using accelerometers to develop time- energy budgets of ... · in the pursuit of finding an...
TRANSCRIPT

Submitted 22 February 2018Accepted 22 September 2018Published 26 October 2018
Corresponding authorMonique A. Ladds,[email protected]
Academic editorDonald Kramer
Additional Information andDeclarations can be found onpage 21
DOI 10.7717/peerj.5814
Copyright2018 Ladds et al.
Distributed underCreative Commons CC-BY 4.0
OPEN ACCESS
Using accelerometers to develop time-energy budgets of wild fur seals fromcaptive surrogatesMonique A. Ladds1,2, Marcus Salton2, David P. Hocking3, Rebecca R. McIntosh2,4,Adam P. Thompson5, David J. Slip2,6 and Robert G. Harcourt2
1 School of Mathematics and Statistics, Victoria University of Wellington, Wellington, New Zealand2Marine Predator Research Group, Macquarie University, Sydney, New South Wales, Australia3 School of Biological Sciences, Monash University, Melbourne, Victoria, Australia4Research Department, Phillip Island Nature Parks, Phillip Island, Victoria, Australia5TAL Life Limited, Melbourne, Victoria, Australia6Taronga Conservation Society Australia, Sydney, New South Wales, Australia
ABSTRACTBackground. Accurate time-energy budgets summarise an animal’s energy expenditurein a given environment, and are potentially a sensitive indicator of how an animalresponds to changing resources. Deriving accurate time-energy budgets requires anestimate of time spent in different activities and of the energetic cost of that activity.Bio-loggers (e.g., accelerometers) may provide a solution for monitoring animals suchas fur seals that make long-duration foraging trips. Using low resolution to recordbehaviour may aid in the transmission of data, negating the need to recover the device.Methods. This study used controlled captive experiments and previous energeticresearch to derive time-energy budgets of juvenile Australian fur seals (Arctocephaluspusillus) equippedwith tri-axial accelerometers. First, captive fur seals and sea lionswereequipped with accelerometers recording at high (20 Hz) and low (1 Hz) resolutions,and their behaviour recorded. Using this data, machine learning models were trainedto recognise four states—foraging, grooming, travelling and resting. Next, the energeticcost of each behaviour, as a function of location (land or water), season and digestivestate (pre- or post-prandial) was estimated. Then, diving and movement data werecollected fromninewild juvenile fur seals wearing accelerometers recording at high- andlow- resolutions. Models developed from captive seals were applied to accelerometrydata from wild juvenile Australian fur seals and, finally, their time-energy budgets werereconstructed.Results. Behaviour classification models built with low resolution (1 Hz) data correctlyclassified captive seal behaviours with very high accuracy (up to 90%) and recordedwithout interruption. Therefore, time-energy budgets of wild fur seals were constructedwith these data. The reconstructed time-energy budgets revealed that juvenile furseals expended the same amount of energy as adults of similar species. No significantdifferences in daily energy expenditure (DEE) were found across sex or season (winteror summer), but fur seals restedmore when their energy expenditure was expected to behigher. Juvenile fur seals used behavioural compensatory techniques to conserve energyduring activities that were expected to have high energetic outputs (such as diving).Discussion. As low resolution accelerometry (1 Hz) was able to classify behaviour withvery high accuracy, future studies may be able to transmit more data at a lower rate,
How to cite this article Ladds et al. (2018), Using accelerometers to develop time-energy budgets of wild fur seals from captive surro-gates. PeerJ 6:e5814; DOI 10.7717/peerj.5814

reducing the need for tag recovery. Reconstructed time-energy budgets demonstratedthat juvenile fur seals appear to expend the same amount of energy as their adultcounterparts. Through pairing estimates of energy expenditure with behaviour thisstudy demonstrates the potential to understand how fur seals expend energy, and whereand how behavioural compensations are made to retain constant energy expenditureover a short (dive) and long (season) period.
Subjects Animal Behavior, Ecology, Marine Biology, Data Mining and Machine LearningKeywords Accelerometer, Otariid, Activity budget, Time-energy budget, Fitness, Daily energyexpenditure (DEE), Machine learning
INTRODUCTIONAn animal’s fitness can be assessed by its ability to survive and reproduce in a givenenvironment (Orr, 2009). Time-energy budgets are a useful measure of one aspect ofanimal fitness, as they describe the energy spent and energy gained over a specific periodin an animal’s life (Boyd, 2002). Animals gain energy by eating and metabolising food, andexpend energy largely through basal metabolic rate (BMR), digestion, thermoregulationand activity, with excess energy available for growth and reproduction (Costa & Williams,1999). Time-energy budgets that quantify both the time animals spend engaged in differentactivities and the energetic costs associated with those activities can be used to determinewhether animals are in positive energy balance (Travis, 1982).
Air-breathing marine mammals, such as fur seals, that forage on aquatic prey havechallenging constraints when acquiring energy. They dive repeatedly, may travel longdistances to foraging sites (an energetically intensive strategy), and must return to thesurface to breathe, only diving for as long as their oxygen stores allow (Gerlinsky, Trites &Rosen, 2014). As relatively small marinemammals, fur seal thermoregulatory costs at sea arehigh compared to terrestrial counterparts, because water conducts heat 25 times faster thanair (Hind & Gurney, 1997) and the heat increment of feeding (HIF) also consumes energy(Rosen & Trites, 1997). However, thermoregulation and HIF are negligible in comparisonto resting metabolic rate and activity that contribute to the largest variation in energyexpenditure (Dalton, Rosen & Trites, 2015). How fur seals acquire and allocate energy tokey processes may be understood through constructing time-energy budgets developedby calculating daily energy expenditure (DEE) and resolved by recording the duration ofvarious activities and multiplying these by their associated energetic cost (Goldstein, 1988).
Calculating the costs associated with different activities from wild fur seals is difficultand often expensive, but estimates of the energetic costs associated with different activitieshave been made from laboratory experiments using captive surrogates and respirometry(Ladds, Slip & Harcourt, 2016). While respirometry measures metabolic rate (and thusenergy expenditure) accurately, its field applications are limited (Halsey, 2011). If a proxyof the metabolic costs incurred by different activities can be developed using animal-bornesensors that identify these activities, such as accelerometers, thenwe can potentiallymeasure
Ladds et al. (2018), PeerJ, DOI 10.7717/peerj.5814 2/28

activity-specific fieldmetabolic rates as well (Cooke et al., 2014). But as the energetic outputswill vary for animal size, age and the time of year, this technologymust be validated (Nathanet al., 2012).
Accelerometers have been used to define the behavioural state of a range of animals,validated through captive experiments (Diosdado et al., 2015; Wang et al., 2015). They canmeasure specific events, such as prey-capture (Volpov et al., 2015), identify a range ofbehaviours (Whitney et al., 2010) and define movement patterns (Shepard et al., 2008b).Dynamic body acceleration (DBA) or stroke rate, measured from accelerometers waspromoted as a way to directly estimate energy expenditure in wild fur seals (Jeanniard-duDot et al., 2016). However, this approach has recently been shown to be flawed, as theapparent relationship between DBA and energy expenditure is in fact time correlated withtime, as both the independent variable (energy) and dependent variable (DBA or strokes)are both summed, thus introducing time into both sides of the equation (Halsey, 2017;Ladds et al., 2017a). Thus, a new way of estimating energy expenditure is needed.
Accelerometers can record at high resolution (multiple samples per second), to givea detailed picture of behaviour, but processing this amount of data post-collection istime-consuming and the amount of data collected may limit opportunities for uploadingdata remotely (Nathan et al., 2012). In addition, battery and memory limitations mean thatif animals are at sea for long periods the period that can be sampled at a high resolutionmaybe relatively short compared to the total trip due to logger memory constraints (Halseyet al., 2009). Limiting the amount of accelerometry data that needs to be collected allowsfor smaller devices to be deployed, or for additional data from other sensors (such astemperature or orientation) to be collected. Fur seals make long-duration foraging tripsover multiple days or weeks, and so analysing such trips maybe made simpler with lowresolution (<10 Hz) recording.
In the pursuit of finding an appropriate and valid methodology of measuring wild furseal energy expenditure and behaviour, the authors have conducted studies to investigate:the metabolic rate of fur seals during activity (Ladds, Slip & Harcourt, 2016); metabolicrates over seasons, sizes, sexes and species (Ladds, Slip & Harcourt, 2017); and how toclassify behaviours from accelerometry (Ladds et al., 2017b; Ladds et al., 2016). What ismissing now is a model connecting behaviour to its energetic cost and the application ofthe model to a wild population. To address this gap, we focus on the Australian fur seal(Arctocephalus pusillus). Australian fur seals are endemic to Australia, occupying muchof the South-Eastern coast (Kirkwood & Goldsworthy, 2013). While much is known aboutadult females (Arnould & Hindell, 2001;Knox et al., 2014), few, if any, studies have focussedon juveniles.
This paper takes a five-step approach to achieving our goal. (1) Conduct behaviouralexperiments with captive seals and train machine learning models to automaticallyrecognise four important behaviours (grooming, resting, travelling and foraging) withhigh (20 Hz) and low (1 Hz) resolution accelerometry. (2) Estimate the energetic cost ofeach behaviour based on previous research. (3) Collect accelerometer data from a sampleof wild fur seals at high and low resolutions. (4) Apply the captive behaviour machinelearning model to determine how much time is spent in each behaviour. (5) Apply the
Ladds et al. (2018), PeerJ, DOI 10.7717/peerj.5814 3/28

energetic cost of the behaviour in two locations (land and water) as a function of time andseason to build an overall estimate of energy expenditure.
MATERIALS AND METHODSBehaviour validation experiments with captive fur seals and sea lionsTo validate the use of accelerometers for classifying behaviours of wild fur seals we usedcaptive surrogates at three Australian marine facilities; Dolphin Marine Magic CoffsHarbour, Underwater World Sunshine Coast, and Taronga Zoo Sydney, from August toNovember 2014 and in August 2015. We used two adult Australian fur seals (Arctocephaluspusillus doriferus; onemale, one female), three New Zealand fur seals (Arctocephalus forsteri;two male adults, one male juvenile), one subantarctic fur seal (Arctocephalus tropicalis;juvenile male), and six Australian sea lions (Neophoca cinerea; two adult males, three adultfemales, one juvenile female). Fur seals had accelerometers attached with tape to the fur,while sea lions wore a custom fitted harness with the accelerometer sewn into a pocket (fordetails of the animals used see Ladds et al., 2017b, Table 1). We pooled data from all fourspecies for training machine learning models because fur seals and sea lions (otariids) areconservative in morphology and including species and/or attachment method as a factoronly improves the accuracy of such models by ∼5% (Ladds et al., 2017b). This study wasconducted under permits from Macquarie University ethics committee (ARA-2012_064)and Taronga ethics committee (4c/10/13).
Tri-axial accelerometers (CEFAS Technology Ltd, Lowestoft, UK) were set to record−8 g to+8 g at 1Hz and 25Hz simultaneously, with a wet/dry sensor active, and behaviourstypical of wild fur seals were video-recorded during training sessions. We observed twotypes of sessions; feeding and behaviour. The feeding sessions aimed to provide seals withlarge food items that required some form of processing prior to eating. Behaviour sessionsalso incorporated some feeding events with small fish that did not require processing. Fishwere thrown in the pool so that seals had to ‘‘capture’’ them mid-water as they sank. Thesetwo behaviours constituted foraging. During each behaviour session seals were instructedto perform a series of natural behaviours from their known behavioural repertoire, suchas porpoising, swimming and grooming. While seals could not reach depths they wouldachieve in the wild, their pools provided adequate space to perform behaviours typical ofwild fur seals. Captive fur seals had access to both land and water during trials, similar to awild fur seal near their haul-out. In addition, seals were trained to swim consistently belowthe water for several minutes to replicate a deep dive for another project. The experimentalset-up and training allowed us to record behaviours that lasted from less than a second(grabbing fish from the water column) to several minutes (swimming or resting).
Behaviours were manually matched to the accelerometry by two investigators. Wherebehaviours recorded by the investigators did not match, they reviewed the video suchthat both reached agreement. Twenty-six behaviours were grouped into four behaviouralcategories—foraging, travelling, grooming and resting, in three locations—land, watersurface and underwater (for details of the behaviours and their groups see Ladds et al., 2016,Table 2). Foraging behaviours consisted of searching for prey and prey handling limited to
Ladds et al. (2018), PeerJ, DOI 10.7717/peerj.5814 4/28

dead fish. Grooming was any behaviour used in body maintenance or thermoregulation.To thermoregulate at sea, fur seals float with either their hind flippers (jughandling) ortheir fore flippers (sailing) in the air. Grooming involves the use of flippers to scratch orrub the body, including the face to clean whiskers. Resting was any period of stillness, whiletravelling was any period involving movement that was not foraging or grooming (Laddset al., 2017b).
Estimate the energetic cost of each behaviourResting energy expenditureEnergy consumption when resting in water is related to water temperature forpostabsorptive (not digesting) female and subadult Australian and New Zealand fur seals(Ladds, Slip & Harcourt, 2017). However, postprandial (digesting) resting metabolic rate(RMR) for pups of northern fur seal (Callorhinus ursinus) (Liwanag, 2010) and juvenileSouth American fur seals (Arctocephalus australis) (Dassis et al., 2014) is 1.6 times thepostabsorptive rate and stays at this level for about 3.5 h. For simplicity, we assumed thatfur seals were postabsorptive while on land, and postprandial in the water.Resting in water:
sSMR Rwater(l O2 kg−1
)= 1.6(0.00195+0.00029
(water temp.
)(duration)). (1)
Because no measure of RMR on land for juvenile Australian fur seals was availablewe used the mass specific standard metabolic rate (sSMR) of a subadult New Zealandfur seal in water (Ladds, Slip & Harcourt, 2017). As northern fur seal pups and southernsea lion subadult males both had ∼30% lower RMR on land than in water (Dassis etal., 2012; Donohue et al., 2000), this assumption was applied to our RMR estimation onland. In addition, to account for a seasonal effect on sSMR in New Zealand fur seals(Ladds, Slip & Harcourt, 2017), we calculated a summer and a winter energy consumption(Eqs. (2.1)–(2.2)).Winter RMR on land:
sSMR Rwinter,land(l O2 kg−1
)= (0.007×0.7)(duration). (2.1)
Summer RMR on land:
sSMR Rsummer,land(l O2 kg−1
)= (0.009×0.7)(duration). (2.2)
Active energy expenditure from foraging and travellingWe combined foraging and travelling as, despite having many studies of the energetic costof diving in seals e.g., (Rosen et al., 2016; Williams et al., 2004), there is yet to be a studyevaluating the cost of travelling at the surface. The time an animal spent active (foragingand travelling) was multiplied by the average energy expenditure estimated in Ladds, Slip& Harcourt (2016). In their study seals swam below the surface stroking constantly, thusthe energetic cost of activity was estimated (as opposed to foraging or travelling per se)(Ladds, Slip & Harcourt, 2016; Rosen et al., 2016; Williams et al., 2004).
There have been no estimates of the cost of travelling on land for any pinniped, thoughexperimentally the cost of movement on land is probably much greater than in water.
Ladds et al. (2018), PeerJ, DOI 10.7717/peerj.5814 5/28

In semi-aquatic water rats (Hydromys chrysogaster) the metabolic cost of running wasaround 13–40% more than swimming when moving at equal speeds, and for platypus(Ornithorhynchus anatinus), the cost of walking was 2.1 times the cost of swimming (Fish etal., 2001). As terrestrial locomotion in otariids is more similar to platypus than water rat, weassumed that the cost of movement on land is twice that in water. As activity compensatesfor some of the additional costs of cold water (Liwanag et al., 2009) we assumed that theenergy expenditure for winter and summer was the same (Eq. (3.1)).Energy expended from activity (foraging and travelling):
Awater,winter/summer(l O2 kg−1
)= 0.0303(duration) (3.1)
Aland,winter/summer(l O2 kg−1
)= 2(0.0303(duration)). (3.2)
Grooming energy expenditureThe energy expended from grooming was estimated to be between 1.5 and 2 times thepostprandial RMR and between 0.9 and 1.2 times postabsorptive RMR in northern fur sealpups depending on activity level (Liwanag, 2010). Considering our model generally onlylabelled active grooming, we assumed that grooming had an energetic cost twice that ofin-water RMR (Eqs. (4.1)–(4.2)).Energy expended from grooming in winter in water:
Gwinter,water(l O2 kg−1
)= (0.007×2)(duration). (4.1)
Energy expended from grooming in summer in water:
Gsummer,water(l O2 kg−1
)= (0.009×2)(duration). (4.2)
For grooming on land fur seals were assumed to be postabsorptive so they were assumedto have the same energetic output as resting or slightly higher.
Wild fur seal data collectionWe tracked juvenile Australian fur seals from two colonies, Seal Rocks (Phillip Island,Victoria Australia, 38◦ 52′S–145◦11′E, n= 6) during austral winter of 2013 and Lady JuliaPercy (Victoria, Australia, 38◦52′S–142◦00′E, n= 8) during austral summer of 2014. Thesesites are the largest breeding colonies for Australian fur seals, with each site containingapproximately 25% of the total population of the species (Kirkwood et al., 2010). InAustralian fur seals, suckling ceases after 1 year, puberty occurs in females at approximately3 years old and in males at 4–5 years old (Arnould & Warneke, 2002). We used animalsbetween one and three years of age that were independently foraging (i.e., juveniles) forthis study.
We identified juveniles by their mature pelage (i.e., lacking the lanugo of pre-moultpups) and size (<1.5 m and 40 kg) and captured individuals using a modified hoop-netand isofluorane gas sedation (Gales & Mattlin, 1998), then measured standard length(straight-line), girth and mass. Numbered tags were applied to the trailing edge of both
Ladds et al. (2018), PeerJ, DOI 10.7717/peerj.5814 6/28

Figure 1 Juvenile Australian fur seal with three devices attached.Devices are CEFAS accelerometer,time depth recorder (TDR) and VHF. Source: DP Hocking.
Full-size DOI: 10.7717/peerj.5814/fig-1
fore-flippers (Super Tags R©, Dalton I.D. Systems Ltd, Henley-on-Thames, UK) to aid withidentification and recapture. One of two types of location device (Kiwisat100, Sirtrack Ltd,New Zealand orMk10;Wildlife Computers), a VHF transmitter (Sirtrack Ltd, 6 cm× 3 cm× 2 cm), and a tri-axial accelerometer G6A+ (CEFAS technology Ltd, Lowestoft, UK) wereglued directly to the fur on the dorsal midline of each fur seal (Fig. 1) using quick-settingepoxy (Araldite 2017; Aeropia Ltd, Crawley, UK or Araldite 268; Huntsman AdvancedMaterials, Victoria, Australia). A time-depth recorder (TDR) was also attached, eitheras part of the Mk10 device or a separate device (Mk9, Wildlife Computer; Fig. 1). Thetotal instrument package mass (179 g–239 g) equated to <1% of the seal’s body mass andattached to maintain the lowest profile possible to minimise a drag effect. We observedanimals until they had fully recovered from anaesthesia and released them at the siteof capture. A minimum of 15 days lapsed before recapture (via hoop net and manualrestraint), and devices were retrieved by cutting the hair beneath the glued instrument.
For the duration of the deployment, defined as from attachment until removal of adevice, TDRs recorded depth (m) every second, and any drift in the depth sensors or errorspikes were corrected prior to analyses using Zero-Offset Correction (Wildlife Computers,Redmond, WA, USA). Tri-axial accelerometers recorded acceleration on the X , Y , andZ axes at 1 sample per second (1 Hz) and temperature at 0.5 Hz. Accelerometers alsorecorded at a high resolution (20 Hz) when diving (depth > 1.5 m). This would sometimes
Ladds et al. (2018), PeerJ, DOI 10.7717/peerj.5814 7/28

continue after a diving event, giving high resolution data both at the surface and duringdiving.
To give an indication of time duration at sea, data from the TDRs were summarisedinto trips and dives. Trips started when a seal entered the water and ended when the sealhauled out, and excluded periods in water with minimal diving or dives <10 m (e.g., whenseals rest at the water surface adjacent to colonies). Dives were defined as periods spentunderwater below a minimum depth of 5 m to account for wave action at the surface.Fur seal physical parameters, trip duration, number of trips, average dive duration, meanmaximum depth and maximum depth were derived from these parameters (Table S1).
Predicting behaviours of wild fur seals from accelerometersAs the high resolution data were only recorded for wild seals while at sea, the high resolutioncaptive data were subsampled to include only those behaviours that occurred in the water.Low resolution (1 Hz) data were recorded continuously for both the wild and captive seals.The wet/dry sensor of the accelerometers from the wild fur seals (hereafter wild data) wasused to indicate when individuals were in water or on land to improve the predictabilityof the models. We tested the accuracy of both high and low resolution accelerometry toclassify behaviours.
To determine the behavioural state of surrogates using accelerometers, gradient boostingmodels (GBM) were trained in R using the package ‘xgboost’ (Chen, He & Benesty, 2016).GBM models are an extension of a random forest, whereby they build a classification treeon a subset of the data, then use a subsequent tree to learn from the errors of the previoustrees. Trees are built successively until a stopping criteria is met, and the trees built areaveraged together to provide an estimate of classification (Friedman, 2002). Captive datawere pooled and split into one of three epochs (the number of samples on which summarydata are calculated) for training the GBM. For high resolution (20 Hz) data epochs of 13, 25and 75 samples were tested, which correspond to 0.65, 1.25 and 3.75 s of data, respectively.For low resolution (1 Hz) data epochs of 7.0, 15.0 and 21.0 samples were tested, whichcorresponded to 7.0, 15.0 and 21.0 s of data respectively. Training and testing longer epochswas not possible because there were too few events lasted for longer than a few seconds,meaning there were not enough examples to train a model. Down-sampling (randomlyselecting behaviours from a pool until a specified number is met) was used to ensure thatthe behaviour categories had an even number of samples (Ladds et al., 2017b).
We coded 52 summary statistics and added five covariates describing some characteristicof the individual or the event to the second stage of model testing. These were includedas they have previously been demonstrated to make a small improvement on predictionperformance of the models (Ladds et al., 2017b). The covariates included were deviceattachment method (harness or tape), age, mass, sex and species of the individual. Weincluded where the behaviour occurred (surface, underwater or land) in all models.Location was determined first by the wet/dry switch which indicated whether a seal was inthe water or on land, then once a seal was more than 1 m under the surface (as determinedby the depth device) they were classified as underwater. Summary statistics calculatedincluded: mean, median, standard deviation, skewness, kurtosis, minimum, maximum,
Ladds et al. (2018), PeerJ, DOI 10.7717/peerj.5814 8/28

absolute value, inverse covariance, autocorrelation trend (the coefficient derived from alinear regression) for each of the three axes. We also calculated q as the square-root of thesum-of-squares of the three axis (Nathan et al., 2012), and included pair-wise correlationsof the three axes (x–y , y–z , x–z) (Ravi et al., 2005). The inclination as azimuth werecalculated as per Nathan et al. (2012). We calculated three measures of dynamic bodyacceleration (DBA) by first using a running mean of each axis over 3 s to create a valuefor static acceleration. We then subtracted the static acceleration at each point from theraw acceleration value to create a value for partial dynamic body acceleration (PDBA).The values of PDBA on each axis were used to calculate overall dynamic body acceleration(ODBA) (Shepard et al., 2008a;Wilson et al., 2006) and vectorial dynamic body acceleration(VeDBA) (Qasem et al., 2012). The integral of the start and end point of ODBA and VeDBAfor each epoch ODBA and VeDBAwas calculated using the package ‘‘MESS’’ in R (Ekstrom,2014, R Core Development Team, 2015).
GBM models were run with the full suite of summary statistics derived from captivedata and run over a grid of parameters (for details see Table 2 and additional file 2 in Laddset al., 2017b). The combination of parameters that resulted in the highest accuracies waschosen for implementation on the high and low resolution wild data. Within each epoch,wild data were categorized using predictions from the GBM model built with captivedata that produced the highest cross-validation accuracy and kappa values. Accuracy isa measure of the proportion of true positives identified by the model, while kappa is aperformance measure that accounts for investigators’ observations agreeing or disagreeingby chance. Behaviour events were categorised for the duration of each deployment. Eventswere considered different when either the location or the behaviour category changed foran epoch, and the change occurred for longer than 15 s. A sensitivity analysis was conductedon the probability of each event being assigned to a behaviour group. For wild data, eachevent was assigned a probability of it being each behaviour category and then classified asthe behaviour that had the highest probability. To evaluate how well our models classifiedbehaviours, behaviours that were selected with less than 80% chance of occurring wereexamined, and the behaviour with the next highest probability was extracted. This allowedus to see when the model may have ‘confused’ two categories.
Apply the model to create time-energy budgetsTo build time-energy budgets, we estimated DEE (MJ) which was assumed to be a functionof the energy expenditure (EE) of a given behaviour event, its duration, the season itoccurred in and where it occurred (land or water) summed over 24 h periods (Table 1,Eq (5)). An example of how this is calculated over a single dive is given in Fig. 2. Detailsof the calculations and assumptions made for the energetic models are in Table 1. Theoverall energetics model is defined by the sum of all of the behaviour events (e = e ...E)that occur in a 24 h period (from midnight to midnight) for A (activity), G (grooming)and R (resting) as a function of season s ( s= winter, summer) and location l ( l = land,water):
DEE (l O2)=
E∑e
Rs,l+
E∑e
As,l+
E∑e
Gs,l . (5)
Ladds et al. (2018), PeerJ, DOI 10.7717/peerj.5814 9/28

Table 1 Energy budget calculations and references for each behavioural and digestive state, accounting for location (land or water—where wa-ter includes surface and underwater) and season (winter or summer). All measures converted to l O2 kg−1 from original measure. Temperature in◦C, duration in minutes, NZM3 is the reference to the seal used.
Energyexpenditure
Digestivestate
Location Australseason
Energy expenditureequation (l O2 kg−1)
Reference
Resting Postprandial Water Temp.related
S Rwater= 1.6(0.002+0.0003×water temp.)(duration)
Ladds, Slip & Harcourt, (2017, Fig 5D),Liwanag, (2010), Dassis et al., (2014)
Resting Postabsorptive Land Winter Rland,winter= 0.0049(duration) Ladds, Slip & Harcourt (2017, Table 2 NFM3),Donohue et al. (2000), Dassis et al. (2014)
Resting Postabsorptive Land Summer Rland,summer= 0.0063(duration) Ladds, Slip & Harcourt (2017, Table 2 NFM3),Liwanag (2010), Dassis et al. (2014)
Foraging/travelling
N/A Water N/A Awater= 0.0303(duration) Ladds, Slip & Harcourt (2016, Table 1 NFM1)
Foraging/travelling
N/A Land N/A Aland= 0.0606(duration) Ladds, Slip & Harcourt (2016, Table 1 NFM1),Fish et al., 2001
Grooming Postprandial Water Winter Gmwater,winter= 0.014(duration) Ladds, Slip & Harcourt (2017, Table 2 NFM3),Liwanag (2010)
Grooming Postprandial Water Summer Gwater,summer= 0.018(duration) Ladds, Slip & Harcourt (2017, Table 2 NFM3),Liwanag (2010)
Grooming Postabsorptive Land Winter Gland,winter= 0.007(duration) Ladds, Slip & Harcourt (2017, Table 2 NFM3),Donohue et al. (2000), Dassis et al. (2014)
Grooming Postabsorptive Land Summer Gland,summer= 0.009(duration) Ladds, Slip & Harcourt (2017b, Table 2 NFM3),Liwanag (2010), Dassis et al. (2014)
See Table 1 for definitions and details of each behaviour state.For reporting and comparison with other energetics papers, the total oxygen used
was converted into MJ. First, the total energy expended was converted to kilocaloriesusing a factor of 5 kcal per l O2, then converted to kilojoules using a conversion factor of4.186 J cal−1 (Williams et al., 2007).
Statistical analysisAs it was not feasible to validate the captive model after applying it to the wild data,we conducted a sensitivity analysis on the probability of each event being assigned toa behaviour group. To do so, we adjusted the proportion of time wild fur seals spentin different behaviours (increasing some while decreasing others, such that the totalproportion of time spent in the three behaviours always summed to 1) and investigatedhow it affected the overall DEE. We calculated 1,000 simulated proportions based on theactual range of time spent in each behavioural category, where each simulated proportionrepresented a day. We applied the energetics model to the simulated proportions andgrouped the activities according to three behaviour categories: active (travelling andforaging) grooming and resting; then by two location categories: water and land. Wethen plotted the total DEE for the day against the simulated proportions for each ofthe five categories. As fur seals were of different sexes and were tagged in differentseasons we tested for differences in DEE between sexes and seasons using post-hocgeneral linear hypothesis and a multiple comparison test via the Tukey method within
Ladds et al. (2018), PeerJ, DOI 10.7717/peerj.5814 10/28

Figure 2 An example of howDEE is calculated for a single dive of a wild male juvenile Australian furseal from Seal Rocks (winter), Victoria, Australia. Panels show location (underwater or surface), be-haviour state (travelling, resting, grooming, foraging) and depth.
Full-size DOI: 10.7717/peerj.5814/fig-2
the function glht from the package ‘‘multcomp’’ (Hothorn et al., 2013). Individual furseal identification was included in models as a random factor and significance was setat p< 0.05. All analyses were completed in R (Version 3.1.3; R Core Development Team,2015) and values reported as mean± SEM. The datasets generated and analysed during thecurrent study are available in the ‘‘Time-energy_budgets_from_accelerometers’’ repository:https://github.com/MoniqueLadds/Time-energy_budgets_from_accelerometers.git.
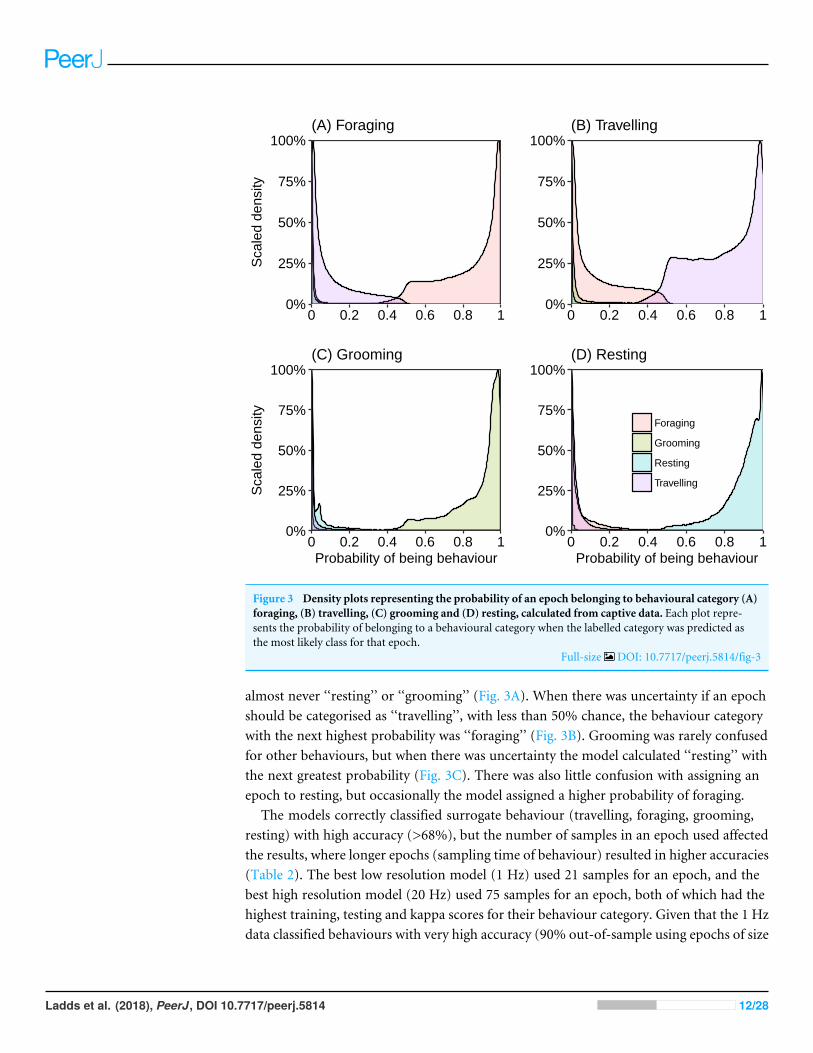
RESULTSBehaviour validation experiments with captive fur seals and sea lionsMost epochs (99%) were assigned to a behaviour category with over 80% probability(Fig. 3). We investigated those behaviours that were assigned with a less than 80% (∼1%of total epochs) probability to understandwhere themodelmay have ‘confused’ behaviours.When the model was uncertain that an epoch was in the behaviour category ‘‘foraging’’(less than chance), it generally predicted the epoch should be assigned as ‘‘travelling’’ and
Ladds et al. (2018), PeerJ, DOI 10.7717/peerj.5814 11/28
0%
25%
50%
75%
100%
0 0.2 0.4 0.6 0.8 1
Sca
led
dens
ity
(A) Foraging
0%
25%
50%
75%
100%
0 0.2 0.4 0.6 0.8 1
(B) Travelling
0%
25%
50%
75%
100%
0 0.2 0.4 0.6 0.8 1Probability of being behaviour
Sca
led
dens
ity
(C) Grooming
0%
25%
50%
75%
100%
0 0.2 0.4 0.6 0.8 1Probability of being behaviour
Foraging
Grooming
Resting
Travelling
(D) Resting
Figure 3 Density plots representing the probability of an epoch belonging to behavioural category (A)foraging, (B) travelling, (C) grooming and (D) resting, calculated from captive data. Each plot repre-sents the probability of belonging to a behavioural category when the labelled category was predicted asthe most likely class for that epoch.
Full-size DOI: 10.7717/peerj.5814/fig-3
almost never ‘‘resting’’ or ‘‘grooming’’ (Fig. 3A). When there was uncertainty if an epochshould be categorised as ‘‘travelling’’, with less than 50% chance, the behaviour categorywith the next highest probability was ‘‘foraging’’ (Fig. 3B). Grooming was rarely confusedfor other behaviours, but when there was uncertainty the model calculated ‘‘resting’’ withthe next greatest probability (Fig. 3C). There was also little confusion with assigning anepoch to resting, but occasionally the model assigned a higher probability of foraging.
The models correctly classified surrogate behaviour (travelling, foraging, grooming,resting) with high accuracy (>68%), but the number of samples in an epoch used affectedthe results, where longer epochs (sampling time of behaviour) resulted in higher accuracies(Table 2). The best low resolution model (1 Hz) used 21 samples for an epoch, and thebest high resolution model (20 Hz) used 75 samples for an epoch, both of which had thehighest training, testing and kappa scores for their behaviour category. Given that the 1 Hzdata classified behaviours with very high accuracy (90% out-of-sample using epochs of size
Ladds et al. (2018), PeerJ, DOI 10.7717/peerj.5814 12/28

Table 2 Cross-validation (training) and out-of-sample (testing) accuracy for gradient boosting models(GBM) trained across a range of epochs using two datasets for all behaviours (ALL) and for behaviourin water (Water).
Behaviour Hz Epochs Cross-validationaccuracy
Out-of-sampleaccuracy
Kappa
ALL 1 7 78.3% 72.1% 71.1%ALL 1 15 79.7% 86.8% 73.6%ALL 1 21 80.8% 89.5% 73.6%Water 20 13 63.2% 67.6% 68.6%Water 20 25 72.4% 69.1% 63.2%Water 20 75 82.7% 75.6% 76.9%
21, Table 2) and recorded for the duration of deployments on wild fur seals (20 Hz dataonly recorded while fur seals were diving and for a short time after), only the 1 Hz data forthe activity budgets were analysed.
Wild fur seal data collectionThree fur seals from Seal Rocks and six fur seals from Lady Julia Percy were successfullyrecaptured (recapture rates of 50% and 67% respectively) and accelerometer data obtained.Fur seals made between two and 45 trips with durations of between 30 min and nine days.Diving parameters (Table S1) were very similar between individuals from both sites. Furseals in winter (from Seal Rocks) made fewer and longer foraging trips than fur seals insummer (from Lady Julia Percy). All other diving parameters were very similar betweenwinter and summer fur seals (Table S1). Similarly, there were few differences in divingparameters for male and female juvenile fur seals.
Predicting behaviours of wild fur seals from accelerometersFigure 4 is an example of the output produced by the activity model for a wild fur seal,showing the end of a foraging bout, travelling back to land and then a short period of restingon land (hauled out). This figure demonstrates the strengths and weaknesses of the GBMbuilt from surrogates. The model was very good at predicting when the wild individual wasresting, as there was very little movement in the accelerometer. But this feature resultedin the dive ascent also being classified as resting as the seal rose slowly through the watercolumn with limited body movement (Fig. 4B). Grooming was also classified accurately; itpredominantly occurred immediately prior to or following a dive, or during the first houror so after hauling out. Foraging and travelling were frequently misclassified by the model(Fig. 3); most commonly, the descent of a dive was classified as foraging when it most likelyshould have been travelling, and foraging appeared periodically during long trips returningto the haul out site.
Apply the model to create time-energy budgetsOverall, the time that fur seals spent in the three different locations was between 31–63%on land, between 3–25% underwater and between 28–47% at the surface of the water.The pressure sensor on the accelerometers on two of the wild fur seals (LJP_A10283and LJP_A10284) failed for a portion of the deployment, which resulted in a significant
Ladds et al. (2018), PeerJ, DOI 10.7717/peerj.5814 13/28

0.00.51.01.52.0
VeD
BA
✁ 2✁ 1
012
Raw
ac
cele
ratio
nland
surface
underwater
Foraging
Grooming
Resting
Travelling
✁ 80✁ 60✁ 40✁ 20
0
09:00 12:00 15:00
Dep
th
0.00.51.01.52.0
VeD
BA
✁ 2✁ 1
012
Raw
acce
lera
tion
surface
underwater
Foraging
Grooming
Resting
Travelling
✁ 60
✁ 40
✁ 20
0
09:00 09:05 09:10 09:15
Dep
th
A)
B)
Figure 4 An example foraging bout, transition and haul-out of a female juvenile Australian fur sealfrom Lady Julia Percy, Victoria, Australia. (A, B) show VeDBA, raw acceleration of the x , y and z axis, lo-cation (underwater, surface or land), behaviour state (travelling, resting, grooming, foraging) and depth(time is in AEST). (A) Shows the end of a foraging bout, transiting back to land and then a short periodof the haul out. The red box highlights the area of the dive that is displayed in (B). (B) shows three divesfrom the foraging bout.
Full-size DOI: 10.7717/peerj.5814/fig-4
underestimation of the time spent underwater. Each fur seal spent approximately half oftheir deployment resting (range 32–55%), predominantly on land (Fig. 5) and another22% (range 17–33%) was used for grooming. Approximately 20% (range 13–25%) of furseals’ time was foraging and approximately 12% travelling (range 8–22%).
There were no significant differences in the DEE for females (18.22 ± 5.91 MJ d−1)and males (18.86 ± 6.01 MJ d−1; post-hoc comparisons: Z =−0.35, p= 0.72) or forwinter deployments (20.77 ± 7.00 MJ d−1) and summer (17.55 ± 5.30 MJ d−1; post-hoccomparisons: Z = 1.10, p= 0.27), which also represented site and year. Therefore, it
Ladds et al. (2018), PeerJ, DOI 10.7717/peerj.5814 14/28

Figure 5 Activity (A) and energy (B) budgets for nine wild juvenile Australian fur seals—six deployedin summer and three deployed in winter. (A) Bars represent % of time spent in each type of activity overthe duration of the deployment for the number of days presented in the top right-hand corner of plots.Colours represent the location of the behaviour. (B) Boxplots represent the minimum, 25% (Q1), median,75% (Q3) and the upper limit (Q3+ 1.5× the interquartile range (Q3 –Q1)) of DEE (MJ d−1) with out-liers of the upper limit represented by points.
Full-size DOI: 10.7717/peerj.5814/fig-5
Ladds et al. (2018), PeerJ, DOI 10.7717/peerj.5814 15/28

Table 3 Daily energy expenditure (DEEMJ d-1) for different behaviours on land, at the surface andunderwater for nine juvenile Australian fur seals.
Behaviour Average DEE(MJ d−1)
SD DEE Max DEE % total DEE %ActivityBudget
LandResting 2.62 1.37 6.66 14.7% 35%Grooming 1.05 0.86 3.77 5.9% 10%Travellinga 1.22 1.52 7.69 6.9% 4%SurfaceResting 1.29 1.59 12.30 7.3% 9%Grooming 1.59 1.46 7.80 8.9% 12%Foraging 2.53 1.97 7.37 14.2% 8%Travelling 2.46 2.38 12.24 13.8% 8%UnderwaterResting 0.27 0.41 2.15 1.5% 1%Grooming 0.25 0.34 1.62 1.4% 2%Foraging 3.30 3.46 17.41 18.5% 9%Travelling 1.19 1.30 5.86 6.7% 3%TotalResting 4.18 3.37 21.11 21.4% 45%Grooming 2.89 2.65 13.20 14.8% 24%Foraging 5.83 5.43 24.78 29.8% 16%Travelling 6.68 7.91 37.36 34.1% 15%
Notes.aAny foraging that was classified as occurring on land was assumed to be travelling.
was justifiable to pool the samples. The average DEE for wild individuals and locationspooled was 18.73 ± 5.73 MJ d−1 (range: 8.24–32.04 MJ d−1) and mass-specific DEE was0.50 ± 0.14 MJ kg−1 d−1 (range: 0.08–0.81 MJ kg−1 d−1; Table 3). The maximum DEEwas from a wild individual that spent 12 h continuously diving at sea (Fig. S1).
The most energetically expensive behaviour was foraging, making up over a third of theDEE (Table 3). Resting on land made up∼15% of the overall energetic budget though thiswas the largest part of the activity budget (∼45%). Fur seals spent little time resting at sea(∼10%) and this behaviour represented ∼9% of the overall energetic budget. The leastcostly activities were underwater grooming (1.4%) and resting (1.5%) which were likelyto be mistaken behaviour classification. Grooming only made up one seventh of DEE, lessthan resting, and most grooming activity was at the surface (12%). Travelling and foragingmade up two-thirds of the energetic budget, though they only represent roughly a third ofthe activity budget.
The sensitivity analysis revealed that the proportion of time spent in different behaviours(active, grooming or resting) and locations (water or land) altered the expected DEE fora juvenile Australian fur seal. DEE increased with more time spent active where DEEincreased up to 27 MJ d−1 when a seal was active more that 50% of the time (Fig. 6A).DEE decreased to 13 MJ d−1 as seals spent more time resting (Fig. 6C). There was no clear
Ladds et al. (2018), PeerJ, DOI 10.7717/peerj.5814 16/28

Figure 6 Plot of 500 simulated points of total DEE for wild juvenile Australian fur seals against per-centage of time spent: (A) active (travelling and foraging); (B) grooming; (C) resting; (D) in water; (E)on land.
Full-size DOI: 10.7717/peerj.5814/fig-6
relationship between the time spent grooming (Fig. 6B) or time spent on land or in water(Figs. 6D–6E) and DEE.
DISCUSSIONBehaviour segmenting with accelerometers and machine learningSupervised machine learning models trained with accelerometry data from captive animalsreliably and accurately classified all four behaviour categories tested: foraging, grooming,resting and travelling. We expected that higher resolution data would enable the modelsto perform better at distinguishing the different behaviour types (Halsey et al., 2009), butwere unable to compare this directly as we had too few long-duration behaviours recordedin water at high resolutions (>7 s). Despite this limitation, low resolution samplingproduced very high out-of-sample (i.e., test) validation accuracies over a range of epochsizes (72–90%; Table 2). The sample window size (epoch) influenced the result, with longerepochs tending to produce greater accuracies. The overall value of the summary statisticand its variation would be lower for long duration behaviours, i.e., low energy, repetitivebehaviours are easier to distinguish (Diosdado et al., 2015). Shorter epochs are more likely
Ladds et al. (2018), PeerJ, DOI 10.7717/peerj.5814 17/28

to pick up irregular movements of the animal that arise from short duration, high energyactivities (such as burst attacks on prey), that were rarely seen in the captive experiments(Bom et al., 2014). Instead, foraging was defined by handling of dead prey and activelysearching the bottom of the pool for food hidden in the substrate (Ladds et al., 2017b).From this definition, foraging became the most difficult behaviour category for the modelto classify.
The trainedmodel based on captive animals predicted the behaviour of the wild fur seals,with minimal anomalies. Overall, the activity budgets matched expectations of wild furseals (Battaile et al., 2015), where they spent most time resting (∼45%), and the rest of theirtime was split evenly among other activities—grooming (∼22%), foraging (∼20%) andtravelling (∼12%). The model classified some behaviours incorrectly, primarily from twoevents—classifying the descent of the dive as foraging, when it was more likely travelling,and from identifying bouts of foraging during long bouts of surface swimming transitingback to the colony, when the fur seals were more likely grooming or simply changingdirection. Explicitly defining some behaviours from accelerometers for other species hasalso been challenging. For example, using supervised machine learning models the foragingbehaviour of plovers could not be classified (Bom et al., 2014), nor grooming of pumas(Wang et al., 2015). The total time that fur seals spent foraging and travelling is likelyaccurate because foraging and travelling were most often confused, thus combining thebehaviours reduces the overall error, and is considered sufficient to summarise their activitybudget. One major limitation of this study was the use of dead prey to induce foraging, sofuture studies should use live prey to help refine and improve the accuracy of models.
Time-energy budgetsJuvenile fur seals had an average DEE that was 4.2 times the predicted BMR, which wasabout the same as estimated mass-specific energy expenditure measured from adult femaleAntarctic fur seals and northern fur seals (4.7 times BMR; Jeanniard-du Dot et al., 2016) andslightly lower than adult female Californian sea lions (Zalophus californianus californianus)(5.2 times BMR; Ponganis et al., 1997). DEE did not differ for sex or for season (winter vs.summer) allowing us to pool the data. Sample size was too small and without adequatereplication for further division. Even so, sex differences were not expected for juveniles,as any differences in diving abilities (Fowler et al., 2006), physiological parameters (Burns,Clark & Richmond, 2004) or survival (Beauplet et al., 2005) have been attributed to age orsize rather than sex (Weise & Costa, 2007).
GroomingJuvenile fur seals in this study spent approximately 25% of their time at-sea grooming,compared to northern fur seals that spend around ∼30% of their time at sea rolling at thesurface and another 9% in other grooming activities (Battaile et al., 2015). Fur seals groomfor general body maintenance and this can offset some of the costs of thermoregulation(Iwata et al., 2013; Liwanag, 2010). Through rubbing the fur, fur seals encourage smallair-bubbles to be accumulate between their layers of fur, providing further insulation. Thisalso helps maintain positive buoyancy which in turn saves energy while diving (discussed
Ladds et al. (2018), PeerJ, DOI 10.7717/peerj.5814 18/28

below; Fish et al., 2002) and increases metabolic rate in cold water (Liwanag, 2010). Furbecomes compressed while diving, reducing its effectiveness to provide insulation, warmthand buoyancy (Fish et al., 2002), and to counteract this fur seals roll at the surface whilerubbing their body with their fore flippers in order to trap air bubbles into their pelage(Liwanag, 2010). Indeed, our models identified many cases of grooming following a dive(e.g., Fig. 4).
Other thermoregulatory behaviours are sailing and jughandling which allows heat toescape their hairless flippers in warmwater, or to avoid heat loss in cold water (Bartholomew&Wilke, 1956). Due to the sedentary style of this behaviour, the total energetic cost of dailygrooming was not different from resting, despite having up to twice the energy demand(Liwanag, 2010). Fur seals appear to allow for its increased energetic cost by resting moreoften (Table 3). General body maintenance, such as rubbing whiskers, can occur afterconsuming large prey items. Wild polar bears (Ursus maritimus) have been observed toclean regularly while consuming prey where they pause eating at regular intervals to rinseand lick their fore paws and face (Stirling, 1974). Fur seals also spent significant timegrooming on land (∼15% of all land activity) using their flippers and occasionally theirteeth to maintain their fur, further indicating the importance of this behaviour.
RestingJuvenile fur seals spent around half of their time resting, which contributed around ∼14%to their overall energetic budget. Due to the large cost of travelling and foraging, fur sealsmust use long haul-out periods to rest and recuperate. This is particularly true of juvenileswho have an additional cost of growth, and use this time for reintegrating tissue and layingdown fat (Kirsch, Iverson & Bowen, 2000). Juvenile Australian fur seals spent on average72% of their time on land resting, which was∼16% of their overall activity budget. Duringlong periods ashore, fur seals generally remain motionless for energy conservation whilefasting. For example, over the breeding season, adult male northern and subantarctic furseals spent >90% of observed time (during the day only) motionless, either sitting or lying(Stirling, 1971).
The fur seals in this study spent ∼12% of their time at-sea resting, similar to Northernfur seals and Antarctic fur seals (Arctocephalus gazella) (Battaile et al., 2015), with ∼2%of this time underwater. Some phocid seals rest underwater (Mitani et al., 2009), but itis highly unlikely that these seals did so as Australian fur seal dives were generally onlya few minutes, and their trip durations relatively short (Maresh et al., 2015). Instead, thebehaviour classified as resting underwater may be explained by the model classifying theascent part of the dive as resting. Long periods of gliding on the ascent part of the dive, likelyresults from the fur seals being positively buoyant. During underwater glides, metabolicrate is at or lower than RMR (Fahlman et al., 2008), which conserves their on-board oxygenstores (Ponganis, Meir & Williams, 2011; Williams et al., 2004). Therefore, classifying thispart of the dive as resting, and thus having a lower metabolic rate associated, actuallystrengthens the validity of the models.
Ladds et al. (2018), PeerJ, DOI 10.7717/peerj.5814 19/28

Active behaviours (Foraging and Travelling)Derivation of our energetic budget distinguishes between two sedentary behaviours (restingand grooming) and two active behaviours (foraging and travelling). While there has been aproposition that accelerometers can be used to measure energetics from active behaviours(Jeanniard-du Dot et al., 2016), these relationships are confounded by time (Halsey, 2017).To account for this, we estimated active energy expenditure as a function of time spent activeat sea. This approach assumed that fur seals were postabsorptive at sea and postprandialon land and the cost of foraging and travelling were equivalent. These assumptions aresupported by evidence that seals partially delay digestion while diving (Rosen & Trites,1997). The cost of foraging and travelling in this study could not be separated because themodel sometimes confused the behaviours. Regardless, the two behaviours are inextricablylinked due to the common movement of the behaviours (Ladds et al., 2017b), and theenergetic cost would likely be similar.
Estimating the energetic cost of locomotion on land was difficult because this has notbeen measured for otariids. Movement on land is likely far more costly than in waterbecause seal morphology has adapted them for efficiency in the ocean (Beentjes, 1990),a hypothesis with experimental evidence from the platypus and the water rat (Fish et al.,2001). Therefore, the cost of travelling on land was assumed to be twice as costly for furseals as swimming in water. As a result, the average EE of activity on land was 1.51 MJ d−1,or ∼5% of the overall energetic budget. Given the assumed high cost of travelling on landand that travelling on land represented only ∼4% of the overall activity budget, juvenilefur seals likely minimise the time spent active on land to save energy for foraging.
Juvenile Australian fur seals spent around half of their time in water (36–69%). Duringthe breeding season, adult female Australian fur seals spend around 75% of their timein the water (Arnould & Hindell, 2001), while pups are only in the water for around 29%of their time (Spence-Bailey, Verrier & Arnould, 2007). Of the time juveniles are in thewater, approximately 56% (35–62%) is spent foraging and travelling, which contributesto most (∼75%) of their DEE (Fig. 4, Table 3). The large cost of travelling and foragingis predominantly from the mechanical power of flipper strokes during swimming, ratherthan diving, which can be offset using a range of behavioural compensatory techniquesthat lower metabolic rate (Davis & Williams, 2012).
CONCLUSIONSWe constructed time-energy budgets for wild fur seals across multiple foraging trips usingaccelerometers recording at a low resolution (1 Hz), validating the activity budgets fromexperiments with captive surrogates. Sensitivity analyses revealed that the average DEE fora 50 kg wild juvenile Australian fur seal over multiple foraging trips was between 18 and25 MJ d−1 which equated to 1.9 to 6.4 times Kleiber’s (1975) prediction for the BMR forsimilarly sized terrestrial mammals. This was within than the field metabolic rate (FMR)range of 3.3 to 6.7 times Kleiber reported for adult female otariids in other studies (Costa,Croxall & Duck, 1989; Fowler et al., 2007; Jeanniard-du Dot et al., 2016).
An important finding from this study is that time-energy budgets were able to becreated from low resolution (1 Hz) accelerometry with very high accuracy (90%). Previous
Ladds et al. (2018), PeerJ, DOI 10.7717/peerj.5814 20/28

studies interpreting the foraging behaviour (Battaile et al., 2015) or energy expenditure(Jeanniard-du Dot et al., 2016) of wild fur seals have used high (>20 Hz) resolution data,at a cost of space and battery power from the device. Through validating low resolutionaccelerometry, this study will advance the use of accelerometers in the field as remoteuploads are more feasible with less data, and battery life can be prolonged. Using lowresolution data also significantly decreases the computational time and power requiredfor analysis. Finally, as the drive towards smaller tags continue, using low resolutionsettings supports the use of smaller tags, without restricting the time with which they canbe deployed.
While there is potential to fine-tune the model presented here to estimate a detailedtime-energy budget on a minute or hourly basis, the current methodology provides avalidated and representative estimate of daily time-energy budgets for wild fur seals.Through pairing estimates of energy expenditure with behaviour this study demonstratesthe potential to understand not only how fur seals expend energy, but also where and howbehavioural compensations are made to retain constant energy expenditure over short (adive) and long (season) time period.
ACKNOWLEDGEMENTSWe thank all the marine mammal staff at Dolphin Marine Magic, Sealife Mooloolaba andTaronga for their invaluable assistance with data collection, training the seals and ongoingcommitment to this project. We thank Phillip Island Nature Parks for the provisionof devices and logistical support in the field. We thank Justin Clark for overseeing theanaesthetics. We thank the volunteers who contributed to data collection and analysis.
ADDITIONAL INFORMATION AND DECLARATIONS
FundingThis project was funded by an Australian Research Council Linkage Grant (Grantnumber LP110200603) to Robert Harcourt and David Slip, with support from TarongaConservation Society Australia. Monique Ladds and Marcus Salton were recipients ofMacquarie University Research Excellence Scholarships. Devices and fieldwork costs weresupplemented by a Holsworth Wildlife Research Endowment award to David Hocking.The funders had no role in study design, data collection and analysis, decision to publish,or preparation of the manuscript.
Grant DisclosuresThe following grant information was disclosed by the authors:Australian Research Council Linkage Grant: LP110200603.Macquarie University Research Excellence Scholarships.Holsworth Wildlife Research Endowment.
Competing InterestsThe authors declare there are no competing interests.
Ladds et al. (2018), PeerJ, DOI 10.7717/peerj.5814 21/28

Author Contributions• Monique A. Ladds and Marcus Salton conceived and designed the experiments,performed the experiments, analyzed the data, prepared figures and/or tables, authoredor reviewed drafts of the paper, approved the final draft.• David P. Hocking conceived and designed the experiments, performed the experiments,authored or reviewed drafts of the paper, approved the final draft.• Rebecca R. McIntosh conceived and designed the experiments, contributedreagents/materials/analysis tools, authored or reviewed drafts of the paper, approved thefinal draft.• Adam P. Thompson analyzed the data, authored or reviewed drafts of the paper,approved the final draft, code and version control.• David J. Slip conceived and designed the experiments, performed the experiments,contributed reagents/materials/analysis tools, authored or reviewed drafts of the paper,approved the final draft.• Robert G. Harcourt conceived and designed the experiments, contributedreagents/materials/analysis tools, authored or reviewed drafts of the paper, approved thefinal draft.
Field Study PermissionsThe following information was supplied relating to field study approvals (i.e., approvingbody and any reference numbers):
This study was conducted under permits from Macquarie University ethics committee(ARA-2012_064) and Taronga ethics committee (4c/10/13).
Data AvailabilityThe following information was supplied regarding data availability:
GitHub: https://github.com/MoniqueLadds/Time-energy_budgets_from_accelerometers.git.
Supplemental InformationSupplemental information for this article can be found online at http://dx.doi.org/10.7717/peerj.5814#supplemental-information.
REFERENCESArnould JP, Hindell MA. 2001. Dive behaviour, foraging locations, and maternal-
attendance patterns of Australian fur seals (Arctocephalus pusillus doriferus).Canadian Journal of Zoology 79:35–48 DOI 10.1139/z00-178.
Arnould JP, Warneke RM. 2002. Growth and condition in Australian fur seals(Arctocephalus pusillus doriferus) (Carnivora: Pinnipedia). Australian Journal ofZoology 50:53–66 DOI 10.1071/ZO01077.
Bartholomew GA,Wilke F. 1956. Body temperature in the northern fur seal, Callorhinusursinus. Journal of Mammalogy 37:327–337 DOI 10.2307/1376731.
Ladds et al. (2018), PeerJ, DOI 10.7717/peerj.5814 22/28

Battaile BC, Sakamoto KQ, Nordstrom CA, Rosen DA, Trites AW. 2015. Ac-celerometers identify new behaviors and show little difference in the activitybudgets of lactating northern fur seals (Callorhinus ursinus) between breedingislands and foraging habitats in the Eastern Bering Sea. PLOS ONE 10:e0118761DOI 10.1371/journal.pone.0118761.
Beauplet G, Barbraud C, Chambellant M, Guinet C. 2005. Interannual variation in thepost-weaning and juvenile survival of subantarctic fur seals: influence of pup sex,growth rate and oceanographic conditions. Journal of Animal Ecology 74:1160–1172DOI 10.1111/j.1365-2656.2005.01016.x.
Beentjes MP. 1990. Comparative terrestrial locomotion of the Hooker’s sea lion(Phocarctos hookeri) and the New Zealand fur seal (Arctocephalus forsteri): evolution-ary and ecological implications. Zoological Journal of the Linnean Society 98:307–325DOI 10.1111/j.1096-3642.1990.tb01204.x.
BomRA, BoutenW, Piersma T, Oosterbeek K, Van Gils JA. 2014. Optimizingacceleration-based ethograms: the use of variable-time versus fixed-time segmen-tation.Movement Ecology 2:1–8 DOI 10.1186/2051-3933-2-6.
Boyd IL. 2002. Energetics: consequences for fitness. In: Hoelzel AR, ed.Marine mammalbiology—an evolutionary approach. Oxford: Blackwell Science Ltd, 247–277.
Burns JM, Clark CA, Richmond JP. 2004. The impact of lactation strategy on phys-iological development of juvenile marine mammals: implications for the tran-sition to independent foraging. International Congress Series 1275:341–350DOI 10.1016/j.ics.2004.09.032.
Chen T, He T, Benesty M. 2016. ‘xgboost’—extreme gradient boosting. R packageversion 0.4-2. Available at https:// cran.r-project.org/package=xgboost .
Cooke SJ, Blumstein DT, Buchholz R, Caro T, Fernandez-Juricic E, Franklin CE,Metcalfe J, O’Connor CM, St Clair CC, SutherlandWJ,Wikelski M. 2014. Physi-ology, behavior, and conservation. Physiological and Biochemical Zoology 87:1–14DOI 10.1086/671165.
Costa DP, Croxall JP, Duck CD. 1989. Foraging energetics of Antarctic fur seals inrelation to changes in prey availability. Ecology 70:596–606 DOI 10.2307/1940211.
Costa D,Williams T. 1999. Marine mammal energetics. In: Reynolds JE, ed. Biology ofmarine mammals. Washington, D.C.: Smithsonian Institution Press, 176–217.
Dalton AJM, Rosen DAS, Trites AW. 2015. Resting metabolic rate and activity: keycomponents of seasonal variation in daily energy expenditure for the north-ern fur seal (Callorhinus ursinus). Canadian Journal of Zoology 93:635–644DOI 10.1139/cjz-2014-0313.
Dassis M, Rodríguez DH, Ieno EN, Davis RW. 2012. Submerged swimming and restingmetabolic rates in Southern sea lions. Journal of Experimental Marine Biology andEcology 432–433:106–112 DOI 10.1016/j.jembe.2012.07.001.
Dassis M, Rodríguez DH, Ieno EN, Denuncio PE, Loureiro J, Davis RW. 2014. Restingmetabolic rate and heat increment of feeding in juvenile South American fur seals
Ladds et al. (2018), PeerJ, DOI 10.7717/peerj.5814 23/28

(Arctocephalus australis). Comparative Biochemistry and Physiology Part A: Molecular& Integrative Physiology 168:63–68 DOI 10.1016/j.cbpa.2013.11.007.
Davis RW,Williams TM. 2012. The marine mammal dive response is exercise mod-ulated to maximize aerobic dive duration. Journal of Comparative Physiology A198:583–591 DOI 10.1007/s00359-012-0731-4.
Diosdado JAV, Barker ZE, Hodges HR, Amory JR, Croft DP, Bell NJ, Codling EA. 2015.Classification of behaviour in housed dairy cows using an accelerometer-based activ-ity monitoring system. Animal Biotelemetry 3:15 DOI 10.1186/s40317-015-0045-8.
DonohueMJ, Costa DP, Goebel ME, Baker JD. 2000. The ontogeny of metabolic rateand thermoregulatory capabilities of northern fur seal, Callorhinus ursinus, pups inair and water. Journal of Experimental Biology 203:1003–1016.
Ekstrom C. 2014.MESS: miscellaneous esoteric statistical scripts. R package version 0.3-2. Available at https:// cran.r-project.org/package=MESS.
Fahlman A, Svärd C, Rosen DAS, Jones DR, Trites AW. 2008.Metabolic costs offoraging and the management of O2 and CO2 stores in Steller sea lions. Journal ofExperimental Biology 211:3573–3580 DOI 10.1242/jeb.023655.
Fish FE, Frappell PB, Baudinette RV, MacFarlane PM. 2001. Energetics of terrestriallocomotion of the platypus Ornithorhynchus anatinus. Journal of ExperimentalBiology 204:797–803.
Fish FE, Smelstoys J, Baudinette RV, Reynolds PS. 2002. Fur doesn’t fly, it floats:buoyancy of pelage in semi-aquatic mammals. Aquatic Mammals 28:103–112.
Fowler SL, Costa DP, Arnould JP, Gales NJ, Burns JM. 2007. Ontogeny of oxygenstores and physiological diving capability in Australian sea lions. Functional Ecology21:922–935 DOI 10.1111/j.1365-2435.2007.01295.x.
Fowler SL, Costa DP, Arnould JP, Gales NJ, Kuhn CE. 2006. Ontogeny of divingbehaviour in the Australian sea lion: trials of adolescence in a late bloomer. Journalof Animal Ecology 75:358–367 DOI 10.1111/j.1365-2656.2006.01055.x.
Friedman JH. 2002. Stochastic gradient boosting. Computational Statistics and DataAnalysis 38:367–378 DOI 10.1016/S0167-9473(01)00065-2.
Gales NJ, Mattlin RH. 1998. Fast, safe, field-portable gas anesthesia for otariids.MarineMammal Science 14:355–361 DOI 10.1111/j.1748-7692.1998.tb00727.x.
Gerlinsky CD, Trites AW, Rosen DAS. 2014. Steller sea lions (Eumetopias jubatus)have greater blood volumes, higher diving metabolic rates and a longer aerobicdive limit when nutritionally stressed. Journal of Experimental Biology 217:769–778DOI 10.1242/jeb.089599.
Goldstein DL. 1988. Estimates of daily energy expenditure in birds: the time-energy bud-get as an integrator of laboratory and field studies. American Zoologist 28:829–844DOI 10.1093/icb/28.3.829.
Halsey LG. 2011. The challenge of measuring energy expenditure: current field andlaboratory methods. Comparative Biochemistry and Physiology Part A: Molecular &Integrative Physiology 158:247–251 DOI 10.1016/j.cbpa.2011.01.001.
Ladds et al. (2018), PeerJ, DOI 10.7717/peerj.5814 24/28

Halsey LG. 2017. Relationships grow with time: a note of caution about energyexpenditure-proxy correlations, focussing on accelerometry as an example. Func-tional Ecology 31:1176–1183 DOI 10.1111/1365-2435.12822.
Halsey LG, Green JA,Wilson RP, Frappell PB. 2009. Accelerometry to estimate energyexpenditure during activity: best practice with data loggers. Physiological andBiochemical Zoology 82:396–404 DOI 10.1086/589815.
Hind A, GurneyW. 1997. The metabolic cost of swimming in marine homeotherms.Journal of Experimental Biology 200:531–542.
Hothorn T, Bretz F, Westfall P, Heiberger RM, Schuetzenmeister A, Scheibe S. 2013.multcomp: simultaneous inference in general parametric models. R package version1.2-18. Vienna: R Foundation for Statistical Computing. Available at https:// cran.r-project.org/web/packages/multcomp/ index.html .
Iwata T, Yonezaki S, Kohyama K, Mitani Y. 2013. Detection of grooming behaviourswith an acceleration data logger in a captive northern fur seal (Callorhinus ursinus).Aquatic Mammals 39:378–384 DOI 10.1578/AM.39.4.2013.378.
Jeanniard-du Dot T, Guinet C, Arnould JPY, Trites AW. 2016. Accelerometers canmeasure total and activity-specific energy expenditure in free-ranging marinemammals only if linked to time-activity budgets. Functional Ecology 31(2):377–386DOI 10.1111/1365-2435.12729.
Kirkwood R, Goldsworthy S. 2013. Fur seals and sea lions. Melbourne: CSIRO Publish-ing.
Kirkwood R, Pemberton D, Gales R, Hoskins AJ, Mitchell T, Shaughnessy PD, ArnouldJPY. 2010. Continued population recovery by Australian fur seals.Marine andFreshwater Research 61:695–701 DOI 10.1071/MF09213.
Kirsch PE, Iverson SJ, BowenWD. 2000. Effect of a low fat diet on body compositionand blubber fatty acids of captive juvenile harp seals (Phoca groenlandica). Physiologi-cal and Biochemical Zoology 73:45–59 DOI 10.1086/316723.
Kleiber M. 1975.Metabolic turnover rate: a physiological meaning of the metabolic rateper unit body weight. Journal of Theoretical Biology 53:199–204DOI 10.1016/0022-5193(75)90110-1.
Knox TC, Stuart-Williams H,Warneke RM, Hoskins AJ, Arnould JP. 2014. Anal-ysis of growth and stable isotopes in teeth of male Australian fur seals revealsinterannual variability in prey resources.Marine Mammal Science 30:763–781DOI 10.1111/mms.12078.
LaddsMA, Rosen DAS, Slip DJ, Harcourt RG. 2017a. Proxies of energy expenditure formarine mammals: an experimental test of ‘‘the time trap’’. Scientific Reports 7:11815DOI 10.1038/s41598-017-11576-4.
LaddsMA, Slip DJ, Harcourt RG. 2016. Swimming metabolic rates vary by sex anddevelopment stage, but not by species, in three species of Australian otariid seals.Journal of Comparative Physiology B 187:503–516 DOI 10.1007/s00360-016-1046-5.
Ladds et al. (2018), PeerJ, DOI 10.7717/peerj.5814 25/28

LaddsMA, Slip DJ, Harcourt RG. 2017. Intrinsic and extrinsic influences on standardmetabolic rates of three species of Australian otariid. Conservation Physiology5(1):cow074 DOI 10.1093/conphys/cow074.
LaddsMA, Thompson AP, Kadar J-P, Slip DJ, Hocking DP, Harcourt RG. 2017b. Supermachine learning: improving accuracy and reducing variance of behaviour classifica-tion from accelerometry. Animal Biotelemetry 5:8 DOI 10.1186/s40317-017-0123-1.
LaddsMA, Thompson AP, Slip DJ, Hocking DP, Harcourt RG. 2016. Seeing it all:evaluating supervised machine learning methods for the classification of diverseotariid behaviours. PLOS ONE 11:e0166898 DOI 10.1371/journal.pone.0166898.
Liwanag HEM. 2010. Energetic costs and thermoregulation in northern fur seal(Callorhinus ursinus) pups: the importance of behavioral strategies for thermal bal-ance in furred marine mammals. Physiological and Biochemical Zoology 83:898–910DOI 10.1086/656426.
Liwanag HEW,Williams TM, Costa D, Kanatous S, Davis R, Boyd I. 2009. Theeffects of water temperature on the energetic costs of juvenile and adult Californiasea lions (Zalophus californianus): the importance of skeletal muscle thermo-genesis for thermal balance. Journal of Experimental Biology 212:3977–3984DOI 10.1242/jeb.033282.
Maresh J, Adachi T, Takahashi A, Naito Y, Crocker D, HorningM,WilliamsT, Costa D. 2015. Summing the strokes: energy economy in northern ele-phant seals during large-scale foraging migrations.Movement Ecology 3:1–16DOI 10.1186/s40462-015-0049-2.
Mitani Y, Andrews RD, Sato K, Kato A, Naito Y, Costa DP. 2009. Three-dimensionalresting behaviour of northern elephant seals: drifting like a falling leaf. Biology Letters6:163–166 DOI 10.1098/rsbl.2009.0719.
Nathan R, Spiegel O, Fortmann-Roe S, Harel R, Wikelski M, GetzWM. 2012. Using tri-axial acceleration data to identify behavioral modes of free-ranging animals: generalconcepts and tools illustrated for griffon vultures. Journal of Experimental Biology215:986–996 DOI 10.1242/jeb.058602.
Orr HA. 2009. Fitness and its role in evolutionary genetics. Nature Reviews Genetics10:531–539 DOI 10.1038/nrg2603.
Ponganis P, Kooyman G,Winter L, Starke L. 1997.Heart rate and plasma lactateresponses during submerged swimming and trained diving in California sea lions,Zalophus californianus. Journal of Comparative Physiology B: Biochemical, Systemic,and Environmental Physiology 167:9–16 DOI 10.1007/s003600050042.
Ponganis PJ, Meir JU,Williams CL. 2011. In pursuit of Irving and Scholander: a reviewof oxygen store management in seals and penguins. Journal of Experimental Biology214:3325–3339 DOI 10.1242/jeb.031252.
Qasem L, Cardew A,Wilson A, Griffiths I, Halsey LG, Shepard EL, Gleiss AC,WilsonR. 2012. Tri-axial dynamic acceleration as a proxy for animal energy expenditure;should we be summing values or calculating the vector? PLOS ONE 7:e31187DOI 10.1371/journal.pone.0031187.
Ladds et al. (2018), PeerJ, DOI 10.7717/peerj.5814 26/28

R Core Development Team. 2015. R: a language and environment for statistical com-puting. R version 331. R package version 3.2.3. Vienna: R Foundation for StatisticalComputing. Available at https://www.r-project.org .
Ravi N, Dandekar N, Mysore P, LittmanML. 2005. Activity recognition from accelerom-eter data. In: Proceedings of the seventeenth conference on innovative applications ofartificial intelligence. Pittsburgh, 1541–1546.
Rosen DAS, Hindle AG, Gerlinsky CD, Goundie E, Hastie GD, Volpov BL, Trites AW.2016. Physiological constraints and energetic costs of diving behaviour in marinemammals: a review of studies using trained Steller sea lions diving in the open ocean.Journal of Comparative Physiology B 187:29–50 DOI 10.1007/s00360-016-1035-8.
Rosen DAS, Trites AW. 1997.Heat increment of feeding in Steller sea lions, Eumetopiasjubatus. Comparative Biochemistry and Physiology Part A Molecular & IntegrativePhysiology 118:877–881 DOI 10.1016/S0300-9629(97)00039-X.
Shepard EL,Wilson RP, Halsey LG, Quintana F, Laich AG, Gleiss AC, Liebsch N, MyersAE, Norman B. 2008a. Derivation of body motion via appropriate smoothing ofacceleration data. Aquatic Biology 4:235–241 DOI 10.3354/ab00104.
Shepard EL,Wilson RP, Quintana F, Laich AG, Liebsch N, Albareda DA, HalseyLG, Gleiss A, Morgan DT, Myers AE. 2008b. Identification of animal movementpatterns using tri-axial accelerometry. Endangered Species Research 10:47–60DOI 10.3354/esr00084.
Spence-Bailey L, Verrier D, Arnould J. 2007. The physiological and behaviouraldevelopment of diving in Australian fur seal (Arctocephalus pusillus doriferus) pups.Journal of Comparative Physiology B 177:483–494 DOI 10.1007/s00360-007-0146-7.
Stirling I. 1971. Studies on the behaviour on the South Australian fur seal, Arctocephalusforsteri (Lesson) I. Annual cycle, postures and calls, and adult males during breedingseason. Australian Journal of Zoology 19:243–266 DOI 10.1071/ZO9710243.
Stirling I. 1974.Midsummer observations on the behavior of wild polar bears (Ursusmaritimus). Canadian Journal of Zoology 52:1191–1198 DOI 10.1139/z74-157.
Travis J. 1982. A method for the statistical analysis of time-energy budgets. Ecology63:19–25 DOI 10.2307/1937026.
Volpov BL, Hoskins AJ, Battaile BC, Viviant M,Wheatley KE, Marshall G, Aber-nathy K, Arnould JPY. 2015. Identification of prey captures in australian furseals (Arctocephalus pusillus doriferus) using head-mounted accelerometers:field validation with animal-borne video cameras. PLOS ONE 10:e0128789DOI 10.1371/journal.pone.0128789.
Wang Y, Nickel B, Rutishauser M, Bryce CM,Williams TM, Elkaim G,WilmersCC. 2015.Movement, resting, and attack behaviors of wild pumas are re-vealed by tri-axial accelerometer measurements.Movement Ecology 3:1–12DOI 10.1186/s40462-015-0030-0.
Weise MJ, Costa DP. 2007. Total body oxygen stores and physiological diving capacityof California sea lions as a function of sex and age. Journal of Experimental Biology210:278–289 DOI 10.1242/jeb.02643.
Ladds et al. (2018), PeerJ, DOI 10.7717/peerj.5814 27/28

Whitney NM, Pratt Jr HL, Pratt TC, Carrier JC. 2010. Identifying shark matingbehaviour using three-dimensional acceleration loggers. Endangered Species Research10:71–82 DOI 10.3354/esr00247.
Williams TM, Fuiman LA, HorningM, Davis RW. 2004. The cost of foraging by amarine predator, the Weddell seal Leptonychotes weddellii: pricing by the stroke.Journal of Experimental Biology 207:973–982 DOI 10.1242/jeb.00822.
Williams TM, Rutishauser M, Long B, Fink T, Gafney J, Mostman-Liwanag H, CasperD. 2007. Seasonal variability in otariid energetics: implications for the effectsof predators on localized prey resources. Physiological and Biochemical Zoology80:433–443 DOI 10.1086/518346.
Wilson RP,White CR, Quintana F, Halsey LG, Liebsch N, Martin GR, Butler PJ. 2006.Moving towards acceleration for estimates of activity specific metabolic rate in freeliving animals: the case of the cormorant. Journal of Animal Ecology 75:1081–1090DOI 10.1111/j.1365-2656.2006.01127.x.
Ladds et al. (2018), PeerJ, DOI 10.7717/peerj.5814 28/28