using acoustic emission to evaluate fracture toughness energy release rate
TRANSCRIPT

7
Using Acoustic Emission to Evaluate Fracture Toughness Energy Release Rate (GI) at Mode I
Delamination of Composite Materials
Amir Refahi Oskouei1, Andrea Zucchelli2, Mehdi Ahmadi3 and Giangiacomo Minak4
1Islamic Azad University, East Tehran Branch, 2,4University of Bologna,
3Amirkabir University of Technology (Tehran Polytechnic), 1,3Iran
2,4Italy
1. Introduction
Delamination is a critical damage mode in composite structures, not necessarily because it
will cause the structure split into two or more pieces at the end of the damaging process, but
because it can degrade the laminate strength to such a degree that it becomes useless in
service. The design of composite structures to account for delamination and other forms of
damage involves two fundamental considerations, namely damage resistance and damage
tolerance. Knowledge of a laminated composite material’s resistance to interlaminar fracture
is useful for product development and material selection.
Damage resistance is the measure of the capability of a material or structure to resist the
initial occurrence of damage. This aspect must be considered for designing and maintaining
the integrity of load carrying structures (Pagano & Schoeppner, 2000). In this regard, we
should also note that polymer matrix composites are given primary attention because of
their importance and dominance in practical structural applications as well as the composite
literature itself.
Mode I inter-laminar fracture has received the greatest attention from researchers. This is
due to the fact that the delamination initiation energy is low compared to that of the
shearing mode. Several studies were already conducted on the mode I fracture to
determine the surface energies of composite materials by creating a crack propagation
effect (Perrin et al., 2003). Researchers were thus able to consider the effect of ambient
conditions and manufacturing variables on the strain energy release rate (GI)
(Velmurugan & Solaimurugan, 2007). The effect of fiber direction on delamination
fracture toughness is a problem that was studied by (Kim & Mayer, 2003), and
(Solaimurugan & Velmurugan, 2008). Literature results show that adjacent ply
delamination fracture toughness decreased as the mismatch angle of fiber between the
same plies increased (MIL-HDBK, 2002). The reason for fracture energy dependence on
www.intechopen.com

Acoustic Emission
152
fiber mismatch angle is considered to be the stiffness of the plies thus fibers have the
highest contribution to the stiffness of each ply. The effects of temperature on
delamination growth in a carbon/epoxy composite under fatigue loading also shows that
at elevated temperatures the strain energy release rate threshold values for delamination
growth under fatigue loading are significantly lower than the critical energy release rates
in static tests (ASTM, 1994; Sjogren & Asp, 2002). The effect of loading rate on fracture
toughness of laminated composites was studied by (Kusaka et al., 1998) and (Hug, 2006).
The results show a slight effect of loading rate on fracture toughness at rates up to 1.6
m/s, but beyond this rate threshold the fracture energy decreases (Benmedakhene et al.,
1999). So far, many researchers have tried to improve delamination fracture toughness
through different techniques. In some investigations, improvements in delamination
fracture toughness were performed through 3D fiber architecture (stitching, knitting and
braiding). It was observed that through thickness stitching is a promising reinforcing
technique for improving interlaminar strength (Tsai & Chen, 2005).
Some analytical and theoretical models simulated via finite element method (FEM) are also used for predicting interlaminar delamination in composite structures (Chen, 1999). The computed results have been very similar and in close agreement with both the experimental results and solutions obtained from a corrected beam theory (Diaz, 2007).
Based on the extensive and thorough literature investigation it can be concluded that mode I
delamination tests depend on many parameters such as opening rate, fiber direction, type of
resin, condition of resin, temperature, etc. Crack propagation can be defined as the ultimate
form of failure mechanism taking place in the interlaminar zone during delamination. As
can be evaluated by direct observation or using a load-displacement plot, this is a
macroscopic failure activity. Microscopic behavior of fiber matrix interface microdamage is
more difficult to be investigated, although it represents a major part of the delamination
process. For monitoring microscopic events, Acoustic Emission (AE) is an appropriate tool
(Refahi Oskouei & Ahmadi, 2010; Ndiaye et al., 2000; R’Mili et al., 2008; Cesari et al., 2007;
Huguet et al., 2002). However, the interpretation of the signals and, hence, the evaluation of
the damage stages is a major problem of the AE method.
The combination of Double-cantilever beam (DCB) fracture-toughness tests with
simultaneous AE monitoring provides useful information about microscopic and
macroscopic aspects of the delamination process.
During the last 30 years, in few papers the AE has been considered as a tool to predict the
delamination fracture toughness (Benmedakhene et al., 1999; Ndiaye et al., 2000; Niebergall
et al., 1999; Bohse, 2000; Lorriot, Wu & Dzenis, 2003; Bohse & Brunner, 2008). Except the
paper (Ndiaye et al., 2000), in all other works the mode I fracture toughness is estimated by
conventional formulas provided by normative and the AE information are used to have a
phenomenological description of the delamination progression. The paper presented by
(Ndiaye et al., 2000) used the AE information to estimate the GIc, nevertheless their approach
has some limitations concerning the theoretical approach and some details about that will be
discussed later in the present paper.
From literature studies about delamination failure in composite laminate and its
monitoring by AE three critical aspects can be listed: the first concerns how AE
www.intechopen.com

Using Acoustic Emission to Evaluate Fracture Toughness Energy Release Rate (GI) at Mode I Delamination of Composite Materials
153
information is used to estimate the GIc, the second concerns the repeatability of the results
and the application of the methodologies to different case studies, the third aspect
concerns the comparison of the results obtained by using the AE information to the ones
that can be obtained by the current standards, such as (ASTM, 1994). Regarding the first
aspect, it can be noted that the classic way of using the AE information in order to
estimate some of the relevant material performances (e.g. ultimate strength, fracture
toughness, residual strength after damage) is based on empirical or semi-empirical
relations where the mechanical and the AE information is used separately. In other words,
in these studies the authors want to use the AE information as self-standing information
to predict or estimate the mechanical performances. The results obtained from such
studies are typically weak with respect to the repeatability and to the extension to case
studies different from the one that is analyzed in the specific paper. The approach that is
proposed and applied in the present study is based on a novel function that combines the
mechanical and AE energies. This function is based on the idea that during the loading
process a material is able to store strain energy and at the same time part of the stored
energy is also released due to the internal failures. The AE events energy represents an
important part of the released energy and can be used to weight the strain energy storing
capability of the material. As greater is the damage due to internal failure as the
cumulated AE increases and at the same time the strain energy storing attitude is reduced.
The proposed function thus compares the strain energy stored in the material (Es) to the
released energy in the form of acoustic energy (Ea) by their ratio (Es/Ea). It was proved
that the best way to represent such a ratio is to consider its natural logarithm (ln(Es/Ea)),
(Minak & Zucchelli, 2008). This function, called sentry function f, has been successfully
applied to study the damage progression of some composite laminates (Minak &
Zucchelli, 2008), to estimate the static and the fatigue residual strength of a plate subjected
to indentation processes (Cesari et al., 2007; Minak & Zucchelli, 2008; Minak et al., 2009),
and to estimate the residual torsional strength of a composite tube subjected to a lateral
impact (Minak et al., 2009).
The purpose of the present study is to investigate the delamination mode I process of composite laminate in double cantilever beam (DCB) set-up by using the sentry function. Three types of specimens with different midplane layups, leading to different levels of inter-laminar performance, were therefore studied. The use of the sentry function enabled the analysis of a test phase during which it was not possible to identify any visible crack propagation. Such analysis is of particular interest to determine the crack length evolution and consequently the GI variation during the test. In particular, it was possible to determine the test stage at which the crack propagation became visually detectable by means of the maximum value of the integral of the sentry function (Int(f)) that is a parameter used to estimate the material damage progression (Minak & Zucchelli, 2008; Minak et al., 2009). The Int(f) is defined as the integral of the sentry function over the displacement domain where acoustic emission has been detected:
AE
Int(f ) f x dx
(1)
Based on values of Int(f) it was possible to predict the test stage at which a delamination propagation becomes visible under an opening load condition. Furthermore, it was possible
www.intechopen.com

Acoustic Emission
154
to highlight a bi-linear relation between the cumulative strain energy release rate (GICUM) and the integral of the sentry function over the displacement domain (Int(f)). The transition point in the bilinear relation enabled the estimation of the critical strain release rate (GIc) value. The GIc obtained by this approach was then compared to the values obtained by both ASTM D5528 standard test method (ASTM, 1994) and (Ndiaye et al., 2000) approaches. It was possible to obtain a very good agreement between the results from the new approach to the ones obtained by the ASTM D5528. At the contrary, a strong disagreement was noted between the results obtained by the Ndiaye approach with respect to the ones obtained by the new approach and the ASTM D5528 one.
2. Experimental procedure
2.1 Material and specimen preparation
The composite double cantilever beam (DCB) specimens used in this study are polyester resin reinforced with glass fiber. The properties of the polyester resin as a matrix material and fiber as a reinforcement are summarized in table 1. Three different interface types were used: woven/woven (T3), woven/unidirectional (T4) and unidirectional/unidirectional (T5). The laminates were prepared by hand lay-up. The starter crack was formed by inserting a Teflon film with a thickness of ~ 20 µm at mid-plane during molding as an initial crack for the mode I interlaminar fracture toughness test. Fiber orientations were measured with respect to beam axis along the specimen length. The angular orientation of woven lamina was represented by the orientation of warp directional fibers. The specimen dimensions were width b=20 mm, crack length a=70 mm, total length 250 mm, and thickness 2h=5mm.
Material Density* Ultimate tensile stress (MPa)
Elastic modulus (GPa)
Tensile failure strain (%)
Polyester resin 1.12 80 2.7 3
Unidirectional glass fiber 500 2150 74 2.6
Woven glass fiber 292 2150 74 2.6
*For polyester the unit of density is g/cm3 and for glass fiber the areal or surface density is considered e.g. g/cm2.
Table 1. Summary of matrix and fiber properties.
2.2 Testing procedure
The opening forces were applied to the DCB specimen with loading blocks (Fig. 1) bonded to one end of the specimen. The ends of the DCB were opened by controlling the crosshead movement. The tests were carried out with a displacement speed of 5 mm/min for each specimen, while the load and delamination length were recorded. Both edges of the specimens just ahead of the insert were coated with a thin layer of water-based typewriter correction fluid and marked in accordance with ASTM D5528 standard instruction to aid in visual detection of delamination onset. Five specimens for each type of sample were used for the DCB test.
www.intechopen.com

Using Acoustic Emission to Evaluate Fracture Toughness Energy Release Rate (GI) at Mode I Delamination of Composite Materials
155
Fig. 1. View of the experimental device for AE monitoring of DCB specimen.
2.3 AE equipment
Acoustic emission software AEWin and a data acquisition system Physical Acoustics
Corporation (PAC) PCI-2 with a maximum sampling rate of 40 MHz were used to record AE
events. A broadband, resonant-type, single-crystal piezoelectric transducer from PAC, called
PICO, was used as the AE sensor. The sensor had a resonance frequency of 513.28 kHz and
an optimum operating range of 100–750 kHz. The surface of the sensor was covered with
grease in order to provide good acoustic coupling between the specimen and the sensor. The
signal was detected by the sensor and enhanced by a 2/4/6-AST pre-amplifier. The gain
selector of the preamplifier was set to 40 dB. The test sampling rate was 1 MHz with 16 bits
of resolution between 10 and 100 dB. Prior to the damage check, the data acquisition system
was calibrated for each kind of specimen, according to a pencil lead break procedure. The
pencil lead break procedure enables the generation of waves at the specimen surface that are
used for the device calibration. At the same time, the velocity and attenuation of the AE
waves were measured. The lead breakage operation was repeated several times and at
different locations between the sensors. After the calibration step, AE signals were captured
during mechanical testing. Signal descriptors, such as amplitude, duration, rise time, counts,
and energy, were calculated by the AE software (AEWin).
2.4 Energy release rate
The beam theory expression for the strain energy release rate of a perfectly built-in (that is,
clamped at the delamination front) double cantilever beam is as follows:
ba
PG
I2
3 (2)
where P Load, δ load point displacement, b specimen width and a delamination length.
In practice, this expression will overestimate GI because the beam is not perfectly built-in (that is, rotation may occur at the delamination front). One way to overcome this problem is to apply a correction factor to the modified beam theory (MB) for the strain energy release
www.intechopen.com
Acoustic Emission
156
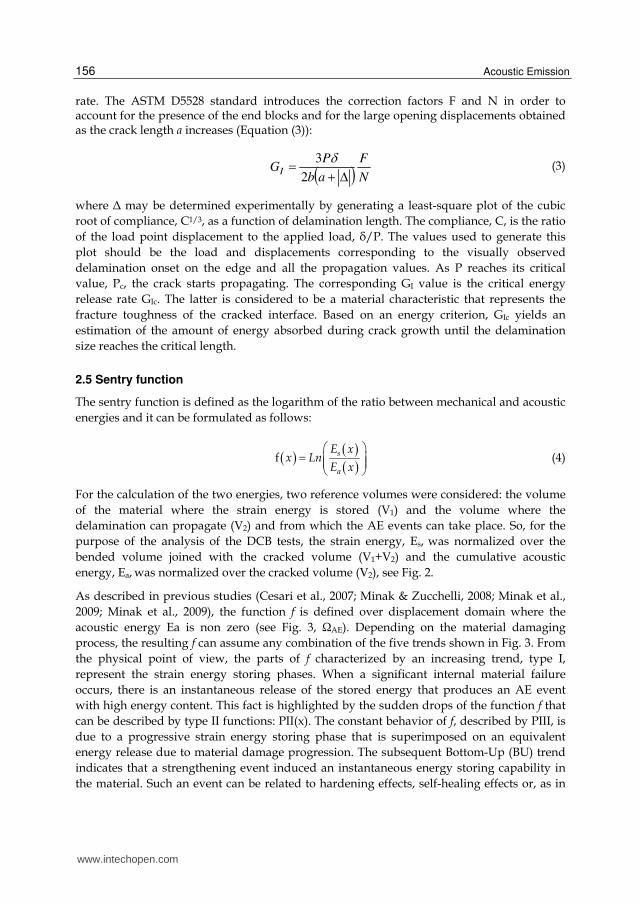
rate. The ASTM D5528 standard introduces the correction factors F and N in order to account for the presence of the end blocks and for the large opening displacements obtained as the crack length a increases (Equation (3)):
NFab
PG
I 2
3 (3)
where Δ may be determined experimentally by generating a least-square plot of the cubic
root of compliance, C1/3, as a function of delamination length. The compliance, C, is the ratio
of the load point displacement to the applied load, δ/P. The values used to generate this
plot should be the load and displacements corresponding to the visually observed
delamination onset on the edge and all the propagation values. As P reaches its critical
value, Pc, the crack starts propagating. The corresponding GI value is the critical energy
release rate GIc. The latter is considered to be a material characteristic that represents the
fracture toughness of the cracked interface. Based on an energy criterion, GIc yields an
estimation of the amount of energy absorbed during crack growth until the delamination
size reaches the critical length.
2.5 Sentry function
The sentry function is defined as the logarithm of the ratio between mechanical and acoustic
energies and it can be formulated as follows:
f s
a
E xx Ln
E x
(4)
For the calculation of the two energies, two reference volumes were considered: the volume
of the material where the strain energy is stored (V1) and the volume where the
delamination can propagate (V2) and from which the AE events can take place. So, for the
purpose of the analysis of the DCB tests, the strain energy, Es, was normalized over the
bended volume joined with the cracked volume (V1+V2) and the cumulative acoustic
energy, Ea, was normalized over the cracked volume (V2), see Fig. 2.
As described in previous studies (Cesari et al., 2007; Minak & Zucchelli, 2008; Minak et al.,
2009; Minak et al., 2009), the function f is defined over displacement domain where the
acoustic energy Ea is non zero (see Fig. 3, ΩAE). Depending on the material damaging
process, the resulting f can assume any combination of the five trends shown in Fig. 3. From
the physical point of view, the parts of f characterized by an increasing trend, type I,
represent the strain energy storing phases. When a significant internal material failure
occurs, there is an instantaneous release of the stored energy that produces an AE event
with high energy content. This fact is highlighted by the sudden drops of the function f that
can be described by type II functions: PII(x). The constant behavior of f, described by PIII, is
due to a progressive strain energy storing phase that is superimposed on an equivalent
energy release due to material damage progression. The subsequent Bottom-Up (BU) trend
indicates that a strengthening event induced an instantaneous energy storing capability in
the material. Such an event can be related to hardening effects, self-healing effects or, as in
www.intechopen.com

Using Acoustic Emission to Evaluate Fracture Toughness Energy Release Rate (GI) at Mode I Delamination of Composite Materials
157
the case of the present study, it can be related to fiber bridging effects. The decreasing
behavior of f, type PIV, is related to the fact that the AE activity is greater then the material
strain energy storing capability: the damage has reached a maximum and the material has
no resources to sustain the load. The PI and BU functions both have an increasing trend.
Both functions, according to the definition of the sentry function represent events that occur
when the strain energy storing capability exceeds the energy release (that is, in this
procedure, measured by the acoustic energy). This means that if the material is able to store
energy during the test, the sentry function can be described by a function of type I or a BU
function type. In the case of moderate material damage, always at the beginning of the
testing process, the strain energy storing capability exceeds the amount of energy that is
released and the sentry function is characterized by an increasing function, but, due to the
fact that the damage in the material is growing, the slope of this function progressively
decreases. On the other hand, if a strong material configuration change occurs, such as the
when fibers between two adjacent plies create a connection, also called fiber bridging, the
strain energy storing capability increases instantaneously. In such a case the sentry function
can be described by a linearly increasing function as the BU function is. So, comparing the PI
and the BU functions, it can observed that the first one is characterized by a decreasing slope
and the BU function has an almost linear slope. Moreover the BU function has a lower
extension than the PI one.
Fig. 2. Reference volume V1 and V2 for the normalized energies calculation.
3. Results and discussion
Results from DCB tests are reported in two main paragraphs: in the first one the mechanical
behavior and the main AE information are reported, in the application of the sentry function
to the studied specimens is presented.
3.1 Mechanical behavior and AE trends
Fig. 4 shows an example of the DCB specimen mechanical behavior in terms of load-
displacement and crack length-displacement diagrams for each mid-plane interface type
(the load was normalized by means of the specimen thickness)
www.intechopen.com

Acoustic Emission
158
Referring to Fig. 4, it can be noted that at the beginning of loading, the load and
displacement relation is almost linear until the maximum load. Beyond the maximum load,
the nonlinearity is considerable. Also, the crack propagation initiates near the maximum
load. Note that there is no visible crack propagation at the beginning of loading. Referring
now to the crack length diagrams, the comparison of three plots in Fig. 4 shows that the
specimen T3 has stable-like crack propagation and there is a smooth increasing curve during
the loading after the maximum load. For specimens T4 and T5, the crack length curve
development has a completely different trend. This is due to fiber bridging during the
delamination process that affects the load-displacement curve. In some cases, before
maximum load, fiber bridging has occurred and the kick points (sudden drop off in load)
are highlighted in the load-displacement curve; however, such a physical phenomenon does
not seem to have any effect on the crack length development. Moreover, the other
conditions like crack jumping from one layer to another one and the cutting condition
(cutting edge) are factors leading to kick point existence too.
Fig. 3. The basic functions PI , PII , PIII and PIV, used to describe the function f.
Diagrams in Fig. 5 show the trend of the GI calculated by the formula (2) from the ASTM
D5528 standard. From such diagrams it can be observed that up to maximum load the strain
energy release rate is increasing, but beyond maximum load there is a slight decrease in the
GI trend. Such reduced values of the strain energy release rate are related to the drop off of
the load shown in the load-displacement diagram. The load drop off is due to the crack
propagation process based on a sudden extension and a subsequent stop (the “stop and go”
phenomenon).
www.intechopen.com

Using Acoustic Emission to Evaluate Fracture Toughness Energy Release Rate (GI) at Mode I Delamination of Composite Materials
159
Fig. 6 summarizes some of the most relevant information extracted from the mechanical
behavior. In particular, the load values which were considered are the maximum load and
the load at which the first crack extension was visibly observed. Both values are useful for
the subsequent calculation of the GI. The displacement values at the maximum load and at
the first observed crack extension are both useful to characterize the different behavior of
the mid-plane interface quality with respect to mode I of delamination.
Fig. 4. Typical load and crack propagation length versus displacement for the three types of specimen mid-plane interfaces.
Fig. 7 shows the acoustic emission events behavior during loading. Different AE behaviors were noted between the different interface types and in particular great differences are highlighted where AE energies were first detected at the early stage of loading with alternating appearances up to an arbitrary delaminated length. Variations in AE event energy also reflect different damage mechanisms. The early stage of loading is free of acoustic events, but near the maximum load the first AE events are detectable. During the crack propagation process, the number of cumulative AE events and the cumulative AE event energy increase (Fig. 8). In particular, it can be seen that depending on the interface type the trend of cumulative events and of cumulative AE energy versus opening displacement change. It can thus be observed that at a fixed opening displacement in the case of the tougher interface, T5,
www.intechopen.com

Acoustic Emission
160
the detected events are fewer than with the brittle one, T4, and the AE energy can vary because of different dominant damage mechanisms in each specimen.
A more detailed description of AE events can be obtained from Fig. 8 where the cumulative
counts and AE event energy are plotted versus the displacement (in Fig. 8, the load and the
GI are also reported in each diagram and all diagrams have the same horizontal scale). In
particular, it can be noted that increasing the toughness of the interface, from T4 up to T5,
the number of cumulative counts recorded at the visible crack propagation point and at the
maximum load decreases.
Fig. 5. Typical trends of load and GI versus displacement for the three mid-plane interfaces.
In particular, it is of interest to consider the number of cumulative counts (Count CUM) and the cumulative AE event energy (Ea CUM) at the first visible crack extension. These values are summarized in Table 2 in terms of mean value (M.V.) and coefficient of variation (C.V.) of cumulative counts and cumulative AE energy.
The data in Table 2 show that the Count CUM or the cumulative AE event energy are not useful variables to predict the test stage at which the first visible crack extension occurs because the coefficients of variation are too high.
www.intechopen.com

Using Acoustic Emission to Evaluate Fracture Toughness Energy Release Rate (GI) at Mode I Delamination of Composite Materials
161
Fig. 6. Comparison of the normalized force vs. displacement diagrams for each of the three interface types with the points where there is the maximum of the force and where crack propagation begins (the confidence bars are based on the single standard deviation).
Count CUM Ea CUM (J)
M.V. C.V. M.V. C.V.
T3 10920 110% 1.3E-13 171%
T4 244 49% 3.8E-16 97%
T5 195 59% 2.5E-17 42%
Table 2. Count CUM and Ea CUM at the first visible crack extension.
3.2 The sentry function application and results discussion
The sentry function is the logarithm of the ratio between the normalized Strain Energy and
the normalized Cumulative Acoustic Energy as in Equation 4. The Strain energy is
calculated by using the load-displacement information, Fig. 4, and the cumulative AE
energy is calculated as the summation of the AE event energy, Fig. 8. Both energies are
normalized by the proper reference volume as previously described, Fig. 2: the reference
volume to normalize the strain energy is made by the bended volume joined with the
volume where the delamination grows (V1+V2), the reference volume for the acoustic
energy is calculated where the delamination grows (V2) considering each measurement of
crack extension, see Fig. 4.
www.intechopen.com
Acoustic Emission
162
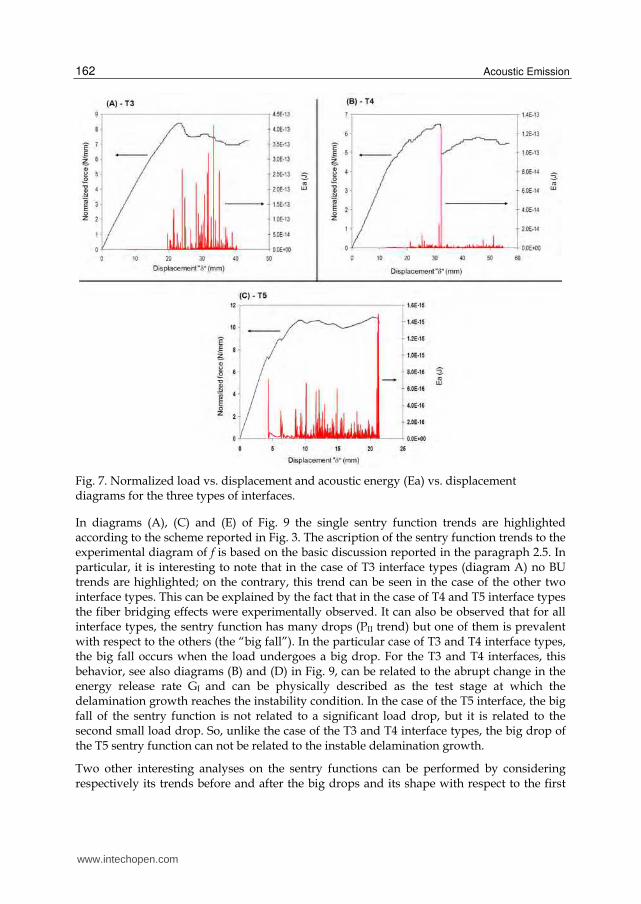
Fig. 7. Normalized load vs. displacement and acoustic energy (Ea) vs. displacement diagrams for the three types of interfaces.
In diagrams (A), (C) and (E) of Fig. 9 the single sentry function trends are highlighted according to the scheme reported in Fig. 3. The ascription of the sentry function trends to the experimental diagram of f is based on the basic discussion reported in the paragraph 2.5. In particular, it is interesting to note that in the case of T3 interface types (diagram A) no BU trends are highlighted; on the contrary, this trend can be seen in the case of the other two interface types. This can be explained by the fact that in the case of T4 and T5 interface types the fiber bridging effects were experimentally observed. It can also be observed that for all interface types, the sentry function has many drops (PII trend) but one of them is prevalent with respect to the others (the “big fall”). In the particular case of T3 and T4 interface types, the big fall occurs when the load undergoes a big drop. For the T3 and T4 interfaces, this behavior, see also diagrams (B) and (D) in Fig. 9, can be related to the abrupt change in the energy release rate GI and can be physically described as the test stage at which the delamination growth reaches the instability condition. In the case of the T5 interface, the big fall of the sentry function is not related to a significant load drop, but it is related to the second small load drop. So, unlike the case of the T3 and T4 interface types, the big drop of the T5 sentry function can not be related to the instable delamination growth.
Two other interesting analyses on the sentry functions can be performed by considering respectively its trends before and after the big drops and its shape with respect to the first
www.intechopen.com

Using Acoustic Emission to Evaluate Fracture Toughness Energy Release Rate (GI) at Mode I Delamination of Composite Materials
163
Fig. 8. Typical AE cumulative event (column 1) and cumulative AE event energy (column 2) during the delamination process for each type of interface.
visible crack propagation. Regarding the first aspect, it can be noted that, before the big fall of f, in the case of T3 and T4 specimens the sentry function trends consist of combinations of PII, PIII and PIV trends. These compositions indicate the fact that the AE released energy tends to overcome the strain energy storing capability of the material. In the case of the T4 specimen, it also has to be noted that before the big fall of the sentry function some BU trends are present. As stated previously, the BU trends highlight the presence of some fiber bridging due to the presence of a unidirectional ply in the T4 interface structure. In the case of T3 and T4 interface types, after the big drop the sentry function consists of a waved composition of PI, PIII and PIV trends. These compositions for the sentry function indicate a renewed strain energy storing capability in the material that is, in any case, partial and
www.intechopen.com

Acoustic Emission
164
Fig. 9. Examples of sentry function trends obtained by the normalized energies in the case of woven-woven (A-T3), woven-unidirectional (B-T4) and unidirectional-unidirectional (C-T5) interface types (the load-displacement and the GI-displacement are also reported in each diagram).
discontinuous due to continuous “stop and go” progression of the post instability delamination growth process. In the case of the T5 interface type, before the big fall, the sentry function is characterized by trends of types PI and PII. These trends indicate the strain energy storing capability and the abrupt failure at the DCB specimen interface level. After the big fall, the sentry function trend of T5 specimens is characterized by the presence of PI, PII, PIV and BU trends. This behavior indicates the fact that, due to the fiber bridging effect, the specimen at the interface zone has a residual strain energy storing capability. In particular, this behavior is sustained until the instability growth of the delamination is reached at about 13 mm of displacement. After the instability of the delamination process,
www.intechopen.com

Using Acoustic Emission to Evaluate Fracture Toughness Energy Release Rate (GI) at Mode I Delamination of Composite Materials
165
the sentry function consists of a composition of PI, PIII and PIV that is waved in shape due to the continuous “stop and go” progression of the crack front.
The second aspect concerns the relationship between the sentry function and the first visible crack propagation. The discussion is based on the fact that the sentry function simultaneously takes into account the strain energy storing capability (Es) and the release of the internal energy (Ea) due to damage. So, when the energy storing capability decreases this indicates that the material damage is increased, and, at the same time, the tendency of the material to release the internal energy will decrease as well. Thus, when the material damage increases, the ratio between the energy storing capability and the cumulated released energy (Es/Ea), that is the sentry function, will decrease. The sentry function can thus be used to describe the history of the material damage. In particular, considering the integral of the sentry function over the AE displacement domain we obtain a value that is proportional to the cumulated material damage. This integral (Int(f)) can be used as a material damage indicator processes (Cesari et al., 2007; Minak & Zucchelli, 2008; Minak et al., 2009). In fact, in previous studies, it was shown how the integral of the sentry function is related to the material damage and in particular how it can be used to predict the residual strength of composite laminate after an accident (such as an indentation or a low velocity impact phenomenon) processes (Cesari et al., 2007; Minak & Zucchelli, 2008). Based on that observation and taking advantage of previous experiences, the integral of the sentry function in the present study is related to the test stage at which the crack propagation became visible. The aim of this analysis is to find a novel way to predict when the crack propagation became visibly detectable (a similar analysis was previously performed considering the cumulative counts and the cumulative AE energy without any success). Implementing this idea, the integral of the sentry function was calculated between the displacement at which the AE was revealed for the first time and the displacement at which the crack progression became visible. Obviously the first crack propagation was accurately estimated by a continuous crack tip monitoring at both specimens edges.
Fig. 10. Mean values and standard deviation of the integral of the sentry function between the beginning of the AE and the first visible crack propagation (value in log-scale).
www.intechopen.com

Acoustic Emission
166
From Fig. 10 it can be seen that the value of the integral of the sentry function between the
beginning of the AE and the first visible crack propagation has a very low deviation from
the mean value for each type of specimen (the coefficient of variations was close to 13%).
These results indicate that for a specific type of interface the value of the integral of the
sentry function can be used as an alarm, indicating when the crack propagation became
visible. From the practical point of view, this way of using the Int(f) could be usefully
applied to detect, in a real size structure, when a delamination crack, under a mode I
loading, starts propagating.
Fig. 11. (A) plot of GI CUM versus Ea CUM as proposed in Ref. (Ndiaye et al., 2000); (B) plot of cumulative GI versus integration of f function, in this case the bilinear functions for each specimen type are visually characterized by means of the transition points highlighted by the circles.
www.intechopen.com

Using Acoustic Emission to Evaluate Fracture Toughness Energy Release Rate (GI) at Mode I Delamination of Composite Materials
167
A second analysis that was performed using the sentry function concerns the relationship between the integral of the sentry function itself and the strain energy release rate. This analysis is inspired by the work of (Ndiaye et al., 2000) where the cumulative of GI is related to the cumulative of the AE event energy, see Fig. 11 (A); a different approach is nevertheless proposed considering the plot of cumulative GI (GICUM) versus the integral of the sentry function, Int(f), see Fig. 11 (B).
The plots in Fig. 11 (A) do not highlight any particular trend; however, this plot has been proposed as a basis to determine the critical stain energy release rate by means of a linear fitting of the data. On the other hand, for each plot in Fig. 11 (B), a bi-linear relationship can be found between the GICUM and Int(f) where a transition point separates the two linear trends. Our idea is that using the plots in Fig. 11(B) it is possible to estimate the critical crack length and consequently the GIc and in the following some arguments are developed following this aim.
A preliminary observation from Fig. 11(B) concern the fact that the two variables, Int(f) and GICUM, exhibit a proportionality. This fact is supported by the fact that the Int(f) is related to the material damage (Minak & Zucchelli, 2008; Minak et al., 2009) and the GICUM is related to the ability of the material to yield the stored strain energy to create new cracked surfaces. So, both variables are related to the material damage and this support their proportionality: cumulating the material damage (Int(f)), the cumulated strain energy release rate (GICUM) increases as well. The slope of the fitting line indicates how fast the cumulated material damage influences the strain energy release rate variation during the test. So, considering the slope of the linear K1,i (i=3,4,5), Fig. 11(B), related to the specimens T3, T4 and T5 respectively, it can be observed that even if T5 interface type is supposed to be the toughest one, it is also more susceptible to the material damage than the other. This mean that T5 is more susceptible to the crack length extension then the other type of specimens: when and if the delamination crack is extended in the specimen, the T5 has a faster attitude to cumulate the damage and to increase the strain energy release rate than the others.
The second observation regard to the second slope of the bilinear trends shown in Fig. 11(B). In fact the analysis of the bilinear relations shown in Fig. 11(B) reveal the fact that the slope of the linear K1,i (i=3,4,5) before the transition point is always higher than the slope K2,i (i=3,4,5) after the transition point. The slope variation is due to a change of the material strength behavior respect to the delamination crack propagation. After the transition points the material exhibits reduced crack propagation strength and the slope decreases. This fact indicate that when the cumulated strain energy release rate (GICUM) increases of a small amount this cause a considerable increment in the cumulated material damage (Int(f)).
Combining the first and the second observations it is possible to note that before the transition point the linear relation between Int(f) and GICUM refers to the stable crack propagation, while after the transition point the linear relation refers to the unsteady state crack propagation. Furthermore it can be also noted that for all specimens the transition point usually occurred near the maximum load in the load-displacement plot.
It can be concluded that Int(f)-GICUM plot (Fig. 11 (B)) can distinguish the specimens with different resistance to the delamination process in mode I.
www.intechopen.com
Acoustic Emission
168
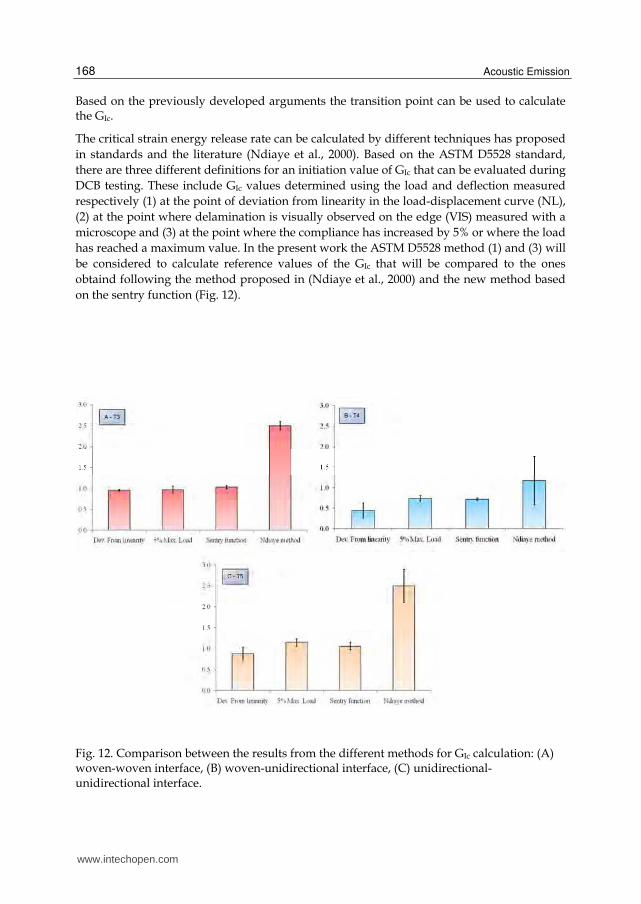
Based on the previously developed arguments the transition point can be used to calculate the GIc.
The critical strain energy release rate can be calculated by different techniques has proposed
in standards and the literature (Ndiaye et al., 2000). Based on the ASTM D5528 standard,
there are three different definitions for an initiation value of GIc that can be evaluated during
DCB testing. These include GIc values determined using the load and deflection measured
respectively (1) at the point of deviation from linearity in the load-displacement curve (NL),
(2) at the point where delamination is visually observed on the edge (VIS) measured with a
microscope and (3) at the point where the compliance has increased by 5% or where the load
has reached a maximum value. In the present work the ASTM D5528 method (1) and (3) will
be considered to calculate reference values of the GIc that will be compared to the ones
obtaind following the method proposed in (Ndiaye et al., 2000) and the new method based
on the sentry function (Fig. 12).
Fig. 12. Comparison between the results from the different methods for GIc calculation: (A) woven-woven interface, (B) woven-unidirectional interface, (C) unidirectional-unidirectional interface.
www.intechopen.com
Using Acoustic Emission to Evaluate Fracture Toughness Energy Release Rate (GI) at Mode I Delamination of Composite Materials
169
The calculated results are obtained by finding the desired points based on the applied
method. These points include propagated length of crack, displacement and the load values.
For the sentry function method, GIc is calculated by finding the knee point taking place in
the GI cumulative versus Int(f) plot. The knee point in this plot is in relation to the
propagated crack length that can be found from the load-displacement plot. With regard to
the crack length, the displacement point and load value of the critical strain energy release
rate are calculated. Comparison between the results shows that the Ndiaye method (Ndiaye
et al., 2000) has estimated GIc values about 2 or 3 times more than the ASTM D5528 results.
But GIc calculated from the sentry function method is in good agreement with the results
obtained from the ASTM D5528 method (5% max. Load). Moreover it can be also noted that
the standard deviation related to the results obtained by the new method are smaller than
the ones obtained applying the ASTM D5528 methods.
It can thus be concluded that the sentry function is another alternative method for
calculating GIc directly from acoustic emission data.
4. Conclusions
In the present study the acoustic emission technique has been used in an unconventional way to monitor and study mode I delamination behavior of different composite laminate interfaces. The study is based on a novel function that combines mechanical information, the strain energy, and the acoustical information, the acoustic emission event energy. This function, called sentry function, is used to study the mode I delamination behavior of the three considered interfaces, and in particular it was used to identify damage progression for each interface type as well as to identify the fiber bridging events. More than this, the sentry function was also used to obtain two considerable results: the first one concerns the identification of the test stage at which the delamination propagation became visible, while the second result is a new way to estimate the GIc. The proposed approach, based on the sentry function, gives values for the GIc of each composite interface that are in good agreement with the values estimated by means of the ASTM D5528 standard procedures. It can also be observed that the proposed method enables an estimation of the GIc with a lower standard deviation from the mean value if compared to the results obtained by the other procedures. The main advantage of the proposed approach with respect to those in the literature is, therefore, the simple and objective identification of the test stage at which the crack delamination length became critical, thus enabling a robust calculation of the GIc value.
5. Acknowledgements
The author is especially indebted to working groups in the engineering faculty and laboratory of Bologna University for valuable discussions of the problems to which the above results pertain.
6. References
ASTM Standard D5528. (1994). Standard Test Method for Mode I Interlaminar Fracture
Toughness of Unidirectional Fiber-Reinforced Polymer Matrix Composites.
www.intechopen.com

Acoustic Emission
170
Benmedakhene, S.; Kenane, M. & Benzeggagh, M. L. (1999). Initiation and Growth of
Delamination in Glass/Epoxy Composites Subjected to Static and Dynamic
Loading by Acoustic Emission Monitoring. Composites Science and Technology,
Vol.59, No.2, (February 1999), pp. 201-208, ISSN 0266-3538
Bohse, J. & Brunner, A. J. (2008). Acoustic Emission in Delamination Investigation, In:
Delamination Behaviour of Composites. S. Sridharan, (Ed.), 217-277, CRC Press,
ISBN 978-1-4200-7967-8, New York
Bohse, J. (2000). Acoustic Emission Characteristics of Micro-Failure Processes in Polymer
Blends and Composites. Composites Science and Technology, Vol.60, No.8, (June 2000),
pp. 1213-1226, ISSN 0266-3538
Cesari, F.; Dal Re, V.; Minak, G. & Zucchelli, A. (2007). Damage and Residual Strength of
Laminated Carbon–Epoxy Composite Circular Plates Loaded at the Centre.
Composites Part A: Applied Science and Manufacturing, Vol.38, No.4, (April 2007), pp.
1163-1173, ISSN 1359-835X
Chen, J.; Crisfield, M.; Kinloch, A. J.; Busso, E. P.; Matthews, F. L. & Qui, Y. (1999).
Predicting Progressive Delamination of Composite Material Specimens via
Interface Elements. Mechanics of Composite Materials Structures, Vol.6, No.4, (October
1999), pp. 301–317, ISSN 1075-9417
Diaz, A. D.; Caron, J. F. & Ehrlacher, A. (2007). Analytical Determination of the Modes I, II
and III Energy Release Rates in a Delaminated Laminate and Validation of a
Delamination Criterion. Composite Structures, Vol.78, No.3, (May 2007), pp. 424–432,
ISSN 0263-8223
Hug G, Thevenet, P.; Fitoussi, J. & Baptiste, D. (2006). Effect of the Loading Rate on
Mode I Interlaminar Fracture Toughness of Laminated Composites. Engineering
Fracture Mechanics, Vol.73, No.16, (November 2006), pp. 2456–2462, ISSN 0013-
7944
Huguet, S.; Godin, N.; Gaertner, R.; Salmon, L. & Villard, D. (2002). Use of Acoustic
Emission to Identify Damage Modes in Glass Fibre Reinforced Polyester. Composites
Science and Technology, Vol.62, No.10-11, (August 2002), pp. 1433–1444, ISSN 0266-
3538
Kim, B. W. & Mayer A. H. (2003). Influence of Fiber Direction and Mixed-Mode Ratio on
Delamination Fracture Toughness of Carbon/Epoxy Laminates. Composites Science
and Technology, Vol.63, No.5, (April 2003), pp. 695–713, ISSN 0266-3538
Kusaka, T.; Hojo, M; Mai, Y. W.; Kurokawa, T.; Nojima, T. & Ochiaib S. (1998). Rate
Dependence of Mode I Fracture Behaviour in Carbon-Fibre/Epoxy Composite
Laminates, Composites Science and Technology, Vol.58, No.3-4, (March-April 1998),
pp. 591-602, ISSN 0266-3538
Lorriot, T. h.; Marion, G.; Harry, R. & Wargnier, H. (2003). Onset of Free-Edge Delamination
in Composite Laminates under Tensile Loading. Composites Part B: Engineering,
Vol.34, No.5, (July 2003), pp. 459–471, ISSN 1359-8368
MIL-HDBK-17-3F, (2002). Department of Defense Handbook, Composite Materials
Handbook, Volume 3. Polymer Matrix Composites Materials Usage, Design and
Analysis, Chapter 5, Paragraph 5.4.5, ed. 17, (June 2002).
www.intechopen.com

Using Acoustic Emission to Evaluate Fracture Toughness Energy Release Rate (GI) at Mode I Delamination of Composite Materials
171
Minak, G. & Zucchelli, A. (2008). Damage Evaluation and Residual Strength Prediction of
CFRP Laminates by Means of Acoustic Emission Techniques. In: Composite
Materials Research Progress, L.P. Durand, (Ed.), 165-207, Nova Science Publishers,
ISBN 978-1-60692-496-9, New York
Minak, G.; Abrate, S.; Ghelli, D.; Panciroli, R. & Zucchelli, A. (2010). Residual Torsional
Strength after Impact of CFRP Tubes, Composites Part B: Engineering, Vol.41, No.8,
(December 2010), pp. 637-645, ISSN 1359-8368
Minak, G.; Morelli, P. & Zucchelli, A. (2009). Fatigue Residual Strength of Circular
Laminate Graphite–Epoxy Composite Plates Damaged by Transverse Load,
Composites Science and Technology, Vol.69, No.9, (July 2009), pp. 1358-1363, ISSN
0266-3538
Ndiaye, I; Maslouhi, A. & Denault, J. (2000). Characterization of Interfacial Properties of
Composite Materials by Acoustic Emission. Polymer Composites, Vol.21, No.4,
(August 2000), pp. 595-604, ISSN 0272-8397
Niebergall, U.; Bohse, J.; Seidler, S.; Grellmann, W. & Schürmann, B. L. (1999). Relationship
of Fracture Behavior and Morphology in Polyolefin Blends. Polymer Engineering &
Science, Vol.39, No.6, (June 1999), pp. 1109-1118, ISSN 1548-2634
Pagano, N. J. & Schoeppner, G. A. (2000). Delamination of Polymer Matrix Composites:
Problems and Assessment. In: Comprehensive Composite Materials. A. Kelly, C.
Zweben, (Ed.), 433-528, Elsevier Science, ISBN 0080437206, Amesterdam
Perrin, F.; Bureau, M. N.; Denault, J. & Dickson, J. I. (2003). Mode I interlaminar Crack
Propagation in Continuous Glass Fiber/Polypropylene Composites: Temperature
and Molding Condition Dependence. Composites Science and Technology, Vol. 63
No.5, (April 2003), pp. 597-607, ISSN 0266-3538
R’Mili, M.; Moevus, M. & Godin, N. (2008). Statistical Fracture of E-Glass Fibres Using a
Bundle Tensile Test and Acoustic Emission Monitoring. Composites Science and
Technology, Vol.68, No.7-8, (June 2008), pp. 1800-1808, ISSN 0266-3538
Refahi Oskouei, A. & Ahmadi, M. (2010). Acoustic Emission Characteristics of Mode I
Delamination in Glass/Polyester Composites. Composite Materials, Vol.44, No.7,
(April 2010), pp. 793-807, ISSN 0021-9983
Sjogren, A. & Asp, L. E. (2002). Effects of Temperature on Delamination Growth in a
Carbon/Epoxy Composite under Fatigue Loading. International Journal of Fatigue,
Vol.24, No.2-4, (February-April 2002), pp. 179–184, ISSN 0142-1123
Solaimurugan, S. & Velmurugan, R. (2008). Influence of In-Plane Fibre Orientation on Mode
I Interlaminar Fracture Toughness of Stitched Glass/Polyester Composites.
Composites Science and Technology, Vol.68, No.7-8, (June 2008), pp. 1742–1752, ISSN
0266-3538
Tsai, G. C. & Chen, J. W. (2005). Effect of Stitching on Mode I Strain Energy Release Rate.
Composite Structures, Vol.69, No.1, (June 2005), pp. 1–9, ISSN 0263-8223
Velmurugan, R. & Solaimurugan, S. (2007). Improvements in Mode I Interlaminar Fracture
Toughness and In-Plane Mechanical Properties of Stitched Glass/Polyester
Composites. Composites Science and Technology, Vol. 67, No.1, (January 2007), pp. 61-
69. ISSN 0266-3538
www.intechopen.com

Acoustic Emission
172
Wu, X. F. & Dzenis, Y. A. (2005). Experimental Determination of Probabilistic Edge-
Delamination Strength of a Graphite–Fiber/Epoxy Composite. Composite Structures,
Vol.70, No.1, (August 2005), pp. 100–108, ISSN 0263-8223
www.intechopen.com
Acoustic EmissionEdited by Dr. Wojciech Sikorski
ISBN 978-953-51-0056-0Hard cover, 398 pagesPublisher InTechPublished online 02, March, 2012Published in print edition March, 2012
InTech EuropeUniversity Campus STeP Ri Slavka Krautzeka 83/A 51000 Rijeka, Croatia Phone: +385 (51) 770 447 Fax: +385 (51) 686 166www.intechopen.com
InTech ChinaUnit 405, Office Block, Hotel Equatorial Shanghai No.65, Yan An Road (West), Shanghai, 200040, China
Phone: +86-21-62489820 Fax: +86-21-62489821
Acoustic emission (AE) is one of the most important non-destructive testing (NDT) methods for materials,constructions and machines. Acoustic emission is defined as the transient elastic energy that is spontaneouslyreleased when materials undergo deformation, fracture, or both. This interdisciplinary book consists of 17chapters, which widely discuss the most important applications of AE method as machinery and civil structurescondition assessment, fatigue and fracture materials research, detection of material defects and deformations,diagnostics of cutting tools and machine cutting process, monitoring of stress and ageing in materials,research, chemical reactions and phase transitions research, and earthquake prediction.
How to referenceIn order to correctly reference this scholarly work, feel free to copy and paste the following:
Amir Refahi Oskouei, Andrea Zucchelli, Mehdi Ahmadi and Giangiacomo Minak (2012). Using AcousticEmission to Evaluate Fracture Toughness Energy Release Rate (GI) at Mode I Delamination of CompositeMaterials, Acoustic Emission, Dr. Wojciech Sikorski (Ed.), ISBN: 978-953-51-0056-0, InTech, Available from:http://www.intechopen.com/books/acoustic-emission/using-acoustic-emission-to-evaluate-fracture-toughness-energy-release-rate-gi-at-mode-i-delamination

© 2012 The Author(s). Licensee IntechOpen. This is an open access articledistributed under the terms of the Creative Commons Attribution 3.0License, which permits unrestricted use, distribution, and reproduction inany medium, provided the original work is properly cited.