using appdynamics with loadrunner€¦ · while some of this discussion centers on loadrunner...
TRANSCRIPT
appdynamics.com
WHITE PAPER
Using AppDynamics with LoadRunner
Exec summary
While it may seem at first look that AppDynamics is oriented towards IT Operations and DevOps, a number of our users have been using AppDynamics for years within performance engineering practices. They realize many of the same benefits as their peers in the IT Ops and DevOps practices. The key is to being proactive in avoiding performance issues prior to going live in production. The following benefits are typically associated with integration of AppDynamics with load testing technologies:
– Gaining deep application-level visibility to answer the ‘Why?’ vs. simply determining ‘What?’
– Rapidly pinpointing bottlenecks in their environment
– Comparing results across releases and performance tests
– Improving performance by measuring the end-to-end performance from the end-user perspective
– Increasing scalability of the application by optimizing software and avoiding unnecessary hardware investments
While some of this discussion centers on LoadRunner specifically, it is important to note that these use-cases may be applied using any load testing solution and methodology, not just LoadRunner.
LoadRunner transaction integration
The simplest and fastest way to get LoadRunner transactions in AppDynamics is ‘painting’ your LoadRunner requests. This method involves adding a custom header that contains the LR transaction name in the request so that AppDynamics can display the transactions exactly as they appear in LoadRunner. Adding a custom header in LoadRunner is a simple process using LoadRunner’s built in capability to set headers, including custom headers. The end-result gives you the same visibility as you have in LoadRunner, but with the following added benefits:
– Deep code-level visibility, in the context of a LoadRunner Transaction, end-to-end
– Application container-level data such as Heap size and usage along with standard and custom JMX metrics
– Deep database visibility, in the context of the transaction, including details SQL breakdowns
– Extended visibility into application infrastructure (CPU, Disk, Network, and Memory).
AppDynamics provides these benefits automatically without the need to configure multiple HP tools, such as HP SiteScope, and then configuring LoadRunner to pull these metrics from HP SiteScope.
It is a simple two-step process to gain this visibility:
1. A minor modification to your VUGen scripts to set the header, using the web_add_header() function.
2. A minor configuration tweak in AppDynamics to detect this new header and name transactions accordingly.
In addition, the AppDynamics integrations team is working on a utility that will help make these changes in the VUGen script automatically (as of October 2015).
appdynamics.com 2
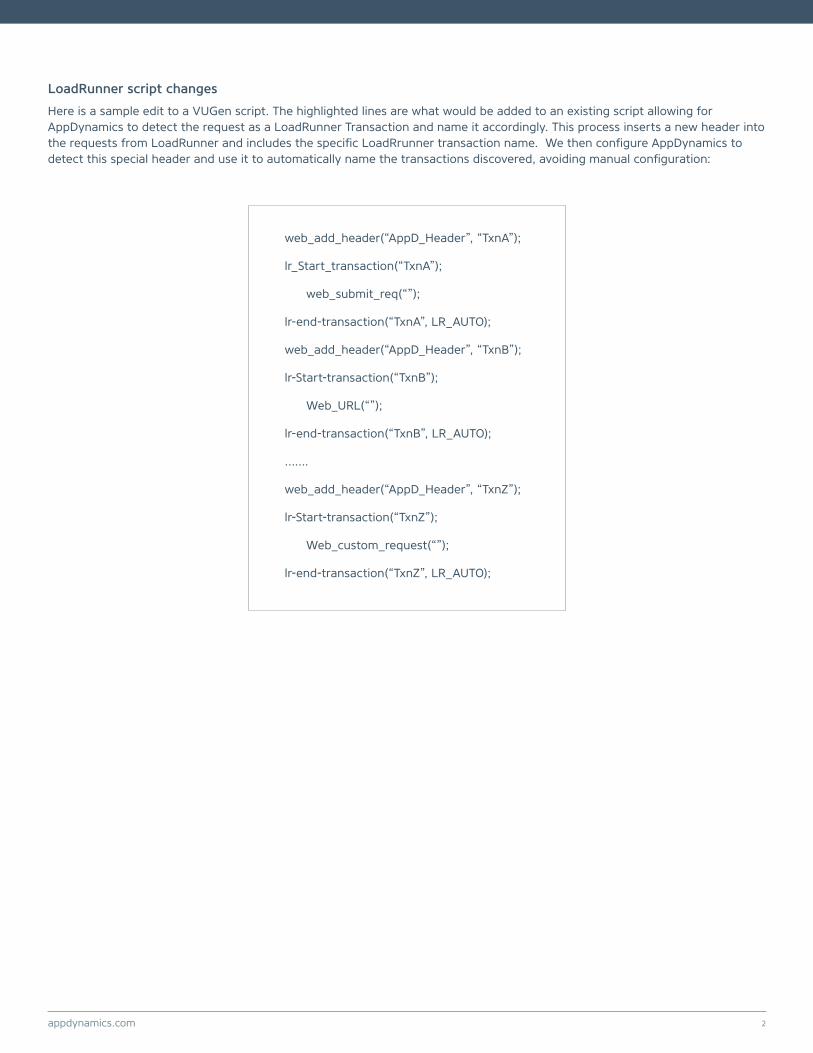
LoadRunner script changes
Here is a sample edit to a VUGen script. The highlighted lines are what would be added to an existing script allowing for AppDynamics to detect the request as a LoadRunner Transaction and name it accordingly. This process inserts a new header into the requests from LoadRunner and includes the specific LoadRrunner transaction name. We then configure AppDynamics to detect this special header and use it to automatically name the transactions discovered, avoiding manual configuration:
web_add_header(“AppD_Header”, “TxnA”);
lr_Start_transaction(“TxnA”);
web_submit_req(“”);
lr-end-transaction(“TxnA”, LR_AUTO);
web_add_header(“AppD_Header”, “TxnB”);
lr-Start-transaction(“TxnB”);
Web_URL(“”);
lr-end-transaction(“TxnB”, LR_AUTO);
…….
web_add_header(“AppD_Header”, “TxnZ”);
lr-Start-transaction(“TxnZ”);
Web_custom_request(“”);
lr-end-transaction(“TxnZ”, LR_AUTO);
appdynamics.com 3
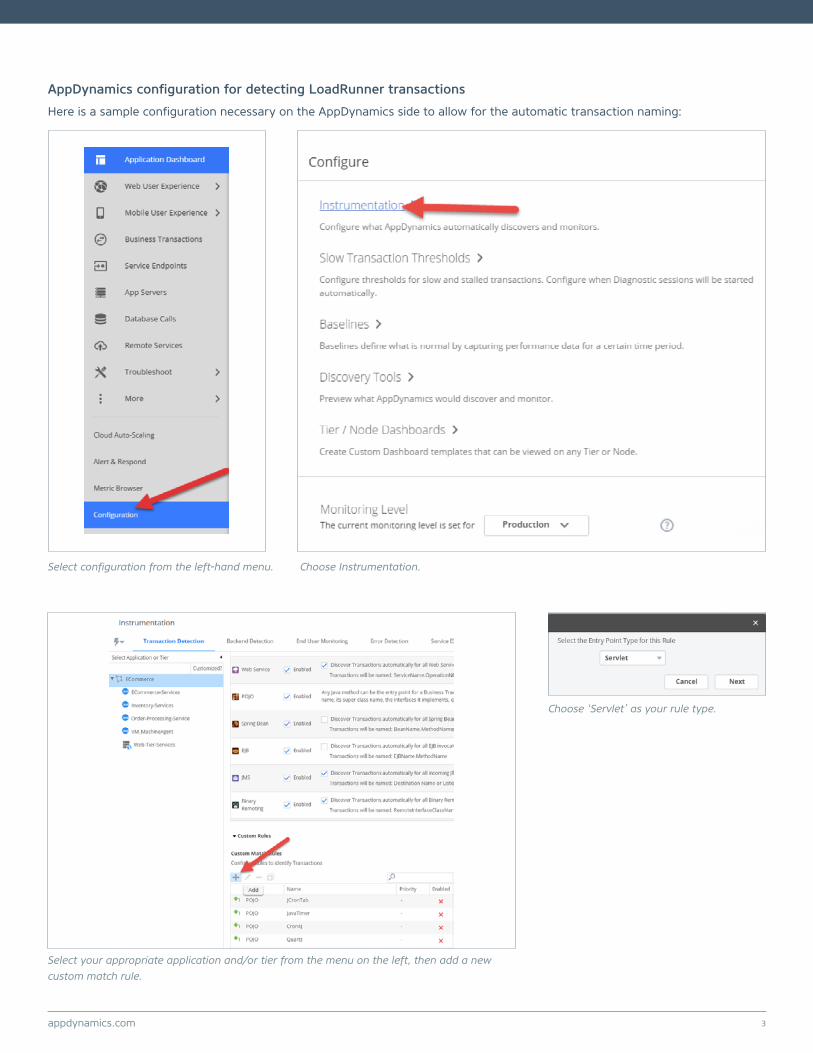
AppDynamics configuration for detecting LoadRunner transactions
Here is a sample configuration necessary on the AppDynamics side to allow for the automatic transaction naming:
Select configuration from the left-hand menu. Choose Instrumentation.
Select your appropriate application and/or tier from the menu on the left, then add a new custom match rule.
Choose ‘Servlet’ as your rule type.
appdynamics.com 4
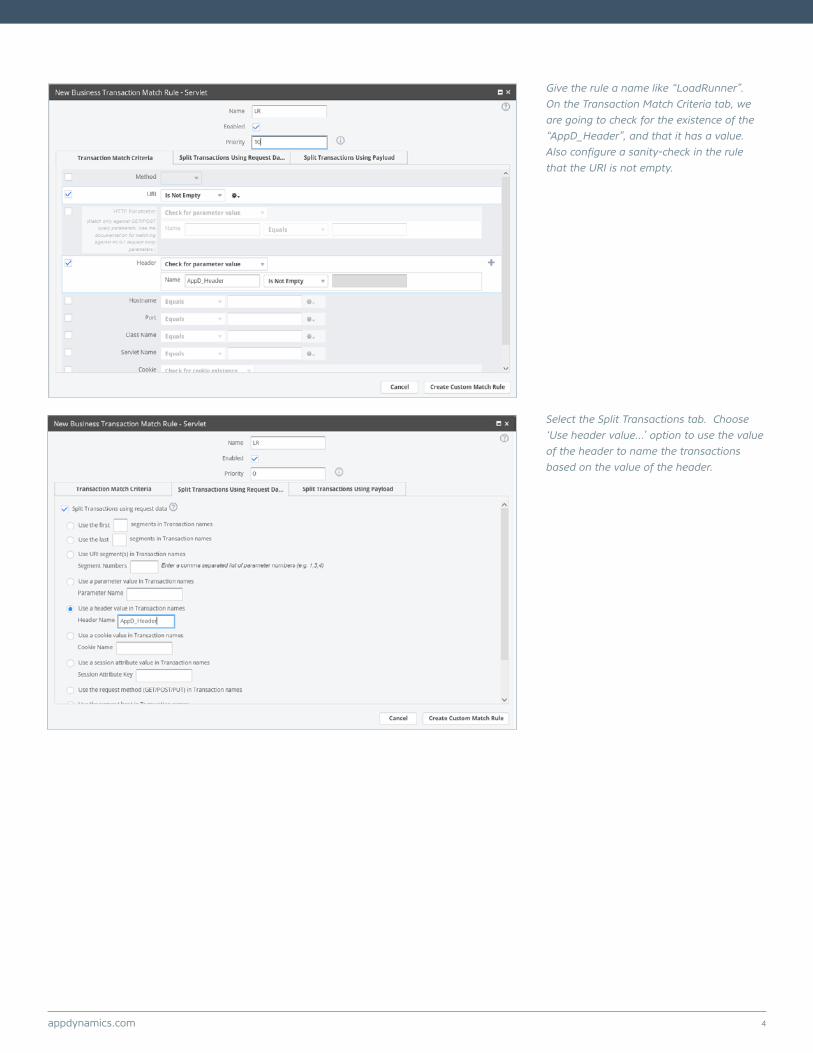
Give the rule a name like “LoadRunner”. On the Transaction Match Criteria tab, we are going to check for the existence of the “AppD_Header”, and that it has a value. Also configure a sanity-check in the rule that the URI is not empty.
Select the Split Transactions tab. Choose ‘Use header value…’ option to use the value of the header to name the transactions based on the value of the header.
appdynamics.com 5
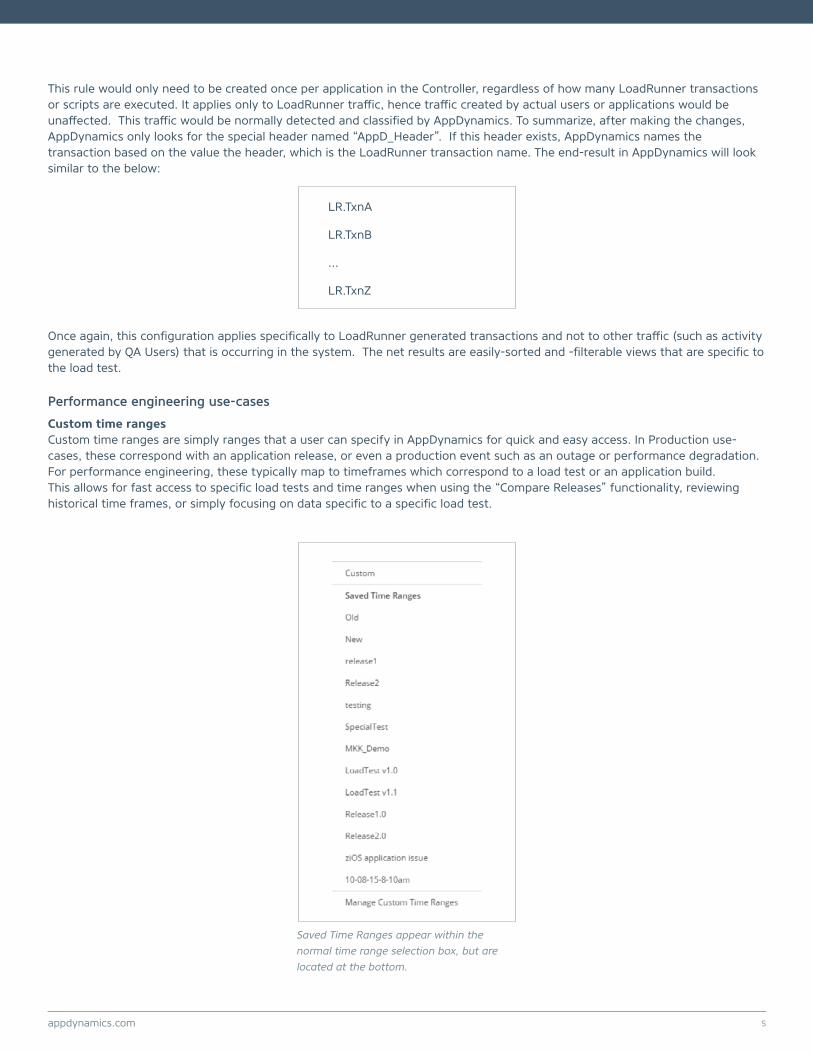
This rule would only need to be created once per application in the Controller, regardless of how many LoadRunner transactions or scripts are executed. It applies only to LoadRunner traffic, hence traffic created by actual users or applications would be unaffected. This traffic would be normally detected and classified by AppDynamics. To summarize, after making the changes, AppDynamics only looks for the special header named “AppD_Header”. If this header exists, AppDynamics names the transaction based on the value the header, which is the LoadRunner transaction name. The end-result in AppDynamics will look similar to the below:
Once again, this configuration applies specifically to LoadRunner generated transactions and not to other traffic (such as activity generated by QA Users) that is occurring in the system. The net results are easily-sorted and -filterable views that are specific to the load test.
Performance engineering use-cases
Custom time ranges Custom time ranges are simply ranges that a user can specify in AppDynamics for quick and easy access. In Production use-cases, these correspond with an application release, or even a production event such as an outage or performance degradation. For performance engineering, these typically map to timeframes which correspond to a load test or an application build. This allows for fast access to specific load tests and time ranges when using the “Compare Releases” functionality, reviewing historical time frames, or simply focusing on data specific to a specific load test.
Saved Time Ranges appear within the normal time range selection box, but are located at the bottom.
LR.TxnA
LR.TxnB
…
LR.TxnZ
appdynamics.com 6
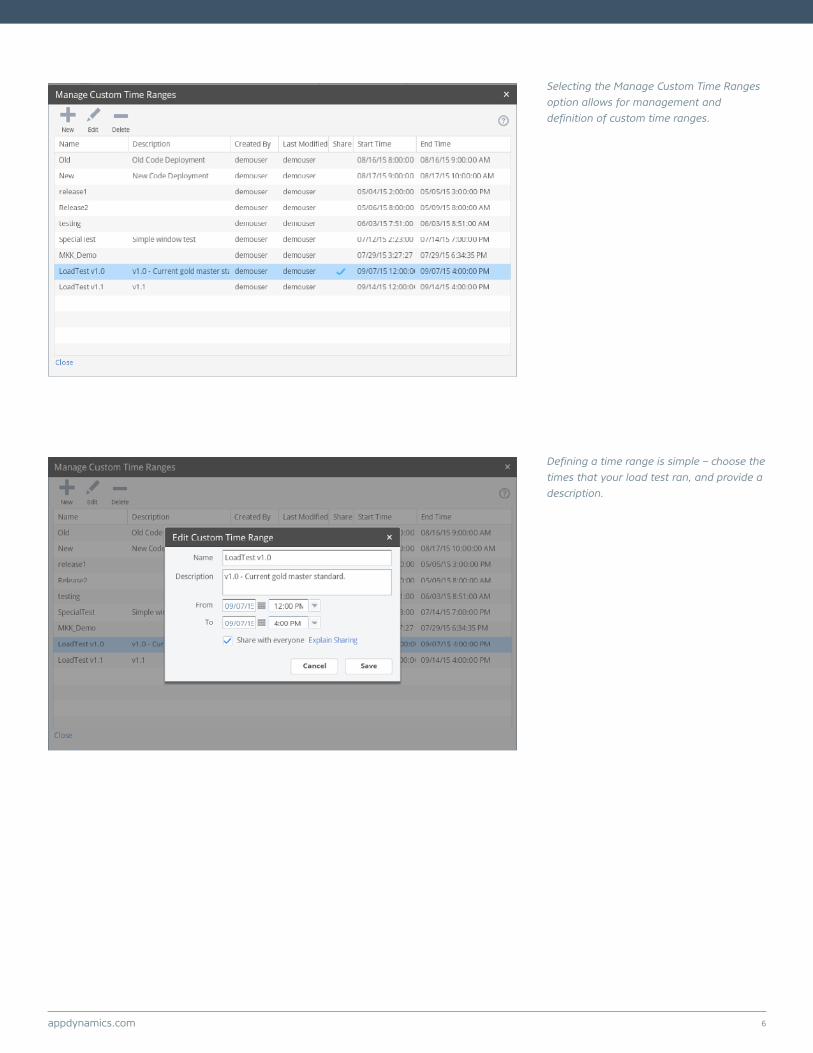
Selecting the Manage Custom Time Ranges option allows for management and definition of custom time ranges.
Defining a time range is simple – choose the times that your load test ran, and provide a description.
appdynamics.com 7
Compare releases
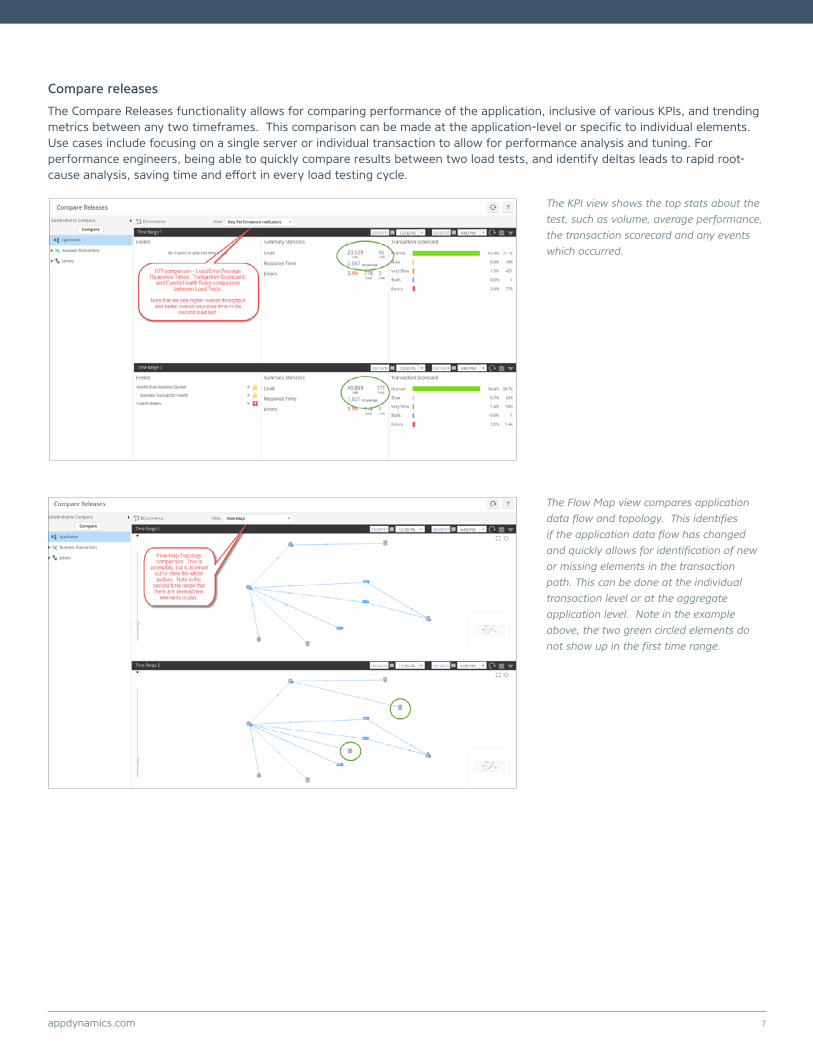
The Compare Releases functionality allows for comparing performance of the application, inclusive of various KPIs, and trending metrics between any two timeframes. This comparison can be made at the application-level or specific to individual elements. Use cases include focusing on a single server or individual transaction to allow for performance analysis and tuning. For performance engineers, being able to quickly compare results between two load tests, and identify deltas leads to rapid root-cause analysis, saving time and effort in every load testing cycle.
The KPI view shows the top stats about the test, such as volume, average performance, the transaction scorecard and any events which occurred.
The Flow Map view compares application data flow and topology. This identifies if the application data flow has changed and quickly allows for identification of new or missing elements in the transaction path. This can be done at the individual transaction level or at the aggregate application level. Note in the example above, the two green circled elements do not show up in the first time range.
appdynamics.com 8
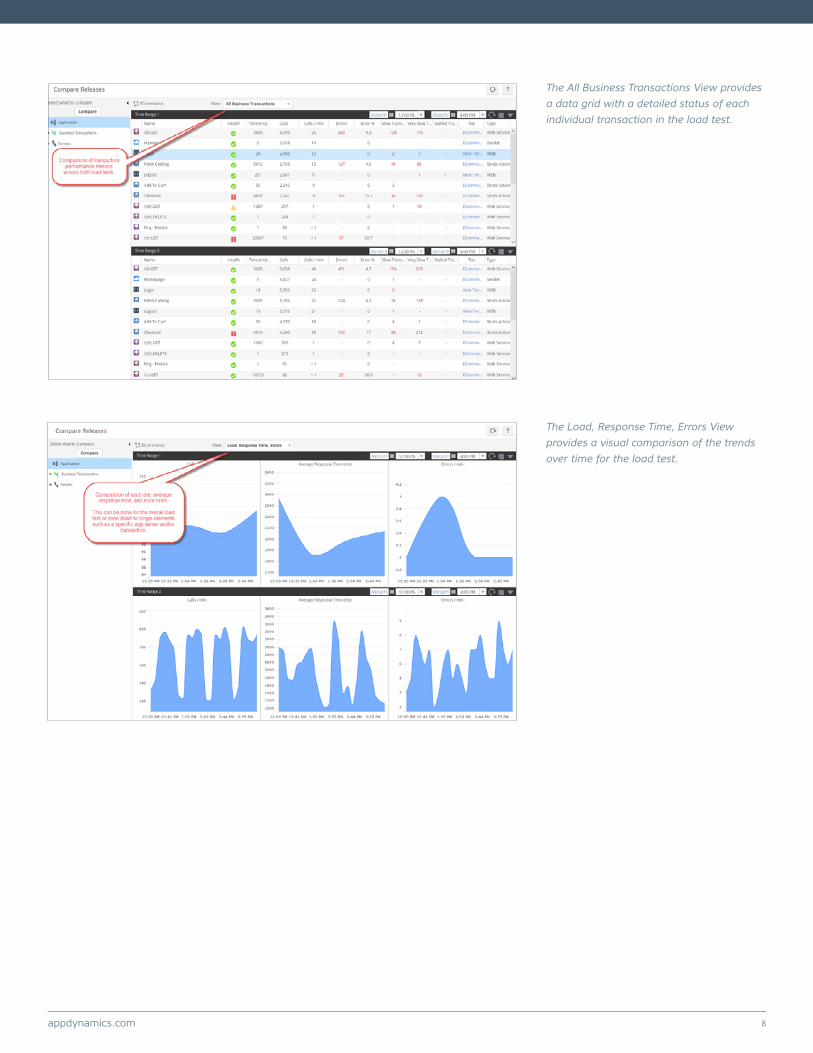
The All Business Transactions View provides a data grid with a detailed status of each individual transaction in the load test.
The Load, Response Time, Errors View provides a visual comparison of the trends over time for the load test.
appdynamics.com 9
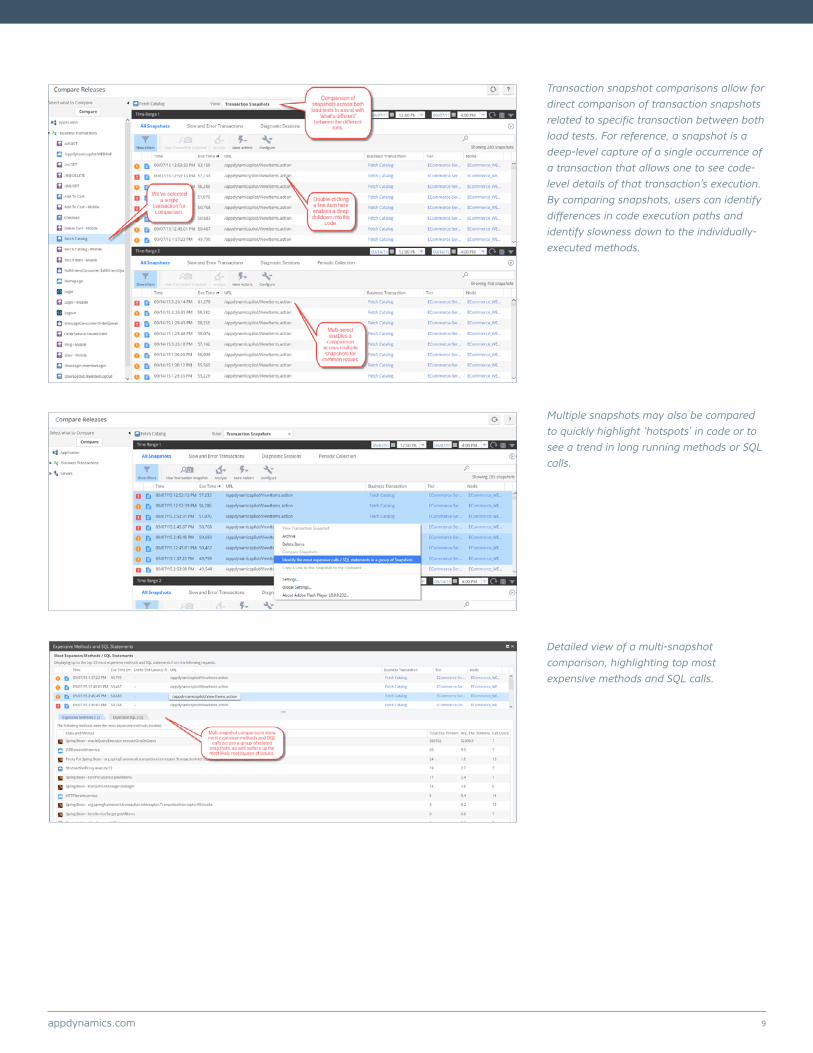
Transaction snapshot comparisons allow for direct comparison of transaction snapshots related to specific transaction between both load tests. For reference, a snapshot is a deep-level capture of a single occurrence of a transaction that allows one to see code-level details of that transaction’s execution. By comparing snapshots, users can identify differences in code execution paths and identify slowness down to the individually-executed methods.
Multiple snapshots may also be compared to quickly highlight ‘hotspots’ in code or to see a trend in long running methods or SQL calls.
Detailed view of a multi-snapshot comparison, highlighting top most expensive methods and SQL calls.
appdynamics.com 10
Database visibility
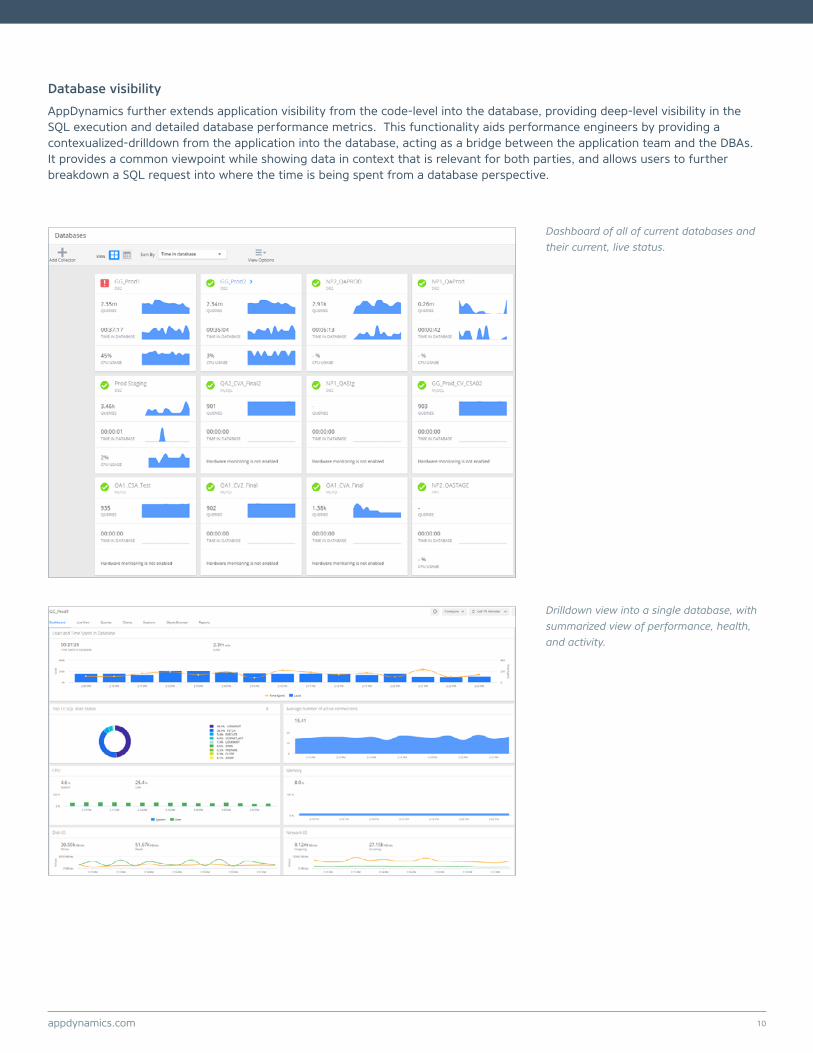
AppDynamics further extends application visibility from the code-level into the database, providing deep-level visibility in the SQL execution and detailed database performance metrics. This functionality aids performance engineers by providing a contexualized-drilldown from the application into the database, acting as a bridge between the application team and the DBAs. It provides a common viewpoint while showing data in context that is relevant for both parties, and allows users to further breakdown a SQL request into where the time is being spent from a database perspective.
Dashboard of all of current databases and their current, live status.
Drilldown view into a single database, with summarized view of performance, health, and activity.
appdynamics.com 11
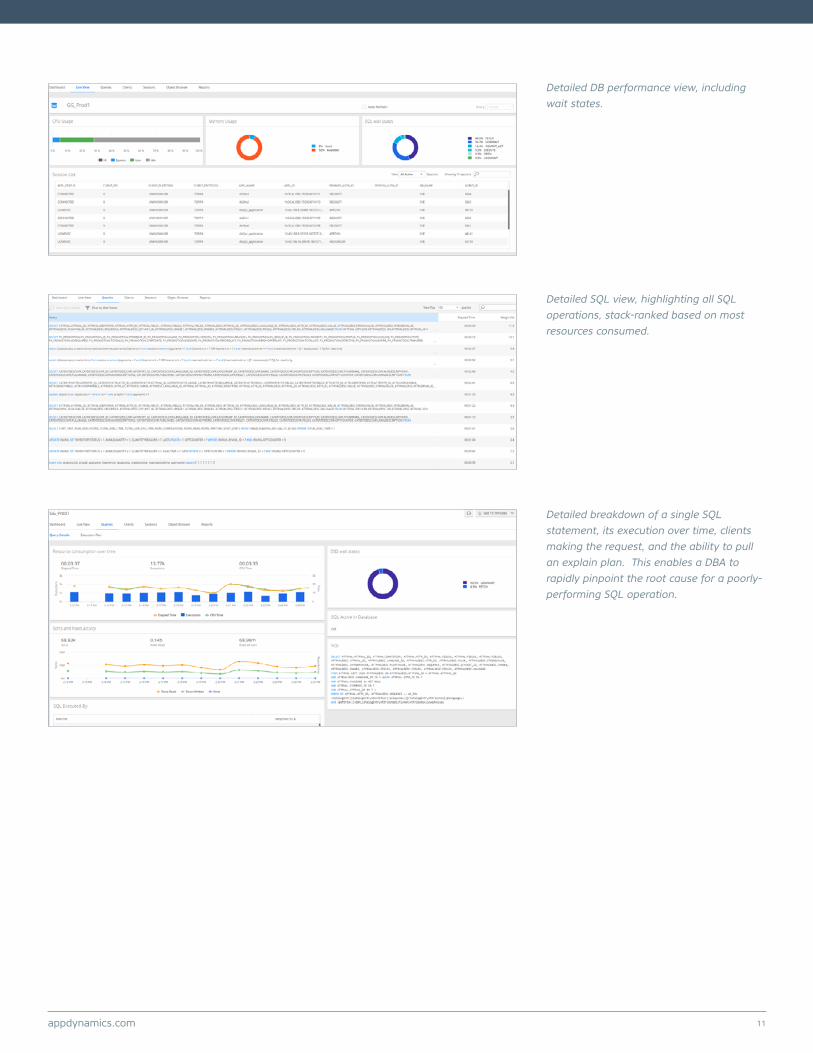
Detailed DB performance view, including wait states.
Detailed SQL view, highlighting all SQL operations, stack-ranked based on most resources consumed.
Detailed breakdown of a single SQL statement, its execution over time, clients making the request, and the ability to pull an explain plan. This enables a DBA to rapidly pinpoint the root cause for a poorly-performing SQL operation.
appdynamics.com 12
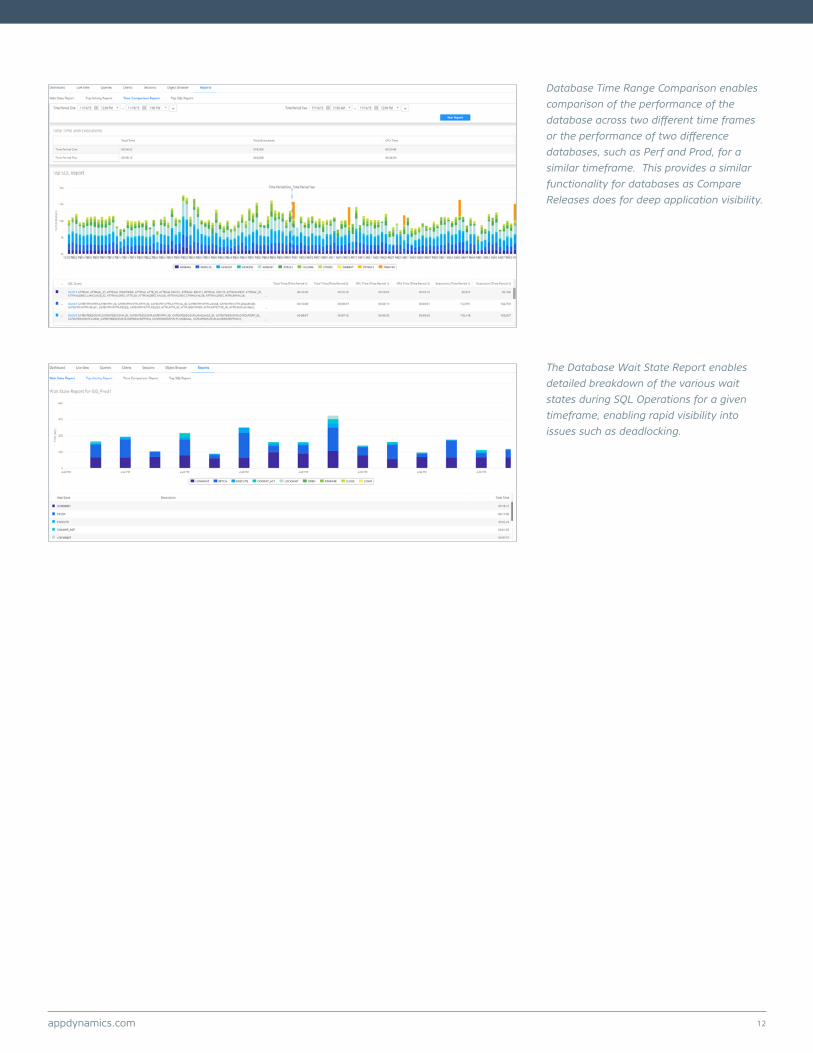
Database Time Range Comparison enables comparison of the performance of the database across two different time frames or the performance of two difference databases, such as Perf and Prod, for a similar timeframe. This provides a similar functionality for databases as Compare Releases does for deep application visibility.
The Database Wait State Report enables detailed breakdown of the various wait states during SQL Operations for a given timeframe, enabling rapid visibility into issues such as deadlocking.
appdynamics.com 13
Scalability and correlation analysis
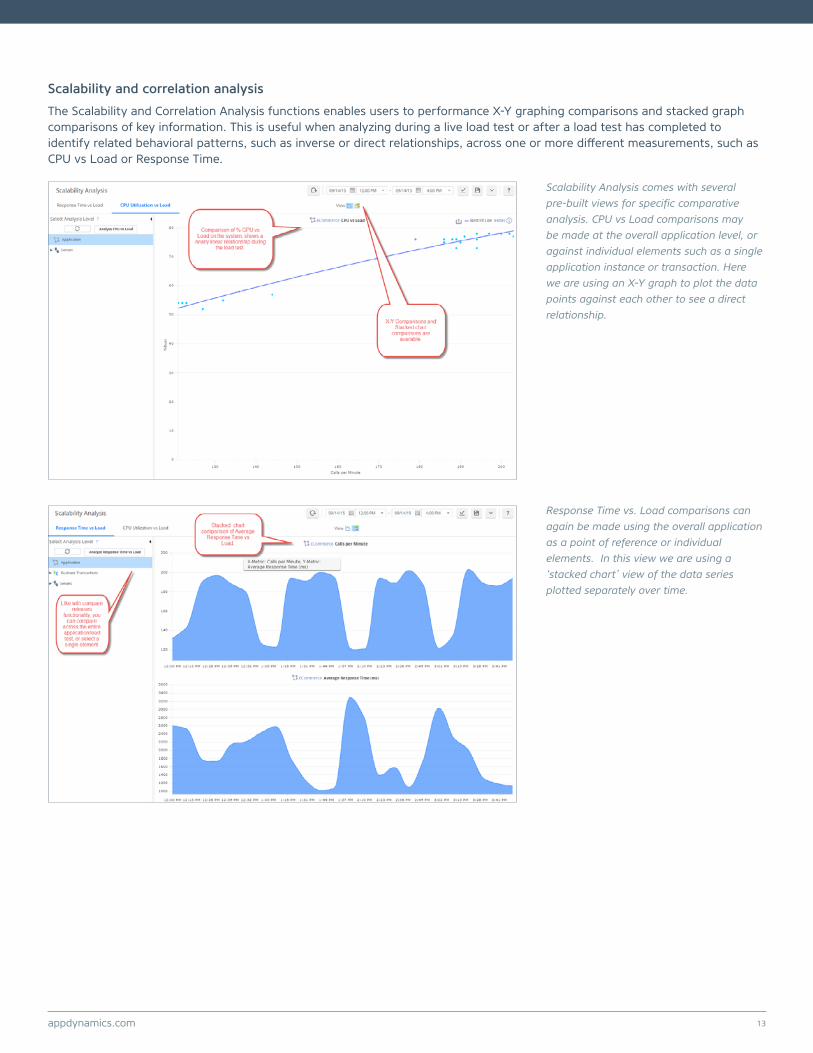
The Scalability and Correlation Analysis functions enables users to performance X-Y graphing comparisons and stacked graph comparisons of key information. This is useful when analyzing during a live load test or after a load test has completed to identify related behavioral patterns, such as inverse or direct relationships, across one or more different measurements, such as CPU vs Load or Response Time.
Scalability Analysis comes with several pre-built views for specific comparative analysis. CPU vs Load comparisons may be made at the overall application level, or against individual elements such as a single application instance or transaction. Here we are using an X-Y graph to plot the data points against each other to see a direct relationship.
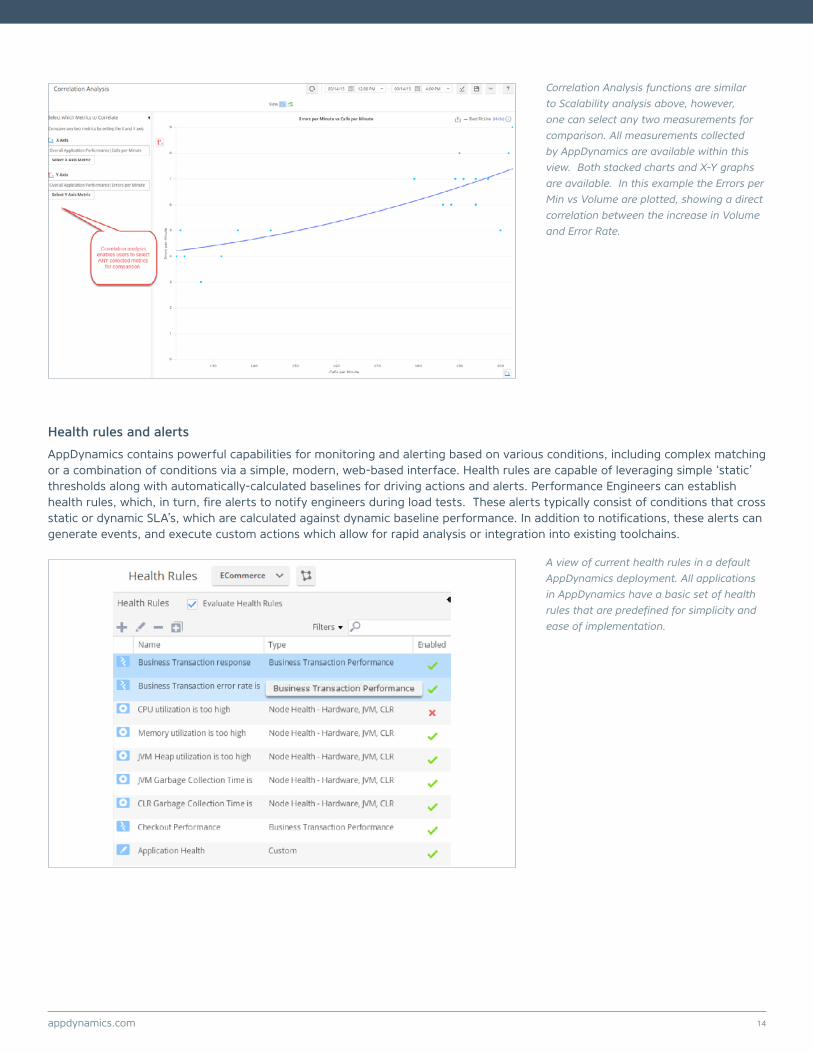
Response Time vs. Load comparisons can again be made using the overall application as a point of reference or individual elements. In this view we are using a ‘stacked chart’ view of the data series plotted separately over time.
appdynamics.com 14
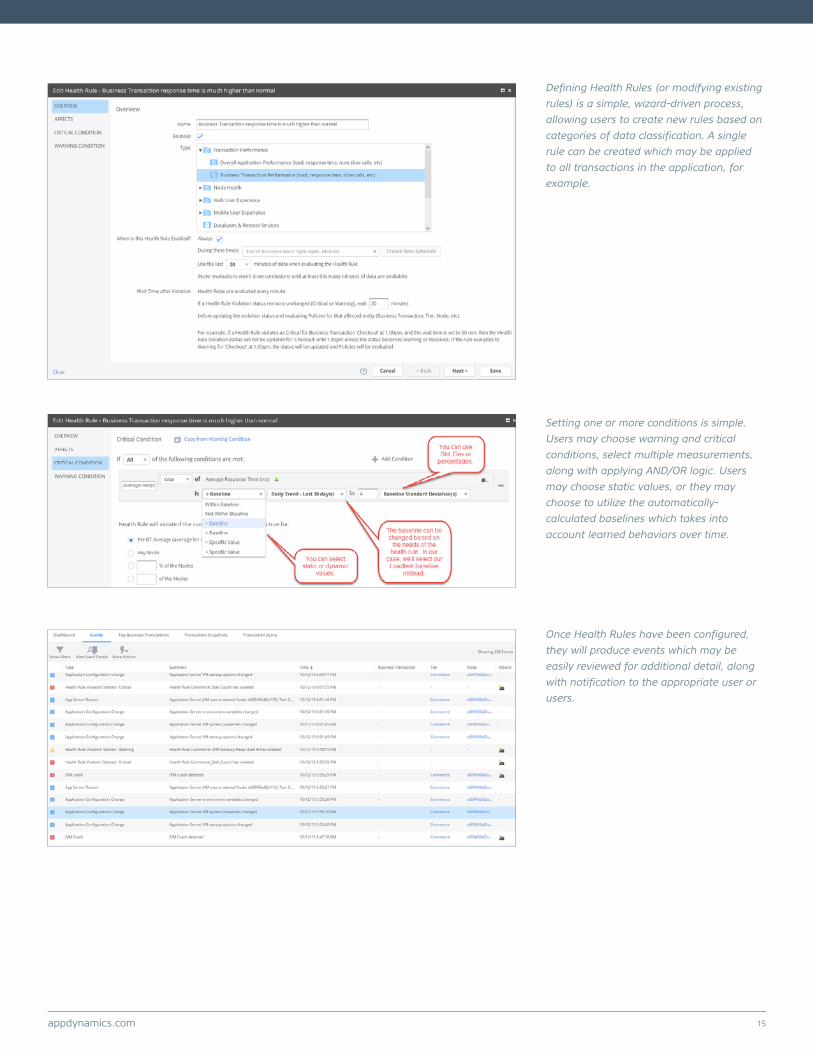
Correlation Analysis functions are similar to Scalability analysis above, however, one can select any two measurements for comparison. All measurements collected by AppDynamics are available within this view. Both stacked charts and X-Y graphs are available. In this example the Errors per Min vs Volume are plotted, showing a direct correlation between the increase in Volume and Error Rate.
Health rules and alerts
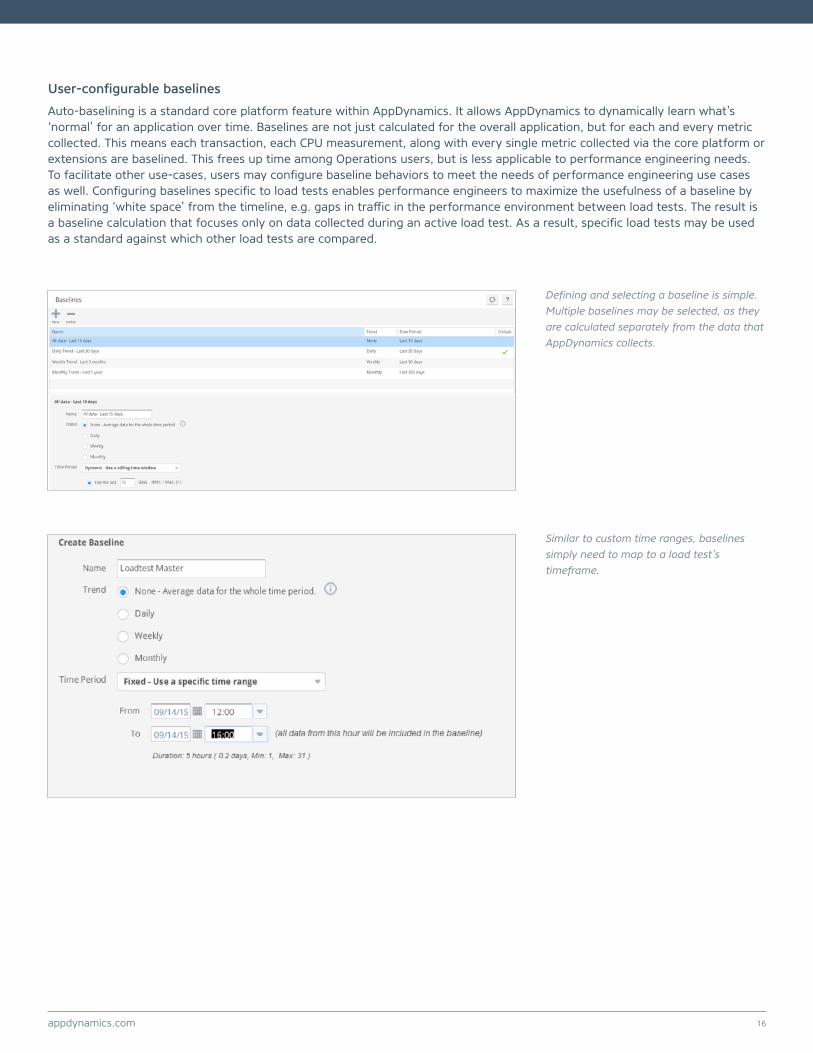
AppDynamics contains powerful capabilities for monitoring and alerting based on various conditions, including complex matching or a combination of conditions via a simple, modern, web-based interface. Health rules are capable of leveraging simple ‘static’ thresholds along with automatically-calculated baselines for driving actions and alerts. Performance Engineers can establish health rules, which, in turn, fire alerts to notify engineers during load tests. These alerts typically consist of conditions that cross static or dynamic SLA’s, which are calculated against dynamic baseline performance. In addition to notifications, these alerts can generate events, and execute custom actions which allow for rapid analysis or integration into existing toolchains.
A view of current health rules in a default AppDynamics deployment. All applications in AppDynamics have a basic set of health rules that are predefined for simplicity and ease of implementation.
appdynamics.com 15
Defining Health Rules (or modifying existing rules) is a simple, wizard-driven process, allowing users to create new rules based on categories of data classification. A single rule can be created which may be applied to all transactions in the application, for example.
Setting one or more conditions is simple. Users may choose warning and critical conditions, select multiple measurements, along with applying AND/OR logic. Users may choose static values, or they may choose to utilize the automatically-calculated baselines which takes into account learned behaviors over time.
Once Health Rules have been configured, they will produce events which may be easily reviewed for additional detail, along with notification to the appropriate user or users.
appdynamics.com 16
User-configurable baselines
Auto-baselining is a standard core platform feature within AppDynamics. It allows AppDynamics to dynamically learn what’s ‘normal’ for an application over time. Baselines are not just calculated for the overall application, but for each and every metric collected. This means each transaction, each CPU measurement, along with every single metric collected via the core platform or extensions are baselined. This frees up time among Operations users, but is less applicable to performance engineering needs. To facilitate other use-cases, users may configure baseline behaviors to meet the needs of performance engineering use cases as well. Configuring baselines specific to load tests enables performance engineers to maximize the usefulness of a baseline by eliminating ‘white space’ from the timeline, e.g. gaps in traffic in the performance environment between load tests. The result is a baseline calculation that focuses only on data collected during an active load test. As a result, specific load tests may be used as a standard against which other load tests are compared.
Defining and selecting a baseline is simple. Multiple baselines may be selected, as they are calculated separately from the data that AppDynamics collects.
Similar to custom time ranges, baselines simply need to map to a load test’s timeframe.
appdynamics.com 17
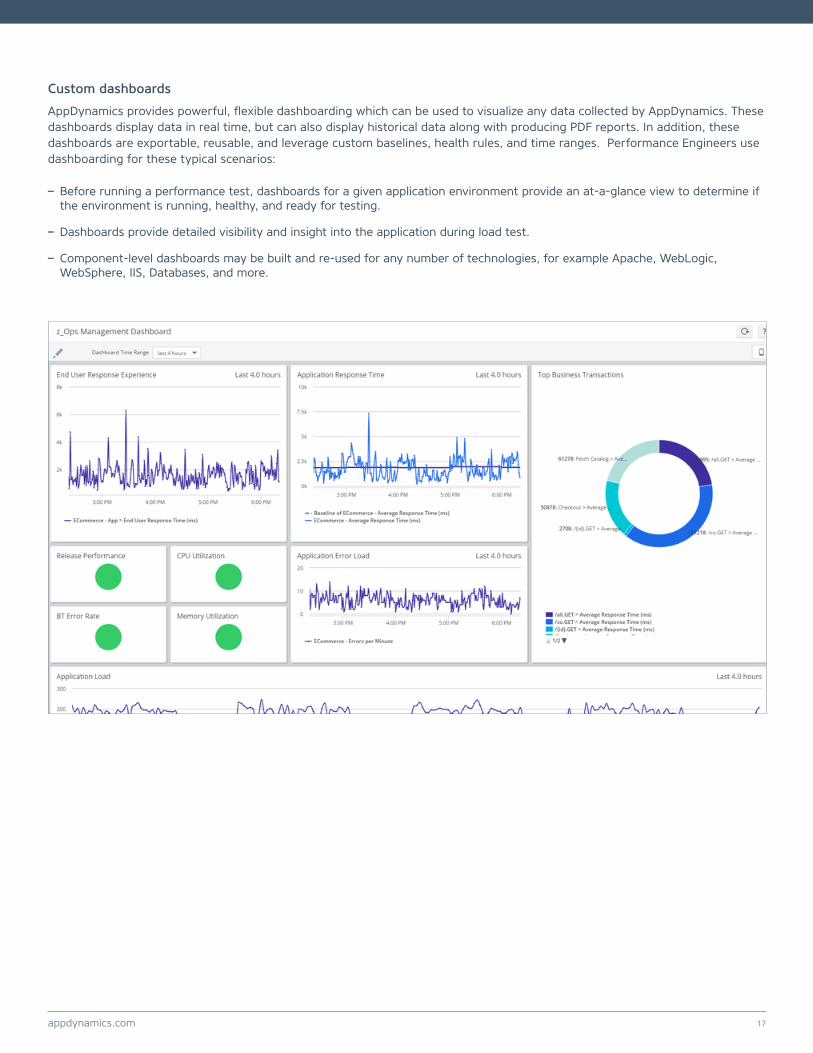
Custom dashboards
AppDynamics provides powerful, flexible dashboarding which can be used to visualize any data collected by AppDynamics. These dashboards display data in real time, but can also display historical data along with producing PDF reports. In addition, these dashboards are exportable, reusable, and leverage custom baselines, health rules, and time ranges. Performance Engineers use dashboarding for these typical scenarios:
– Before running a performance test, dashboards for a given application environment provide an at-a-glance view to determine if the environment is running, healthy, and ready for testing.
– Dashboards provide detailed visibility and insight into the application during load test.
– Component-level dashboards may be built and re-used for any number of technologies, for example Apache, WebLogic, WebSphere, IIS, Databases, and more.
appdynamics.com 18
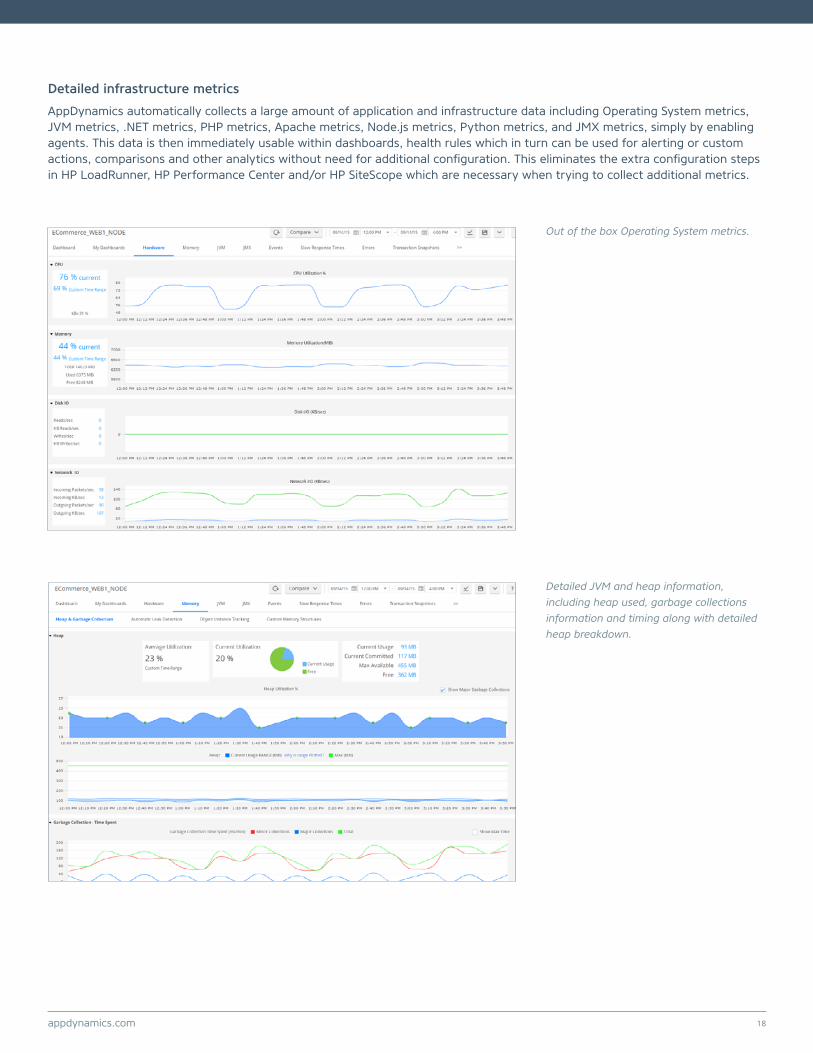
Detailed infrastructure metrics
AppDynamics automatically collects a large amount of application and infrastructure data including Operating System metrics, JVM metrics, .NET metrics, PHP metrics, Apache metrics, Node.js metrics, Python metrics, and JMX metrics, simply by enabling agents. This data is then immediately usable within dashboards, health rules which in turn can be used for alerting or custom actions, comparisons and other analytics without need for additional configuration. This eliminates the extra configuration steps in HP LoadRunner, HP Performance Center and/or HP SiteScope which are necessary when trying to collect additional metrics.
Out of the box Operating System metrics.
Detailed JVM and heap information, including heap used, garbage collections information and timing along with detailed heap breakdown.
appdynamics.com 19
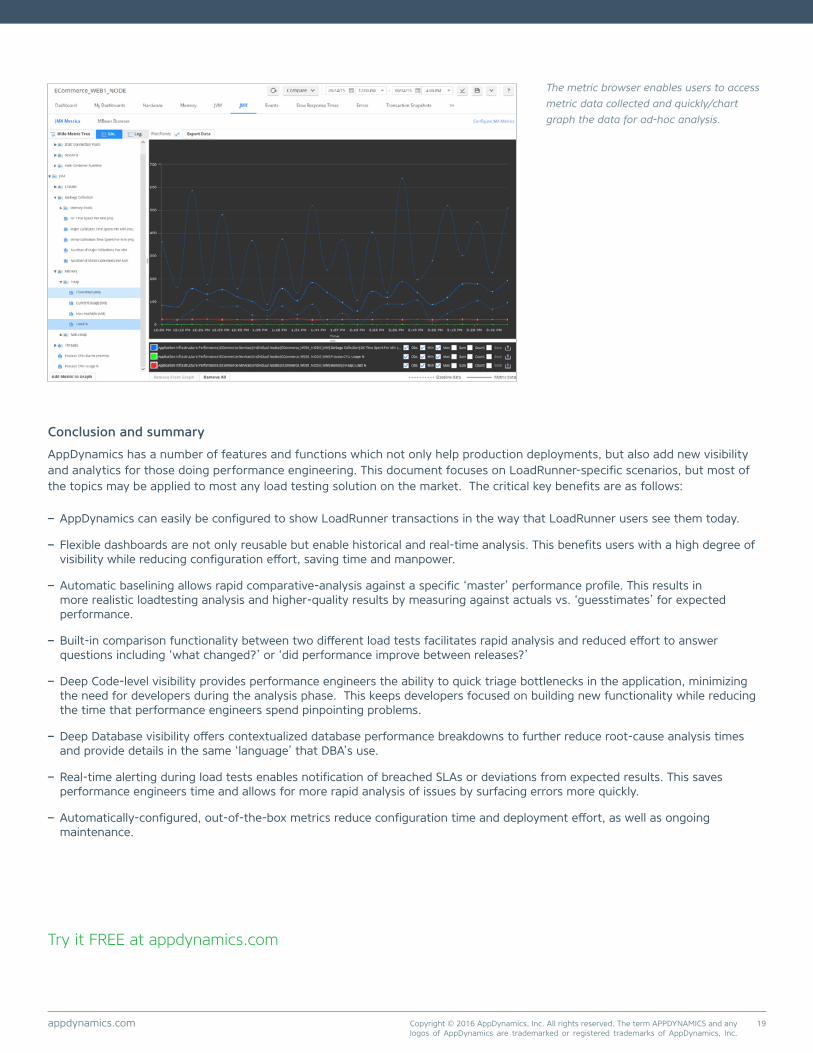
The metric browser enables users to access metric data collected and quickly/chart graph the data for ad-hoc analysis.
Conclusion and summary
AppDynamics has a number of features and functions which not only help production deployments, but also add new visibility and analytics for those doing performance engineering. This document focuses on LoadRunner-specific scenarios, but most of the topics may be applied to most any load testing solution on the market. The critical key benefits are as follows:
– AppDynamics can easily be configured to show LoadRunner transactions in the way that LoadRunner users see them today.
– Flexible dashboards are not only reusable but enable historical and real-time analysis. This benefits users with a high degree of visibility while reducing configuration effort, saving time and manpower.
– Automatic baselining allows rapid comparative-analysis against a specific ‘master’ performance profile. This results in more realistic loadtesting analysis and higher-quality results by measuring against actuals vs. ‘guesstimates’ for expected performance.
– Built-in comparison functionality between two different load tests facilitates rapid analysis and reduced effort to answer questions including ‘what changed?’ or ‘did performance improve between releases?’
– Deep Code-level visibility provides performance engineers the ability to quick triage bottlenecks in the application, minimizing the need for developers during the analysis phase. This keeps developers focused on building new functionality while reducing the time that performance engineers spend pinpointing problems.
– Deep Database visibility offers contextualized database performance breakdowns to further reduce root-cause analysis times and provide details in the same ‘language’ that DBA’s use.
– Real-time alerting during load tests enables notification of breached SLAs or deviations from expected results. This saves performance engineers time and allows for more rapid analysis of issues by surfacing errors more quickly.
– Automatically-configured, out-of-the-box metrics reduce configuration time and deployment effort, as well as ongoing maintenance.
Try it FREE at appdynamics.com
Copyright © 2016 AppDynamics, Inc. All rights reserved. The term APPDYNAMICS and any logos of AppDynamics are trademarked or registered trademarks of AppDynamics, Inc.