using balanced scorecard to help improve the …
TRANSCRIPT

USING BALANCED SCORECARD TO HELP IMPROVE
THE QUALITY OF CARE AND SERVICE FOR THE
PRIVATE CLINICS IN TAIWAN
By
Yi-Ming Liu (Emilio) M.D.
A dissertation submitted to Johns Hopkins University in conformity with the
requirements for the degree of Doctor of Public Health
Baltimore, Maryland
April, 2017

ii
Abstract
Aesthetic as opposed to National-Health-Insurance-Bureau (NHIB) affiliated
clinics are largely unregulated by healthcare authorities in Taiwan. Their
management is mainly focused on financial performance. Consequently, the quality
of care and services cannot be easily assessed or measured.
Two aims and fifteen specific hypotheses were established at the start of the
study design: Aim one, Examine whether the implementation of Balanced Scorecard
(BSC) improves organizational performance; Aim two, Examine whether the
implementation of BSC improves patient care.
With two clinics of similar characteristics in size, medical and service personnel
and customers, one serving as the intervention or experimental group, the other one as
the non-intervention or comparison group, after defining the organization’s mission,
core values, vision, and strategies, breaking down the strategies into its component
parts through the objectives and measures, and articulating goals for time, quality,
performance and service, and translate them into measures, we selected the Balanced
Scorecard (BSC) as the measuring management tool, designing an implementation
model for the experimental group only, with key performance indicators (KPIs) in
each of the following perspectives: financial, customer, internal processes and
learning and growth.

iii
Data were collected for six months in both groups or clinics, subsequent analyses
yielding convincing results in the intervention group with increased BSC scores in
Financial and Customer perspectives compared to the non-intervention group,
optimistic and confident scores in the Internal processes, with increased BSC scores
in employee satisfaction and staff turnover, mixed results in others concerning the
Learning and Growth perspective. Based upon these scores and results, both aims
and twelve out of fifteen hypotheses were confirmed and accepted.
Influences of instrumentation, attrition and contamination were cited as internal
threats, whereas Hawthorne effect was mentioned as external threats to validity.
The main strengths of this study are that this is the first BSC study designed for
aesthetic clinics which could serve as the guidelines of establishing regulation
parameters to the healthcare authorities. Meanwhile, due to the lack of time and
allocated resources, the small sample size and short duration of data collection were
the most evident limitations; hopefully we can expand the scope of the study in the
near future.

iv
Dissertation Readers
Dr. Leiyu Shi, DrPH, MBA, MPA, Professor
Dr. Antonio Trujillo, PhD, MPP, Associate Professor, and Chair
Yea-Jen Hsu, PhD, Assistant Scientist
Lilly D. Engineer, MD, DrPH, MHA, Assistant Professor
Arthur Ching Tzao, MD, PhD, Professor
Alternative
Hong Kan, PhD, Associate Scientist
Henry B. Perry, MD, Senior Scientist

v
Acknowledgements
My deepest gratitude is to my supervisor Dr. Leiyu Shi, for his guidance and
council, and for having faith and confidence in me throughout my doctoral studies. I
am especially grateful for all his patience, critical review of the work, and open
mindedness, without which I could have not embarked on a topic of such a complex
and extensive study. I am also grateful to my committee members for all their
comments and valuable suggestions; Dr. Yea-Jen Hsu, for her unique scholarly
perspective, insightful feedback, and guidance, and Dr. Antonio Trujillo, Dr. Lily
Engineer, Dr. Hong Kan, and Dr. Henry Perry for helping me refine my understanding
of pertinent concepts, which greatly assisted my investigation. Also my gratitude goes
towards my preceptor in Taiwan, Dr. Arthur Ching Tzao, for providing timely advices
throughout all these years.
I thank my parents, sisters, and brother, for their lasting support and love. To
my parents, I am indebted for instilling in me the appreciation of knowledge and
education. I cannot end without thanking my family, on whose encouragement and
love I have relied throughout my time in the program. Most of all, my deepest
appreciation goes to my wife Ling Ling for her unwavering faith in me and for her
love and unconditional support. Her patience and encouragement helped me to
overcome many challenging situations and to finish this dissertation. Thanks to my

vi
girls Nikki and Nina for their genuine prayer and love.
Most importantly, I thank God and my Lord Jesus for guiding and helping me
endure, persevere, not giving up all these years, so I can be better suited for His
purpose in my life.

vii
Table of Contents
Abstract ---------------------------------------------------------------------------------------I-II
Dissertation Readers-------------------------------------------------------------------------III
Acknowledgements------------------------------------------------------------------------IV-V
Table of Contents--------------------------------------------------------------------------VI-X
List of Figures----------------------------------------------------------------------------XI-XII
List of Tables---------------------------------------------------------------------------XIII-XV
Abbreviations-----------------------------------------------------------------------XVI-XVIII
Chapter One: Introduction---------------------------------------------------------------1-13
1.1. Background----------------------------------------------------------------------------1-5
1.1.1. Aesthetic medicine---------------------------------------------------------------1-3
1.1.2. Regulation of aesthetic medicine----------------------------------------------3-5
1.2. Study Objective and Significance---------------------------------------------------6-8
1.3. Specific Aims and Hypotheses-----------------------------------------------------9-13
1.3.1 Special Aim One-----------------------------------------------------------------9-10
1.3.2 Six hypotheses related to Aim One------------------------------------------10-11

viii
1.3.3 Special Aim Two-------------------------------------------------------------------11
1.3.4 Eight hypotheses related to Aim Two---------------------------------------11-13
Chapter Two: Literature Review-------------------------------------------------------14-59
2.1. Theoretical Background of Balanced Scorecard-------------------------------14-15
2.2. Why Balanced Scorecard was Chosen-------------------------------------------16-21
2.3. The Impact of Implementing BSC-----------------------------------------------22-31
2.4. Objective and Measures of Each Perspective-----------------------------------32-36
2.5. The Implementation of Balanced Scorecard------------------------------------37-55
2.5.1 The Planning Phase----------------------------------------------------------------44
2.5.2 The development phase-------------------------------------------------------45-47
2.5.3 Strategy Map-------------------------------------------------------------------48-55
2.6. Quality Improvement in Healthcare---------------------------------------------56-59
Chapter Three: Research Methods----------------------------------------------------60-94
3.1. Conceptual Framework and Study Design--------------------------------------60-67

ix
3.1.1 Conceptual Framework of Study--------------------------------------------60-62
3.1.2 Strategies of BSC--------------------------------------------------------------63-65
3.1.3 Study Design-----------------------------------------------------------------66-67
3.2. Study Setting------------------------------------------------------------------------68-83
3.2.1 Definition of Measures--------------------------------------------------------68-76
3.2.1.1 Financial Perspective-----------------------------------------------------68-69
3.2.1.2 Customer Perspective----------------------------------------------------69-71
3.2.1.3 Internal Process Perspective---------------------------------------------71-73
3.2.1.4 Learning and Growth Perspective--------------------------------------73-76
3.2.2 Data Sources--------------------------------------------------------------------77-78
3.2.3 Sampling of Questionnaire---------------------------------------------------79-81
3.2.3.1 Customer Satisfaction----------------------------------------------------79-81
3.2.3.2 Employee Satisfaction---------------------------------------------------82-83
3.3. Analytic approach------------------------------------------------------------------84-94
3.3.1Balance of the four perspectives----------------------------------------------84-90
3.3.2 Formulas of the BSC Score of Measures-----------------------------------91-92
3.3.3 Descriptive Analysis-----------------------------------------------------------92-93
3.3.4 Correlative Analysis---------------------------------------------------------------94

x
Chapter Four: Results------------------------------------------------------------------95-161
4.1. Interviewee Characteristics------------------------------------------------------95-100
4.1.1 Employee characteristics------------------------------------------------------95-98
4.1.2 Customer characteristics----------------------------------------------------------99
4.2. BSC Scores between the Two Group by the Four Perspectives-----------101-132
4.3. BSC Scores between the Two Groups----------------------------------------133-143
4.4. Perspectives among Six Departments----------------------------------------144-161
Chapter Five: Discussion-------------------------------------------------------------162-188
5.1. Foreword-------------------------------------------------------------------------------162
5.2. Financial Perspective-----------------------------------------------------------163-165
5.3. Customer Perspective-----------------------------------------------------------166-167
5.4. Internal Process Perspective---------------------------------------------------168-169
5.5. Learning and Growth Perspective---------------------------------------------170-171
5.6. Quality Improvement-----------------------------------------------------------172-173
5.7. Balanced Scorecard and Malcolm Baldrige National Quality Award
(MBNQA)----------------------------------------------------------------------174-175
5.8. Conclusions----------------------------------------------------------------------176-177
5.9. Threats to Validity---------------------------------------------------------------178-180

xi
5.9.1 Threats to Internal Validity------------------------------------------------------178
5.9.2 Threats to External Validity-----------------------------------------------178-180
5.10. Strengths and Limitations-----------------------------------------------------181-183
5.10.1 Strengths-------------------------------------------------------------------------181
5.10.2 Limitations-----------------------------------------------------------------181-183
5.11. Policy Implication--------------------------------------------------------------184-185
5.12. Future Research Plans---------------------------------------------------------186-187
5.13. Human Subjects Considerations---------------------------------------------------188
References-------------------------------------------------------------------------------189-199
Curriculum Vitae-----------------------------------------------------------------------200-204

xii
List of Figures
Figure.2.5.1 The links between vision, strategy, and the four perspectives-------------38
Figure 2.5.2 A Strategy Map Shows How the Organization Creates Value------------53
Figure 3.1.1 Conceptual framework of BSC------------------------------------------------61
Figure 3.1.2 Conceptual framework of study-----------------------------------------------62
Figure3.1.3 Strategy map----------------------------------------------------------------------65
Figure 4.3.1 BSC scores in the test group by departments------------------------------134
Figure 4.3.2 BSC scores in the control group by departments--------------------------136
Figure 4.3.3 BSC scores of the clinics between the two groups------------------------138
Figure 4.3.4 BSC scores of the physicians between the two groups-------------------139
Figure 4.3.5 BSC scores of the nurses between the two groups------------------------140
Figure 4.3.6 BSC scores of the cosmetologists between the two groups--------------141
Figure 4.3.7 BSC scores of the advisors between the two groups----------------------142
Figure 4.3.8 BSC scores of the administration stuff between the two groups--------143
Figure 4.4.1 Perspectives of the clinic in the test group---------------------------------145
Figure 4.4.2 Perspectives of the clinic in the control group-----------------------------146
Figure 4.4.3 Perspectives of the physician in the test group----------------------------148
Figure 4.4.4 Perspectives of the physician in the control group------------------------149

xiii
Figure 4.4.5 Perspectives of the nurses in the test group--------------------------------151
Figure 4.4.6 Perspectives of the nurses in the control group----------------------------152
Figure 4.4.7 Perspectives of cosmetologist in the test group----------------------------154
Figure 4.4.8 Perspectives of cosmetologist in the control group-----------------------155
Figure 4.4.9 Perspectives of the advisors in the test group------------------------------157
Figure 4.4.10 Perspectives of the advisors in the control group------------------------158
Figure 4.4.11 Perspectives of administration in the test group--------------------------160
Figure 4.4.12 Perspectives of administration in the control group---------------------161

xiv
List of Tables
Table 2.3.1. Types of Health Care Organizations That Have Implemented the BSC ----
--------------------------------------------------------------------------------------------24-26
Table 2.3.2. Health Care Applications of the Balanced Scorecard-------------------28-29
Table 2.5.1. Balanced Scorecard Team Roles and Responsibilities------------------42-43
Table 2.5.2 The Sample of Scorecard--------------------------------------------------------54
Table 3.2.1 Definition of measures of four perspectives------------------------------75-76
Table 3.2.2 Staffing of the clinics------------------------------------------------------------78
Table 3.2.3 Numbers of interviewee of Customer Satisfaction---------------------------81
Table 3.3.1 Target scores and baseline scores among measures----------------------86-87
Table 3.3.2 Weight of six departments---------------------------------------------------89-90
Table 4.1.1 Employee characteristics between the two groups---------------------------97
Table 4.1.2 Customer characteristics between the two groups--------------------------100
Table 4.2.1 BSC scores of the clinics as a unit between the two groups on October and
November 2014 (all hypotheses applicable)-----------------------------------------104-105
Table 4.2.2 BSC scores of the clinics as a unit between the two groups on December
2014 and January 2015 (all hypotheses applicable)---------------------------------106-107
Table 4.2.3 BSC scores of the clinics as a unit between the two groups on February

xv
and March 2015 (all hypotheses applicable)-----------------------------------------108-109
Table 4.2.4 BSC scores of physicians between the two groups on October and
November 2014 (all hypotheses applicable)-----------------------------------------111-112
Table 4.2.5 BSC scores of physicians between the two groups on December 2014 and
January 2015 (all hypotheses applicable)--------------------------------------------113-114
Table 4.2.6 BSC scores of physicians between the two group on February and March
2015 (all hypotheses applicable)------------------------------------------------------115-116
Table 4.2.7 BSC scores of nurses between the two groups on October and November
2014 (all hypotheses applicable)------------------------------------------------------------118
Table 4.2.8 BSC scores of nurses between the two groups on December 2014 and
January 2015 (all hypotheses applicable)--------------------------------------------------119
Table 4.2.9 BSC scores of nurses between the two group on February and March 2015
(all hypotheses applicable)-------------------------------------------------------------------120
Table 4.2.10 BSC scores of cosmetologists between the two groups on October and
November 2014 (all hypotheses applicable)-----------------------------------------------122
Table 4.2.11 BSC scores of cosmetologists between the two groups on December,
2014 and January, 2015 (all hypotheses applicable)-------------------------------------123
Table 4.2.12 BSC scores of cosmetologists between the two groups on February and
March 2015 (all hypotheses applicable)---------------------------------------------------124

xvi
Table 4.2.13 BSC scores of advisors between the two groups on October and
November 2014 (all hypotheses applicable)-----------------------------------------------126
Table 4.2.14 BSC scores of advisors between the two group on December 2014 and
January 2015 (all hypotheses applicable)--------------------------------------------------127
Table 4.2.15 BSC scores of advisors between the two groups on February and March
2015 (all hypotheses applicable)------------------------------------------------------------128
Table 4.2.16 BSC scores of the administration staff between the two groups on
October and November 2014 (all hypotheses applicable)-------------------------------130
Table 4.2.17 BSC scores of the administration staff between the two groups on
December 2014 and January 2015 (all hypotheses applicable)-------------------------131
Table 4.2.18 BSC scores of the administration staff between the two group on
February and March 2015 (all hypotheses applicable)-----------------------------------132

xvii
Abbreviations
ACE= Angiotensin-Converting-Enzyme
ACS= American College of Surgeons
AHCPR= Agency for Healthcare Policy and Research
A/R= Account Receivable
BEM= Business Excellence Model
Botox= botulinum toxin
BSC= Balanced Scorecard
CAHPS= Consumer Assessments of Health Plans Study
CAM= Complementary and Alternative Medicine
CEO= Chief Executive Officers
CQC= Care Quality Commission
DHEA= Dehydroepiandrosterone
EFQM= European Foundation for Quality Management
HER= Electronic Health Records
ER= Emergency Room
FACCT= the Foundation for Accountability
GMP= Gross Margin Percentage
HGH= Human Growth Hormone

xviii
HMO= Health Maintenance Organization
HRSA= The Health Resources and Services Administration
ICES= Institute for Clinical Evaluative Science
ICU= Intensive Care Unit
IHAS= Independent Healthcare Advisory Services
IHF= Independent Health Facilities
IOM= Institute of Medicine
JCAH= Joint Commission on Accreditation of Hospitals
KPI= key performance indicators
MBNQA = Malcolm Baldrige National Quality Award
PA/P/V= Purchase amount per patient per visit
PDCA= Plan-Do-Check-Action
QFD= Quality Function Deployment
ROI= Return on Investment
TEFRA= Tax Equity and Fiscal Responsibility Act
TQM= Total Quality Management
UK= United Kingdom
US= United States
USA= United States of America

xix
USD= United States Dollar
VIP= Very-Important-Person

1
Chapter One
Introduction
1.1. Background
1.1.1. Aesthetic medicine
Aesthetic medicine is a term that has been used by medical professionals to
describe surgical procedures (viz. Aesthetic / cosmetic surgery) and medical
treatments that aim to improve a person’s appearance or subjective sense of well-
being. The line dividing conventional and aesthetic medicine is blurring as more
people begin to regard aesthetic medicine as a form of medical science. Indeed, it is
a practice of “medicalised” beauty therapy (Tan, 2007). In a society where beauty is
increasingly seen as an essential ingredient of health (Moosa, 2002), the demand for
aesthetic medicine drives more doctors to provide aesthetic services as part of their
medical practice. It is different from other forms of medical services, in that it is a
treatment for “want” rather than for “need”. Some aesthetic / cosmetic procedures
don’t involve surgery. These include muscle paralysis, such as injections of
botulinum toxin (Botox) to relax facial muscles and to make lines and wrinkles less
obvious; dermal fillers, injected into wrinkles or creases to fill them out; micro-
dermabrasion, by which doctor uses fine crystals and a vacuum to remove dead skin

2
cells; Non-surgical laser and intense light treatments, such as hair removal; meso-
therapy, using a combination of naturally occurring compounds administrated through
a series of micro-injections for the purpose of fat reduction to improve body contour.
Some other similar medical treatments include some which have been on the
market for many years in the Complementary and Alternative Medicine (CAM)
industry, but have recently been rebranded as ‘anti-aging’. These include vitamins,
anti-oxidants, supplements such as β-carotene, selenium and coenzyme Q10,
homeopathic products etc. Other products used in ‘anti-aging’ manner are hormone
therapies, testosterone, melatonin, Human Growth Hormone (HGH), and
Dehydroepiandrosterone (DHEA). And these anti-aging products and procedures
are not only provided in aesthetic / cosmetic clinics but also in the so called anti-aging
clinics. In Taiwan, many private clinics provide some of these procedures. There
are a lot of private clinics under the name of Aesthetic or Cosmetic clinic, which
perform only less invasive (non-surgical) services.
These less invasive procedures can be carried out in medical clinics, which are
mainly office-based procedures that require minimal or no local anesthesia. In fact,
we can find in lesser developed countries that some of these procedures are carried
out in beauty salons. In the United Kingdom (UK), providers of cosmetic treatments
that do not involve surgery do not have to be registered with the Care Quality

3
Commission (CQC). The CQC is the independent regulator for health services in
England. On the other hand, providers of injectable cosmetics such as Botox, can
choose to register with the IHAS (Independent Healthcare Advisory Services) registry
of injectable cosmetic providers – Treatments you can trust. This registry only
accepts doctors, dentists and nurses who meet the standards and training principles
required to give injectable cosmetics safely. (NHS Choices, Non-surgical cosmetics
procedures)
1.1.2. Regulation of aesthetic medicine
A brief global scan of health regulatory systems revealed that the practice of
aesthetic medicine has been marginally regulated, even in the more developed
countries (Tan, 2007). However, the rising concerns of existing health regulations
are that they may not be adequate or appropriate to ensure the safe practice in
aesthetic medicine.
In the United States (U.S.), dozens of doctors, pharmacists and clinic owners
have been prosecuted for illegally dispensing anabolic steroids and growth hormone
to patients under the guise of anti-aging medicine. There are 34 states with a
prescription drug monitoring program, which is a so-called layer of protection against

4
abuse and fraud. Under the programs, pharmacies are required to enter into the
database information about every prescription they fill for controlled dangerous
substances, a category that includes anabolic steroids like testosterone. Regulators
would therefore have a snapshot of every doctor’s prescribing habits. In the UK,
private practitioners have to provide the Healthcare Commission with patients’
records and patient satisfaction surveys. In Australia, there are no specific
regulations governing the practice of cosmetic procedures.
Another concern is about human resources. In the UK, doctors who perform
aesthetic medicine procedures are not required to receive any special training in this
field. There is no specialist registry for aesthetic medicine and doctors from any
medical specialty can provide such services. In 2000, the Care Standard Act forces
the general practitioners to be on the specialist registry or to have undertaken
specialist training relevant to the aesthetic / cosmetic procedures they are providing.
In Canada, there are fewer regulations applied to clinics that use anesthesia
(Independent Health Facilities (IHF) Act, Ontario Regulation), and the physicians in
Ontario can delegate aesthetic procedures to non-qualified personnel under his/her
supervision.
The regulations of aesthetic / cosmetic medicine in Taiwan are not strict either.
Although most of the healthcare organizations have contracted with Bureau of

5
National Health Insurance, and are required to enter the information into the database;
the prescriptions of most aesthetic/ cosmetic procedures are not included because the
money is not paid by insurance but directly out-of-pocket. The qualification of the
practitioners of aesthetic / cosmetic procedures is not required as in many other
countries. Concerns about quality of aesthetic / cosmetic procedures are not rare
occurrences in Taiwan, and the highly competitive nature of the industry with little
published evidence and the fear of disclosure of trade secrets cause aesthetic /
cosmetic clinics to be distrusted by potential customers.

6
1.2. Study Objective and Significance
Our study is to develop and implement a framework of Balanced Scorecard
(BSC) for a group of direct chain (regular chain) aesthetic/ cosmetic clinics that
perform less invasive aesthetic/ cosmetic procedures. There are two types of chain
enterprises including the direct chain/ regular chain, and joined chain (franchise chain,
or contractual chain). Direct chain means the clinics are directly operated by the
head office of a company or a corporate. The joint chain clinics are owned and
operated by independent practitioners or business enterprises supported by the direct
chain headquarters which is responsible for expanding its marketing network, enhance
its brand and improve its image. Choosing chain clinics makes the actions of
adoption of the BSC more synchronized, and helps the selection of measures less
disputable.
Since 1992, there are lots of studies about the implementation of BSC. The
BSC is a management tool originally applied to businesses in the private sector, and is
thought to be “a multidimensional framework for describing, implementing and
managing strategy at all levels of an enterprise by linking objectives, initiatives and
measures to an organization’s strategy”. Some of these studies have applied BSC to
different types of healthcare organizations. According to the article of MacStravic
(MacStravic 1999, cited in Chan & Ho, 2000), there were at least six benefits that

7
could be gained by healthcare providers from a true BSC approach, namely, increased
customer insight, refocused internal operations, energized internal stakeholders,
strengthened customer relations and increased loyalty and return of value.
In 2003, Zelman et al. reviewed different types of healthcare organizations that
have adopted BSC suggest the theory and concepts of the BSC are relevant to health
care, but modification to reflect the industry and organizational realities is necessary.
In 2004 the Institute for Clinical Evaluative Science (ICES), based in Ontario,
Canada, released a report, “Developing a BSC for Public Health”, that introduced a
public health specific BSC framework for performance measurement (BMC Public
Health 2009). The report adapts the four quadrants (or perspectives) to fit the role of
public health against business organizations. As a result, BSC has been reported as a
popular management tool adopted by lots of different types of healthcare
organizations but not in aesthetic / cosmetic clinics.
In our research, the aesthetic / cosmetic clinics face the realities of business
competition and marginal regulation of healthcare organizations. The main study
objective is that we will address the inner or potential regulation guidelines by the
strategies and measures design and link to performance by using BSC as the
conceptual framework. That is to demonstrate if BSC can help the management team
and medical and non-medical services providing staff to improve the quality of care

8
and services in aesthetic / cosmetic clinics. Moreover, to find important indicators
that may support the establishment of the framework of regulations, and to provide
more high quality aesthetic / cosmetic services beyond the regulations.

9
1.3. Specific Aims and Hypotheses
We have two special aims in our research. For Aim one, we have six
hypotheses and for Aim two we have eight. These Aims and hypotheses will be
described as follows.
1.3.1 Special Aim One
The first specific aim of the study is to examine whether the implementation of
BSC improves organizational performance or not.
One of our main goals with implementing BSC is to achieve better
organizational performance. According to Richard et al. (Richard 2009),
organizational performance comprises the actual output or results of an organization
as measured against its intended outputs (or goals and objectives). It encompasses
three specific areas of firm outcomes: (a) financial performance (profits, return on
assets, return on investment, etc.); (b) product market performance (sales, market
share, etc.); and (c) shareholder return (total shareholder return, economic value
added, etc.).
In representing the measures of organizational performance, we have chosen the
measures of two perspectives: Financial Perspective and Learning and Growth

10
Perspective; and leave the other two perspectives (Internal process Perspective and
Customer Perspective) to evaluate the performance of patient care.
1.3.2 Six hypotheses related to Aim One
The hypotheses of organizational performance include:
Hypothesis 1a (H 1a): the implementation of BSC for a period of time can
help improving lagging indicators such as Gross Margin Percentage.
Hypothesis 1b (H 1b): the implementation of BSC for a period of time can
help improving lagging indicators such as Purchase Amount per Patient
(per) Visit.
Hypothesis 1c (H 1c): the implementation of BSC for a period of time can
help improving lagging indicators such as Return on Investment (ROI).
Hypothesis 1d (H 1d): the implementation of BSC for a period of time can
help improving performance indicators such as Staff Turnover.
Hypothesis 1e (H 1e): the implementation of BSC for a period of time can
help improving performance indicators such as Access to Training.
Hypothesis 1f (H 1f): the implementation of BSC for a period of time can

11
help improving performance indicators such as Employee Satisfaction.
1.3.3 Special Aim Two
The second specific aim of the study is to examine whether the implementation
of BSC improves patient care.
As described in project summary, we are dedicated to provide high quality
aesthetic /cosmetic services beyond what the regulations require. Thus we would
like to focus on improving the quality of patient care by implementing BSC.
1.3.4 Eight hypotheses related to Aim Two
To demonstrate whether the implementation of BSC improves patient care, we
came up with some hypotheses based on the two perspectives of Internal Process
Perspective and of Customer Perspective such as:
Hypothesis 2a (H 2a): the implementation of BSC for a period of time can
help improving patient care by measures such as decreased Complain Rate.
Hypothesis 2b (H 2b): the implementation of BSC for a period of time can
help improving patient care by measures such as increased Patient Repeat

12
Rate.
Hypothesis 2c (H 2c): the implementation of BSC for a period of time can
help improving patient care by measures such as increased Patient Referral
Rate.
Hypothesis 2d (H 2d): the implementation of BSC for a period of time can
help improving patient care by measures such as increased Customer
Satisfaction Rate.
Hypothesis 2e (H 2e): the implementation of BSC for a period of time can
help improving patient care by measures such as an adequate amount of
Time of Physician Consultation.
Hypothesis 2f (H 2f): the implementation of BSC for a period of time can
help improving patient care by measures such as decreased Waiting Time in
the waiting room.
Hypothesis 2g (H 2g): the implementation of BSC for a period of time can
help improving patient care by measures such as an adequate Time to Get
an Appointment.
Hypothesis 2h (H 2h): the effort of adopting Balanced Scorecard can
improve the quality of medical services, by which can be highly valued by

13
customers and also can be served as accreditation criteria by health policy
regulators.

14
Chapter 2
Literature Review
2.1. Theoretical Background of the Balanced Scorecard
Kaplan and Norton (1992) argued that managers should take both financial and
non-financial criteria into account when taking decisions (Braam and Nijssen 2004).
When the financial and non-financial perspectives integrated carefully and in a
balanced manner in a ‘‘scorecard’’ it would provide managers with a brief but
comprehensive and timely view of their business. Four different key perspectives
were identified as being critical: the financial, the customer, the internal business
process, and the learning and growth. In 1996, the same authors extended their view
stressing the importance of aligning the scorecard information with the business
strategy (Kaplan and Norton 1996).
To translate the strategic goals efficiently into tangible objectives and measures,
Kaplan and Norton suggested four interrelated management processes: (1) clarifying
and translating vision and strategy; (2) communicating and linking strategic objectives
and measures; (3) business planning and target setting; and (4) enhancing strategic
feedback and learning.

15
Finally, in 2001 Kaplan and Norton introduced five principles to keep strategy
the focus of organizational management processes: (1) translating the strategy into
operational terms; (2) aligning the organization to the strategy; (3) making strategy
everyone’s everyday job; (4) making strategy a continual process; (5) mobilizing
change through executive leadership (Kaplan and Norton 2001).
And the BSC has been gradually moved from being defined as a comprehensive
performance measurement system to taking the BSC as a strategy implementation tool
to facilitate and control performance measurement and management. The
conceptual development history allowed the BSC a variety of interpretations and
usages.

16
2.2. Why Balanced Scorecard was Chosen
Before knowing which tool to select for measuring the performance of health
care organizations, and certainly before choosing the BSC as the “golden”
performance-measuring instrument, we have to ask why even measure them in the
first place? What are the purposes and motivators behind the initiative of these
projects?
In a study focused on the public agencies, Behn identified eight major purposes
that public managers have for measuring performance: to evaluate, control, budget,
motivate, promote, celebrate, learn, and improve (Behn, 2003). Although other
experts cited other purposes including demands for evidence of program effectiveness
(Wholey, 1997), increase accountability or to hold organizations accountable
(Ammons, 1995; Osborne, 2000), decision making, resource allocation and
facilitating the devolution of authority to lower levels of the hierarchy (Kravchuck,
1996). The list could be longer or shorter depending on the organization type, but
for Behn, the only real purpose is “to improve performance”, all other purposes are
just “sub-purposes” aiming to achieve the ultimate purpose of improving performance
outcomes (Behn, 2003).
Performance measurement in health care is not a new-, fashionable concept
proposed by the most resourceful medical centers. In the 18th century, there was

17
evidence showing that the hospital of the University of Pennsylvania collected patient
outcome data. McIntyre and colleagues overviewed the history of performance
measurement and came up with the following classification of four phases (McIntyre,
2001).
The first phase (1750-1910) can be described as “Early Attempts at
Performance Measurement”. The most important cases included: (1) The
Pennsylvania Hospital collected patient outcome data tabulated by diagnostic groups
in 1754. (2) Ernest A. Codman, a surgeon at Massachusetts General Hospital,
proposed the “end result system of hospital standardization,” a health care
performance assessment system, in 1910. Three years later, the American College of
Surgeons (ACS) was founded by Franklin Martin, M.D., a colleague of Codman.
The second phase (1910-1950) can be labeled as “Birth of the Modern Era and
New Delivery Systems”. The significant cases included: (1) In 1910, the Western
Clinic in Tacoma, Washington, and its providers offered a broad range of medical
services for a premium of 0.5 USD per member per month. It was considered the
first Health Maintenance Organization (HMO). (2) In 1918, the ACS begun
conducting hospital inspections to determine facility-level compliance with the
“Minimum Standards for Hospitals”, activities that led to the formation of the “Joint
Commission on Accreditation of Hospitals (JCAH) 33 years later. Interesting

18
enough, of the 692 hospitals inspected, only 89 met the requirements. (3) In 1929,
Michael Shadid, M.D., created a cooperative health plan in Elk City, Oklahoma,
selling shares of 50 dollars to local farmers in order to raise capital for a new hospital.
The farmers received in return medical services at a discount. (4) Also in 1929,
Baylor Hospital in Texas established the Blue Cross system providing prepaid health
care services to a group of approximately 1,500 teachers. (5) In 1937, the Kaiser
Foundation Health Plans was organized. (6) In 1939, medical societies in California
created Blue Shield plans.
The major cases in the third phase (1950-1980) or the phase of “The Golden
Years” included: (1) The JCAH published the “Standards for Hospital Accreditation”
in 1951 and begun offering accreditation to hospitals. (2) In 1964, the JCAH started
charging fees for accreditation inspections. In 1965, the Congress passed the Social
Security Amendments, which included a provision that in order to participate in
Medicare and Medicaid programs, the hospitals must be accredited by the JCAH.
In the fourth phase (1980-2000), “The Age of Information and Consumerism”,
the important cases included: (1) The Tax Equity and Fiscal Responsibility Act
(TEFRA) passed in 1985, allowing Medicare HMOs to enroll Medicare beneficiaries
under a capitated risk program. (2) The consumers demanded more information
about the services they are receiving to know exactly what they are paying for. (3)

19
In order to satisfy the increasingly sophisticated customers, health care organizations
and the plans they offer begun focusing on achieving higher standards of care quality.
Knowing that the quality of care and services must improve on a constant and
consistent basis, and knowing the need of measuring the performance of the care- and
service giving organizations, we must next select the appropriate measuring tools to
accomplish the mission. The following questions should be answered: (1) What are
the available tools? (2) How do they compare to each other? How does the BSC
compare to other tools? (3) Is the BSC a better or even the best choice?
After searching the literature, we have found many “performance measures” or
“performance measurement indicators” but only a few “organization performance
measurement systems” available. In fact, the only widely adopted system besides
the BSC is the Business Excellence Model (BEM) designed by the European
Foundation for Quality Management (EFQM).
Andersen et al. compared the BEM with the BSC and concluded that while the
BEM was a good diagnostic tool, the BSC was clearly the better performance
measuring system with explicit strategic management relevance to the organizations
using it (Andersen, 2000).
Other health care measurement systems developed by the US government or
non-profit agencies include (Leneski, 2005): (1) Oryx: the JCAHO developed this

20
system to evaluate hospitals and other health care organizations with the primary
function of accountability. (2) FACCT: the Foundation for Accountability developed
this set of measures to help consumers evaluate the quality of health care they receive
with the primary function of accountability and selection. (3) Consumer
Assessments of Health Plans Study (CAHPS): developed by the Agency for
Healthcare Policy and Research (AHCPR). It measures the consumers’ satisfaction
with the healthcare services they receive with the function of helping consumers make
proper selections. (4) Conquest: Harvard developed these measures for clinical
performance, quality and appropriateness of healthcare services with the main
function of helping consumer selection. (5) Health People 2010: developed by the
US Department of Health and Human Service. It is basically a collection of
measures that monitor the nation’s health with the main purpose of improving
healthcare quality.
All these performance measurement systems were useful in accomplishing one or
several purposes described by Behn (Behn, 2003), but none of them offered such a
comprehensive, integrated collection of measures that like the BSC, can help health
care organizations translate their vision, communicate their strategy up and down the
organization, enable business planning, and give the organization the capacity to
feedback and learn strategically (Kaplan, 1996).

21
Since the implementation of BSC had been successful by many healthcare
organizations in USA, the other countries begun to evaluate if it actually improves the
performance of hospitals. In China, the following investigators like Zhijun L.,
Zengbiao Y., and Liqun Z. (Zhijun L 2014) investigated that BSC improves
organizational and personal performance of public hospitals in China. Also in
Canada and Greece, two studies agree that BSC is a useful tool in improving
performance of health sector (Nippak P. M. 2016).

22
2.3. The Impact of Implementing BSC
With such various applications and interpretations, the BSC has been called one
of the most important management innovations of the 20th century (J. Steele, 2001).
It has been adopted in a broad range of industries from manufacturing to health care,
both in the US and abroad (Zelman et al., 2003). There were some inspiring
findings regarding the use of BSC. Hoque and James (2000) made a survey of 66
Australian manufacturing companies and found the greater BSC usage is associated
with improved performance. Iselin et al. (2008) interviewed fifty Chief Executive
Officers (CEOs) from the manufacturing corporations with sales revenue greater than
$100 million. The report shows that the strength of the alignment of strategic goals
and the performance reporting system is positively associated with performance.
Ittner et al. (2003) surveyed 140 US financial services firms, and the result of the
study suggested that the use of BSC is associated with higher measurement system
satisfaction but not improved accounting and stock market performance. In contrast,
Crabtree and DeBusk (2008) investigated BSC adopters in the three-year period
following adoption. They reported the BSC-adopters significantly outperformed
their industry counterparts who did not adopt BSC.
Since1994 (J.R. Griffith, 1994), more and more articles related to the
implementation of BSC in healthcare organizations have been published. Zelman et

23
al. (2003) has pointed out that BSC is well into his growth phase in healthcare. The
basic principles of the BSC are well documented in the health care literature (e.g.,
Baker and Pink, 1995; Chow et al., 1998; Zelman et al., 2003; and Oliveira J., 2001).
As the application of BSC became popular, Zelman et al. (2003) have stated
that Baker and Pink (1995) were among the first to argue that the theory and concepts
of the balanced scorecard were relevant to hospitals. Castaneda-Mendez et al.
(1998), demonstrated that in order to connect practices, outcomes, quality, value, and
costs, health care organizations must use a balanced scorecard. Chow et al. (1998),
interviewed administrators about the BSC and concluded that each organization must
engage in the full range of strategic management activities, from defining its mission
to the selection of goals and strategies, in order to develop its own unique scorecard
and to assist progress toward the selected goals. Sahney (1998) outlined how the
BSC could be used by a managed care organization. Zelman et al. (1999)
investigated the concept of the BSC in relation to academic healthcare centers and
concluded that their unique characteristics may mitigate the full benefit of the
approach.

24
Table 2.3.1. Types of Health Care Organizations That Have Implemented the
BSC
Organization Type Examples Source
Hospital Systems Henry Ford Healthcare
System
Sahney (1998)
Ontario Ministry of Health
and Ontario Hospital
Pink et al. (2001)
Hospitals Duke’s Children’s
Hospital
Meliones et al. (2000,
2001)
Sunnybrook Health
Science Centre
Gordon et al. (1998)
Peel Memorial Hospital Harber (1998)
Duke Women’s Services Jones and Filip (2000)
University of Colorado
Health Sciences Center,
Burn Center
Wachtel et al. (1999)
University Departments Department of
Anesthesiology, Yale
Rimer (2000)
Rimer and Garstka

25
University (1999)
Yale Faculty Practice Plan Rimer (2000)
Baylor Garson et al. (1999)
Long-Term Care Ebenezer Social Services Potthoff et al. (1999)
The Sisters of Charity of
Ottawa Health Service
MacDonald (1998)
Psychiatric Centers Hudson River Psychiatric
Center
Hudson River Psychiatric
Center Web Site (2002)
Insurance Companies Kaiser Permanente Kaiser Permanente
(2001)
Pharmaceutical
Companies
Wyeth Pharmaceuticals Business Wire (2001)
National Health Care
Organizations
National Women’s Health
Quality Initiative
Inamdar et al. (2000)
JCAHO Employee Benefit
Review (1995)
Federal Government US Military Health
Services System
Krakauer et al. (1998)
Veteran’s Administration VA Web Site (1999)

26
DHHS for Mental Health
Services- “The Evaluation
Program”
Department of Health and
Human Services (1996)
Local Government Department of Health,
Washington, DC
Department of Health
Web Site (2001)
Source: Zelman (2003)
27
As Braam and Nijssen (2004) stated, the BSC can be and is used in different
ways involving many different functional areas and indicators (measures). Different
ways of implementing and using the BSC may have different effects on company
performance (Braam and Nijssen, 2004).
Zelman et al. (2003) had listed different types of healthcare organizations with
implementation of BSC (Table 2.1) and different types of applications of BSC (Table
2.2). A study from Korea found that high degree of reliability and validity of this
BSC suggests that it may be used for performance measurements of a Korean hospital
nursing organization (Hong Y et at, 2008).

28
Table 2.3.2. Health Care Applications of the Balanced Scorecard
Type of Application Examples Source
Organizational
Performance
Organizations Listed in
Table 1.
See Table 1.
Public Information Patient Care Report Cards Lowe and Baker (1997)
Badger (1998)
Clinical Pathway Cardiac Prevention Levknecht et al. (1997)
Schriefer et al. (1997)
Hospital Department
Performance
Operating Rooms Mathias (2001)
Information Technology Niss (1999)
Gordon and Geiger
(1999)
Medical Rehabilitation Cohen et al. (1997)
Quality of Care and
Outcome Measurement
Breast Cancer West et al. (1997)
Mental Health Rosenheck (1998)
Renal Transplant Colaneri (1999)
Renal Dialysis Peters and Ryan (1999)
Post-Op Nausea Graumlich et al. (2000)

29
Managed Care Evaluation HEDIS Kenkel (1996)
Performance
Measurement of a
Consortia of Hospitals
CRISP Bergman (1994)
Source: Zelman (2003)

30
These encouraging results and massive amount of information make BSC a
good choice of management tool for healthcare institutions. In a large-scale
investigation of the implementation of BSC in Sweden Healthcare organizations
showed (Aidemark et al., 2009), that the prevalence of the BSC is 65% among
Swedish emergency hospitals. This study results proved the convenience of
implementing of BSC. Aidemark et al. (2009) once more demonstrated that the BSC
contribute to creating goal congruence by becoming a common language that is used
in communication about the hospitals’ goals and strategies and that the task of
implementing and working with a BSC creates wide-spread involvement in such
strategic discussion.
The flexibility of widely adopted BSC and well- proved empirical results make
the BSC a successful management tool for lots of industries including healthcare
organization. In 2005, the HRSA (The Health Resources and Services
Administration, an agency of the U.S. Department of Health and Human Services )
had published “Balanced Scorecards for Small Rural Hospitals: Concepts Overview &
Implementation Guidance” because they believe that the Balanced Scorecard can be
useful and adaptable to small rural hospitals. This makes the BSC all the more
credible.
For nurses turnover rate there was a study concluded that a balanced scorecard

31
with strategy map is an effective tool that demonstrates connection between the
organizational mission and the outcomes of a nurse sabbatical program (Embree JL,
2015). In 2004, Ethiopia introduced a community-based Health Extension Program
to deliver basic and essential health services. Teklehaimanot HD et al. used BSC to
demonstrate that the implementation of BSC can improve specific elements of the
program and its performance (Teklehaimanot HD. 2016). A recent study aimed at
hemodialysis patients concluded that a balanced scorecard of quality performance
should include three elements: population-based best clinical practice, patient
perceptions, and individually crafted patient goals of care (Kliger AS, 2016). A
study from Canada indicated that the planning and selection process used to determine
the key indicators can aid in the development of a balanced scorecard for a health
information management department (Nippak PM et at., 2016). A study from Iran
showed that there is a continuous improvement of hospital performance with the
success of the implementation of BSC model (Semnani F, 2016).

32
2.4. Objective and Measures of Each Perspective
The framework of BSC is to organize strategic objectives into the four
perspectives (Kaplan and Norton, 2001). It is important to create performance
objectives for each perspective of BSC. Niven (2002) points out that the best way is
to examine each perspective of BSC in a form of a question: (1) Financial – What
financial steps are necessary to ensure the execution of our strategy? (2) Customer –
Who are our targeted customers, and what is our value proposition in serving them?
(3) Internal Process perspective – To satisfy our customers and shareholders, in which
processes must we excel? (4) Employee Learning and Growth – What capabilities
and tools do our employees require to help them execute our strategy?
These are the key questions to find adequate and possible measures fitting into
our BSC implementation framework. To accomplish the implementation of BSC,
one of the vital principles is identifying those indicators / measures that accurately
measure the accomplishment of strategies. Measuring performance has been a task
of healthcare since long before the development of the Balanced Scorecard. As Hill
& Powell (2005) described, there are three types of performance measures: input
measures, output measures, and outcome measures. Input measures include staff time
or budgetary resources. Output measures include number of people served or units
produced by a program or service. Input and output measures demonstrate effort

33
expended and numbers served but tell little about whether these interventions are
making a difference. Outcome measures track the benefit received by stakeholders
as a result of an organization’s efforts.
Most would agree that outcome measures provide the best information for
decision-making. A BSC should include a mix of input, output, and outcome
measures and a mix of lag and lead indicators. Lag indicators measure whether
targets have been met, while lead indicators measure progress along the way.
Employee satisfaction is an example of a lag indicator while absenteeism is an
example of a lead indicator (Hill & Powell, 2005).
Kaplan and Norton have identified and suggested some outcome measures
include: (1) Core Financial Measures: Return-on-investment / Economic value-added,
Profitability, Revenue growth / mix, and Cost reduction. (2) Core Customer
Measures: Market share, Customer acquisition, Customer retention, Customer
profitability, and Customer satisfaction. (3) Core Learning and Growth Measures:
Employee satisfaction, Employee retention, and Employee productivity.
Another example of measures is listed by Mohammed Ba-abaad (2009),
according to each perspective of the BSC, a number of key performance indicators
(KPIs) can be used in health care organizations such as: (1) Financial: Cash flow,

34
ROI, Return on capital employed, Return on equity. (2) Customer: Delivery
performance to customer – by date, Quality performance to customer – by quality,
Customer satisfaction rate, Customer loyalty, Customer retention. (3) Internal
Business Processes: Number of activities, Opportunity success rate, Accident ratios,
and Overall equipment effectiveness. (4) Learning & Growth: Investment rate,
Illness rate, Internal promotions, Employee turnover, and Gender ratios.
And in the study of Hill & Powell (2005), there are some industrial specific
measures included in the BSC implementing guidance for small rural hospitals: (1)
Financial: Operating profit margin, Days of cash on hand, Commercial mix, Net
revenue increase, Cost per patient day, Salary and benefit expense, and Nursing staff
productivity. (2) Customer: MD loyalty index, Time to treating provider, Courtesy
and respect, Patient engagement, Inpatient satisfaction, Emergency Department
satisfaction, and Patient access index. (3) Internal Business Processes: Contractual
allowances, Bad debt expense, Net days in Account Receivable (A/R), Unbilled A/R,
MD engagement index, Average age of plant, Falls: acute care, Falls: swing beds,
Medical error rate, Emergency Room (ER) waiting time, Responsiveness,
Angiotensin-Converting-Enzyme (ACE) Inhibitor delivery, Beta Blocker delivery,
Antibiotic delivery, and Aspirin delivery. (4) Learning & Growth: Nursing stuff
turnover, Staff turnover, Staff loyalty index, Medical error policy, Staff training

35
dollars, Access to training, Mission index, and Staff engagement index.
Although the measures of the four perspectives vary, and all the options seem to
be hardly formed, there are still some rules for us to follow. Niven (2002) points out
the general rule to find out the set of measures. He suggests that “less is more.” In
order to ensure focus on the vitally essential objectives, the total number should be
limited to approximately 15 scattered across the four perspectives.
Considering the scale and particularity of target aesthetic clinics, these are some
possible measures we have chosen. For the Financial dimension, there are: (1) Gross
Margin Percentage (GMP) is equivalent to (Revenue-Cost of goods sold) / Revenue.
It is a measure of how well each dollar of a clinic's revenue is utilized to cover the
costs of care provided. (2) Purchase amount per patient per visit (PA/P/V) is
equivalent to (Monthly revenue from customers) / (Monthly patient visits). It is not
a conventional financial indicator; it reflects how well the trained or untrained staff
can or cannot create value for their organizations. (3) Return on Investment (ROI) is
equivalent to (Gain from investment – Cost of Investment) / (Cost of Investment).
ROI is an index showing how much profit or cost saving is realized and sometimes
used as a way to grade how well a company is managed.
For the Customer dimension, there are: (1) Complain rate, (2) Patient repeat

36
rate, (3) Patient referral rate, (4) Customer satisfaction rate. For the Internal
Business Processes dimension, there are: (1) Time of physician consultation, (2)
Waiting time (in waiting room), (3) Time to get an appointment. For the Learning &
Growth dimension, there are: (1) Staff turnover, (2) Access to training, (3) Employee
satisfaction.

37
2.5. The Implementation of Balanced Scorecard
The first step of creating the BSC is to clearly define the mission, core values,
vision, and strategies before constructing the four perspectives. That is, translating
the vision into operational goals. Mission is what one wants to achieve by starting
the business. This must be re-examined and refreshed periodically if an organization
is to remain dynamic. Values are clear in everything one does, how one operates.
Articulating values provides everyone with guiding lights, ways of choosing among
competing priorities and guidelines about how people will work together. Vision is
what keeps the organization moving forward even against discouraging odds. Vision
is the most powerful tool of motivating an organization. If it is vivid and meaningful
enough, people can do astounding things to bring the organization’s vision to life.
Niven (2002) suggested that to start to implement the BSC, the first thing to do is to
clearly define the organization’s mission, core values, vision, and strategy, since they
are the bases of an effective BSC. This is the very first and most important task of
all which leads the directions of the implementation of BSC.

38
Figure.2.5.1 The links between vision, strategy, and the four perspectives
Source: Kaplan and Norton, 1992.

39
The second step is to breakdown the strategies into its component parts through
the objectives and measures fitted to each perspective. Kaplan (1992) suggests the
next step should be to articulate goals for time, quality, performance and service, and
translate them into measures. Almost all the measures should be calculated
mathematically and be characterized by frequency, unit type, and polarity.
It is important to be able to communicate business strategies across to all
organizational members for the purpose of alignment and attainment of the business
strategic goals and objectives (Mohammed Ba-Abaad, 2009). The measurement
links strategies and actions are needed to avoid inappropriate measures be applied.
This is because such measures tend to lead to actions, which are incongruent with the
strategies no matter how well they are formulated or communicated through the
organizations (Oliveira J., 2001).
Another critical process of implementing BSC is to examine the entire data and
reports periodically and weed out the inappropriate measures from the appropriate
ones (Chang & Young, 1999). According to Brown (1996), assessing the
performance measurement system to keep the right measures will ensure the future
success of the organizations. Iterative assessing can help the management team
accomplish their tasks in addressing the weaknesses and limitations in their systems
which is not without problems. The concept of balance should be continuously

40
noticed by paying attention to the following:
1. Balance between financial and non-financial indicators of success
2. Balance between internal and external elements of the organization
3. Balance between lag and lead indicators (measures)
In addition to the principles of Kaplan and Norton, to successfully implement
BSC, we need more experienced advisors’ skill and advice. The book “Balanced
Scorecard Step-By-Step” written by Paul R. Niven informs us some details of the very
first about implementation of BSC.
One of the most important things is to form the most admissible Balanced
Scorecard team. As Niven (2002) stated, when the Scorecard is driven down to all
levels through a process of cascading, the alignment and focus derived across the
organization can lead to real breakthroughs in performance. At first, all of the BSC
team must realize why change is not an option but an imperative. Managers and
supervisors make this happen with their understanding, acceptance, support of, and
usage of the BSC.
However, not all members of these groups will demonstrate such a willingness
to participate. While boisterous and open criticism of new senior management
initiatives is fairly rare, managers and supervisors often remain silent or demonstrate

41
muted enthusiasm, which workers quickly interpret as a questionable show of support
for the program (Janice A. Klein, 1984).

42
Table 2.5.1. Balanced Scorecard Team Roles and Responsibilities
Role Responsibilities
Executive
sponsor
Assumes ownership for the Balanced Scorecard
implementation
Provides background information to the team on strategy and
methodology
Maintains communication with senior management
Commits resources (both human and financial) to the team
Provides support and enthusiasm for the Balanced Scorecard
throughout the organization
Balanced
Scorecard
champion
Coordinates meetings; plans, tracks, and reports team results
to all audiences
Provides thought leadership on the Balanced Scorecard
methodology to the team
Ensures all relevant background material is available to the
team
Provides feedback to the executive sponsor and senior
management

43
Facilitates the development of an effective team through
coaching and support
Team members Provide expert knowledge of business unit or functional
operations
Inform and influence their respective senior executives
Act as Balanced Scorecard ambassadors within their unit or
department
Act in the best interests of the business as a whole
Organizational
change expert
Increases awareness of organizational change issues
Investigates change-related issues affecting the Balanced
Scorecard implementation
Works with the team to produce solutions mitigating change-
related risks
Resource: Niven (2002)

44
Former U.S. Secretary of Labor Robert Reich has said that well-trained and
dedicated employees are the only sustainable source of competitive strength. Thus
when implementing the BSC to the target organizational unit, we should have an
honest evaluation of the management team and supervisors who will participate and
support for BSC implementation. Niven (2002) have some suggestions for the vital
roles of Balanced Scorecard team which were listed in Table 3.
With a well-trained and well-positioned management team, and with executive
sponsorship for BSC implementation, then we will be able to go through the next
phases.
2.5.1 The Planning Phase
According to Niven (2002), to begin the work of building a BSC, there is some
groundwork that lay ahead of the implementation. To summarize, the planning
phase includes these six steps: (1) Develop a guiding rationale for BSC. (2)
Determine the appropriate organizational unit. (3) Step 3. Secure executive
sponsorship. (4) Form and train the BSC team. (5) Formulate the implementation
plan. (6) Develop a communication strategy and plan for BSC implementation.

45
2.5.2 The development phase
It is important to get executive consensus throughout the development phase.
However, it may prove virtually impossible to convene the senior management team
this frequently. So Niven (2002) suggested if group meetings are not possible, we
have to ensure all team members are consistently reporting to their “home” executives
with team progress and gathering feedback from the executive to use to guide the
future direction of the team’s work. In the development phase, there are some steps to
follow:
(1) Gather and distribute background material.
The BSC is a tool that describes strategy. In order to fulfill this promise, the
management team should have ample access to background material on the
organization’s mission, vision, values, strategy, competitive position, and employee
core competencies.
(2) Provide Balanced Scorecard education.
To make all employee population get familiar with BSC earlier, it is necessary
to have a comprehensive BSC training session designed to outline the challenges that
led you to select the Scorecard, fundamental principles of the model, success stories,
and how you plan to guide the implementation.

46
(3) Develop or confirm mission, values, vision, and strategy.
It is important to generate a consensus of where our organization rests in terms
of these critical items.
(4) Conduct executive interviews.
During these interviews with senior management, the team will gather feedback
on the organization’s competitive position, key success factors for the future, and
possible BSC objectives and measures.
(5) Develop the Strategy Map.
The simple one-page graphical representation of strategy will describe and
powerfully communicate to everyone in the company what is absolutely critical to
your success in each of the four Balanced Scorecard perspectives.
(5a) Executive workshop.
Gain senior management consensus on the Strategy Map developed by the
team. Capture and incorporate any recommendations from the executive group.
(5b) Gather employee feedback.
(6) Develop performance measures.
To translate each of the objectives on the Strategy Map into metrics that can be

47
tracked to provide insight into the execution of strategy and establish accountability
throughout the company.
(6a) Executive workshop.
(6b) Gather employee feedback.
(7) Establish targets and prioritize initiatives.
Setting targets may be among the most challenging aspects of the entire
implementation. All measures should be accompanied by initiatives designed to
bring the targets to fruition.
(8) Step 8. Gather data for the first Balanced Scorecard report.
(9) Step 9. Make “Getting to first Balanced Scorecard Report” to be the number
one priority in the initial stages of the implementation.
(10) Develop the ongoing Balanced Scorecard implementation plan.
Cascading accountability for results to lower levels of the organization, linking
budgeting and planning to strategic aims, and aligning reward systems are all vital
operations that can be positively impacted by the presence of an effective BSC.

48
2.5.3 Strategy Map
The strategy map plays an important role in implementing the BSC. To
communicate strategy clearly and succinctly to all stakeholders of an organization, the
strategy map allows BSC developers to quickly grasp important interdependencies,
question assumptions, and simply create a better description of their unique strategies
(Niven, 2002, 2005). It links objectives and strategies with arrows to depict patterns
of cause and effect, and briefly presented as a one-page graphic of what must be done
well in each of the four perspectives to execute strategies of the organization. In the
manner of beginning the statements with a verb in each of the perspectives, the
strategy map answers the questions of each objective, such as “increase the return on
investment” or “close skill gaps” etc.
To build an effective strategy map, Niven (2002) indicates some of the sources
of information that should be considered:
(1) Annual reports.
An invaluable source of information, annual reports not only contain
detailed financial information but also discuss market position, key
products, prospects for the future, and maybe even nonfinancial indicators
of the organization.

49
(2) Mission statement.
Ask each member of BSC team to recite the organization’s mission
statement. After all, most organizations do have one.
(3) Values.
The purpose of establishing the value is to ask if the organization has
established its guiding principles.
(4) Vision.
As with the mission, the team should be able to find a vision
statement for the organization or it could be developed to reflect the reality
of current organization.
(5) Strategic plan.
This is the mother lode of Map and Scorecard building information.
A coherent strategic plan based on mission, values, and vision is a great
start in the process. Most organizations have their BSC rollout delayed, or
even derailed, as the organization struggles to produce a valid strategy.
(6) Project plans.
It is very important to gauge which projects appear to be aligned with

50
the strategy of the organization and have the support of influential
executives. These initiatives may be candidates to remain as important
action plans in achieving one or more Scorecard measures.
(7) Consulting studies.
Consultants most likely have provided background information that
will prove very helpful in the review process.
(8) Performance reports.
Find reports of existing management system and review at least a
year’s worth of these reports to determine what indicators of performance
are currently deemed critical to the organization’s success.
(9) Competitor data.
Knowing what the competitors are doing and tracking may help us to
determine some of the key objectives and measures. But don’t simply
copy the objectives and metrics of the competitors. They may have mature
processes that focus on different aspects of the value chain.
(10) Organizational histories.
It will likely provide a wealth of information on why the organization

51
was started (mission), what the founders valued, key lessons learned over
the years, and a picture of the future.
(11) Analyst reports.
If the organization is publicly traded, analyst reports will provide an
excellent glimpse of what the market values the company. These
documents often provide a wealth of statistical data as well.
(12) Trade journals and news articles.
These could have a strong impact on the objectives and measures the
BSC team has chosen to influence public opinion.
(13) Benchmarking reports.
These documents provide good background and may stimulate
discussion of potential measures. The objectives and measures we choose
to represent that strategy may in some cases mirror those of other
organizations, but it’s the determination of the key drivers for our
organization that will ultimately differentiate us from the rivals.
The Strategy Map would be helpful in developing the measures of BSC.
Although developing measures is a difficult work to begin with, there is a simple

52
method to avoid situations like this from blocking the progress of BSC, that is, to
craft two to three-sentence narratives for each objective (Niven, 2002) after the
accomplishment of the Strategy Map.
In healthcare sector, the value of organization indicates human-based and
knowledge-intensive property. When a healthcare organization wants to improve
financial performance, the other three perspectives should be prior to financial
perspective. Learning and growth plays the initial driver for reaching both customer
and financial performance through the mediator of internal process. Since the
learning and growth perspective acts as a base for all other perspectives and they
depend on it, healthcare organizations must continuously improve quality by
educating staff and updating their internal process. Finally, according to above
structure, healthcare organizations can increase customer satisfaction and productivity
and improve the financial perspective (Raeisi AR, Yarmohammadian MH, Bakhsh
RM, & Gangi H, 2012; Wu IL & Kuo YZ, 2012).

53
Figure 2.5.2 A Strategy Map Shows How the Organization Creates Value

54
Table 2.5.2 The Sample of Scorecard
Source: Paul R. Niven (2002)

55
These measures can be translated into scorecards one by one and be categorized
by four perspectives, as presented in Table 2.5.2.

56
2.6. Quality Improvement in Healthcare
Over sixteen years ago, the Institute of Medicine’s (IOM) report “To Err is
Human; Building a Safer Health SYSTEM” revealed that between 44,000 and 98,000
Americans die each year as a result of medical errors (Kohn et al., 1999). This
report had raised public awareness of healthcare quality and had initiated a series of
activities of healthcare improvement. In 2001, IOM published “Cross the Quality
Chasm: A New Health System for 21st Century”. In this report, IOM identified 6
aims for improvement in healthcare:
1. Safe: avoiding injuries to patients from care that is intended to help them.
2. Effective: providing services based on scientific knowledge to all who could
benefit, and refraining from providing services to those unlikely to benefit
(avoiding underuse and overuse).
3. Patient-centered: providing care that is respectful of and responsive to individual
patient preferences, needs, and values and ensuring that patient values guide
clinical decisions.
4. Timely: reducing waits and sometimes harmful delays for both those who receive
and give care.
5. Efficient: avoiding waste, such as waste of equipment, supplies, ideas, and
energy.

57
6. Equitable: providing care that does not differ in quality because of personal
characteristics such as gender, ethnicity, geographic location, and socioeconomic
status.
Thereafter, healthcare begun to take actions such as six sigma, continuous
improvement, and Deming Plan-Do-Check-Action (PDCA) cycle to reduce medical
errors and to improve quality of care. Six Sigma is a philosophy that seeks to reduce
variation in processes that lead to defects (Chase et al., 2006). By achieving Six
Sigma, the failure rate is minimized to 3.4 defects per million opportunities, which
translates to a 99.9996% success rate (Lanham and Maxon-Cooper, 2003).
Continuous improvement and Deming PDCA cycle have been applied to sustain
continuous improvement of healthcare performance.
On the other hand, quality in healthcare organizations may be evaluated using
Donabedian’s trilogy. These are structure such as how care is organized, for
example, Intensive Care Unit (ICU) staffing with intensivists; process, what is done
by caregivers, such as the percentage of patients with diabetes who have their
glycated hemoglobin measured; and outcomes, like the results achieved, such as
mortality rates following coronary artery bypass graft (Pronovost et al., 2006).
Before the report of IOM, the increasing competition in the healthcare industry
and the existence of continual pressure from the stakeholders of the healthcare

58
organizations, forced these institutions to look for alternative ways of adding values to
their services while cutting down the cost of services-care deliveries to their
customers and patients (Castandeda-Mendez, 1998). This is one of the incentives
the healthcare organizations devote to some continuous quality improvement
activities such as the implementation of Total Quality Management (TQM), industrial
benchmarking and participation of hospital accreditation programs.
As described by Mohammed Ba-Abaad (2009), the initiatives are further
strengthened by a large number of organizations’ interest in hunting the national and
international quality awards that are widely acknowledged by the public, such as the
Baldrige Awards in USA, and European Foundations for Quality Management
Awards. These prestigious awards are given to winning organizations in recognition
of their substantial improvement in their business performances and contribute
positively in boosting the reputation of the winners and increase their
competitiveness. For healthcare providers, they have newly established Baldridge
Healthcare Criteria to refer to in measuring their own performance excellence and
meeting up the challenges of healthcare cost containment (Chow-Chua & Goh, 2002).
Medical organizations not only set up to achieve financial efficiency, but also to
achieve several goals-present a broad view of performance, create transparency and
accountability, communicate goals and engage faculty, and ensure they use data to

59
guide strategic decisions (Hwa M, Sharpe BA & Wachter RM, 2013; Nippak PM, et
al., 2016). Recently, more and more studies report that the BSC is favorable in the
organizational performance, in helping the decision making process, and successful in
absorbing customer satisfaction (Ajami S, Ebadsichani A, Tofighi S, & Tavakoli N,
2013; de Matos Nasser E, Reis da Costa SR, 2013)
Furthermore, hospitals use the BSC to help improve clinical care. Smith et al.
(2014) applied it to hip and knee replacements. They found measurable
improvements in all quality dimensions, including shorter hospital stays and wait
times, higher bed utilization, earlier patient ambulation, and better patient outcomes.
In Taiwan, an academic medical center builds up the BSC red light tracking warning
system, which improved controllable costs, infection rates, and the medical records
completion rate. The medical center concludes that the system is an effective and
efficient tool where improvement depends on ongoing and consistent attention in a
continuing effort to better administer medical care and control costs (Chen HF, Hou
YH, & Chang RE, 2012).

60
CHAPTER 3
Research Methods
3.1. Conceptual Framework and Study Design
3.1.1 Conceptual Framework of Study
Figure 3.1.2 represents the conceptual framework of the study. To accomplish
the study, we must first translate the vision into operational goals, then breakdown the
strategies into measures of the four perspectives; gather the data of all measures for
periodical checking, revision and hypothesis testing. The study is constructed based
on the implementation of BSC, thus the conceptual framework of BSC is also
mentioned in Figure 3.1.
By checking the data collected from the measures, every set goal would be
compared with it ; if the data of an individual measure failed to achieve the goal, then
both the scorecard and the data should be reviewed by the BSC team and be revised if
necessary (dashed line with an arrow).
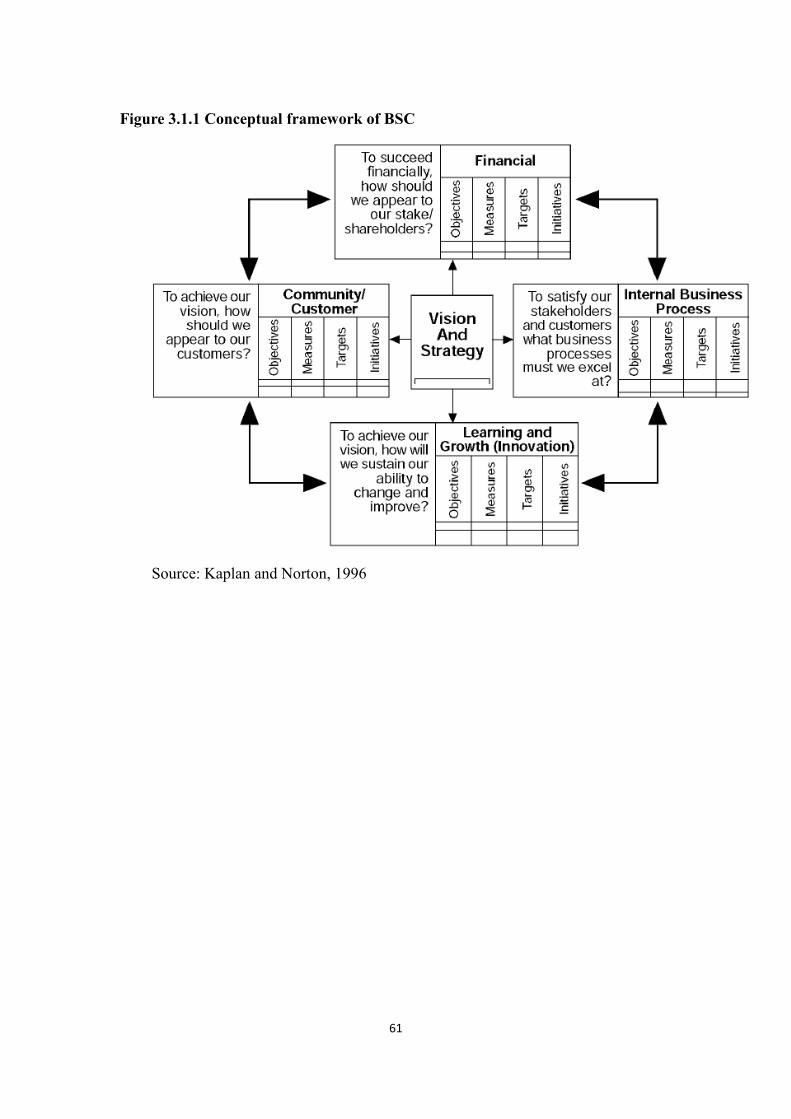
61
Figure 3.1.1 Conceptual framework of BSC
Source: Kaplan and Norton, 1996

62
Figure 3.1.2 Conceptual framework of the study
Financial
H1a,H1b,H1c
Monthly Data
Mission
Values
Vision
Strategy
Data of
Measures
Periodically check and
revise, including the
balance of four
perspectives
Customer
H2a,H2b,H2c,H2h
Questionnaires
Internal Process
H2e,H2f,H2g
Records of Services
Learning
And Growth H1d,H1e,H1f Records of Services,
Questionnaires
Perspectives and
Hypothesis
Hypothesis Test
Failure to Achieve Goals

63
3.1.2 Strategies of Balanced Scorecard
The objective of the study is to construct the BSC framework of aesthetic
medicine that could assist other clinics improve their medical and service qualities.
After the introduction and implementation of the BSC, the subject clinic of the study
could become the benchmark of aesthetic/ cosmetic medicine. To achieve the above
vision, three strategies of financial perspective are formulated-Revenue Growth,
Profit Growth and Cost Reduction. According to these strategies, improving public
awareness and customer satisfaction are reckoned as strategies of Customer
perspective which could increase revenue and profit and reduce cost. Customer
satisfaction is divided into two strategies, Effective and Pleasant Treatment
Experience and Zero Defect Service.
In the last two perspectives, Internal Process and Learning and Growth, the
study aims to follow three strategies of Customer perspective. To improving public
awareness, word of mouth marketing and market expansion are arranged for raising
awareness. Word of mouth marketing can be promoted by setting up Very-
Important-Person (VIP) management. As well as Word of mouth marketing,
cooperation with renowned medical and academic institutions is expected to improve
public awareness.
For Effective and Pleasant Treatment Experience when addressing the Internal

64
Process perspective, providing custom-designed treatment protocols, physician-based
consulting service and constantly introducing new technology can help providing
better quality of treatment and services. As of Learning and Growth perspective, by
leadership of the physician and by emphasizing talent incubation, the employees can
enhance medical knowledge and capability, consequently achieving and improving
employee satisfaction.
Items written with gray characters are the ones that are not being done or are
being done partially at this time and are considered beyond the scope of this study,
and could be considered as future implementation strategies once the study concludes.

65
Figure3.1.3 Strategy map

66
3.1.3 Study Design
This study is a case study by applying balanced scorecard to a group of direct
chain (regular chain) aesthetic / cosmetic clinics, where the author is the chief
executive officer. One clinic will be selected as the test subject to apply the
strategies of Balanced Scorecard and another clinic as the control subject (with data
collection, but no implementation of strategies).
All the clinics are located in Metro Taipei Area. Both subject clinics provide
similar aesthetic procedures, three physicians providing pertinent medical services,
and similar staffing. On the test clinic three strategies was applied, including time
extension of physician consultation, providing regular training courses for all staff
members, and regular book/ journal reading reports for all staff members.
Implementation plan:
1. Increase staff training hours
2. Increase physician consultation time
3. Decrease staff dissatisfaction rate and turn-over rate
4. Decrease dispute or complaint rate by customers and adverse medical reactions
5. Increase customer satisfaction rate
The control clinic is given the opportunity of adopting BSC implementation
after the study is completed.

67
The study will be applied for six months and data will be collected monthly.
All data were collected by staff members of both clinics with the help of the Sun
Home Business Consulting Corp., a local accounting firm with expertise on BSC
implementation, which then helps transforming original data into BSC score on a
monthly basis.

68
3.2. Study Setting
3.2.1 Definition of Measures
According to the four perspectives of BSC, the measures will be derived from
strategies of each perspective, then the data are collected from both the test and
control clinics. Those measures are chosen by the author of the study, who is an
aesthetic physician with fifteen years of experience, after consulting with four
associates of Sun Home Business Consulting Corporation. The measures are
described as follows (Table 3.2.1):
3.2.1.1 Financial Perspective
In this perspective, we have two strategies with three measures, including:
Strategy 1 Profit growth, Measure 1: Gross Margin Percentage, with the following
definition:
Gross margin percentage (GMP) = (Revenue-Cost of goods sold) / Revenue
It is a measure of how well each dollar of a clinic's revenue is utilized to cover
the costs of care provided.
Strategy 1 Profit growth, Measure 2: Return on Investment (ROI), with the following
definition:
Return on investment (ROI) = (Gain from investment – Cost of Investment) / (Cost of

69
Investment)
ROI is an index that shows how much profit or cost saving is realized and
sometimes used as a way to grade how well a company is managed. The monthly
numerical financial data will be collected from both clinics.
Strategy 2 Revenue growth, Measure 3: Purchase amount per patient per visit, with
the following definition:
Purchase amount per patient per visit (PA/P/V) = Monthly revenue from customers /
Monthly patient visits
It is not a conventional financial indicator; it reflects how well the trained or
untrained staff can or cannot create value for their organizations.
3.2.1.2 Customer Perspective
There are four strategies with six measures, including:
Strategy 1 Effective and nice experienced treatment, Measure 1: Patient Repeat Rate,
with the following definition:
Patient Repeat Rate = (number of total customers - first visit customers) / number of
total customers
Both the front counter staff or the Electronic Health Records (EHR) system can
calculate the repeat rate at the end of the month.

70
Strategy 2 Improve customer satisfaction, Measure 2: Customer satisfaction rate, with
the following definition:
Customer satisfaction rate = number of satisfied customers / number of total
customers
The one major question of customer satisfaction survey is the level of
satisfaction that customers felt about the services. The level of satisfaction
concerning both medical or non-medical services could be classified into five
categories: extremely satisfied, very satisfied, satisfied, dissatisfied, extremely
dissatisfied. Customers who select one of the first three categories will be counted
as satisfied customers.
To collect this data, customers are selected by cluster sampling for customer
satisfaction survey and this data will be generated quarterly.
Strategy 3 Improve public awareness, Measure 3: Patient Referral Rate, with the
following definition:
Patient Referral Rate = number of referred customers / number of total customers
On the first visit, customers are requested to fill the form of personal
information; one of the questions is about who referred them in. If the blank is filled
with some specific name of a specific customer, it will be considered a valid referral
count. This measure will be calculated quarterly.

71
Strategy 3 Improve public awareness, Measure 4: Increase Numbers of New Patients,
with the following definition:
Increase Numbers of New Patients= Number of new patients increased in the clinic
monthly
Strategy 4 Zero defect service, Measure 5: Adverse Medical Reaction Rate, with the
following definition:
Adverse Medical Reaction Rate= number of customers with adverse medical reactions
/ number of total customers
Strategy 4 Zero defect service, Measures 6: Complaint Rate, with the following
definition:
Complaint Rate = number of complaint events / number of total customers
It could be calculated by gathering customers’ oral or written feedback. The
front counter staffs that are responsible for patient service will take notes and count
the number of total customers at the end of the month.
3.2.1.3 Internal Process Perspective
In this perspective, we have three strategies with five measures, including:
Strategy 1 Doctor-based consultation, Measure 1: Time of Physician Consultation,
with the following ways of measurement:

72
The data could be collected either by the EHR system or by the nurse in the
consultation room writing down the time of customer entering and exiting. The
length of time can be easily calculated and recorded in a table even if the EHR system
is not available.
Strategy 1 Doctor-based consulting service, Measure 2: Rate of Completing the Deal,
with the following definition:
Rate of Completing the Deal = number of deal completed / number of total deals
Strategy 2 Provide customized treatment, Measure 3: Time to get an appointment
(Days), with the following measurement:
Our customers can book an appointment through phone calls or after the
previous treatment session before leaving the clinic. In our experience, the ideal
time to get an appointment is within 2 days of the phone call. This data could be
collected through the appointment books of the clinics. It could be generated
monthly.
Strategy 2 Provide customized treatment, Measure 4: Waiting Room Time, with the
following definition:
The time from arrival to the registration counter and that of entering the
consultation room can be recorded by hand or by a simply keyed in to the computer.
In a clinic with no EHR system, it would be collected by the customer service staff.

73
Strategy 3Enhance service quality, Measure 5: Dispute Rate by Customers, with the
following definition:
Dispute Rate= number of dispute case / number of total cases
3.2.1.4 Learning and Growth Perspective
In this perspective, there are three strategies and five measures, including:
Strategy 1 Talent incubation, Measure 1: Access to Training, with the following
definition:
Access to Training = staff’s personal attendance hours of training courses / total hours
of training courses
The number of quitted staffs could be found in the human resource records. It
will be calculated monthly.
Strategy 1 Talent incubation, Measure 2: Number of Training Courses Completed,
with the following measurement:
It is the record of the number of courses the personnel has completed in one month.
Strategy 2 Improve employee satisfaction rate, Measure 3: Employee satisfaction rate,
with the following definition:
Employee satisfaction rate= number of satisfied employees / number of total
employees

74
The one major question of employee satisfaction survey is the level of
satisfaction that employees feel about their jobs. The level of satisfaction could also
be categorized into five categories such as: extremely satisfied, very satisfied,
satisfied, dissatisfied, extremely dissatisfied. Employees who select one of the first
three options is considered satisfied.
Strategy 2 Improve employee satisfaction rate, Measure 4: Staff Turnover, with the
following definition:
Staff Turnover = number of quitted staffs / number of total staffs
The number of quitted staffs could be found in the human resource records. It
will be calculated monthly. Only the employees who had passed the probationary
period (i.e. 3 month) will be included.
Strategy3 Leadership of physician, Measure 5: Number of Book or Journal Reports,
with the following definition:
Number of Book or Journal Reports= number of clinic holding a books or journal
reports

75
Table 3.2.1 Definition of measures of four perspectives
Perspective Measures Formula
Financial
Gross Margin Percentage (GMP) (%) 𝑅𝑒𝑣𝑒𝑛𝑢𝑒 − 𝐶𝑜𝑠𝑡 𝑜𝑓 𝑔𝑜𝑜𝑑𝑠 𝑠𝑜𝑙𝑑
𝑅𝑒𝑣𝑒𝑛𝑢𝑒
ROI (%) 𝐺𝑎𝑖𝑛 𝑓𝑟𝑜𝑚 𝑖𝑛𝑣𝑒𝑠𝑡𝑚𝑒𝑛𝑡 – 𝐶𝑜𝑠𝑡 𝑜𝑓 𝐼𝑛𝑣𝑒𝑠𝑡𝑚𝑒𝑛𝑡
𝐶𝑜𝑠𝑡 𝑜𝑓 𝐼𝑛𝑣𝑒𝑠𝑡𝑚𝑒𝑛𝑡
Purchase Amount per Patient per Visit
(NTD)
𝑅𝑒𝑣𝑒𝑛𝑢𝑒 𝑓𝑟𝑜𝑚 𝑐𝑢𝑠𝑡𝑜𝑚𝑒𝑟𝑠
𝑃𝑎𝑡𝑖𝑒𝑛𝑡 𝑣𝑖𝑠𝑖𝑡
Customer
Patient Repeat Rate (%) 𝑁𝑢𝑚𝑏𝑒𝑟 𝑜𝑓 𝑡𝑜𝑡𝑎𝑙 𝑐𝑢𝑠𝑡𝑜𝑚𝑒𝑟𝑠 − 𝑓𝑖𝑟𝑠𝑡 𝑣𝑖𝑠𝑖𝑡 𝑐𝑢𝑠𝑡𝑜𝑚𝑒𝑟𝑠
𝑁𝑢𝑚𝑏𝑒𝑟 𝑜𝑓 𝑡𝑜𝑡𝑎𝑙 𝑐𝑢𝑠𝑡𝑜𝑚𝑒𝑟𝑠
Customer Satisfaction Rate (%) 𝑁𝑢𝑚𝑏𝑒𝑟 𝑜𝑓 𝑠𝑎𝑡𝑖𝑠𝑓𝑖𝑒𝑑 𝑐𝑢𝑠𝑡𝑜𝑚𝑒𝑟𝑠
𝑁𝑢𝑚𝑏𝑒𝑟 𝑜𝑓 𝑡𝑜𝑡𝑎𝑙 𝑐𝑢𝑠𝑡𝑜𝑚𝑒𝑟𝑠
Patient Refer Rate (%) 𝑁𝑢𝑚𝑏𝑒𝑟 𝑜𝑓 𝑟𝑒𝑓𝑒𝑟𝑟𝑒𝑑 𝑐𝑢𝑠𝑡𝑜𝑚𝑒𝑟𝑠
𝑁𝑢𝑚𝑏𝑒𝑟 𝑜𝑓 𝑡𝑜𝑡𝑎𝑙 𝑐𝑢𝑠𝑡𝑜𝑚𝑒𝑟𝑠
Increase Numbers of New Patient (N) Number of new patient
Adverse Medical Reaction Rate (%) Number of customers with adverse Medical reaction
𝑁𝑢𝑚𝑏𝑒𝑟 𝑜𝑓 𝑡𝑜𝑡𝑎𝑙 𝑐𝑢𝑠𝑡𝑜𝑚𝑒𝑟𝑠
Complain Rate (%) 𝑁𝑢𝑚𝑏𝑒𝑟 𝑜𝑓 𝑐𝑜𝑚𝑝𝑙𝑎𝑖𝑛𝑖𝑛𝑔 𝑒𝑣𝑒𝑛𝑡𝑠
𝑁𝑢𝑚𝑏𝑒𝑟 𝑜𝑓 𝑡𝑜𝑡𝑎𝑙 𝑐𝑢𝑠𝑡𝑜𝑚𝑒𝑟𝑠
Internal
Process
Time of Physician Consultation (Minute)
How many minutes a physician spent in consulting a
customer
Rate of Completing the Deal (%) number of deal completed / number of total deals
Time to Get an Appointment (Days)
Within how many days can A customer book an
appointment through phone calls
Waiting Time (Minutes)
The amount of time a customer spent waiting from
arrival to consultation by a physician
Dispute Rate by Customers (%) number of dispute case / number of total cases
Learning
and
Access to Training (%) 𝐻𝑜𝑢𝑟𝑠 𝑜𝑓 𝑝𝑒𝑟𝑠𝑜𝑛𝑛𝑒𝑙′𝑠 𝑎𝑡𝑡𝑒𝑛𝑑𝑎𝑛𝑐𝑒 𝑜𝑓 𝑡𝑟𝑎𝑖𝑛𝑖𝑛𝑔 𝑐𝑜𝑢𝑟𝑠𝑒𝑠
Total ℎ𝑜𝑢𝑟𝑠 𝑜𝑓 𝑡𝑟𝑎𝑖𝑛𝑖𝑛𝑔 𝑐𝑜𝑢𝑟𝑠𝑒𝑠
Number of Training Course Completed
(N) Personnel has completed how many training courses

76
Growth Employee Satisfaction Rate (%) 𝑁𝑢𝑚𝑏𝑒𝑟 𝑜𝑓 𝑠𝑎𝑡𝑖𝑠𝑓𝑖𝑒𝑑 𝑒𝑚𝑝𝑙𝑜𝑦𝑒𝑒𝑠
𝑁𝑢𝑚𝑏𝑒𝑟 𝑜𝑓 𝑡𝑜𝑡𝑎𝑙 𝑒𝑚𝑝𝑙𝑜𝑦𝑒𝑒𝑠
Staff Turnover Rate (%) 𝑁𝑢𝑚𝑏𝑒𝑟 𝑜𝑓 𝑞𝑢𝑖𝑡𝑡𝑒𝑑 𝑠𝑡𝑎𝑓𝑓𝑠
𝑁𝑢𝑚𝑏𝑒𝑟 𝑜𝑓 𝑡𝑜𝑡𝑎𝑙 𝑠𝑡𝑎𝑓𝑓𝑠
Number of Book Reports
(for clinic and physician) (N) Number of clinic holding a book report

77
3.2.2 Data Sources
There are two clinics in the study, one considered as the test group and the other
the control group. The main services of both groups are aesthetic and cosmetic
procedures, all minimally invasive, excluding plastic surgery operations. They are
established and funded by a cosmetic product distribution company. The test group
was the volunteer to implement strategies of BSC, and the control group agreed to
participate without implementation of BSC strategies.
Table 3.2.2 shows the personnel characteristics of two groups. Those staffs
were invited to join the study for 6 months. We planned to measure performances of
physician, nurse, cosmetology, advisor, administration and clinic as an organization
by BSC on a monthly basis. Both groups have similar structure of staffing with
identical amount of physicians, nurses and advisors.

78
Table 3.2.2 Staffing of the clinics
Numbers Test clinic Control clinic
Total 15 17
Physician 3 3
Nurse 3 3
Cosmetologist 5 6
Advisor 3 3
Administration staff 1 2

79
3.2.3 Sampling of Questionnaire
This study has defined some measures of satisfaction. According to them, we
built and designed the customer and employee satisfaction survey questionnaires and
collected data to fulfill the requirements of the BSC measures.
3.2.3.1 Customer Satisfaction
Customer satisfaction has been defined as the state of mind that customers have
about a company and its products or services when their expectations have been met
or exceeded. This is the state that reflects the lifetime of the product or service
experience (www.qualtrics.com). The customer satisfaction survey will be applied
monthly to 50 customers per clinic. Those important measures such as time of
physician consultation, customer complaint rates, and the 3Rs (repeat, retain and
refer) rates will be included in the design of the questionnaire. To get a better
consistency of distribution of the population, we choose cluster sampling as the
sampling method. Cluster sampling is a sampling technique used when "natural"
groupings are evident in a statistical population. It is often used in marketing research.
Elements within a cluster should ideally be as heterogeneous as possible, but
there should be homogeneity between cluster means. Each cluster should be a small
scale representation of the total population. The clusters should be mutually

80
exclusive and collectively exhaustive. Because the size of clinics and the frequency
of customer visits may vary, the details of the sampling will also vary from clinic to
clinic.
The rationale of asking the level of customer satisfaction is to get an idea of the
overall feeling of services received, and also to ask the customer whether the quality
of patient care is highly valued and comparable to other accredited healthcare
organizations.
We interviewed customers of the both clinics who have consented to answer the
questionnaire for customer satisfaction. The number of interviewees of both groups
was equal month by month. There were 520 valid and 13 invalid questionnaires.

81
Table 3.2.3 Numbers of interviewee of Customer Satisfaction
Numbers Test clinic Control group
Total 527 526
October 2014 95 95
November 2014 95 80
December 2014 80 80
January 2015 90 90
February 2015 75 75
March 2015 85 85
Invalid 7 6

82
3.2.3.2 Employee Satisfaction
Employee satisfaction is the terminology used to describe whether employees
are happy, contented and their desires and needs at work fulfilled. Many measures
purport that employee satisfaction is a factor in employee motivation, employee goal
achievement, and positive employee morale in the workplace (about.com).
Employee satisfaction is often measured by anonymous employee satisfaction surveys
(about.com) administered periodically that gauge employee satisfaction in areas such
as management, understanding of mission and vision, empowerment, teamwork,
communication and ,co-worker interaction.
Our goal to achieve a better employee satisfaction is to help our employees
accomplish their self-fulfillment through a meaningful and continuous improvement
of the working environment. As mentioned in the section of aims and hypotheses,
we assume the implementation of BSC can increase employee motivation,
satisfaction, knowledge, skills and abilities. The level of satisfaction will be gauged
in the six areas mentioned above by questionnaires, and the results will be evaluated
in combination with human resource records monthly.
The questions probing the level of employee satisfaction is aimed to gather
information about how happy they are at work; also asking the employees to think
about the overall conditions of their career, and ways that can improve them.

83
Additional questions will help us achieve better employee stewardship.
We collected questionnaires of employee satisfaction monthly as well. All
staffs of both clinics consented to participate in the study for 6 months. Ninety valid
questionnaires were interviewed in the test clinic for 6 months, and 102 in the control
clinic.

84
3.3. Analytic approach
The collected data will be entered into Microsoft Excel for statistical analysis.
As Braam and Nijssen (2004) implicated, overly technically-oriented with
introduction of new unfamiliar software could lead the results that lack involvement
of the departments. Using popular software such as Microsoft Excel for data
entering and analysis may mitigate the resistance toward the implementation of BSC.
We also will periodically apply a test to check the balance of four perspectives.
3.3.1Balance of the four perspectives
To check the balance of the four different perspectives, we adopted the formula
designed by Braam et al. (2004) to accomplish better allocation of attention over the
four perspectives. We can periodically perform self-examination by simply counting
the balanced scorecards achieving the goals in the dictionary, and find out the
proportion of each perspective. Next, the BSC use as a comprehensive measurement
tool was calculated utilizing the following formula:
A high score reflects a situation where all four aspects are equally taken into

85
account (score = +100), suggesting a comprehensive measurement, whereas a low
score indicates an extremely unbalanced use with 100 percent focus on a single
perspective (score = -50) (Braam et al., 2004). The assumption is therefore an equal
allocation of attention over the different perspectives is optimal (Kaplan and Norton,
1996), and the unbalance may remind us to re-allocate our resources. Simply follow
the framework of this research, and we should be able to adjust or revise our measures
maintaining the desired balanced.
According to the formula designed by Braam et al. (2004), we designed the
target score and the baseline score for each measure that we could compare by
transforming them into the same unity of scale. Table 3.3.1 shows target scores and
baseline scores of nineteen measures of all four perspectives. If the data of the
measure is higher than the baseline score and the difference is larger than the one
observed between the target and baseline scores, the data of that measure will get
100% score.

86
Table 3.3.1 Target scores and baseline scores among measures
Perspective Measures Target Baseline
Financial
Gross Margin Percentage (GMP) (%) 50.0% 20.0%
ROI (%) 2.8% 0.0%
Purchase Amount per Patient per
Visit (NTD)
20,000 5,000
Customer
Patient Repeat Rate (%) 50% 0.0%
Customer Satisfaction Rate (%) 95.0% 80.0%
Patient Referral Rate (%) 20% 0.0%
Increase Numbers of New Patients
(N)
25 0
Adverse Medical Reaction Rate (%) 8.5% 10.0%
Complain Rate (%) 18.0% 20.0%
Internal
Process
Time of Physician Consultation
(Minutes)
20 5
Rate of Completing the Deal (%) 35.0% 30.0%
Time to Get an Appointment (Days) 6 7
Waiting Time (Minutes) 60 120

87
Dispute Rate (%) 17.5% 20.0%
Learning
and Growth
Access to Training (%) 1 0.7
Number of Training Course
Completed (N)
1 0
Employee Satisfaction Rate (%) 75.0% 70.0%
Staff Turnover (%) 10.0% 20.0%
Number of Book/ Journal Reports 1 0

88
Based on the hypotheses of the implementation of BSC, we have weighed the
four perspectives in six departments (Table 3.3.2).
Some weighing considerations are listed below:
Nurses and cosmetologists are responsible for customer relationship and their comfort
level, so they are not evaluated on the financial KPIs.
Regarding the Customer Perspective, since the cosmetologists, advisors and
administration staff do not execute medical procedures, they will not be measured for
the adverse medical reaction rate, but yes for patient repeat rate, customer satisfaction
rate and complaint rate.
Time of physician consultation is only executed by the physicians so that nurses,
cosmetologists, advisors and administration staff are not evaluated.
For the Learning and Growth perspective, the clinic as an organization and physicians
are gauged by book reports because they need to learn new technology and enhance
their capability. Besides, physicians are requested to meet accreditation
requirements set by the Ministry of Health by periodically renewing their licenses.
Most book/ journal reading sessions are conducted by the physicians.

89
Table 3.3.2 Weight of six departments
Measures (%) Clinic Physician Nurse Cosmetologist Advisor Administration
Financial 15 4.0 0 0 5.3 21.9
Gross Margin Percentage 7.5 ╳ ╳ ╳ ╳ 14.3
ROI 4.0 ╳ ╳ ╳ ╳ 7.6
Purchase Amount per Patient
per Visit
3.5 4.0 ╳ ╳ 5.3 ╳
Customer 35 39.6 58.4 44.1 48.9 30.5
Patient Repeat Rate 12.0 13.6 20.0 17.6 18.3 ╳
Customer Satisfaction Rate 6.0 6.8 10.0 8.8 9.2 22.9
Patient Referral Rate 4.0 4.5 6.7 5.9 6.1 ╳
Numbers of New Patients 6.0 6.8 10.0 ╳ 9.2 ╳
Adverse Medical Reaction
Rate
4.0 4.5 6.7
╳ ╳
╳
Complaint Rate 3.0 3.4 5.0 8.8 6.1 7.6
Internal Process 35 39.4 20.0 39.8 26.0 22.8
Time of Physician Consultation 5.0 5.6 ╳ ╳ ╳ ╳
Rate of Completing the Deal 5.0 5.6 ╳ 7.4 15.3 ╳
Time to Get an Appointment 8.0 9.0 ╳ 7.4 ╳ 9.5

90
Waiting Time 10.0 11.3 8.3 14.7 ╳ ╳
Dispute Rate 7.0 7.9 11.7 10.3 10.7 13.3
Learning and Growth 15.0 17.1 21.6 19.0 20.0 24.8
Access to Training 6.0 6.8 10.0 8.8 9.2 3.8
Number of Training Courses
Completed
3.0 3.4 5.0 4.4 4.6 3.8
Employee Satisfaction Rate 2.0 2.3 3.3 2.9 3.1 11.5
Staff Turnover 2.0 2.3 3.3 2.9 3.1 5.7
Number of Book/ Journal
Reports
2.0 2.3
╳ ╳ ╳
╳

91
3.3.2 Formulas of the BSC Score of Measures
Formula 1 applies for the following thirteen measures when transforming data
into BSC, including Gross Margin Percentage (GMP), ROI, Purchase Amount per
Patient per Visit, Patient Repeat Rate, Customer Satisfaction Rate, Patient Referral
Rate, Number of New Patients, Time of Physician Consultation, Rate of Striking-a-
Deal, Access to Training, Number of Training Course Completed, Employee
Satisfaction Rate, Number of Book Reports.
Formula 1.
BSC Score of measure = Weight × [𝐷𝑎𝑡𝑎 𝑜𝑓 𝑚𝑒𝑎𝑠𝑢𝑟𝑒−𝐵𝑎𝑠𝑒𝑙𝑖𝑛𝑒 𝑠𝑐𝑜𝑟𝑒 𝑜𝑓 𝑚𝑒𝑎𝑠𝑢𝑟𝑒
𝑇𝑎𝑟𝑔𝑒𝑡 𝑠𝑐𝑜𝑟𝑒 𝑜𝑓 𝑚𝑒𝑎𝑠𝑢𝑟𝑒−𝐵𝑎𝑠𝑒𝑙𝑖𝑛𝑒 𝑠𝑐𝑜𝑟𝑒 𝑜𝑓 𝑚𝑒𝑎𝑠𝑢𝑟𝑒×
100%], |𝐷𝑎𝑡𝑎 𝑜𝑓 𝑚𝑒𝑎𝑠𝑢𝑟𝑒−𝐵𝑎𝑠𝑒𝑙𝑖𝑛𝑒 𝑠𝑐𝑜𝑟𝑒 𝑜𝑓 𝑚𝑒𝑎𝑠𝑢𝑟𝑒
𝑇𝑎𝑟𝑔𝑒𝑡 𝑠𝑐𝑜𝑟𝑒 𝑜𝑓 𝑚𝑒𝑎𝑠𝑢𝑟𝑒−𝐵𝑎𝑠𝑒𝑙𝑖𝑛𝑒 𝑠𝑐𝑜𝑟𝑒 𝑜𝑓 𝑚𝑒𝑎𝑠𝑢𝑟𝑒| ≤ 1
Formula 2 is used for six measures, including Adverse Medical Reaction Rate,
Complaint Rate, Time to Get an Appointment, Waiting Time, Dispute Rate, and Staff
Turnover.
Formula 2.
BSC Score of measure = Weight × [𝐵𝑎𝑠𝑒𝑙𝑖𝑛𝑒 𝑠𝑐𝑜𝑟𝑒 𝑜𝑓 𝑚𝑒𝑎𝑠𝑢𝑟𝑒−𝐷𝑎𝑡𝑎 𝑜𝑓 𝑚𝑒𝑎𝑠𝑢𝑟𝑒
𝐵𝑎𝑠𝑒𝑙𝑖𝑛𝑒 𝑠𝑐𝑜𝑟𝑒 𝑜𝑓 𝑚𝑒𝑎𝑠𝑢𝑟𝑒−𝑇𝑎𝑟𝑔𝑒𝑡 𝑠𝑐𝑜𝑟𝑒 𝑜𝑓 𝑚𝑒𝑎𝑠𝑢𝑟𝑒×
100%], |𝐷𝑎𝑡𝑎 𝑜𝑓 𝑚𝑒𝑎𝑠𝑢𝑟𝑒−𝐵𝑎𝑠𝑒𝑙𝑖𝑛𝑒 𝑠𝑐𝑜𝑟𝑒 𝑜𝑓 𝑚𝑒𝑎𝑠𝑢𝑟𝑒
𝐵𝑎𝑠𝑒𝑙𝑖𝑛𝑒 𝑠𝑐𝑜𝑟𝑒 𝑜𝑓 𝑚𝑒𝑎𝑠𝑢𝑟𝑒−𝑇𝑎𝑟𝑔𝑒𝑡 𝑠𝑐𝑜𝑟𝑒 𝑜𝑓 𝑚𝑒𝑎𝑠𝑢𝑟𝑒| ≤ 1
The final BSC Score of the subject, which encompasses six departments and

92
their staffs, is summed up by nineteen BSC Scores of the measures. We calculated
six BSC scores of both clinics and compared differences after implementing the
mentioned strategies of BSC.
Formula 3
BSC Score of department=∑ BSC Score of measure191
3.3.3 Descriptive Analysis
Descriptive analysis will be used to explain the characteristics of the measures.
The definitive measures (variables) of the BSC will be set once the BSC team
members have reached consensus about the measures. We wanted to test if the
performance is improved with implementing BSC, so we can have our hypotheses
simplified in a more common form:
H ij: the implementation of BSC can help improving (some specific
measure)
Thus we will be able to compare if there are differences between the test group
(with BSC implementation) and the control group (without BSC implementation).
The following are what we will possibly do in data analysis:

93
The frequency of each variable will be presented in the tables and charts for both
clinics.
For nominal data, we will construct a bar graph; and a histogram will be
prepared for displaying the distribution of scores.
To indicate the average and variation of the measures, we adopt sample mean (x ̅)
and standard deviation (S.D.) for the continuous data for both clinics. If the data
is ordinal, the median is used to represent the average and the interquartile range
to represent variability.
Contingency tables will be made to see the differences of proportions among the
subgroups.
The hypothesis tests will be performed to show the difference between the test
clinic and the control clinic. We can perform the two sample t-test assuming
equal variances for all mentioned hypotheses to check if implementing BSC will
improve our performance.
H0: (μ1-μ2) = 0 vs. H1: (μ1-μ2) > 0
t =(𝑥1̅̅̅ − 𝑥2̅̅ ̅) − (𝜇1 − 𝜇2)
√𝑠𝑝2(
1
𝑛1+
1
𝑛2)

94
3.3.4 Correlative Analysis
To test furthermore the relationship between variables of questionnaires, we
will apply χ2 (Chi-square) test to examine the correlation between categorical
variables, and the outcomes. The Chi-squared calculation helps us decide if there is
a statistically significant difference between groups.

95
CHAPTER 4
Results
4.1. Interviewee Characteristics
4.1.1 Employee characteristics
In the study, 15 employees of the test group (or clinic, same below) had
participated in the follow-up interview for six months along with 17 employees of the
control group. The population of all 5 departments is similar between the two
groups. The physicians are all males in the two groups, but in the other four
departments they are almost all females. In the control group, there are one advisor
and one administration staff.
Physicians in the test group are older than the other departments and their
average age is 41.3 year-old. Otherwise, the average age of the other departments is
under 30. Similarly, in the control group, the average age of the physicians is 39.3,
and the average age of the other departments is under 30 as well.
In the test group, the average length of service of physicians, advisors and
administration staff are over two years, among them the physicians’ service time are
the longest. In the control group, the average length of service of physicians and

96
advisors are over two years. As of the length of education, cosmetologists have the
lowest with both groups averaging 13.2 years. Physicians obviously have the
longest with the average of 20.3years in the test group and 19.7 years in the control
group (Table 4.1.1).

97
Table 4.1.1 Employee characteristics between the two groups
Characteristics (N) Physician Nurse Cosmetologist Advisor Administration
Test group (N=15) 3 3 5 3 1
Gender
Male 3 0 0 0 0
Female 0 3 5 3 1
Average age (yrs) 41.3 28.3 27.4 30.7 26.0
Average length of
service (yrs)
2.66 1.66 1.4 2.33 2.0
Average education
(yrs)
20.3 16.0 13.2 16.0 16.0
Control group
(N=17)
3 3 6 3 2
Gender
Male 3 0 0 1 1
Female 0 3 6 2 1
Average age (yrs) 39.3 28.0 28.2 29.7 28.0
Average length of
service (yrs)
2.3 1.3 1.2 2.7 1.5
Average education
(yrs)
19.7 16.0 13.2 16.0 16.0

98
In six months, the research team had interviewed 315 customers of the test
group and 290 of the control group. The majority of customers are female, 71.4% in
the test group and 75.2% in the control group. Male customers are therefore 28.6%
in the test group and 24.8% in the control group. The average age of the customers
in the test group is older than that of the control group, which is 38.8 years in the test
group and 36.7 years in the control group. The average length of education in the
test group is longer than it in the control group, which is 15.1 years compared to 14.7
years in the control group (Table 4.1.2).

99
4.1.2 Customer characteristics
Customer characteristics were summarized in Table 4.1.2

100
Table 4.1.2 Customer characteristics between the two groups
Characteristics (N) Test group Control group
Total 315 290
Gender
Male 90(28.6%) 72(24.8%)
Female 225(71.4%) 218(75.2%)
Average age (yrs) 38.8 36.7
Average education (yrs) 15.1 14.7

101
4.2. BSC Scores between the Two Group by the Four Perspectives
The study has measured both groups with their personnel divided in six
departments- Clinic, Physicians, Nurses, Cosmetologists, Advisors, and
Administration Staff. The data was collected for six months from October, 2014 to
March, 2015. Each department has measured one BSC score per month and we have
calculated six BSC scores.
The following tables and their respective result numbers can test the hypotheses
stated at the beginning of the study in Chapter 1.
Hypothesis 1a (H 1a): the implementation of BSC for a period of time can
help improving lagging indicators such as Gross Margin Percentage.
Hypothesis 1b (H 1b): the implementation of BSC for a period of time can
help improving lagging indicators such as Purchase Amount per Patient (per)
Visit.
Hypothesis 1c (H 1c): the implementation of BSC for a period of time can
help improving lagging indicators such as Return on Investment (ROI).
Hypothesis 1d (H 1d): the implementation of BSC for a period of time can
help improving performance indicators such as Staff Turnover.
Hypothesis 1e (H 1e): the implementation of BSC for a period of time can

102
help improving performance indicators such as Access to Training.
Hypothesis 1f (H 1f): the implementation of BSC for a period of time can
help improving performance indicators such as Employee Satisfaction.
Hypothesis 2a (H 2a): the implementation of BSC for a period of time can
help improving patient care by measures such as decreased Complain Rate.
Hypothesis 2b (H 2b): the implementation of BSC for a period of time can
help improving patient care by measures such as increased Patient Repeat
Rate.
Hypothesis 2c (H 2c): the implementation of BSC for a period of time can
help improving patient care by measures such as increased Patient Referral
Rate.
Hypothesis 2d (H 2d): the implementation of BSC for a period of time can
help improving patient care by measures such as increased Customer
Satisfaction Rate.
Hypothesis 2e (H 2e): the implementation of BSC for a period of time can
help improving patient care by measures such as an adequate amount of Time
of Physician Consultation.

103
Hypothesis 2f (H 2f): the implementation of BSC for a period of time can
help improving patient care by measures such as decreased Waiting Time in
the waiting room.
Hypothesis 2g (H 2g): the implementation of BSC for a period of time can
help improving patient care by measures such as an adequate Time to Get an
Appointment.
Hypothesis 2h (H 2h): the effort of adopting BSC can improve the quality
of medical services, thus be highly valued by customers and also serve as
accreditation criteria by health policy regulators.
The BSC scores of the test group increases from October, 2014 to February,
2015, from 76.7 to 92.3 when we measured the clinic as a unit, but drops on March,
2015 to 88.5. The difference of BSC scores between the two groups range from 18.5
on November 2014 to 29.9 on February 2015. Scores of the Customer Perspective
and Learning and Growth has the largest difference between the two groups (Table
4.2.1, 4.2.2, 4.2.3).

104
Table 4.2.1 BSC scores of the clinics as a unit between the two groups on October
and November 2014 (all hypotheses applicable)
Measures
October 2014 November 2014
Data BSC Score Data BSC Score
Total (Test/ Control) 76.7/54.2 77.4/58.9
Financial 3.3/2.8 5.0/1.0
GMP (%) (H1a) 21.9%/18.7% 0.5/0.0 35.4%/22.7% 3.9/0.7
ROI (%) (H1c) 1.8%/1.9% 2.6/2.8 0.3%/-3.2% 0.4/0.0
Purchase Amount per Patient per Visit
(NTD) (H1b)
5,750/3,527 0.2/0.0 7,850/6,308 0.7/0.3
Customer 23.4/15.9 28.4/17.8
Patient Repeat Rate (%) (H2b) 0.0%/0.0% 0.0/0.0 7.0%/3.0% 4.2/1.8
Customer Satisfaction Rate (%) (H2d) 88.0%/84.0% 6.4/3.2 90.0%/85% 8.0/4.0
Patient Referral Rate (%) (H2c) 10.0%/5.0% 6.0/6.0 14.0%/8.0% 6.0/6.0
Number of New Patients (N) 25/23 4.0/3.7 35/32 4.0/4.0
Adverse Medical Reaction Rate (%) 7.0%/8.0% 3.0/3.0 6.0%/8.0% 3.0/2.0
Complaint Rate (%) (H2a) 18.0%/28% 4.0/0.0 16.0%/26.0% 3.2/0.0
Internal Process 35/30.2 35.0/33.4
Time of Physician Consultation
(Minutes) (H2e)
10/7 8.0/3.2 18/9 8.0/6.4
Rate of Completing the Deal (%) 57.0%/55.0% 10.0/10.0 65.0%/57.0% 10.0/10.0
Time to Get an Appointment (Days)
(H2g)
2.2/2.5 5.0/5.0
2.1/1.7 5.0/5.0
Waiting Time (Minutes) (H2f) 35/45 5.0/5.0 33/40 5.0/5.0

105
Dispute Rate (%) 10.0%/17.0% 7.0/7.0 10.0%/15.0% 7.07.0
Learning and Growth 15.0/5.4 9.0/6.8
Access to Training (%) (H1e) 100.0%/0.0% 2.0/0.0 0.0%/0.0% 0.0/0.0
Number of Training Courses
Completed (N)
1/0 2.0/0.0 0/0 0.0/0.0
Employee Satisfaction Rate (%) (H1f) 79.0%/72% 6.0/2.4 88.0%/75% 6.0/3.8
Staff Turnover (%) (H1d) 0.0%/0.0% 3.0/3.0 0.0%/0.0% 3.0/3.0
Number of Book/ Journal Reports 1/0 2.0/0.0 0/0 0.0/0.0

106
Table 4.2.2 BSC scores of the clinics as a unit between the two groups on
December 2014 and January 2015 (all hypotheses applicable)
Measures
December 2014 January 2015
Data BSC Score Data BSC Score
Total (Test/ Control) 83.7/50 90.7/56
Financial 7.3/0.0 10.2/2.8
GMP (%) (H1a) 40.1%/18.1% 5.0/0.0 45.3%/23.5% 6.3/0.9
ROI (%) (H1c) 1.2%/-0.7% 1.7/0.0 2.1%/1.3% 3.1/1.9
Purchase Amount per Patient per
Visit (NTD) (H1b)
7,133/3,892 0.5/0.0 8,345/4,125 0.8/0.0
Customer 29.4/14.4 30.6/17.2
Patient Repeat Rate (%) (H2b) 15.0%/8.0% 4.5/2.4 25.0%/12.0% 5.0/2.4
Customer Satisfaction Rate (%)
(H2d)
93.0%/83.0% 10.4/2.4 93.0%/87.0% 10.4/5.6
Patient Referral Rate (%) (H2c) 14.0%/5.0% 6.0/3.8 16.0%/7.0% 6.0/3.5
Number of New Patients (N) 28/20 4.0/3.2 33/21 4.0/3.4
Adverse Medical Reaction Rate (%) 4.0%/6.0% 3.0/2.7 4.0%/6.0% 3.0/2.0
Complaint Rate (%) (H2a) 17.0%/21% 1.5/0.0 14.0%/19.0% 2.2/0.4
Internal Process 35/31.8 35/27.2
Time of Physician Consultation
(Minutes) (H2e)
18/11 8.0/4.8 22/8 8.0/1.6
Rate of Completing the Deal (%) 63.0%/51.0% 10.0/10.0 73.0%/59.0% 10.0/10.0
Time to Get an Appointment (Days)
(H2g)
1.8/2.1 5.0/5.0 1.7/1.8 5.0/5.0
Waiting Time (Minutes) (H2f) 27/35 5.0/5.0 25/28 5.0/5.0

107
Dispute Rate (%) 6.0%/11.0% 7.0/7.0 7.0%/12.0% 7.0/5.6
Learning and Growth 12/3.8 15/8.9
Access to Training (%) (H1e) 100.0%/0.0% 2.0/0.0 100.0%/0.0% 2.0/0.0
Number of Training Courses
Completed (N)
1/0 2.0/0.0 3/0 2.0/0.0
Employee Satisfaction Rate (%)
(H1f)
86.0%/77.0% 6.0/3.8 85.0%/79.0% 6.0/3.9
Staff Turnover (%) (H1d) 25.0%/33.0% 0.0/0.0 5.0%/8.0% 3.0/3.0
Number of Book/ Journal Reports 1/0 2.0/0.0 1/1 2.0/2.0

108
Table 4.2.3 BSC scores of the clinics as a unit between the two groups on
February and March 2015 (all hypotheses applicable)
Measures
February 2015 March 2015
Data BSC Score Data BSC Score
otal (Test/ Control) 92.3/62.4 88.5/55.7
Financial 11.2/3.2 12.4/3.6
GMP (%) (H1a) 45.8%/24.6% 6.5/1.2 47.3%/25.7% 6.8
ROI (%) (H1c) 2.5%/1.4% 3.6/2.0 3.2%/1.5% 4.0
Purchase Amount per Patient per
Visit (NTD) (H1b)
9,566/4,539 1.1/0.0 11,667/4,778 1.6
Customer 32.1/19.9 31/19.7
Patient Repeat Rate (%) (H2b) 37.0%/15.0% 5.6/2.3 43.0%22.0% 5.2/2.6
Customer Satisfaction Rate (%)
(H2d)
95.0%/89% 12.0/7.2 96.0%88.0% 12.0/6.4
Patient Referral Rate (%) (H2c) 18.0%/10.0% 6.0/3.8 17.0%/13.0% 5.1/3.9
Number of New Patients (N) 38/28 4.0/4.0 41/26 4.0/4.0
Adverse Medical Reaction Rate (%) 4.0%/4.0% 2.4/2.4 3.0%/5.0% 2.3/1.7
Complaint Rate (%) (H2a) 13.0%/19.0% 2.2/0.3 11.0%/16.0% 2.4/1.1
Internal Process 34.7/28.4 31.3/23.9
Time of Physician Consultation
(Minutes) (H2e)
25/10 8.0/2.0 23/10 5.8/1.6
Rate of Completing the Deal (%) 71.0%/63% 10.0/10.0 69.0%/57% 9.8/6.8
Time to Get an Appointment (Days)
(H2g)
1.7/2.3 5.0/4.7 2.3/2.1 4.7/4.9
Waiting Time (Minutes) (H2f) 21/25 5.0/5.0 18/20 5.0/5.0

109
Dispute Rate (%) 8.0%/8.0% 6.7/6.7 7.0%/8.0% 6.1/5.6
Learning and Growth 14.3/10.9 13.8/8.6
Access to Training (%) (H1e) 100.0%/100.0% 2.0/2.0 100.0%/0.0% 2.0/0/0
Number of Training Courses
Completed (N)
2/1 2.0/2.0 1/0 2.0/0.0
Employee Satisfaction Rate (%)
(H1f)
85.0%/81.0% 5.3/3.9 86.0%/82% 4.8/3.6
Staff Turnover (%) (H1d) 4.0%/7.0% 3.0/3.0 4.0%/7.0% 3.0/3.0
Number of Book/ Journal Reports 1/0 2.0/0.0 1/1 2.0/2.0

110
Among physicians, the BSC score of the test group increases from October
2014 to January 2015, from 78.6 to 93.0, but drops to 84.5 on March 2015. The
difference of BSC scores between the two groups range from 16.8 on November 2014
to 32.5 on January 2015. Score of the Customer and Learning and Growth
Perspectives have the largest difference between the two groups (Table 4.2.4, 4.2.5,
4.2.6).

111
Table 4.2.4 BSC scores of physicians between the two groups on October and
November 2014 (all hypotheses applicable)
Measures
October 2014 November 2014
Data BSC Score Data BSC Score
Total (Test/ Control) 78.6/56.7 82.6/65.8
Financial 0.2/0.0 0.8/0.3
Purchase Amount per Patient per
Visit (NTD) (H1b)
5,750/3,527 0.2/0.0 7,850/6,308 0.8/0.3
Customer 21.9/17.9 32.2/20.5
Patient Repeat Rate (%) (H2b) 0.0%/0.0% 0.0/0.0 7.0%3.0% 4.7/2.0
Customer Satisfaction Rate (%)
(H2d)
88.0%/84.0% 7.2 /3.6 90.0%/85.0% 9.0/4.5
Patient Referral Rate (%) (H2c) 10.0%/5.0% 6.8/6.8 14.0%/8.0% 6.8/6.8
Number of New Patients (N) 25/23 4.5/4.2 35/32 4.5/4.5
Adverse Medical Reaction Rate (%) 2.4%/2.2% 3.4/3.4 2.2%/2.3% 3.0/2.6
Complaint Rate (%) (H2a) 4.0%/6.3% 0.0/0.0 3.1%/5.4% 4.1/0.0
Internal Process 39.5/34.1 39.5/37.7
Time of Physician Consultation
(Minutes) (H2e)
10/7 9.0/3.6 18/9 9.0/7.2
Rate of Completing the Deal (%) 57.0%/55.0% 11.3/11.3 65.0%/57.0% 11.3/11.3
Time to Get an Appointment (Days)
(H2g)
2.2/2.5 5.6/5.6 2.1/1.7 5.6/5.6
Waiting Time (Minutes) (H2f) 35/45 5.6/5.6 33/40 5.6/5.6
Dispute Rate (%) 3.1%/3.5% 7.9/7.9 1.9%/2.9% 7.9/7.9

112
Learning and Growth 16.9/4.6 10.2/7.2
Access to Training (%) (H1e) 100.0%/0.0% 2.3/0.0 0.0%/0.0% 0.0/0.0
Number of Training Courses
Completed (N)
1/0 2.3/0.0 0/0 0.0/0.0
Employee Satisfaction Rate (%)
(H1f)
78.5%/70.9% 6.8/1.2 86.1%/74.5% 6.8/3.8
Staff Turnover (%) (H1d) 0.0%/0.0% 3.4/3.4 0.0%/0.0% 3.4/3.4
Number of Book/ Journal Reports 1/0 2.3/0.0 0/0 0.0/0.0

113
Table 4.2.5 BSC scores of physicians between the two groups on December 2014
and January 2015 (all hypotheses applicable)
Measures
December 2014 January 2015
Data BSC Score Data BSC Score
Total (Test/ Control) 88.0/56.1 93.0/60.5
Financial 0.6/0.0 0.9/0.0
Purchase Amount per Patient per
Visit (NTD) (H1b)
7,133/3,892 0.6/0.0 8,345/4,125 0.9/0.0
Customer 34.4/15.3 35.6/20.7
Patient Repeat Rate (%) (H2b) 15.0%/8.0% 5.1/2.7 25.0%/12.0% 5.6/2.7
Customer Satisfaction Rate (%)
(H2d)
93.0%/83.0% 11.8/2.7 93.0%/87.0% 11.8/6.3
Patient Referral Rate (%) (H2c) 14.0%/5.0% 6.8/4.2 16.0%/7.0% 6.8/4.0
Number of New Patients (N) 28/20 4.5/3.6 33/21 4.5/3.8
Adverse Medical Reaction Rate (%) 1.0%/2.4% 3.4/1.5 1.1%/1.7% 3.4/2.4
Complaint Rate (%) (H2a) 3.0%/3.8% 2.8/0.6 2.3%/3.3% 3.5/1.4
Internal Process 39.5/35.9 39.5/29.9
Time of Physician Consultation
(Minutes) (H2e)
18/11 9.0/5.4 22/8 9.0/1.8
Rate of Completing the Deal (%) 63.0%/51.0% 11.3/11.3 73.0%/59.0% 11.3/11.3
Time to Get an Appointment (Days)
(H2g)
1.8/2.1 5.6/5.6 1.7/1.8 5.6/5.6
Waiting Time (Minutes) (H2f) 27/35 5.6/5.6 25/28 5.6/5.6
Dispute Rate (%) 1.1%/2.1% 7.9/7.9 1.5%/2.6% 7.9/5.5
Learning and Growth 13.6/4.8 16.9/9.9

114
Access to Training (%) (H1e) 100.0%/0.0% 2.3/0.0 100.0%/0.0% 2.3/0.0
Number of Training Courses
Completed (N)
1/0 2.3/0.0 3/0 2.3/0.0
Employee Satisfaction Rate (%)
(H1f)
87.3%/77.8% 6.8/4.8 84.4%/78.8% 6.8/4.3
Staff Turnover (%) (H1d) 25.0%/33.0% 0.0/0.0 5.0%/8.0% 3.4/3.4
Number of Book/ Journal Reports 1/0 2.3/0.0 1/1 2.3/2.3
‘

115
Table 4.2.6 BSC scores of physicians between the two group on February and
March 2015 (all hypotheses applicable)
Measures
February 2015 March 2015
Data
BSC
Score
Data
BSC
Score
Total (Test/ Control) 92.2/68.7 84.5/57.7
Financial 1.2/0.0 1.8/0.0
Purchase Amount per Patient per
Visit (NTD) (H1b)
9,566/4,539 1.2/0.0 11,667/4,778 1.8/0.0
Customer 35.8/23.0 34.6/21.8
Patient Repeat Rate (%) (H2b) 37.0%/15.0% 6.3/2.5 43.0%/22.0% 5.8/3.0
Customer Satisfaction Rate (%)
(H2d)
95.0%/89.0% 13.6/8.1 96.0%/88.0% 13.6/7.2
Patient Referral Rate (%) (H2c) 18.0%/10.0% 6.8/4.2 17.0%/13.0% 5.8/4.4
Number of New Patients (N) 38/28 4.5/4.5 41/26 4.5/4.5
Adverse Medical Reaction Rate (%) 1.3%/0.5% 2.6/3.4 1.0%/0.9% 2.5/2.6
Complaint Rate (%) (H2a) 2.8%/3.9% 2.1/0.2 2.4%/4.4% 2.4/0.0
Internal Process 39.2/31.5 34.3/26.4
Time of Physician Consultation
(Minutes) (H2e)
25/10 9.0/2.3 23/10 6.5/1.8
Rate of Completing the Deal (%) 71.0%/63.0% 11.3/11.3 69.0%/57.0% 11.0/7.6
Time to Get an Appointment (Days)
(H2g)
1.7/2.3 5.6/5.3 2.3/2.1 5.3/5.5
Waiting Time (Minutes) (H2f) 21/25 5.6/5.6 18/20 5.6/5.6
Dispute Rate (%) 1.6%/1.8% 7.6/7.0 1.8%/1.8% 5.8/5.8

116
Learning and Growth 16.0/14.3 13.9/9.5
Access to Training (%) (H1e) 100.0%/100.0% 2.3/2.3 100.0%/0.0% 2.3/0.0
Number of Training Courses
Completed (N)
2/1 2.3/2.3 1/0 2.3/0.0
Employee Satisfaction Rate (%)
(H1f)
84.6%/85.9% 5.8/6.3 81.0%/81.3% 3.7/3.8
Staff Turnover (%) (H1d) 4.0%/7.0% 3.4/3.4 4.0%/7.0% 3.4/3.4
Number of Book/ Journal Reports 1/0 2.3/0.0 1/1 2.3/2.3

117
For the nurses of the clinic in the test group, the BSC score increases from
October 2014 to February 2015, from 80.7 to 96.3, but drops on March 2015 to 88.8.
The difference of BSC scores between the two groups range from 26.4 on October
2014 to 51.0 on December 2014. Scores of the Customer and Learning and Growth
Perspectives have the largest difference between the two groups (Table 4.2.7, 4.2.8,
4.2.9).

118
Table 4.2.7 BSC scores of nurses between the two groups on October and
November 2014 (all hypotheses applicable)
Measures
October 2014 November 2014
Data BSC Score Data BSC Score
Total (Test/ Control) 80.7/54.3 83.7/52.8
Customer 39.0/26.4 48.7/29.4
Patient Repeat Rate (%) (H2b) 0.0%/0.0% 0.0/0.0 7.0%/3.0% 7.0/3.0
Customer Satisfaction Rate (%)
(H2d)
88.0%84.0% 10.7/5.3 90.0%/85.0% 13.3/6.7
Patient Referral Rate (%) (H2c) 10.0%/5.0% 10.0/10.0 14.0%/8.0% 10.0/10.0
Number of New Patients (N) 25/23 6.7/6.1 35/32 6.7/6.7
Adverse Medical Reaction Rate (%) 4.6%/5.8% 5.0/5.0 3.8%/5.7% 5.0/3.1
Complaint Rate (%) (H2a) 0.8%/1.3% 6.7/0.0 0.7%/1.4% 6.7/0.0
Internal Process 20.0/20.0 20.0/8.3
Waiting Time (Minutes) (H2f) 35/45 8.3/8.3 33/40 8.3/8.3
Dispute Rate (%) 0.5%/1.0% 11.7/11.7 0.6%//2.2% 11.7/0.0
Learning and Growth 21.7/20.0 15.0/15.0
Access to Training (%) (H1e) 100.0%/0.0% 3.3/0.0 0.0%/0.0% 0.0/0.0
Number of Training Courses
Completed (N)
1/0 3.3/0.0 0/0 0.0/0.0
Employee Satisfaction Rate (%)
(H1f)
79.3%/71.4% 10.0/2.8 85.8%/79.1% 10.0/10.0
Staff Turnover (%) (H1d) 0.0%/0.0% 5.0/5.0 0.0%/0.0% 5.0/5.0

119
Table 4.2.8 BSC scores of nurses between the two groups on December 2014 and
January 2015 (all hypotheses applicable)
Measures
December 2014 January 2015
Data BSC Score Data BSC Score
Total (Test/ Control) 89.8/38.8 92.1/56.5
Customer 53.2/24.6 52.1/27.9
Patient Repeat Rate (%) (H2b) 15.0%/8.0% 7.5/4.0 25.0%/12.0% 8.3/4.0
Customer Satisfaction Rate (%)
(H2d)
93.0%/83.0% 17.3/4.0 93.0%/87.0% 17.3/9.3
Patient Referral Rate (%) (H2c) 14.0%/5.0% 10.0/6.3 16.0%/7.0% 10.0/5.8
Number of New Patients (N) 28/20 6.7/5.3 33/21 6.7/5.6
Adverse Medical Reaction Rate (%) 3.0%/3.6% 5.0/5.0 2.9%/4.3% 4.9/3.2
Complaint Rate (%) (H2a) 0.5%/2.2% 6.7/0.0 0.6%/2.3% 4.8/0.0
Internal Process 8.3/8.0 18.3/16.7
Waiting Time (Minutes) (H2f) 27/35 8.3/8.0 25/28 8.3/8.3
Dispute Rate (%) 0.3%/1.7% 11.7/0.0 0.8%/0.9% 10.0/8.3
Learning and Growth 16.7/5.9 21.7/11.9
Access to Training (%) (H1e) 100.0%/0.0% 3.3/0.0 100.0%/0.0% 3.3/0.0
Number of Training Courses
Completed (N)
1/0 3.3/0.0 3/0 3.3/0.0
Employee Satisfaction Rate (%)
(H1f)
86.1%/76.5% 10.0/5.9 85.1%/79.6% 10.0/6.9
Staff Turnover (%) (H1d) 25.0%/33.0% 0.0/0.0 5.0%/8.0% 5.0/5.0

120
Table 4.2.9 BSC scores of nurses between the two group on February and March
2015 (all hypotheses applicable)
Measures
February 2015 March 2015
Data
BSC
Score
Data
BSC
Score
Total (Test/ Control) 96.3/65.4 88.8/60.0
Customer 55.1/32.0 47.7/31.4
Patient Repeat Rate (%) (H2b) 37.0%/15.0% 9.3/3.8 43.0%/22.0% 8.6/4.4
Customer Satisfaction Rate (%)
(H2d)
95.0%/89.0% 20.0/12.0 96.0%/88.0% 20.0/10.7
Patient Referral Rate (%) (H2c) 18.0%/10.0% 10.0/6.3 17.0%/13.0% 8.5/6.5
Number of New Patients (N) 38/28 6.7/6.7 41/26 6.7/6.7
Adverse Medical Reaction Rate (%) 2.7%/3.5% 4.1/3.3 2.0%/4.1% 4.0/2.3
Complaint Rate (%) (H2a) 0.5%/2.4% 5.1/0.0 1.2%/0.9% 0.0/0.9
Internal Process 20.0/16.3 19.4/17.2
Waiting Time (Minutes) (H2f) 21/25 8.3/8.3 18/20 8.3/8.3
Dispute Rate (%) 0.2%/0.8% 11.7/8.0 0.4%/0.6% 11.1/8.9
Learning and Growth 21.1/17.1 21.7/11.4
Access to Training (%) (H1e) 100.0%/100.0% 3.3/3.3 100.0%/0.0% 3.3/0.0
Number of Training Courses
Completed (N)
2/1 3.3/3.3 1/0 3.3/0.0
Employee Satisfaction Rate (%)
(H1f)
86.1%/79.2% 9.5/5.4 90.3%/82.8% 10.0/6.4
Staff Turnover (%) (H1d) 4.0%/7.0% 5.0/5.0 4.0%/7.0% 5.0/5.0

121
For the cosmetologists in the test group, the BSC score increases from October
2014 to March 2015, from 77.1 to 93.0. The difference of BSC scores between the
two groups range from 10.7 on October 2014 to 33.9 on March 2015. Scores of
Customer Perspective has the largest difference between the two groups (Table 4.2.10,
4.2.11, 4.2.12).

122
Table 4.2.10 BSC scores of cosmetologists between the two groups on October
and November 2014 (all hypotheses applicable)
Measures
October 2014 November 2014
Data BSC Score Data BSC Score
Total (Test/ Control) 77.1/64.4 85.6/66.8
Customer 18.2/13.5 32.6/17.4
Patient Repeat Rate (%) (H2b) 0.0%/0.0% 0.0/0.0 7.0%/3.0% 6.2/2.6
Customer Satisfaction Rate (%)
(H2d)
88.0%/84.0% 9.4/4.7 90.0%/85% 11.8/5.9
Patient Referral Rate (%) (H2c) 10.0%/5.0% 8.8/8.8 14.0%/8.0% 8.8/8.8
Complaint Rate (%) (H2a) 4.1%/5.0% 0.0/0.0 2.5%/5.4% 5.9/0.0
Internal Process 39.7/39.7 39.7/39.7
Rate of Completing the Deal (%) 57.0%/55.0% 14.7/14.7 65.0%/57.0% 14.7/14.7
Time to Get an Appointment (Days)
(H2g)
2.2/2.5 7.4/7.4 2.1/1.7 7.4/7.4
Waiting Time (Minutes) (H2f) 35/45 7.4/7.4 33/40 7.4/7.4
Dispute Rate (%) 1.3%/3.4% 10.3/10.3 2.0%/2.8% 10.3/10.3
Learning and Growth 19.1/11.1 13.2/9.7
Access to Training (%) (H1e) 100.0%/0.0% 2.9/0.0 0.0%/0.0% 0.0/0.0
Number of Training Courses
Completed (N)
1/0 2.9/0.0 0/0 0.0/0.0
Employee Satisfaction Rate (%)
(H1f)
80.1%/73.8% 8.8/6.7 88.9%/74.8% 8.8/5.3
Staff Turnover (%) (H1d) 0.0%/0.0% 4.4/4.4 0.0%/0.0% 4.4/4.4

123
Table 4.2.11 BSC scores of cosmetologists between the two groups on December,
2014 and January, 2015 (all hypotheses applicable)
Measures
December 2014 January 2015
Data BSC Score Data BSC Score
Total (Test/ Control) 85.1/58.8 92.4/63.1
Customer 30.7/12.6 33.6/19.3
Patient Repeat Rate (%) (H2b) 15.0%/8.0% 6.6/3.5 25.0%/12.0% 7.4/3.5
Customer Satisfaction Rate (%)
(H2d)
93.0%/83.0% 15.3/3.5 93.0%/87.0% 15.3/8.2
Patient Referral Rate (%) (H2c) 14.0%/5.0% 8.8/5.5 16.0%/7.0% 8.8/5.1
Complaint Rate (%) (H2a) 4.0%/4.0% 0.0/0.0 3.2%/3.1% 2.1/2.4
Internal Process 39.7/39.7 39.7/34.0
Rate of Completing the Deal (%) 63.0%/51.0% 14.7/14.7 73.0%/59.0% 14.7/14.7
Time to Get an Appointment (Days)
(H2g)
1.8/2.1 7.4/7.4 1.7/1.8 7.4/7.4
Waiting Time (Minutes) (H2f) 27/35 7.4/7.4 25/28 7.4/7.4
Dispute Rate (%) 1.5%/2.1% 10.3/10.3 1.2%/3.1% 10.3/4.6
Learning and Growth 14.7/6.5 19.1/9.8
Access to Training (%) (H1e) 100.0%/0.0% 2.9/0.0 100.0%/0.0% 2.9/0.0
Number of Training Courses
Completed (N)
1/0 2.9/0.0 3/0 2.9/0.0
Employee Satisfaction Rate (%)
(H1f)
87.7%/78.1% 8.8/6.5 86.2%/78.5% 8.8/5.4
Staff Turnover (%) (H1d) 25.0%/33.0% 0.0/0.0 5.0%/8.0% 4.4/4.4

124
Table 4.2.12 BSC scores of cosmetologists between the two groups on February
and March 2015 (all hypotheses applicable)
Measures
February 2014 March 2015
Data BSC Score Data BSC Score
Total (Test/ Control) 91.0/76.1 93.0/59.1
Customer 36.7/20.1 37.0/21.0
Patient Repeat Rate (%) (H2b) 37.0%/15.0% 8.2/3.3 43.0%/22.0% 7.6/3.9
Customer Satisfaction Rate (%)
(H2d)
95.0%/89.0%
17.6/10.6
96.0%/88.0% 17.6/9.4
Patient Referral Rate (%) (H2c) 18.0%/10.0% 8.8/5.5 17.0%/13.0% 7.5/5.7
Complaint Rate (%) (H2a) 3.1%/3.7% 2.0/0.7 1.8%/3.0% 4.3/2.0
Internal Process 35.6/39.3 37.2/27.6
Rate of Completing the Deal (%) 71.0%/63.0% 14.7/14.7 69..0%/57.0% 14.3/9.9
Time to Get an Appointment (Days)
(H2g)
1.7/2.3 7.4/6.9 2.3/2.1 6.9/7.2
Waiting Time (Minutes) (H2f) 21/25 7.4/7.4 18/20 7.4/7.4
Dispute Rate (%) 2.5%/1.2% 6.2/10.3 1.5%/3.1% 8.6/3.1
Learning and Growth 18.8/16.8 18.7/10.5
Access to Training (%) (H1e) 100.0%/100.0% 2.9/2.9 100.0%/0.0% 2.9/0.0
Number of Training Courses
Completed (N)
2/1 2.9/2.9 1/0 2.9/0.0
Employee Satisfaction Rate (%)
(H1f)
86.3%/82.5% 8.5/6.5 89.1%/83.9% 8.4/6.1
Staff Turnover (%) (H1d) 4.0%/7.0% 4.4/4.4 4.0%/7.0% 4.4/4.4

125
For the advisors in the test group, the BSC score increases from October 2014 to
February 2015, from 77.2 to 93.3, but drops on March, 2015 to 87.5. The difference
of BSC scores between the two groups range from 21.1 on November 2014 to 33.4 on
January 2015. Scores of the Financial and Learning and Growth Perspectives have
the largest differences between the two groups (Table 4.1.13, 4.1.14, 4.1.15).

126
Table 4.2.13 BSC scores of advisors between the two groups on October and
November 2014 (all hypotheses applicable)
Measures
October 2014 November 2014
Data BSC Score Data BSC Score
Total (Test/ Control) 77.2/54.6 76.8/55.7
Financial 0.3/0.0 1.0/0.5
Purchase Amount per Patient per
Visit (NTD) (H1b)
5750/3,527 0.3/0.0 7850/6,308 1.0/0.5
Customer 31.1/19.7 36.1/24.1
Patient Repeat Rate (%) 0.0%/0.0% 0.0/0.0 7.0%/3.0% 6.4/2.7
Customer Satisfaction Rate (%) 88.0%/84.0% 9.8/4.9 90.0%/85.0% 12.2/6.1
Patient Referral Rate (%) 10.0%/5.0% 9.2/9.2 14.0%/8.0% 9.2/9.2
Increase Numbers of New Patient (N) 25/23 6.1/5.6 35/32 6.1/6.1
Complaint Rate (%) 8.3%/13.9% 6.1/0.0 9.1%/12.2% 2.2/0.0
Internal Process 26.0/26.0 26.0/26.0
Rate of Completing the Deal (%) 57.0%/55.0% 15.3/15.3 65.0%/57.0% 15.3/15.3
Dispute Rate (%) 4.8%/8.2% 10.7/10.7 4.7%/6.1% 10.7/10.7
Learning and Growth 19.8/9.0 13.7/5.2
Access to Training (%) 100.0%/0.0% 3.1/0.0 0.0%/0.0% 0.0/0.0
Number of Training Courses
Completed (N)
1/0 3.1/0.0 0/0 0.0/0.0
Employee Satisfaction Rate (%) 80.4%/72.4% 9.2/4.4 90.1%/70.5% 9.2/0.6
Staff Turnover (%) 0.0%/0.0% 4.6/4.6 0.0%/0.0% 4.6/4.6

127
Table 4.2.14 BSC scores of advisors between the two group on December 2014
and January 2015 (all hypotheses applicable)
Measures
December 2014 January 2015
Data BSC Score Data BSC Score
Total (Test/ Control) 82.4/50.6 89.1/55.7
Financial 0.8/0.0 1.2/0.0
Purchase Amount per Patient per
Visit (NTD)
7,133/3,892 0.8/0.0 8,345/4,125 1.2/0.0
Customer 40.5/18.7 42.1/23.6
Patient Repeat Rate (%) (H2b) 15.0 %/8.0% 6.9/3.7 25.0%/12.0% 7.6/3.7
Customer Satisfaction Rate (%)
(H2d)
93.0%/83.0% 15.9/3.7 93.0%/87.0% 15.9/8.5
Patient Referral Rate (%) (H2c) 14.0%/5.0% 9.2/5.7 16.0%/7.0% 9.2/5.3
Number of New Patients (N) 28/20 6.1/4.9 33/21 6.1/5.1
Complaint Rate (%) (H2a) 8.4%/9.5% 2.4/0.8 7.0%/9.2% 3.3/0.9
Internal Process 26.0/26.0 26.0/25.7
Rate of Completing the Deal (%) 63.0%/51.0% 15.3/15.3 73.0%/59.0% 15.3/15.3
Dispute Rate (%) 3.0%/4.0% 10.7/10.7 3.0%/5.1% 10.7/10.7
Learning and Growth 15.3/5.9 19.8/9.6
Access to Training (%) (H1e) 100.0%/0.0% 3.1/0.0 100.0%/0.0% 3.1/0.0
Number of Training Courses
Completed (N)
1/0 3.1/0.0 3/0 3.1/0.0
Employee Satisfaction Rate (%)
(H1f)
84.4%/77.1% 9.2/5.9 84.5%/77.7% 9.2/5.0
Staff Turnover (%) (H1d) 25.0%/33.0% 4.6/0.0 5.0%/8.0% 4.6/4.6

128
Table 4.2.15 BSC scores of advisors between the two groups on February and
March 2015 (all hypotheses applicable)
Measures
February 2015 March 2015
Data
BSC
Score
Data
BSC
Score
Total (Test/ Control) 93.3/65.3 87.5/58.5
Financial 1.6/0.0 2.4/0.0
Purchase Amount per Patient per
Visit (NTD)
9,566/4,539 1.6/0.0 11,667/4,778 2.4/0.0
Customer 46.6/28.6 44.6/28.5
Patient Repeat Rate (%) (H2b) 37.0 %/15% 8.5/3.4 43.0%/22.0% 7.9/1.0
Customer Satisfaction Rate (%)
(H2d)
95.0%/89.0% 18.3/11.0 96.0%/88.0% 18.3/9.8
Patient Referral Rate (%) (H2c) 18.0%/10.0% 9.2/5.7 17.0%/13.0% 7.8/6.0
Number of New Patients (N) 38/28 6.1/6.1 41/26 6.1/6.1
Complaint Rate (%) (H2a) 5.2%/7.5% 4.5/2.3 4.5%/6.8% 4.5/2.6
Internal Process 26.0/26.0 25.3/21.0
Rate of Completing the Deal (%) 71.0%/63.0% 15.3/15.3 69.0%/57.0% 14.9/10.3
Dispute Rate (%) 3.0%/3.3% 10.7/10.7 2.7%/2.3% 10.4/10.7
Learning and Growth 18.2/10.7 15.2/9.1
Access to Training (%) (H1e) 100.0%/100.0% 3.1/3.1 100.0%/0.0% 3.1/0.0
Number of Training Courses
Completed (N)
2/1 3.1/3.1 1/0 3.1/0.0
Employee Satisfaction Rate (%)
(H1f)
83.9%/70.1% 7.5/0.1 79.9%/79.8% 4.5/4.5
Staff Turnover (%) (H1d) 4.0%/3.3% 4.6/4.6 4.0%/7.0% 4.6/4.6

129
For the administration staff, the difference of BSC scores between the two
groups range from 11.7 on March 2015 to 38.7 on December 2014. Scores of
Financial and Learning and Growth Perspectives have the largest differences between
the two groups (Table 4.1.16, 4.1.17, 4.1.18).

130
Table 4.2.16 BSC scores of the administration staff between the two groups on
October and November 2014 (all hypotheses applicable)
Measures
October 2014 November 2014
Data BSC Score Data BSC Score
Total (Test/ Control) 61.1/23.9 42.5/21.2
Financial 5.9/5.3 8.2/1.3
GMP (%) (H1a) 21.9%/18.7% 0.9/0.0 35.4%/22.7% 7.3/1.3
ROI (%) (H1c) 1.8%/1.9% 5.0/5.3 0.3%/-3.2% 0.8/0.0
Customer 7.6/0.0 7.6/0.0
Complaint Rate (%) (H2a) 0.8%/1.5% 7.6/0.0 0.6%/1.6% 7.6/0.0
Internal Process 22.9/9.5 9.5/9.5
Time to Get an Appointment (Days)
(H2g)
2.2/2.5 9.5/9.5 2.1/1.7 9.5/9.5
Dispute Rate (%) 0.3%/0.9% 13.3/0.0 0.8%/1.0% 0.0/0.0
Learning and Growth 24.8/9.1 17.1/10.4
Access to Training (%) (H1e) 100.0%/0.0% 3.8/0.0 0.0%/0.0% 0.0/0.0
Number of Training Courses
Completed (N)
1/0 3.8/0.0 0/0 0.0/0.0
Employee Satisfaction Rate (%)
(H1f)
78.9%/71.5% 11.4/3.4 87.3%/73.3% 11.4/4.7
Staff Turnover (%) (H1d) 0.0%/0.0% 5.7/5.7 0.0%/0.0% 5.7/5.7

131
Table 4.2.17 BSC scores of the administration staff between the two groups on
December 2014 and January 2015 (all hypotheses applicable)
Measures
December 2014 January 2015
Data BSC Score Data BSC Score
Total (Test/Control) 54.8/16.1 58.0/42.1
Financial 12.9/0.0 17.9/5.3
GMP (%) (H1a) 40.1%/18.1% 9.6/0.0 45.3%/23.5% 12.0/1.7
ROI (%) (H1c) 1.2%/-0.7% 3.3/0.0 2.1%/1.3% 5.8/3.6
Customer 0.0/0.0 1.4/0.0
Complaint Rate (%) (H2a) 1.1%/1.5% 0.0/0.0 0.9%/1.1% 1.4/0.0
Internal Process 22.9/9.5 14.0/22.9
Time to Get an Appointment (Days)
(H2g)
1.8/2.1 9.5/9.5 1.7/1.8 9.5/9.5
Dispute Rate (%) 0.1%/1.1% 13.3/0.0 0.5%/0.3% 4.4/13.3
Learning and Growth 19.0/6.5 24.8/14.0
Access to Training (%) (H1e) 100.0%/0.0% 3.8/0.0 100.0%/0.0% 3.8/0.0
Number of Training Courses
Completed (N)
1/0 3.8/0.0 3/0 3.8/0.0
Employee Satisfaction Rate (%)
(H1f)
85.9%/76.3% 11.4/6.5 88.0%/80.1% 11.4/8.2
Staff Turnover (%) (H1d) 25.0%/33.0% 0.0/0.0 5.0%/8.0% 5.7/5.7

132
Table 4.2.18 BSC scores of the administration staff between the two groups on
February and March 2015 (all hypotheses applicable)
Measures
February 2015 March 2015
Data BSC Score Data BSC Score
Total (Test/Control) 52.2/36.5 52.8/41.1
Financial 19.2/6.1 20.6/6.9
GMP (%) (H1a) 45.8%/24.6% 12.3/2.2 47.3%/25.7% 13.0/2.7
ROI (%) (H1c) 2.5%/1.4% 6.9/3.9 3.2%/1.5% 7.6/4.2
Customer 0.0/0.0 0.0/1.0
Complaint Rate (%) (H2a) 1.4%/1.5% 0.0/0.0 1.1%/0.9% 0.0/1.0
Internal Process 9.5/9.0 9.0/21.2
Time to Get an Appointment (Days)
(H2g)
1.7/2.3 9.5/9.0 2.3/2.1 9.0/9.3
Dispute Rate (%) 0.7%/0.9% 0.0/0.0 0.6%/0.2% 0.0/11.9
Learning and Growth 23.4/21.5 23.3/12.1
Access to Training (%) (H1e) 100.0%/100.0% 3.8/3.8 100.0%/0.0% 3.8/0.0
Number of Training Courses
Completed (N)
2/1 3.8/3.8 1/0 3.8/0.0
Employee Satisfaction Rate (%)
(H1f)
85.0%/82.1% 10.1/8.1 87.4%/81.1% 9.9/6.3
Staff Turnover (%) (H1d) 4.0%/7.0% 5.7/5.7 4.0%/7.0% 5.7/5.7

133
4.3. BSC Scores between the Two Groups
Except for the administration staff, in the test group, the BSC scores of the
clinic, physicians, etc. are of increasing trend, even if it drops slightly on March 2015.
The administration staff has not only the lowest score among the six departments, we
also noticed that its score was unable to improve after implementing the strategies.
The scores of the other five departments have been gauged closely, especially for the
clinic and advisors, and we were able to see that their scores are nearly the same and
have similar trending patterns (Figure 4.3.1).

134
Figure 4.3.1 BSC scores in the test group by departments
0
10
20
30
40
50
60
70
80
90
100
Oct., 2014 Nov., 2014 Dec., 2014 Jan., 2015 Feb., 2015 Mar., 2015
BSC Score
Month
Clinic
Physician
Nurse
Cosmetologist
Advisor
Administration

135
Compared with the test group, scores among the control group are lower on
average. The scores of the administration staff is not only the lowest among all six
departments, it also maintains consistently low from Dec. 2014 to Feb. 2015 (Figure
4.3.2).

136
Figure 4.3.2 BSC scores in the control group by departments
0
10
20
30
40
50
60
70
80
90
100
Oct., 2014 Nov., 2014 Dec., 2014 Jan., 2015 Feb., 2015 Mar., 2015
BSC Score
Month
Clinic
Physician
Nurse
Cosmetologist
Advisor
Administration

137
To compare all six departments between the two groups, we added two linear
trends assuming that the scores would change with time. Scores of all six
departments in the test group are higher than those of the control group. Between
the two groups, the average difference is between 20 and 30. However, the largest
difference can be found on the nurses on Dec. 2014 which is 51. The most
prominent slope can be seen on the clinic with R2 of 0.77, the cosmetologists and the
advisors, with R2 of 0.82 and 0.75 respectively.
The slope of the physicians’ curve in the test group is the smallest compared
with other departments in the test group. Besides, in the control group, scores are
barely changing with time. Furthermore, the administration stuff cannot be analyzed
if a trending pattern is to be pointed out. We also could not analyze all six
departments in the control group with a clear trending pattern (Figure 4.3.3-4.3.8).

138
Figure 4.3.3 BSC scores of the clinics between the two groups
y = 3.1658x + 73.776
R² = 0.7709
y = 0.6812x + 53.846
R² = 0.0924
0
10
20
30
40
50
60
70
80
90
100
Oct., 2014 Nov., 2014 Dec., 2014 Jan., 2015 Feb., 2015 Mar., 2015
BSC Score
Month
Test Group
Control Group
Test Group
Control group

139
Figure 4.3.4 BSC scores of the physicians between the two groups
y = 1.8073x + 80.17
R² = 0.3627
y = 0.5231x + 59.083
R² = 0.0351
0
10
20
30
40
50
60
70
80
90
100
Oct., 2014 Nov., 2014 Dec., 2014 Jan., 2015 Feb., 2015 Mar., 2015
BSC Score
Month
Test Group
Control Group
Test Group
Control group

140
Figure 4.3.5 BSC scores of the nurses between the two groups
y = 2.3131x + 80.463
R² = 0.586
y = 2.415x + 46.184
R² = 0.2536
0
20
40
60
80
100
120
Oct., 2014 Nov., 2014 Dec., 2014 Jan., 2015 Feb., 2015 Mar., 2015
BSC Score
Month
Test Group
Control Group
Test Group
Control group

141
Figure 4.3.6 BSC scores of the cosmetologists between the two groups
y = 2.9433x + 77.063
R² = 0.8218
y = 0.1785x + 64.087
R² = 0.0027
0
10
20
30
40
50
60
70
80
90
100
Oct., 2014 Nov., 2014 Dec., 2014 Jan., 2015 Feb., 2015 Mar., 2015
BSC Score
Month
Test Group
Control Group
Test Group
Control group

142
Figure 4.3.7 BSC scores of the advisors between the two groups
y = 2.9841x + 73.779
R² = 0.7516
y = 1.6246x + 51.585
R² = 0.3742
0
10
20
30
40
50
60
70
80
90
100
Oct., 2014 Nov., 2014 Dec., 2014 Jan., 2015 Feb., 2015 Mar., 2015
BSC Score
Month
Test Group
Control Group
Test Group
Control group

143
Figure 4.3.8 BSC scores of the administration stuff between the two groups
y = -0.2572x + 54.457
R² = 0.0057
y = 4.5074x + 14.381
R² = 0.5739
0
10
20
30
40
50
60
70
Oct., 2014 Nov., 2014 Dec., 2014 Jan., 2015 Feb., 2015 Mar., 2015
BSC Score
Month
Test Group
ControlGroup
Test Group
Controlgroup

144
4.4. Perspectives among all six departments
When comparing the four perspectives between the two groups, the clinic
department in the control group has the lowest scores. Except for Internal Process,
BSC scores of the other perspectives have prominent differences between the two
groups in the clinic department. However, only the differences in the Financial
Perspective have a gradually increasing trend (Figure 4.4.1 & 4.4.2).

145
Figure 4.4.1 Perspectives of the clinic in the test group
15 9 12 15 14 14
35
35 35
35 35 31
23 28
29 31 32
31
3 5
7
10 11
12 77
77
84
91
92 88
y = 3.1658x + 73.776
R² = 0.7709
0
10
20
30
40
50
60
70
80
90
100
Oct., 2014 Nov., 2014 Dec., 2014 Jan., 2015 Feb., 2015 Mar., 2015
BSC score
Month
Financial
Customer
Internal Process
Learning & Growth
Total
Linear trendline

146
Figure 4.4.2 Perspectives of the clinic in the control group
In the physician department, all four perspectives of the test group get higher
5 7 4
9 11 9
30
33
32 27
28
24
16
18
14 17
20
20
3
1
0
3
3
4
54
59
50
56 62
56
y = 0.6812x + 53.846
R² = 0.0924
0
10
20
30
40
50
60
70
Oct., 2014 Nov., 2014 Dec., 2014 Jan., 2015 Feb., 2015 Mar., 2015
BSC score
Month
Financial
Customer
Internal Process
Learning & Growth
Total
Linear trendline

147
scores than the control group, especially those of Customer and Learning and Growth.
For example, from Oct. 2014 to Dec. 2014, the scores of Learning and Growth in the
test group are 17, 10, 14 and 5, 7, 5 in the control group. The difference percentages
are 70.6%, 30% and 64.3% in favor of the test group (Figure 4.4.3 &4.4.4).

148
Figure 4.4.3 Perspectives of the physician in the test group
17 10
14 17 16 14
40
40 40
40 39
34
22 32
34
36 36
35
0 1
1
1 1
2 79
83
88 93
92
85
y = 1.8073x + 80.17
R² = 0.3627
0
10
20
30
40
50
60
70
80
90
100
Oct., 2014 Nov., 2014 Dec., 2014 Jan., 2015 Feb., 2015 Mar., 2015
BSC score
Month
Financial
Customer
Internal Process
Learning & Growth
Total
Linear trendline

149
Figure 4.4.4 Perspectives of the physician in the control group
5 7 5
10 14
9
34
38
36 30
31
26
18
20
15 21
23
22
0
0
0
0
0
0 57
66
56 61
69
58
y = 0.5231x + 59.083
R² = 0.0351
0
10
20
30
40
50
60
70
80
Oct., 2014 Nov., 2014 Dec., 2014 Jan., 2015 Feb., 2015 Mar., 2015
BSC score
Month
Financial
Customer
Internal Process
Learning & Growth
Total
Linear trendline

150
Between the two groups, the nurse department of the control group had a steadier
performance than the control group. Especially, differences of the Customer
perspective are larger than those of Internal Process and Learning and Growth for
almost all six months. On Dec. 2014, differences of Internal Process and Learning
and Growth in the test group are the largest, which are 60% and 64.7% respectively.
In Internal Process, differences become less notorious from Jan., 2015 to Mar. 2015
than from Nov., 2014 to Dec. 2014 (Figure 4.4.5 & 4.4.6).

151
Figure 4.4.5 Perspectives of the nurses in the test group
22 15 17
22 21 22
20
20 20
18 20 19
39 49
53 52
55 48
0 0
0 0
0
0 81
84
90 92 96
89
y = 2.3131x + 80.463
R² = 0.586
0
10
20
30
40
50
60
70
80
90
100
Oct., 2014 Nov., 2014 Dec., 2014 Jan., 2015 Feb., 2015 Mar., 2015
BSC score
Month
1 Financial
2 Customer
3 Internal Process
4 Learning & Growth
Total
Linear trendline

152
Figure 4.4.6 Perspectives of the nurses in the control group
8
15
6
12 17
11
20 8
8
17
16
17
26
29
25
28
32
31
0 0
0
0
0
0
54 53
39
57
65
60 y = 2.415x + 46.184
R² = 0.2536
0
10
20
30
40
50
60
70
Oct., 2014 Nov., 2014 Dec., 2014 Jan., 2015 Feb., 2015 Mar., 2015
BSC score
Month
1 Financial
2 Customer
3 Internal Process
4 Learning & Growth
Total
Linear trendline

153
For the cosmetologists, differences of Customer and Learning and Growth
between the two groups are larger than that of Internal Process except that in Mar.
2015 the score was 37 to 28, a difference of 24.3% in favor of the test group. For the
Customer perspective, the largest difference is observed in Dec. 2014 with 58.1%
advantage of the performance over the control group (Figure 4.4.7 & 4.4.8).

154
Figure 4.4.7 Perspectives of cosmetologist in the test group
19 13 15
19 19 19
40
40 40
40 36 37
18 33 31
34 37
37 0
0 0
0 0 0
77
86 85
92
91 93
y = 2.9433x + 77.063
R² = 0.8218
0
10
20
30
40
50
60
70
80
90
100
Oct., 2014 Nov., 2014 Dec., 2014 Jan., 2015 Feb., 2015 Mar., 2015
BSC score
Month
1 Financial
2 Customer
3 Internal Process
4 Learning & Growth
Total
Linear trendline

155
Figure 4.4.8 Perspectives of cosmetologist in the control group
11 10 6
10
17 11
40 40
40 34
39
28
14 17
13 19
20
21
0 0
0
0
0
0
64
67
59 63
76
59
y = 0.1785x + 64.087
R² = 0.0027
0
10
20
30
40
50
60
70
80
Oct., 2014 Nov., 2014 Dec., 2014 Jan., 2015 Feb., 2015 Mar., 2015
BSC score
Month
1 Financial
2 Customer
3 Internal Process
4 Learning & Growth
Total
Linear trendline

156
In the advisor department, differences are more evident on the Customer and
Learning and Growth perspectives. However, differences of the Customer
perspective do not increase with the time of the study (Figure 4.4.9 & 4.4.10).

157
Figure 4.4.9 Perspectives of the advisors in the test group
20 14 15
20 18 15
26
26 26
26 26
25
31 36
40
42 47
45
0 1
1
1 2
2
77
77
82
89 92
87
y = 2.9841x + 73.779
R² = 0.7516
0
10
20
30
40
50
60
70
80
90
100
Oct., 2014 Nov., 2014 Dec., 2014 Jan., 2015 Feb., 2015 Mar., 2015
BSC score
Month
Financial
Customer
Internal Process
Learning & Growth
Total
Linear trendline

158
Figure 4.4.10 Perspectives of the advisors in the control group
9 5 6
10 11 9
26
26 26
26 26
21
20 24
19
24
29
28
0 0
0
0
0
0 55
56 51
59 65
59
y = 1.6246x + 51.585
R² = 0.3742
0
10
20
30
40
50
60
70
Oct., 2014 Nov., 2014 Dec., 2014 Jan., 2015 Feb., 2015 Mar., 2015
BSC score
Month
Financial
Customer
Internal Process
Learning & Growth
Total
Linear trendline

159
The results of the Financial perspective of the administration staff in the test
group showed score improvement over time. Both groups barely get scores in the
Customer perspective. Large variations in performance in the Internal Process
perspective can be seen without being able to draw clear conclusions (Figure 4.4.11 &
4.4.12).

160
Figure 4.4.11 Perspectives of administration in the test group
25
17 19
25 23 23
23
10
23 14
10 9
8
8
0 1
0 0
6
8
13 18
19 21
61
42
55 58
52 53
y = -0.2572x + 54.457
R² = 0.0057
0
10
20
30
40
50
60
70
Oct., 2014 Nov., 2014 Dec., 2014 Jan., 2015 Feb., 2015 Mar., 2015
BSC score
Month
Financial
Customer
Internal Process
Learning & Growth
Total
Linear trendline

161
Figure 4.4.12 Perspectives of administration in the control group
9 10
7
14
21
12
10 10
10
23 9
21
0 0
0
0
0
1
5 1
0
5
6
7
24 21
16
42
36
41
y = 4.5074x + 14.381
R² = 0.5739
0
5
10
15
20
25
30
35
40
45
Oct., 2014 Nov., 2014 Dec., 2014 Jan., 2015 Feb., 2015 Mar., 2015
BSC score
Month
Financial
Customer
Internal Process
Learning & Growth
Total
Linear trendline

162
CHAPTER 5
Discussions
5.1. Foreword
The major objective of this research is to demonstrate whether the
implementation of BSC over a period of time can help the management team to
improve the quality of care and services in aesthetic / cosmetic clinics. To express
the main research interest of this study, we have two major arms to examine the
impact of BSC on organizational performance and patient care. The first arm is
intended to answer the question whether the implementation of BSC can improve the
performance of organization. The second arm is aimed to respond whether the
patient care could be better as well. This chapter starts with the discussions of
results of these two arms and the arguments of the quality improvement of medical
services in aesthetic/ cosmetic clinics, followed by the debates of threats to internal
and external validity, as well as strengths and limitations, then ends with the
presentations of policy implication, future study plans and human subject
considerations.

163
5.2. Financial Perspective
The BSC is a tool for strategic management and communicating performance.
The purpose of implementing BSC in an organization is to assist in presenting
priorities in management. To accomplish the goal of financial success is the main
objective of many for profit or even non-profit organizations (Wu and Chang, 2012:
pp. 474-485). Therefore, the financial perspective is on the top of the BSC strategies
map in that financial measures appear as a traditional method of evaluating success
(Kaplan and Norton, 2000: pp. 9-15). The financial perspective pursues growth
strategy and risk analyzed in terms of the shareholder and is recognized for the
importance of short-term financial results obtained from the analysis of financial
targets for institutions in the competitive environment (Kaplan and Norton, 2000: pp.
9-15). Successful financial measures include massive cost reductions, small
deviations from the budget, performance changes in a short period of time and
increased return on investment (Farooq and Hussain, 2011: pp. 754-768).
In our study, the key performance indicators for the financial perspective are
Gross Margin Percentage (GMP) , which measures how well the revenue is used to
cover the costs; Purchase Amount per Patient per Visit (PAPV), which measures
revenue growth from each patient’s visit; and Return on Investment (ROI), which
measures the management and investment strategy for profit and cost. Business

164
volume should be increased with the implementation of BSC over a period of time,
which would lead to a return to profitability in sales turnover and a high return on
investment (Baroma et al., 2013: pp. 239-251).
Our study results showed that from Oct. 2014 to Mar. 2015, score of the BSC for
the financial key performance indicators like Gross Margin Percentage (GMP),
Purchase Amount per Patient per Visit (PAPV), and Return on Investment (ROI) of
the clinic increased from 3.3 to 12.4 in the test group and from 2.8 to 3.6 in the
control group (Table 4.2.1, Table 4.2.2, Table 4.2.3). These findings confirmed the
answer of our research questions about whether the implementation of BSC for a
period of time can improve financial indicators of the clinic or not to be true.
According to the study conducted by Chitu A et al who employed a multiple
regression model to analyze the impact of various financial key performance
indicators and found that, of all the indicators that with the highest influence on
financial outcome is the volume of sales activity. It is considered as the first priority
to impress the general public's concern about the image of an organization in terms of
management (Chitu A and Opris ME, 2014 pp 59-86). In our research, the increase
of the sales volume and activity contribute to all our financial key performance
indicators like Gross Margin Percentage (GMP), Purchase Amount per Patient per
Visit (PAPV), and Return on Investment (ROI). We therefore concluded from our

165
study results that the implementation of BSC leads to a better management of
aesthetic or cosmetic clinics, in terms of the financial perspective.
On the other hand, our results also demonstrated that from Oct. 2014 to Mar.
2015, the BSC score of the financial key performance indicator, Purchase Amount per
Patient per Visit (PAPV), of the physicians also increased from 0.2 to 12.4 in the test
group and for the control group the change was from 0.0 to 0.0 (Table 4.2.4, Table
4.2.5, Table 4.2.6). This finding also confirmed the answer of our research question
about whether the implementation of BSC for a period of time can improve financial
indicator of the physicians or not to be real. Since the increase of PAPV also
resulted from the augment of the volume of sales activity, we therefore concluded that
the implementation of BSC leads to a better financial management of aesthetic or
cosmetic physicians by accepting our hypothesis 1a, 1b and 1c.

166
5.3. Customer Perspective
In addition to the financial perspective, the customer perspective of the BSC is
arguably the most important part of the approach. No matter how outstanding the
internal process of your business and how much your employees learn and grow,
without customers the organization is unable to make profits and will never have a
chance to achieve the goal of financial excellence. The Customer perspective
describes the value recommendations that the organization will carry out with a view
to satisfy customers and create more sales volume as well as activities to the targeted
customers. The leading measures which are selected for the customer perspective
should measure the value that is delivered to the customer with adequate services and
reasonable cost. These value references include the quality of product, the timing of
delivery, the state-of-the-art performance, and the consequences that come as a result
of these value references.
In our study, the indicators chosen for the evaluation of customer dimension
include customer complain rate, patient repeat rate, patient referral rate and customer
satisfaction rate. We hypothesized that with positive consumption experiences,
customers will be less likely to complain, more likely to return and refer other new
customers, and more likely to be satisfied. Positive customer feedbacks reflect the
excellence of the internal process of the organization, even the learning and growth of

167
the organization staff, and will certainly contribute a lot to the financial performance.
From our Table 4.2.1 to Table 4.2.12, our study results revealed that a significant
increased BSC scores of the key performance indicators of customer perspective like
customer complain rate, patient repeat rate, patient referral rate and customer
satisfaction rate for the clinic, physicians, nurses, and cosmetologists in the test group
as compared to the control group from Oct. 2014 to Mar. 2015. These findings
confirm our study hypothesis 2a, 2b, 2c and 2d about whether the implementation of
BSC for a period of time can help improving patient care by measures such as
decreased Complain Rate, increased Patient Repeat Rate, increased Patient Referral
Rate and increased Customer Satisfaction Rate to be true. We therefore concluded
that the implementation of BSC leads to a better customer management of aesthetic or
cosmetic clinics.

168
5.4. Internal Process Perspective
To master the internal processes of an organization in generating high quality,
trustworthy and consistent products as well as services is the key to success in any
organization. Based on the missions, visions and core values of the organization, the
management of internal process perspective of BSC concentrates on all the activities
and processes required for the organization to excel at providing the value expected
by the customers. A successful internal processes management will lead to an
excellent intervention that aims to impress customers, increase sales volume and
activities, hence improving financial outcomes. It is therefore important to find the
right process indicators for measurement and to set the proper standards for
performance levels of each of the process indicators to guarantee the production and
delivery of high-quality products and services with reasonable costs. In other words,
achieving good performance levels on appropriate process measures leads to high-
quality products and services, which in turn, lead to satisfied, loyal and delighted
customers who then produce an increased sales volume and activities.
Consequently, and eventually, the increased financial performance promotes a long-
term survival and success of an organization.
In our research, we selected the following key performance indicators such as
time of physician consultation, rate of completing the deal, time to get an

169
appointment, waiting time and dispute rate for the clinics and physicians; rate of
completing the deal, time to get an appointment, waiting time, and dispute rate for
cosmetologists; waiting time and dispute rate for nurses; rate of completing the deal
and dispute rate for advisors, to evaluate the internal process. Our study results
indicated that for the clinics and physicians, the internal process improved in terms of
the increase in time of physician consultation, decrease in time to get an appointment,
waiting time, and a lower dispute rate, and increase in rate of completing the deal
(Table 4.2.1~6). Meanwhile, the internal process improved in terms of the
decrease in waiting time and dispute rate for nurses and advisors (Table 4.2.7~9 and
Table 4.2.12~15). Likewise, for cosmetologists, the internal process improved in
terms of the decrease in time to get an appointment, waiting time, and dispute rate,
and an increase in rate of completing the deal (Table 4.2.10~12). However, the time
to get an appointment improved and the dispute rate increased in the test group of
administration staff and decreased in the control group (Table 4.2.16~18). The
implementation of BSC increased somewhat the work load of the administration staff
without proportionately increasing their incentives might be the explanation of these
negative results. With mostly positive findings, we are still confident to conclude
that the implementation of BSC over a period of time can help improve the
management of internal process by supporting the hypothesis 2e, 2f, and 2g.

170
5.5. Learning and Growth Perspective
The fundamental objective of learning and growth perspective in BSC is that
these actions aim to accomplish the missions, visions and core values of an
organization. In other words, what the employees should learn and grow ought
to be connected to how to satisfy the customer’s needs, how to improve business
processes, and how to reach the financial goals of the organization.
To achieve these objectives, the key performance indicators in our research for
evaluating learning and growth perspective are rate of accessing to training, number
of training courses completed, employee satisfaction rate, staff turnover rate, and
number of book/journal reports. Our research results showed that more employee
satisfaction rate and less staff turnover were noted in the test group as compared to the
control group at the clinics, nurses, cosmetologists and administration staff level from
Oct. 2014 to Mar. 2015 (Table 4.2.1~3, Table 4.2.7~12 and Table 4.2.16~18). On the
other hand, at the level of physicians and advisors, only less staff turnover was noted
in test group compared to the control group in this study period (Table 4.2.4~6 and
Table 4.2.13~15).
These results from our research implied that only employee satisfaction and
retention make sense in the implementation of BSC in terms of learning and growth
perspective in our research. Employee satisfaction and employee retention are two

171
major measurements for evaluating the impact of implementation of BSC on the
employee perspective. Employee satisfaction recognizes the importance of
employee morale for improving productivity, product quality, time of delivery, and
customer satisfaction. Employee retention acknowledges that employees develop
organization-specific intellectual capital and provide a valuable non-financial asset to
the organization. Furthermore, employee retention is known to be cost saving because
the organization will spend a lot more money when they are forced to find and hire
talented and experienced people to replace the already well-trained employees who
leave.
The following are possible reasons of the other three measurements of learning
and growth perspective, rate of accessing to training, number of training courses
completed, and number of book/journal reports, failed to show a significant change
after the implementation of BSC. The explanations for these negative findings may
be related to the heavy clinical workload of cosmetic procedures. Under these
circumstances, even with the implementation of Balanced Scorecard, employees in
the test group did not have enough time to access more training courses and complete
more book or journal reports. Despite these negative results, we still conclude that
the implementation of Balanced Scorecard over a period of time helped improving
part of the learning and growth perspective by approving our hypothesis 1f.

172
5.6. Quality Improvement
The hypothesis 2h of our research refers to the effort of adopting BSC can
improve the quality of medical services, by which can be highly valued by customers
and possibly served as accreditation criteria by health policy regulators. To examine
the impact of implementation of BSC on the quality of medical services of the
cosmetic clinics, we employed Donabedian model (Donabedian, 1966) in our
research. Donabedian model is a framework that gives a concept for studying
quality of medical services. Based on this model, there are three domains that the
information about quality of medical services can be concluded from: “structure,”
“process,” and “outcomes." Since the location characteristics, facilities and equipment
are similar for both test and control clinics, the “structure” domain in our research
referred to the learning and growth perspective of our staff since better knowledge and
skills provide better quality of medical care. The financial perspective of the clinics
also serve as part of the structure domain for evaluating medical quality since a strong
financial structure is the basis of better medical services. The “process” domain in
our research was indicated by the internal process perspective which gives the
managements from providers to customers throughout the delivery of healthcare.
Customer perspective is certainly responsible for the “outcomes” domain in our
research for all the positive results from customer satisfaction, repeat visiting, and

173
new referral come from good outcomes of medical service delivery on the cosmetic
effects of customers.
Our research results showed that with the implementation of BSC, there were
significant improvements of all four perspectives in the test clinic compared to the
control one. We therefore concluded that the quality of medical services improved
and the hypothesis 2h was thereby confirmed.

174
5.7. Balanced Scorecard and Malcolm Baldrige National Quality Award
(MBNQA)
To develop a strategic framework for the excellence of an organization not
merely based on financial performance, BSC is the first choice among many
management tools in our study. The BSC reflects the overall assessment of an
organization based on performance excellence criteria as laid out by the Malcolm
Baldrige National Quality Award (MBNQA) (Asplund J., 2016)
The MBNQA is a comprehensive instrument for understanding and managing
organizational performance in all its dimensions. It covers all aspects of
management, including leadership; strategic planning; customers, or patients in health
care organization; measurement, analysis, and knowledge management; workforce;
operations; and results. It also provides a systemic inspection for the alignment and
integration across an organization. The individual criterion of MBNQA is essential
for organizational management and leadership, how the Baldrige criteria link to one
another determines the success of the organization.
The comparison between BSC and MBNQA was studied by Shuki Dror (Dror
2008). BSC has several limitations, for example, there is no basic guidelines for
selecting performance measures, and there is complex feedback from the financial
perspective to the customer and internal process perspectives. However, BSC has

175
important advantages such as sequential objectives, capability of directing long-term
programs, possibility of selecting relevant performance measures, and measurement
based on actual data and two levels of feedback, as compared to other quality award
models like MBNQA. In this article, a structured methodological approach based on
the Quality Function Deployment (QFD) was described to improve implementation of
the BSC method in an individual organization. The QFD method identifies customer
desires and the importance of those desires, it also identifies characteristics which
may be relevant to those desires, correlates the two, verifies those correlations, and
then assigns objectives and priorities for the system improvement. Therefore, a QFD
assisted BSC program potentially ensures that every financial performance defined by
the enterprise strategy is linked to a set of performance measures in the relevant
domains that may eventually strengthen and complete the BCS use for individual
facilities.
.

176
5.8. Conclusions
By looking at the four perspectives of the BSC, we were able to show significant
improvements of the performance by the physicians and staff of the test clinic over
the control clinic with exception of the administration department (Fig. 4.3.8)
There are some drawbacks with the implementation of BSC. Opportunity cost
and costs for consultants and implementation might be high and even higher when the
strategy or structure of an organization is changed. The fact that the employees have
taken and completed training courses does not necessarily mean that they have fully
understood the teaching materials. At least six months, better more than one year,
are required to see the effect of BSC. However, some organizations may have
significantly changed or even closed within that period. While we concluded with
several useful and interesting findings through the comparisons of performances in
terms of financial, customer, internal process and learning and growth perspective of
our test group or clinic, and control group or clinic, in this research, we were able to
demonstrate that by implementing a set of strategies, the BSC scores obtained by the
test group or clinic as a whole or divided by its six departments are significantly
higher than those of the control group or clinic. One of the fundamental reasons of
the success in implementing Balanced Scorecard is that BSC is deemed as a value
added to the test group or clinic. This value creates more clarity in objectives, more

177
useful objective partitioning and more organized action plans. Moreover, the
implementation of BSC also brings more realistic and relevant objectives for the
employees. With the implementation of BSC, the clinic is helped in enhancing the
financial aspects such as increasing profitability, economic value, sales growth, cash
flow generation, and return on capital employed; the customer aspect like customer
satisfaction, customer retention, customer acquisition, and market share increments;
the internal process aspect by providing management level with a comprehensive
picture of business operations; the learning and growth aspect such as employee
satisfaction, alignment of employee incentives with overall clinic success factors and
employee morale. Accordingly, gross margin percentage, purchase amount per
patient, return on investment, patient repeat rate, customer satisfaction rate, patient
referral rate, number of new patients, time of physician consultation, rate of
completing the deal, employee satisfaction rate, and staff turnover increased; whereas
adverse medical reaction rate, complaint rate, time to get an appointment, waiting
time, and dispute rate decreased.
In summary, it is safe to conclude that the implementation of BSC for a period of
time was able to help improving the overall performances of aesthetic/ cosmetic
clinics in this setting.

178
5.9. Threats to Validity
5.9.1 Threats to Internal Validity
The cause-effect relationship of experimental variables has been partly clarified
by drawing a proper strategy map to avoid misleading or misunderstanding. In our
study, one of the potential threats of internal validity is the influences of
instrumentation. We have carefully designed the satisfaction survey questionnaires
to avoid affecting the results or conclusions.
Another threat to the internal validity is attrition that could happen when the
employee quit his/her job during the period of data collection. If the dropping out
leads to relevant biases between groups, a whole class of alternative explanations is
possible that account for the observed differences.
5.9.2 Threats to External Validity
While implementing the BSC, one of the discussed threats toward external
validity is the Hawthorne effect (McCarney R 2007). With this effect, Leonard KL
et al. had demonstrated that, quality of care be improved by repeated measurement
(Leonard KL, 2017). The threats of Hawthorne effect toward external validity may
reduce gradually since this effect decreases with time. Since there was only a six-

179
month study period in our research, the Hawthorne effect may not be a problem to the
external validity of our research.
Another possible threat to the external validity of our research is that the results
of implementation of Balanced Scorecard can be varied due to its flexibility. Von
Bergen et al. (2004) and Wicks et al. (2007) have pointed out several factors that can
justify the failure of the implementation of the BSC framework. First of all is the
inconsistent or half-hearted application of the BSC and unwillingness to consider the
BSC a dynamic process of self-improvement. As David Norton (one of the creators
of BSC) pointed out, the biggest mistake that organizations may make is thinking that
the scorecard is just about measures. Second, measures that do not focus on strategy.
Organizations tend to insert some new non-financial measures, but fail to align them
adequately with strategy. Third, organizations do not have a balanced emphasis in
each of the four perspectives. Fourth, the BSC assumes employee commitment but
does not emphasize the employee perspective. Fifth, the BSC is founded on a
management philosophy that is based on control rather than commitment. Sixth, the
BSC assumes that trade-offs are necessary to solve problems, rather than emphasizing
win-win solutions. Seventh, the BSC is developed at the executive level, but not
communicates or cascades down through an organization. Without effective
communication throughout the organization, a BSC will not spur lasting change and

180
performance improvement.

181
5.10. Strengths and Limitations
5.10.1 Strengths
BSC is fundamentally a customized performance measurement system that looks
beyond traditional financial measures and is based on organizational strategy. There
are several strengths in our research. The first is that it is so far the first
implementation of BSC in the field of aesthetic/ cosmetic medicine. The second is
the design of the study which is dedicated to pursue the better quality of aesthetic
medicine under generally acknowledged blurring regulations. The third is that both
test clinic and control clinic are owned by the same chief executive officer, thus the
organization culture would be uniform. With this setting, the organization culture as
a confounder will be eliminated.
5.10.2 Limitations
As Aidemark et al. (2009) implicated that, even if the positive strains have
continued during recent years, some articles have been presented with a more critical
intonation and authors have underlined problems connected with the implementation
of the BSC. The criticism refers to both the theoretical model and to the practical
uses of the Balanced Scorecard. Nørreklit (2003), for example, criticized that the

182
model on a principle level and claimed that BSC was a persuasive but not a
convincing concept. This, she claimed, will result in that the readers read their own
intentionality into the theory and that every reader will form his own theory rather
than that of Kaplan and Norton. Several authors have also questioned whether the
BSC that has been identified in real-world settings really is the same instrument as
introduced by Kaplan and Norton or the idea of the implementers (Bukh & Malmi,
2006; Johanson et al., 2006).
One limitation of this research could also at the same time be an advantage of
BSC, the flexibility. Since there are no two identical organizations with exactly the
same size, culture, and other aspects, the process of implementation could not simply
follow a standardized set of procedures. This might cause the varied results of BSC
implementation and sometimes involuntary failure.
The implementation of BSC for only six months in our study is another
limitation for the access of training, number of training courses completed, and
number of book/ journal reports produced by the employees. Some of the
professional associations offer only annual training courses. For example, if a
professional association offers training courses in the summer while our study period
is from Oct. to Mar., there will not be a chance for the employee to access training and
complete the training courses. Meanwhile, the production of a book or journal

183
report is not easy to accomplish within only 6 months. If the study period could be
lengthened to one or two years, the difference of these KPIs between the test group
and control group could be much more obvious.

184
5.11. Policy Implication
In our research, we tested the hypothesis 2h that described the effort of adopting
BSC can improve the quality of medical services, and that our customers will feel
satisfied at the same level of accreditation by official regulators. Since our research
results support the statement, we may say that the implementation of BSC is
beneficial in helping healthcare authorities add or modify items to their criteria for
future accreditation of aesthetic medical organizations.
As demonstrated by Tan (2007), aesthetic medicine should be regulated because
every procedure in aesthetic medicine is meant to alter some part(s) of the body to
achieve a more pleasant appearance and would carry a certain risk of harm.
Furthermore, aesthetic medicine may distort the traditional doctor-patient relationship,
raise patients’ expectations and increase the risk of medical malpractice (Cullen,
2002). An unregulated aesthetic medicine industry may also have an adverse impact
on professional and ethical standards, as medical professionals may be more likely to
sacrifice ethical and moral principles to achieve profit-driven goals, and this would be
a great concern for customers and potential customers.
Due to the marginally regulated aesthetic industry in many countries (Tan, 2007),
the voluntary self-regulation should be an alternative guarantee of procedures’ quality

185
for customers. Nevertheless, as demonstrated by Tan (2007), the voluntary self-
regulation may not work. One of the most important factors is that the voluntary
self-regulation often involves quality improvement activities where medical
practitioners participate in peer reviews and learn from observed practice deficiencies,
but the aesthetic industry is an exception where practitioners are unlikely to reveal or
acknowledge their own shortcoming.
In our research, BSC is demonstrated to be one of the solutions to improve
quality of medical and non-medical services through the improvement of structure,
represented by the improvement of learning and growth; process, represented by the
improvement of internal process even with undisclosed formulas and procedures, and
outcomes, represented by the improvement of financial and customer perspectives.
These results indicated that, the activities of quality improvement such as BSC
implementation should be encouraged to achieve a win-win situation with the
reduction of regulation expenditure and the better care provider reputation with
customer trust on the quality of aesthetic medicine.

186
5.12. Future Research Plans
With the success of implementation of BSC in our study, the same conceptual
framework could be applied to other business as well. For example, the principle
investigator of this research and the author of this doctoral dissertation opened a series
of Argentinian Barbecue Beef Restaurants in Taipei city. The hypothesis will be that
whether the implementation of BSC also leads to the improvement in management of
restaurants as well.
To overcome one of the limitations in our current research, we can plan to
extend the study period to more than one year. With this setting, the access of
training, number of training courses completed, and number of book/ journal reports
produced by the employees could possibly be increased and thus leads to an
improvement of learning and growth perspective of BSC.
The head to head comparison of BSC with other management tools such as
strategic Planning, Customer Relationship Management, Employee Engagement
Surveys and Benchmarking could also be done in the future in our already established
system with test and control cosmetic clinics.
Since there is no basic guideline for selecting KPI for the four perspectives
of BSC, we could use more KPIs for evaluating the success of an organization in

187
the future study. In our study, we use only three KPIs for financial perspective,
namely, Gross Margin Percentage (GMP), Purchase Amount per Patient per Visit
(PAPV), and Return on Investment (ROI). As a matter of fact, there are a lot of
KPIs for the financial perspective to be used, such as Total assets holdings,
Profitability of assets, Profitability of net assets, Ratio of equity capital to total
assets holdings, Capital productivity ratio, Efficiency of assets, Market price per
share and Sales volumes for new products/services (Rahimi H., 2017; BSC
Designer). We believe that, there are different financial KPIs for different
businesses. Whereas further studies are needed to decide what KPIs are better
suited for which business.

188
5.13. Human Subjects Considerations
This research includes the collection of individual information from the
customer and employee satisfaction survey. For the sake of private information
safety, the critical and sensitive personal information have been protected by the
application of a series of encrypted code on each questionnaire.
The questionnaires are composed of two parts, each are marked with the same
encrypted code. One part consists of critical personal information and the other part
contains the major issues of the questionnaire. These two parts are separately by
different BSC implementation team members, and the original questionnaires are
carefully preserved from unauthorized contact and are going to be destroyed from
stem to stern after finishing the final analysis.

189
REFERENCES
1. Aidemark, L.G., Funck, E.K., Measurement and Health Care Management.
Financial Accountability and Management 2009; 25(2): 253–276.
2. Ajami S., Ebadsichani A., Tofighi S., Tavakoli N., Medical records department
and balanced scorecard approach. J Edu Health Promot 2013;2:7.
3. Ammons D.N., Overcoming the Inadequacies of Performance Measurement in
Local Government: The Case of Libraries and Leisure Services. Public
Administration Review 1995;55(1):37–47.
4. Andersen H.V., Lawrie G., Shulver M., The Balanced Scorecard vs. the EFQM
Business Excellence Model – Which is the Better Strategic Management Tool?
2GC Working Paper 2000;June:1-16.
5. Asplund J., BALDRIGE AWARD 2016 winner uses holistic approach. Hosp
Health Netw 2016;90(2):15.
6. Baker G.R., Pink G.H., A balanced Scorecard for Canadian Hospitals.
Healthcare Management Forum 1995;4:7-21.
7. Baroma, B., Bellisario A., Chirico A., Appolloni, A Breakthroughs in the
Management Accounting Science: Imaging a Balanced Scorecard Thought.
Lean Philosophy Rationales Transit Stud Rev 2013:239-251.
8. Behn R.D., Why Measure Performance? Different Purposes Require Different

190
Measures. Public Administration Review 2003;63:586-606.
9. Braam G.J.M., Nijssen E.J., Performance effects of using the Balanced
Scorecard: a note on Dutch experience. Long Range Planning 2004;(37):335-
349.
10. Brown M.G., Keeping Score - Using the Right Metrics to Drive World-Class
Performance. In Quality Resources 1996, New York, NY.
11. Bukh, P.N., Malmi T., Re-examining the Cause-and-effect Principle of the
Balanced scorecard. In S. Jönsson, and J. Mouritsen (eds.), 2006 Accounting in
Scandinavia- The Northern Lights (Liber, Malmö).
12. BSC Designer, at: http://www.bscdesigner.com/list-of-sample-kpis-in-5-
perspectives-of-bsc.htm (accessed 10 April 2017).
13. Castaneda-Mendez K., Mangan K., Lavery A.M., The Role and Application of
the Balanced Scorecard in Health Care Quality Management. Journal of
Healthcare Quality 1998;20:10-13.
14. Chan Y.L., Ho S.K., Performance measurement and the use of balanced
scorecard in Canadian hospitals. Advances in Management Accounting
2000;9:145-169.
15. Chang R.Y., DE Young P., Measuring Organizational Improvement Impact: A
Practical Guide to Successfully Linking Organizational Improvement Measures.

191
John Wiley Sons Inc, United States, 1999.
16. Chase R., Jacobs F., Aquilano N., Operations Management for Competitive
Advantage. In 2006, 11th ed. Burr Ridge, Ill:McGraw-Hill/Irwin.
17. Chen H.F., Hou Y.H., Chang R.E., Application of the Balanced Scorecard (BSC)
to an Academic Medical Center in Taiwan: the Effect of Warning Systems on
Improvement of Hospital Performance. Journal of the Chinese Medical
Association 2012;(10):530-535.
18. Chitu A., Opris M.E., Importance of financial perspective indicators in Balanced
Scorecard in a leasing company, Theoretical and Applied Economics Volume
XXI 2014;8(597):59-68.
19. Chow C.W., Ganulin D., Teknika O., Haddad K., Williamson J., The Balanced
Scorecard: A Potent Tool for Energizing and Focusing Health Care Organization
Management, J Healthc Manag 1998;43(3):263-280.
20. Chow-Chua C., Goh M., Framework for evaluating performance and quality
improvement in hospitals. Managing Service Quality 2002;12(1):54-66.
21. Crabtree, A.D., DeBusk, G.K., The effects of adopting the balanced scorecard on
shareholder returns. Advances in Accounting 2008;24:8-15.
22. De Matos Nasser E., Reis da Costa S.R., Implementation of indicators through
balanced scorecards in a nutritional therapy

192
company. Nutr Hosp 2013;28(3):884-95.
23. Donabedian A., Evaluating the quality of medical care. Milbank Mem Fund
1966;44(3):Suppl:166-206.
24. Dror S., The Balanced Scorecard versus quality award models as strategic
frameworks, Journal of Total Quality Management & Business Excellence
2008;19(6):583-593.
25. Embree J.L., Swenty C.F., Schaar G., A Balanced Scorecard With Strategy Map:
Measuring the Value of a Nursing Sabbatical. J Nurs Care Qual 2015;30(4):352-
8.
26. Farooq, A., Hussain, Z., Balanced scorecard perspective on change and
performance: a study of selected Indian companies. Procedia Social and
Behavioral Sciences 2011;24(1):754-768.
27. Hill T., Powell L., Balanced Scorecard for Small Rural Hospital: Concept
Overview & Implementation Guidance. In Rural Health Resource Center 2005.
28. Hong Y., Hwang K.J., Kim M.J., Park C.G., Balanced scorecard for performance
measurement of a nursing organization in a Korean hospital. Taehan Kanho
Hakhoe Chi 2008;38(1):45-54.
29. Hoque Z., James W., Linking balanced scorecard measures to size and market
factors: impact on organizational performance. Journal of Management

193
Accounting Research 2000;12(1):1-15.
30. Hwa M., Sharpe B.A., Wachter R.M., Development and implementation of a
balanced scorecard in an academic hospitalist group. J Hosp Med 2013;8(3):148-
53.
31. Iselin, E.R., Mia, L., Sands J., The effects of the balanced scorecard on
performance: The impact of the alignment of the strategic goals and performance
reporting. Journal of General Management 2008;33:71-85.
32. Ittner C.D., Larcker D.F., Randall T., Performance implications of strategic
performance measurement in financial services firms. Accounting, Organizations
and Society 2003;28(7-8):715-741.
33. Janice A., Klein., Why supervisors resist employee involvement. Harvard
Business Review 1984;5:87-95.
34. Griffith J.R., Reengineering Health Care: Managements Systems for Survivors.
Hospital & Health Services Administration 1994;39(4):451-470.
35. Steele J.. Transforming the balanced scorecard into your strategy execution
system. Manage 2001;5:22-23.
36. Johanson U.,, Skoog M., Backlund A., Almqvist R., Balancing dilemmas of the
balanced scorecard. Accounting, Auditing & Accountability Journal
2006;19(6):842-858.

194
37. Kaplan R.S., Norton D.P., The balanced scorecard measures that drive
performance. Harvard Business Review 1992:71-79.
38. Kaplan R.S., Norton D.P., Using the Balanced Scorecard as a Strategic
Management System. Harvard Business Review 1996;1:1-13.
39. Kaplan R.S., Norton D.P., Strategy Maps: Converting Intangible Assets into
Tangible Outcomes, Harvard Business School Press 2000;1(1):9-15.
40. Kaplan R.S., Norton D.P., The Strategy‐Focused Organization: How Balanced
Scorecard Companies Thrive in the New Business Environment. Harvard
Business School Press 2001.
41. Kliger A.S., Quality Measures for Dialysis: Time for a Balanced Scorecard. Clin
J Am Soc Nephrol 2016;11(2):363-8.
42. Kohn L.T., Corrigan J.M., Donaldson M.S., To Err is Human: Building a Safer
Health System. Institute of Medicine (US) Committee on Quality of Health Care
in America. Washington (DC): National Academies Press (US); 1999.
43. Kravchuk R.S., Schack R.W., Designing Effective Performance Measurement
Systems under the Government Performance and Results Act of 1993. Public
Administration Review 1996;56(4):348-58.
44. Lanham B., Maxson-Cooper P., Is six sigma the answer for nursing to reduce
medical errors and enhance patient safety? Nurs Econ 2003;21:39-41.

195
45. Leneski C.D., Developing a Performance Measurement System for Local Public
Healthcare Agencies in the Florida Department of Health using the Balanced
Scorecard Framework. Doctoral Dissertation, University of North Carolina at
Chapel Hill. 2005;UMI no. 3190279.
46. Leonard K.L., Masatu M.C., Changing health care provider performance through
measurement. Soc Sci Med 2017;181:54-65.
47. MacStravic S., A really balanced scorecard. Health Forum J 1999;42(3):64-7.
48. McCarney R., Warner J., Iliffe S., Haselen R.V., Griffin M., and Fisher P., The
Hawthorne Effect: a randomized, controlled trial. BMC Med Res Methodol
2007;7:30.
49. McIntyre D., Rogers L., Heier E.J., Overview, History, and Objectives of
Performance Measurement. Health Care Financing Review 2001;22:7-21.
50. Mohammed Ba-Abaad K., Review of the Literature of Balanced Scorecard and
Performance Measurement: The Case Of Healthcare Organizations Business e-
Bulletin 2009;l(1).
51. Moosa S., Wellbeing: a cross category approach to nutrition, health and beauty.
Business Insights 2002, available at:
http://www.m2.com/m2/web/story.php/20036E41A2968513290B80256CD0005

196
2778A (accessed 10 April 2017).
52. Nippak P.M., Veracion J.I., Muia M., Ikeda-Douglas C.J., Isaac W.W., Designing
and evaluating a balanced scorecard for a health information management
department in a Canadian urban non-teaching hospital. Health Informatics
Journal 2016;22(2):120-39.
53. Niven P.R., Balanced Scorecard Diagnostics: Maintaining Maximum
Performance (Hoboken, NJ: John Wiley & Sons, 2005), p. 64.
54. Nørreklit H., The balanced scorecard: what is the score? A rhetorical analysis of
the balanced scorecard", Accounting, Organizations and Society 2003;28:591-
621.
55. Oliveira J., The Balanced Scorecard: An Integrative Approach to Performance
Evaluation,"Healthcare Financial Management 2001;55(5):42-46.
56. Osborne D., Plastrik P., The Reinventor’s Fieldbook: Tools for Transforming
Your Government. San Francisco, CA: Jossey-Bass. 2000.
57. Pronovost P., Miller M., Wachter R., Tracking progress in patient safety: an
elusive target. JAMA 2006;296:696-699.
58. Raeisi A.R., Yarmohammadian M.H., Bakhsh R.M., Gangi H., Performance
evaluation of Al-Zahra academic medical center based on Iran balanced
scorecard model. J Educ Health Promot 2012;1:1.

197
59. Rahimi H., Kavosi Z., Shojaei P., Kharazmi E., Key performance indicators in
hospital based on balanced scorecard model. J Health Man & Info 2017;4(1):17-
24.
60. Richard P.J., Devinney T.M., Yip G.S. Johnson G., Measuring Organizational
Performance: Towards Methodological Best Practice. Journal of Management
2009;35:718-804.
61. Sahney V.K., Balanced Scorecard as a Framework for Driving Performance in
Managed Care Organizations, Managed Care Quarterly 1998;6(2):1-8.
62. Semnan F., Asadi R., Designing a Developed Balanced Score-card Model to
Assess Hospital Performance Using the EFQM, JCI Accreditation Standards and
Clinical Governance. J Bus Hum Resour Manag 2016;2(1). Available at:
http://crescopublications.org/pdf/jbhrm/JBHRM-2-005.pdf, Article Number:
JBHRM-2-005.
63. Smith C., Christiansen T., Dick D., Howden J.S., Wasylak T., Werle J.,
Performance management tools motivate change at the frontlines. Health
Manage Forum 2014;27(1):15-19.
64. Tan K.B.H., Ministry of Health, Singapore, Aesthetic medicine: a health
regulator's perspective, Clinical Governmence: A International Journal
2007;12(1):13-25.

198
65. Teklehaimanot H.D., Teklehaimanot A., Tedella A.A., Abdella M., Use of
Balanced Scorecard Methodology for Performance Measurement of the Health
Extension Program in Ethiopia. Am J Trop Med Hyg 2016;94(5):1157-69.
66. Wholey J.S., Newcomer K.E., Clarifying Goals, Reporting Results. Using
Performance Measurement to Improve Public and Nonprofit Programs, New
Directions for Evaluation 75, edited by Kathryn E. Newcomer, P.91-98. San
Francisco, CA: Jossey-Bass. 1997.
67. Wicks A.M., St. Clair L., Kinney C.S., Competing Values in Healthcare:
Balancing the (Un) Balanced Scorecard, Journal of Healthcare Management
2007;52(5):309-325.
68. Wu I.L., Chang C.H., Using the balanced scorecard in assessing the performance
of e-SCM diffusion: A multi-stage perspective. Decision Support Systems
2012;52(1):474-485.
69. Zelman W.N., Blazer D., Cower J.M., Bumgarner P.O., Cancilla L.M., Issues for
Academic Health Centers to Consider Before Implementing a Balanced-
Scorecard Effort. Academic Medicine 1999;74(12):1,269-1,277.
70. Zelman W. N., Pink G. H., Matthias C.B., Use of the balanced scorecard in
health care. Journal of Health Care Finance 2003;29(4):1-16.

199
71. Zhijun L., Zengbiao Y., Zhang L., The Application of Balance Scorecards in
Public Hospital Administration in China. The international J of Management-
Theory and Application 2013;1(1).
200
Curriculum Vitae
Yi Ming Liu, MD
16th F, Nº 26, Huan He Rd.
Xin Dian 231, Taiwan
Tel: 886-2-8912-3323/ 886-955-067228
E-Mail: [email protected]
Summary of Personal History
Born in Kaohsiung, a southern city in Taiwan (October 1965).
Emigrated to Argentina at the age of 12 (October 1977).
Arrived in the USA after graduating from medical school in Buenos Aires
(October 1991).
Returned to Taiwan (November 1997).
Education
MD., School of Medicine, National University of Buenos Aires, Buenos
Aires, Argentina (June 1992).

201
Dr. PH candidate, Department of Health Policy and Management,
Bloomberg School of Public Health, Johns Hopkins University.
License & Certification
Board of Surgery, Republic of China (December 2002).
Medical License, Republic of China (September 1999).
United States Medical Licensing Examinations" (USMLE) Certificate
(November 1995).
Medical License, Republic of Argentina (March 1993).
Working Experience
CEO, Meso Group, Co. Ltd. (from July 2006 to present)
Director, Meso Clinic, Taipei, Taiwan (from July 2006 to present).
Attending Staff, Surgical Intensive Care Unit (SICU), Cardinal Tien
Hospital, Taipei, Taiwan (from July 2003 to 2006).
Surgery Resident and Chief of Residents, Department of General Surgery,
Mackay Memorial Hospital, Taipei, Taiwan (from September 1999 to June
2003).

202
Surgery Resident, Min Sheng General Hospital, Taoyuan, Taiwan (from April
1999 to September 1999).
Surgery Resident, Tainan Municipal Hospital, Tainan, Taiwan (from
December 1997 to March 1999).
Clinical Research Fellow, Department of Neurological Surgery, Wayne State
University, Detroit, Michigan (from May 1996 to November 1997).
Research Fellow, Department of Neurological Surgery, University of Illinois
at Chicago (from May 1996 to April 1997).
Publication
Transverse Colon Duplication Mimicking Megacolon-Report of a Case
(Journal of Society of Colon and Rectal Surgeon, Taiwan, 2003; 14: 114-
118).
Abdominal Cocoon Associated with Intestinal Malrotation and Small
Intestine Obstruction – A Case Report (Formosan Journal of Surgery, 2006;
39: 160-3).
Intestinal Perforations in Behçet’s Disease (Journal of Gastrointestinal
Surgery, 2007; 11: 508-14).

203
Awards & Honors
Admitted to the medical school with the 45th highest entrance examination
score among over 10,000 applicants (March 1984).
Recipient of scholarship for outstanding academic performance (from April
1984 to December 1985).
Special Skills
Fluent in writing and speaking in several languages, including Mandarin
Chinese, Taiwanese, Spanish, and English.
Skillful player of various music instruments, including bass guitar,
saxophone, trumpet and drums. Leader of the “Grade 5 Band”, a gospel rock
band, and the co-producer of “G-5 I & G-5 II” album CDs (September 2004
and September 2006 respectively).
Table tennis champion, medium high ranking category, US Open (November
1993).
Personal Characteristics
Perseverant, easy to work with, able to release tension through humor, eager
in academic learning, and humble when being taught.

204
Expert in brain storming, English teaching, entrepreneurial ventures, public
speaking.
Sharp analytical thinking ability when facing controversial issues.
Rich in international experiences, approaching things from refreshing
perspectives.