using big data to monitor the introduction and spread of
TRANSCRIPT

Page 1 of 8
Article DOI: https://doi.org/10.3201/eid2506.180138
Using Big Data to Monitor the Introduction and Spread of Chikungunya, Europe, 2017
Appendix 2
Appendix 2 Figure 1. Average monthly vectorial capacity (VC) estimates derived on the basis of
temperature averaging to the 75th percentile of monthly distribution, July-October, 2017. Areas with
autochthonous transmission are indicated by colored polygons.

Page 2 of 8
Appendix 2 Figure 2. Number of passengers arriving from chikungunya transmission active areas into
Europe, August 2017.

Page 3 of 8
Appendix 2 Figure 3. Mobility proximity (MP) estimates from the Var department, France, to areas in
Europe with stable Ae. albopictus populations, July-September 2017. The polygons mark the outbreak
areas.

Page 4 of 8
Appendix 2 Figure 4. Estimated risk areas of chikungunya spread from the outbreak areas in the Var
department, France, based on combined vectorial capacity (VC) and mobility proximity (MP) estimates,
August-October 2017. The polygons mark the outbreak areas.

Page 5 of 8
Appendix 2 Figure 5. Vectorial capacity (VC) estimates for Lazio region, July-October 2017, based on
average climatic conditions during the period 1996–2015. The number of reported cases are overlaid as
circles.

Page 6 of 8
Appendix 2 Figure 6. Estimated risk areas of chikungunya spread from the outbreak areas of Anzio and
Rome in Lazio region based on combined vectorial capacity (VC) and mobility proximity (MP) and
estimates, August 2017. The number of reported cases are overlaid as circles.

Page 7 of 8
Appendix 2 Figure 7. Estimated risk areas of chikungunya spread from the outbreak areas of Anzio and
Rome in Lazio region based on combined vectorial capacity (VC) and mobility proximity (MP) and
estimates, September and October 2017. The number of reported cases are overlaid as circles.
Page 8 of 8
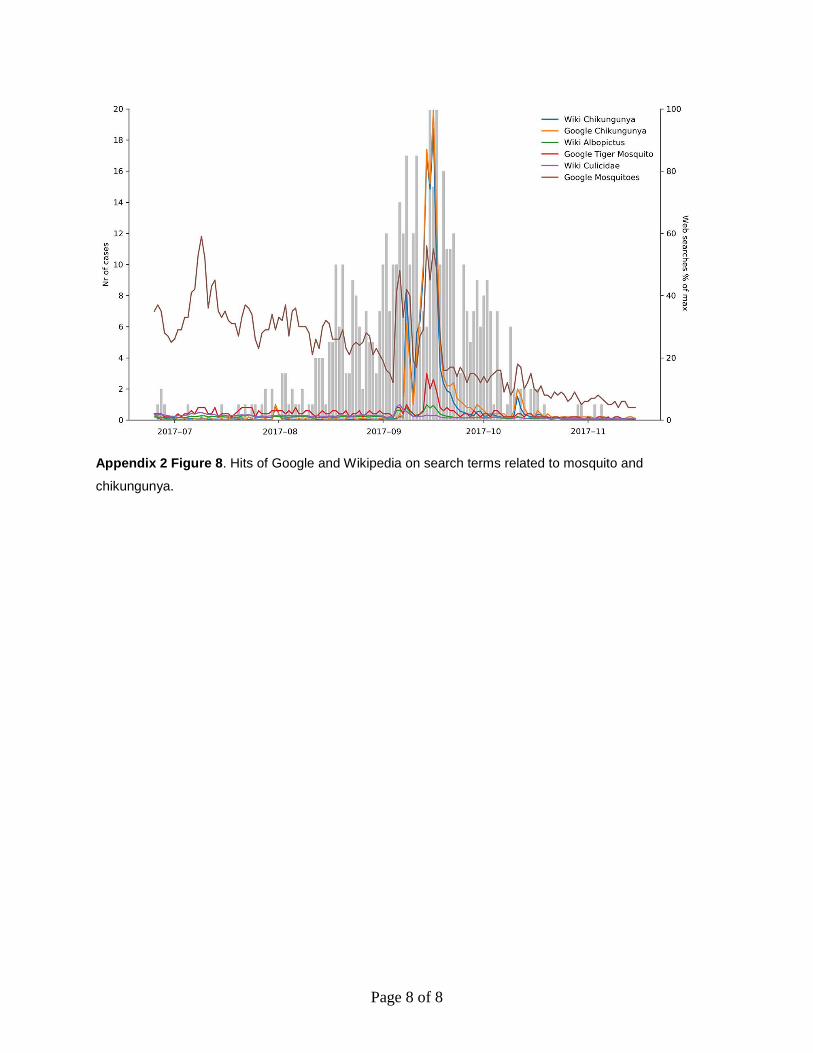
Appendix 2 Figure 8. Hits of Google and Wikipedia on search terms related to mosquito and
chikungunya.