using climate to predict infectious disease outbreaks: a … · using climate to predict infectious...
TRANSCRIPT
Using climate to predict infectious disease outbreaks: a review
WHO/SDE/OEH/04.01 English only
Using Climate to Predict Infectious Disease Outbreaks:
A Review
Communicable Diseases Surveillance and Response Protection of the Human Environment
Roll Back Malaria Geneva
2004

Using climate to predict infectious disease outbreaks: a review
Using climate to predict infectious disease outbreaks: a review
© World Health Organization 2004
All rights reserved. Publications of the World Health Organization can be obtained from Marketing and Dissemination, World Health Organization, 20 Avenue Appia, 1211 Geneva 27, Switzerland (tel: +41 22 791 2476; fax: +41 22 791 4857; email: [email protected]). Requests for permission to reproduce or translate WHO publications – whether for sale or for noncommercial distribution – should be addressed to Publications, at the above address (fax: +41 22 791 4806; email: [email protected]).
The designations employed and the presentation of the material in this publication do not imply the expression of any opinion whatsoever on the part of the World Health Organization concerning the legal status of any country, territory, city or area or of its authorities, or concerning the delimitation of its frontiers or boundaries. The mention of specific companies or of certain manufacturers’ products does not imply that they are endorsed or recommended by the World Health Organization in preference to others of a similar nature that are not mentioned. Errors and omissions excepted, the names of proprietary products are distinguished by initial capital letters. The World Health Organization does not warrant that the information contained in this publication is complete and correct and shall not be liable for any damages incurred as a result of its use.
Using climate to predict infectious disease outbreaks: a review
Table of contents Preface 4 Acknowledgements 6 List of abbreviations 7 Executive summary 8 1. Introduction 10 2. Historical early warning systems 12 3. Conceptual framework for developing climate-based EWS for infectious diseases 14
3.1 Preliminary phases 14 3.1.1 Evaluating epidemic potential 14 3.1.2 Identifying the geographical location of epidemic areas 14 3.1.3 Identifying climatic and non-climatic disease risk factors 15 3.1.4 Quantifying links between climate variability and disease
outbreaks: constructing predictive models 15 3.2 Early warning systems 16
3.2.1 Disease surveillance 17 3.2.2 Monitoring disease risk factors 17 3.2.3 Model forecasts 18
3.3 Response phase 19 3.4 Assessment/evaluation phase 19
4. Identifying candidate diseases for early warning systems 21 5. Climate-based early warning systems for infectious diseases 27
5.1 Cholera 27 5.2 Malaria 27 5.3 Meningococcal meningitis 29 5.4 Dengue/dengue haemorrhagic fever 30 5.5 African trypanosomiasis 31 5.6 Yellow fever 31 5.7 Japanese and St. Louis encephalitis 31 5.8 Rift Valley fever 32 5.9 Leishmaniasis 33 5.10 West Nile virus 33 5.11 Ross River virus and Murray Valley encephalitis 34 5.12 Influenza 35
6. General discussion and conclusions 37 7. Bibliography 43 Appendix 1 51

Using climate to predict infectious disease outbreaks: a review
Preface This document was written as guidance for the Department of Communicable Diseases Surveillance and Response (CSR), the Department of Protection of the Human Environment (PHE), and the Roll Back Malaria Department (RBM) on the potential of early warning systems based on climate variations to enhance global surveillance and response to epidemic-prone diseases. CSR has a unique mandate to lead international efforts to achieve global health security. Its strategy has three components: to improve preparedness of member states by strengthening national surveillance and response systems; to contain known risks; and to respond to unexpected health events. PHE aims to achieve safe, sustainable and health-enhancing human environments, protected from biological, chemical and physical hazards and secure from the adverse effects of global and local environmental threats. Founded in 1998, Roll Back Malaria aims to halve the world's malaria burden by 2010. Its four main technical strategies are: prompt access to treatment, especially for young children; prevention and control of malaria in pregnant women; vector control; and prevention and containment of epidemics. Knowledge of the interactions between climate and health date back to the time of Aristotle, but our understanding of this subject has recently progressed rapidly as technology has become more advanced. At the same time the ability to forecast weather (in terms of both accuracy and lead-times) has greatly improved in recent years, especially with the use of remote sensing. The increased accuracy of climate predictions, and improving understanding of interactions between weather and infectious disease, has motivated attempts to develop models which predict changes in the incidence of epidemic-prone infectious diseases. Such models are designed to provide early warning of impending epidemics which, if accurate, would be invaluable for epidemic preparedness and prevention. This document evaluates the current and future potential of climate-based disease early warning as a means of improving preparedness for, and response to, epidemics. Based on the history of EWS development to date, the authors develop a conceptual framework for constructing and evaluating climate-based EWS. They identify the climate-sensitive diseases of major public health importance and review the current state of the art in climate-based modelling of these diseases, as well as future requirements and recommendations. This document lays the foundation for future development of EWS that capitalize on new knowledge about the interaction between climate and infectious diseases, as well as improved capacity for forecasting climate. No large scale EWS is yet in place but for some diseases, such as malaria and Rift Valley fever, early warnings based on climatic conditions are beginning to be used in selected locations to alert ministries of health to the potential for increased risk of outbreaks and to improve epidemic preparedness. However, the use of such models is just beginning, and experience with their use is limited. A number of models are in the pipeline, although more work is required before climate-based models can realize their full potential. This includes: 1. Developing and strengthening disease surveillance systems to produce the high-quality, long-
term data needed for model development and testing. 2. Developing standard terminology and criteria for evaluating the accuracy of such models. 3. Inclusion of non-climatic influences in the models.
4
Using climate to predict infectious disease outbreaks: a review
4. Making the models relevant to particular response decisions and to the particular needs of
policy-makers. 5. Cost effectiveness analyses. This joint CSR, PHE and RBM publication was prepared with the understanding that climate-based EWS, when fully developed, do have the potential to provide increased lead-times in which to implement epidemic prevention and/or control activities. Therefore their development should be encouraged, and both positive and negative experience of using such systems should be documented. It is only with experience that such systems will become useful tools.
Guenael Rodier, Director Department of Communicable Disease Surveillance and Response World Health Organization
Margaret Chan, Director Department of Protection of the Human Environment World Health Organization
Fatoumata Nafo-Traoré, Director Roll Back Malaria Department World Health Organization
5

Using climate to predict infectious disease outbreaks: a review
Acknowledgements Project coordination Martha Anker (Department of Communicable Disease Surveillance and Response, World Health Organization), and Carlos Corvalán (Department of Protection of the Human Environment, World Health Organization) Report Authors Katrin Kuhn, Diarmid Campbell-Lendrum, Andy Haines, Jonathan Cox (London School of Hygiene and Tropical Medicine)
Contributors and Reviewers Thanks to Tarekegn Akebu, David Bradley, Simon Brooker, Sari Kovats, Mary Marimootoo, Dirk Pfeiffer and Paul Wilkinson for contributions and suggestions on the initial draft, to Michael Nathan, Aafje Rietveld, Madeleine Thomson and Charles Delacollette for useful review comments, and to Jo Woodhead for editing of the text.
6

Using climate to predict infectious disease outbreaks: a review
List of Abbreviations CCD Cold cloud duration CDC Centers for Disease Control and Prevention, Atlanta, USA CDNA Communicable Disease Network Australia CIMSiM Container Inhabiting Mosquito Simulation Model CL Cutaneous leishmaniasis DALY Disability adjusted life years DAVID Disease and vector integrated database DENSiM Dengue Simulation Model DEWS Dengue early warning system/s DHF Dengue haemorrhagic fever EIR Entomological inoculation rate ENSO El Niño / Southern Oscillation EUMETSAT European Organisation for the Exploitation of Meteorological
Satellites EWS Early warning system/s FAO Food and Agriculture Organization of the United Nations FEWS Famine early warning system/s GIS Geographical information system JE Japanese encephalitis LST Land surface temperature MARA Mapping Malaria Risk in Africa Project MVE Murray Valley encephalitis NOAA AVHRR National Oceanic and Atmospheric Administration Advanced Very
High Resolution Radiometer NDVI Normalized difference vegetation index REWS Regional early warning system/s RRV Ross River virus RVF Rift Valley fever SADC Southern African Development Community SD Standard deviation SLE St. Louis encephalitis SSH Sea surface height SST Sea surface temperature STD Sexually transmitted disease TB Tuberculosis VL Visceral leishmaniasis WNV West Nile virus
7
Using climate to predict infectious disease outbreaks: a review
Executive summary It is commonly accepted that climate plays a role in the transmission of many infectious diseases, of which some are among the most important causes of mortality and morbidity in developing countries. Often these diseases occur as epidemics which may be triggered by variability in climatic conditions that favour higher transmission rates. With increasing demand for operational disease early warning systems (EWS), recent advances in the availability of climate and environmental data and increased use of geographical information systems (GIS) and remote sensing make climate-based EWS increasingly feasible from a technical point of view. This report presents a framework for developing disease EWS and, following steps within it, reviews the degree to which individual infectious diseases are sensitive to climate variability. This is used as a basis for identifying diseases for which climate-based prediction offers most potential for disease control. Subsequent sections review the current state of development of EWS for specific diseases and assess their likelihood of success. This report demonstrates that there is considerable on-going research activity identifying climate-epidemic links. Of the 18 diseases meeting defined criteria for the potential for climate-based EWS, few (African trypanosomiasis, leishmaniasis, yellow fever and Murray Valley encephalitis) are not associated with some sort of EWS development activity. For others (St. Louis encephalitis and West Nile virus in the United States of America) operational and effective warning systems have been developed which rely solely on viral activity detection (also the strategy employed for early detection and prediction of influenza outbreaks). It remains unclear whether the addition of climatic predictors would improve the predictive accuracy or lead-time of these systems. For the remaining diseases (cholera, malaria, meningitis, dengue, Japanese encephalitis, Rift Valley fever and Ross River virus), research projects have demonstrated a temporal link between climatic factors and variations in disease rates. In some of these cases the power to predict epidemics has been tested, although the tests are preliminary and usually based on either limited data or
inadequate description of the methods used. From the published literature so far, there is little evidence to suggest that any of these systems currently are being used to influence disease control decisions. This report suggests a number of likely explanations for this: 1. Affordable and accessible data and analytical
tools have become widespread only recently, so that the field is at a relatively early stage of development. Many more studies should be available in the next two to three years as systems are completed and tested in other locations.
2. Few studies have been published, so there are
no generally agreed criteria for assessing predictive accuracy (for example, it is seldom clear how an epidemic year is defined). As a consequence it is often difficult to judge the utility of existing systems.
3. Most research projects have had relatively
limited resources and therefore not been tested in locations outside the original study area.
4. Most studies in this area focus solely on
climatic factors and do not explicitly test other explanations for variations in disease rates through time.
5. Many studies are undertaken as ‘pure
research’ therefore neither the extent to which they address specific control decisions nor their utility for planning public health interventions is clear.
This report concludes that a number of steps could be taken to begin to address these issues. These include: 1. Maintaining and strengthening disease
surveillance systems for monitoring incidence of epidemic diseases. High quality, long-term disease data are essential for generating and refining models relating climate to infectious disease; lack of disease data is a more common limiting factor than lack of climate data. In some cases existing approaches to surveillance may generate
8

Using climate to predict infectious disease outbreaks: a review
disease data appropriate for use within an EWS – in others it may be necessary to either modify existing systems or build completely new systems. The introduction of computer hardware and software at appropriate levels within the surveillance system may facilitate timely collation and analysis of incoming disease data. Widespread introduction of GIS tools, the WHO Healthmapper software for example, may allow surveillance data to be stored and accessed in a disaggregated form, allowing detailed analysis of spatial and temporal distributions. Consideration should be given to integrating such monitoring into single systems (e.g. by combining disease and famine EWS) to facilitate data access and maximize comparability.
2. Clarifying definitions of terminology and
methods for assessing predictive accuracy. For instance, the definition of an epidemic (i.e. number of cases in a specific population over a specified time) should be determined before the modelling process is carried out. The accuracy of the system could be measured using standard epidemiological measures (e.g. sensitivity, specificity, positive and negative predictive value, and kappa statistics). The accuracy of predictive models for incidence numbers or rates could be measured as the root mean square error, or as correlation coefficients between observed and predicted case numbers – always against independent data (i.e. not included in the original model building process).
3. Testing for non-climatic influences (e.g. population immunity, migration rates, drug resistance etc.) on disease fluctuations is desirable. This should avoid disease variations being attributed incorrectly to climate. Theoretically, measurements of all relevant factors for which data are available should allow more accurate predictive models, although this is not always feasible in practice.
4. Including health policy-makers in all stages
of system design (e.g. involvement of local control personnel in defining an epidemic and determining the most appropriate warning lead-time). These discussions should relate to specific control decisions and consider local (particularly resource) constraints on the implementation of the EWS. Experience with famine EWS in the 1990s showed the effectiveness of predictions to depend less on their accuracy, more on political factors.
5. Basing final recommendations on EWS
implementation on thorough cost-effectiveness analysis. This should measure the value of collecting data on the various climatic and non-climatic influences for predicting the occurrence, timing and scale of epidemics. In some situations, for example, adding climatic information to an EWS may give only a small increase in predictive power and therefore effectiveness of control, however if sufficiently cheap and simple to collect it justifies inclusion. Economic evaluation of EWS should recognise the opportunity costs involved in diverting scarce resources from other strata of disease transmission.
9

Using climate to predict infectious disease outbreaks: a review
1. Introduction Early identification of an infectious disease outbreak is an important first step towards implementing effective disease interventions and reducing resulting mortality and morbidity in human populations. In the majority of cases, however, epidemics are generally well under way before authorities are notified and able to control the epidemic or mitigate its effects. Both geographical and seasonal distributions of many infectious diseases are linked to climate, therefore the possibility of using seasonal climate forecasts as predictive indicators in disease early warning systems (EWS) has long been a focus of interest. During the 1990s, however, a number of factors led to increased activity in this field: significant advances in data availability, epide-miological modelling and information technology, and the implementation of successful EWS outside the health sector. In addition, convincing evidence that anthropogenic influences are causing the world’s climate to change has provided an added incentive to improve understanding of climate-disease interactions. Projections indicate an approximate average global warming of 2-5 ºC within the twenty-first century (IPCC 2001), accompanied by an increase in the frequency of extreme and anomalous weather events such as heat-waves, floods and droughts (McMichael 2001). It has been widely speculated that these projected changes may have significant impacts on the timing and severity of infectious disease outbreaks. A range of infectious (particularly vector-borne) diseases are geographically and temporally limited by environmental variables such as climate and vegetation patterns. Climatic factors’ impact on infectious diseases can be divided into three main effects: on human behaviour; on the disease pathogen; on the disease vector, where relevant:
Human behaviour
Climate variability directly influences human behaviour, which in turn can determine disease transmission patterns. The strong seasonal pattern of influenza infections in Europe, for example, is thought to reflect humans’ increased tendency to spend more time indoors during winter months (Halstead 1996). Also, the peak of gastro-enteritis
in temperate developed countries during summer months can be related to changes in human behaviour (e.g. more picnics and barbecues) associated with warmer temperatures (Altekruse et al. 1998).
Disease pathogens For infectious diseases where the pathogen replicates outside the final host (i.e. in the environment or an intermediate host or vector), climate factors can have a direct impact on the development of the pathogen. Most viruses, bacteria and parasites do not replicate below a certain temperature threshold (e.g. 18 ºC for the malaria parasite Plasmodium falciparum and 20 ºC for the Japanese encephalitis virus; Macdonald 1957, Mellor and Leake 2000). Ambient temperature increases above this threshold will shorten the development time of the pathogen.
Disease vectors The geographical distribution and development rate of insect vectors is strongly related to temperature, rainfall and humidity. A rise in temperature accelerates the insect metabolic rate, increases egg production and makes blood feeding more frequent (e.g. Mellor and Leake 2000). The influence of rainfall also is significant, although less easy to predict. Rainfall has an indirect effect on vector longevity through its effect on humidity; relatively wet conditions may create favourable insect habitats, thereby increasing the geographical distribution and seasonal abundance of disease vectors. In other cases excess rainfall may have catastrophic effects on local vector populations if flooding washes away breeding sites. Even where linkages between disease and climate are relatively strong, other non-climatic factors also may have a significant impact on the timing and severity of disease outbreaks. One such factor is population vulnerability (e.g. influenced by herd immunity and malnutrition). In Kenya, for example, Shanks et al. (2000) have argued that malaria epidemics in the western highlands may occur only when the non-immune proportion of the population has grown by recovery, births and immigration because local children surviving
10

Using climate to predict infectious disease outbreaks: a review
to adulthood develop immunity. When developing an EWS, factors influencing the population dynamics of the pathogen (e.g. drug resistance) also may have to be considered. Human-related factors such as population movements and agricultural practices also can have considerable impact on disease patterns at various spatial scales. For example, the prevalence of malaria and leishmaniasis sometimes is strongly related to irrigation schemes and deforestation (e.g. Campbell-Lendrum et al. 2001, Guthmann et al. 2002).
Arguably, the importance of non-climatic factors should be assessed and compared to that of climate variability in order to justify the development of climate-based EWS for infectious diseases. The relative contributions of climatic and non-climatic risk factors in explaining temporal variability in disease incidence will, to a large degree, determine the practical utility of a climate-based EWS.
11

Using climate to predict infectious disease outbreaks: a review
2. Historical early warning systems The use of climate data for predicting outbreaks of infectious diseases dates back to work by Gill and others in India. Gill (1923) developed an EWS for malaria based on rainfall, prevalence of enlarged spleens, economic conditions (price of food grains) and epidemic potential (the coefficient of variation of fever mortality during October for the period 1828-1921). A response mechanism also existed which could be initiated within time to avert the worst impact. The model itself was used to predict epidemics from 1921-1942 in 29 districts of the Punjab; although the author believed that warnings in the first two years were issued too late (both in late September when the malaria season occurs in October). Formal assessment of the model’s predictions for 1923-42 indicated that accuracy was significantly better than would have been obtained by chance (Swaroop 1949). However, the model’s exact accuracy is difficult to assess as there is no indication of the number of epidemics correctly predicted. Gill’s approach demonstrates how an EWS can be constructed from relatively few vari-ables although this method can be very demanding in data requirements. Another problem with this analysis is that there is no indication of how an epidemic was defined. Rogers (1923, 1925, 1926) described associations between climatic variables such as temperature, rainfall, humidity and winds, and the incidence of diseases such as pneumonia, smallpox, leprosy and tuberculosis in India and elsewhere. Although Rogers’ inferences were made on a visual rather than statistical basis, these studies highlighted the potential utility of long-term datasets. The leprosy data used, for example, represented 30 years of annual incidence data for the whole of India in combination with meteorological records from over 2 000 sites (Rogers 1923). Based on his conclusions, it was recommended that climatic variables be used for forecasting epidemics of TB, smallpox and pneumonia and for mapping worldwide incidence of leprosy. However, such systems were never implemented on a wide scale. These historical studies demonstrate the usefulness of long-term historical or current datasets in predicting present and future patterns of disease. They also suggest that it is possible to
construct an EWS based on overall associations of climate variables with disease incidence, without necessarily relying on complete knowledge of the effects of climate on all components of the disease transmission cycle. The health sector is now in a much stronger position to explore the utility of EWS. Firstly, standardization of disease diagnosis and networked computerized reporting potentially allow accurate and rapid monitoring of disease incidence (although undermined by patchy and often deteriorating surveillance systems in many parts of the world). Secondly, a wide variety of environmental monitoring data from satellite and ground-based systems are easily accessible at no or low cost, facilitating the investigation of potential links to climate. Thirdly, advances in statistical and epidemiological modelling allow apparent associations to be tested explicitly, rather than relying on visual inspection. Despite the renewed interest in EWS within the health sector, there has been little operational activity to date. This contrasts with other sectors: most notably, a large amount of research and development effort has been focused on the development of famine early warning systems (FEWS) following widespread famine in Africa in the early 1980s. A FEWS has been defined by Davies et al. (1991) as “a system of data collection to monitor people’s access to food, in order to provide timely notice when a food crisis threatens and, thus, to elicit appropriate response.” FEWS operate at various geographical levels (Table 1), with food availability being predicted using risk indicators such as market export prices, pest infestations, war and conflict, nutritional indices and climate and vegetation variables. The Food and Agriculture Organization of the United Nations (FAO) has established the Africa Real Time Environmental Monitoring Information System (ARTEMIS) which uses Meteosat remotely sensed images to monitor crop seasons and rainfall. These can be used to assess environmental conditions during the current growing season relative to previous years.
12

Using climate to predict infectious disease outbreaks: a review
.
Table 1. Examples of FEWS and their geographical coverage.
Level Early warning system
Global Global Information and Early Warning System (GIEWS)
Regional Southern African Development Community (SADC) Comité Permanent Interetats de Lutte contre la
Sécheresse dans le Sahel (CILSS) National USAID Famine early warning system information
network (FEWS NET) Sub-national Save the Children Fund (SCF-UK), Darfur, Sudan Local Suivi Alimentaire Delta Seno (SADS), Mopti, Mali
A critical point in Davies’ definition of a FEWS is the inclusion of an ‘appropriate response’, which suggests that an EWS should be part of a wider, integrated system designed to respond to a crisis. The importance of a response will be discussed below with particular reference to infectious diseases, but it is the phase following the early warning (i.e. mitigation and response) which so far has been crucial in determining the success of FEWS. The message from numerous studies is that EWS are of little use if the capacity to respond is not present – i.e. the resources to react promptly and effectively must be included within the EWS. For instance, the 1990-91 drought in southern Africa was the worst of the twentieth century, placing approximately 40 million people at risk of starvation. A major famine was averted due to both the SADC Regional EWS warning in March 1991 of a substantial grain shortfall and extensive national and international government involvement in ordering and delivering food imports. Experience elsewhere has shown that where decisions are predicated on signs that a crisis is already underway, relief is not delivered on time – as was the case in Sudan and Chad 1990-91.
Additionally, political issues can have a significant impact on the timing of the response. In Ethiopia, for example, early warning information from national systems was ignored for years due to political instability (Buchanan-Smith et al. 1995). In various instances the success of the FEWS approach has been limited by a number of organizational problems, the implications of which should not be overlooked in the health sector: 1. Climate is only one of many determinants
which could be included in an EWS. 2. Early warning of a crisis is no guarantee of
prevention. 3. Interest in preventing a crisis is part of a
wider political, economic and social agenda. In many cases governments are not directly accountable to vulnerable popu-lations.
4. In most cases, the purpose of early warning
is undermined as relief arrives too late due to poor organization at donor-level.
13

Using climate to predict infectious disease outbreaks: a review
3. Conceptual framework for developing climate-based EWS for infectious disease Attempts to initiate EWS development within a specific country should be preceded by a decision-making process which identifies the principal disease(s) of interest. This will depend on the burden of various infectious diseases in the region and on levels of national and international funding available for disease-specific activities. On the basis of an extensive literature review, the following framework for constructing climate-based infectious disease EWS is proposed (Figure 1). The framework comprises four preliminary phases, the EWS itself, and the response and assessment phases. 3.1. Preliminary phases 3.1.1 Evaluating epidemic potential An EWS for an infectious disease should be developed only if the disease is epidemic-prone. Before assessing the epidemic potential of a disease, the word epidemic should be defined (Last 2001): The occurrence in a community or region of cases of an illness, specific health-related behaviour, or other health-related events clearly in excess of normal expectancy. The community or region and the period in which the cases occur are specified precisely. The number of cases indicating the presence of an epidemic varies according to the agent, size, and type of population exposed; previous experience or lack of exposure to the disease; and time and place of occurrence. ‘Outbreak’ is also commonly used, and is defined by Last (2001) as “an epidemic limited to localized increase in the incidence of a disease, e.g. in a village, town or closed institution.” If it is assumed that outbreaks and epidemics differ only in the scale of their effects rather than their aetiology, the concept of climate-based EWS will be applicable equally to both.
Generally, a disease that exhibits large inter-annual variability can be considered as epidemic. The transmission of many infectious diseases varies markedly by season. For example, the majority of influenza outbreaks in the northern hemisphere occur in mid to late winter (WHO 2000) while, even in relatively stable trans-mission areas, peak malaria transmission generally follows periods of heavy rain (Macdonald 1957). Where disease is present in an area, fluctuations in its incidence are considered epidemics only if the number of cases exceeds a certain threshold. A commonly used definition of an outbreak is a situation where reported disease cases exceed a threshold of 1.96 multiplied by the standard deviation of the mean for at least two weeks (Snacken et al. 1992). For influenza, the duration of an epidemic also has been defined as the number of weeks when virus has been isolated from at least 10% of samples (Snacken et al. 1992). In all cases, an epidemic is defined best by examining continuous long-term datasets, therefore setting up surveillance centres is an important preliminary requirement. 3.1.2 Identifying the geographical location of epidemic areas Even if an infectious disease is widespread throughout a country or entire region, geographically the risk of epidemics is not equal at all locations and will reflect, inter alia, the distribution and behaviour of disease vectors and hosts. Geographical variation in risk of epidemics is widely acknowledged, but epidemic-prone areas are seldom defined formally. This is due partly to the difficulties in defining epidemics, partly to lack of long-term surveillance data and changing epidemiology of diseases over time. For example, malaria transmission in many lowland areas of Africa often is characterized as holoendemic, with year round transmission, while neighbouring regions at higher altitude are considered to be epidemic-prone. In these areas, environmental conditions (presumably tempe-rature) are on average less favourable, and transmission occurs in the form of epidemics
14
Using climate to predict infectious disease outbreaks: a review
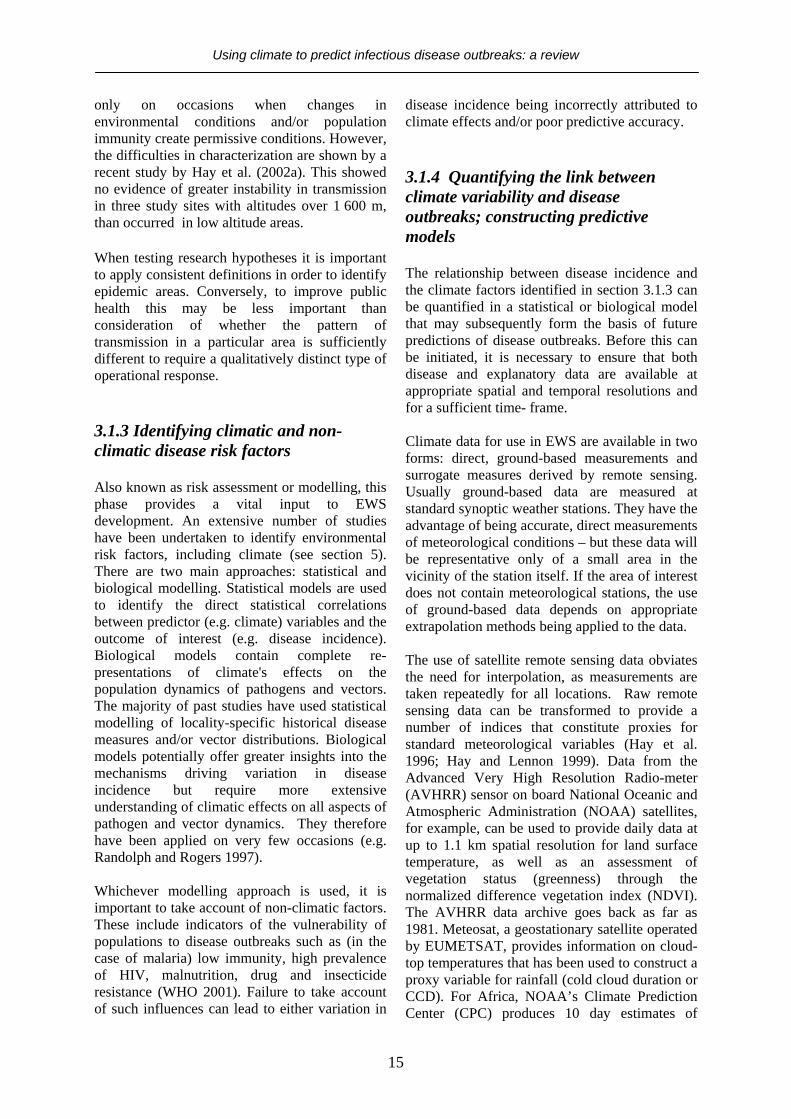
only on occasions when changes in environmental conditions and/or population immunity create permissive conditions. However, the difficulties in characterization are shown by a recent study by Hay et al. (2002a). This showed no evidence of greater instability in transmission in three study sites with altitudes over 1 600 m, than occurred in low altitude areas. When testing research hypotheses it is important to apply consistent definitions in order to identify epidemic areas. Conversely, to improve public health this may be less important than consideration of whether the pattern of transmission in a particular area is sufficiently different to require a qualitatively distinct type of operational response. 3.1.3 Identifying climatic and non-climatic disease risk factors Also known as risk assessment or modelling, this phase provides a vital input to EWS development. An extensive number of studies have been undertaken to identify environmental risk factors, including climate (see section 5). There are two main approaches: statistical and biological modelling. Statistical models are used to identify the direct statistical correlations between predictor (e.g. climate) variables and the outcome of interest (e.g. disease incidence). Biological models contain complete re-presentations of climate's effects on the population dynamics of pathogens and vectors. The majority of past studies have used statistical modelling of locality-specific historical disease measures and/or vector distributions. Biological models potentially offer greater insights into the mechanisms driving variation in disease incidence but require more extensive understanding of climatic effects on all aspects of pathogen and vector dynamics. They therefore have been applied on very few occasions (e.g. Randolph and Rogers 1997). Whichever modelling approach is used, it is important to take account of non-climatic factors. These include indicators of the vulnerability of populations to disease outbreaks such as (in the case of malaria) low immunity, high prevalence of HIV, malnutrition, drug and insecticide resistance (WHO 2001). Failure to take account of such influences can lead to either variation in
disease incidence being incorrectly attributed to climate effects and/or poor predictive accuracy. 3.1.4 Quantifying the link between climate variability and disease outbreaks; constructing predictive models The relationship between disease incidence and the climate factors identified in section 3.1.3 can be quantified in a statistical or biological model that may subsequently form the basis of future predictions of disease outbreaks. Before this can be initiated, it is necessary to ensure that both disease and explanatory data are available at appropriate spatial and temporal resolutions and for a sufficient time- frame. Climate data for use in EWS are available in two forms: direct, ground-based measurements and surrogate measures derived by remote sensing. Usually ground-based data are measured at standard synoptic weather stations. They have the advantage of being accurate, direct measurements of meteorological conditions – but these data will be representative only of a small area in the vicinity of the station itself. If the area of interest does not contain meteorological stations, the use of ground-based data depends on appropriate extrapolation methods being applied to the data. The use of satellite remote sensing data obviates the need for interpolation, as measurements are taken repeatedly for all locations. Raw remote sensing data can be transformed to provide a number of indices that constitute proxies for standard meteorological variables (Hay et al. 1996; Hay and Lennon 1999). Data from the Advanced Very High Resolution Radio-meter (AVHRR) sensor on board National Oceanic and Atmospheric Administration (NOAA) satellites, for example, can be used to provide daily data at up to 1.1 km spatial resolution for land surface temperature, as well as an assessment of vegetation status (greenness) through the normalized difference vegetation index (NDVI). The AVHRR data archive goes back as far as 1981. Meteosat, a geostationary satellite operated by EUMETSAT, provides information on cloud-top temperatures that has been used to construct a proxy variable for rainfall (cold cloud duration or CCD). For Africa, NOAA’s Climate Prediction Center (CPC) produces 10 day estimates of
15

Using climate to predict infectious disease outbreaks: a review
rainfall based on CCD and these, together with NDVI, are disseminated free of charge through the Africa Data Dissemination Service1. Software for extracting and analysing these data for specific localities (WinDisp) also is available as freeware. CCD data go back to 1988, although CPC rainfall estimates are available only from 1995. The analytical steps involved in quantifying climate-disease links can be separated into four main steps: 1. Fitting trend lines and sine-cosine waves (or similar) to remove long-term trends and seasonal variation from outcome and predictor variables. 2. Testing for correlations between climate variability and variability in the outcome variable. 3. Using the derived equations to make predictions for subsequent time points not included in the original model. 4. Measuring levels of agreement between predictors and outcomes. Quantifying the relationship between climate parameters and the occurrence of infectious diseases and/or their vectors in order to predict geographical and temporal patterns of disease has been attempted numerous times (see sections 2 and 5). Although these predictions allow us to map disease and vector ranges, the majority are not EWS, either because they aim to make spatial rather than temporal predictions (i.e. predict disease rates in locations that have not previously been surveyed), or because they are used to explore possible effects of long-term changes in climate over decades, rather than for the next few weeks or months. For EWS the specific analytical methods used, and associated accuracy measures, depend on the specific purpose. For example, one major aim of EWS is to predict the likelihood of an epidemic (i.e. whether a pre-defined threshold of incidence will be exceeded). For this purpose it is appropriate to use techniques for predicting a binary outcome, such as logistic regression or discriminant analysis, with climatic and non-climatic data as the predictor variables and the 1 http://edcsnw4.cr.usgs.gov/adds/
occurrence or non-occurrence of an epidemic as the outcome. Various measurements can be used to represent different aspects of predictive accuracy. These include the overall proportion of correct predictions, the sensitivity (proportion of epidemics correctly predicted), specificity (pro-portion of non-epidemics correctly predicted), positive predictive value (proportion of predictions of an epidemic that were correct), negative predictive value (proportion of predictions of non-epidemics that were correct), and kappa statistics, a measure of increased predictive accuracy above that expected by chance alone (Brooker et al. 2002a). Another major aim of EWS is to predict not only the occurrence, but also the size of an epidemic. In this case, it is appropriate to use regression techniques with a continuous outcome, such as traditional linear and non-linear regression, or more complex regression techniques such as ARIMA (autoregressive-moving average) models that incorporate trends and temporal autocorrelation into a single model. In this case, predictive accuracy can be represented by comparing the magnitude of the observed and predicted epidemic, using the root mean square error, or as correlation coefficients between observed and predicted case numbers (Abeku et al. 2002). In either case, model accuracy should be assessed against independent data (i.e. not included in the original model building process) to give an accurate replication of an attempt to predict a future epidemic. Using the same data to both build and test a model will tend to exaggerate predictive accuracy. 3.2. Early warning systems An EWS encompasses not only predictions of disease in time and space but also active disease surveillance and a pre-determined set of responses. The distinction between prediction and early warning must be clearly defined: early warning is prediction but not all prediction is early warning. In the context of this report, early warnings are considered to come from both model predictions and disease surveillance (i.e. early detection), and include consideration of operational conditions and responses.
16

Using climate to predict infectious disease outbreaks: a review
3.2.1 Disease surveillance Disease surveillance provides a means of monitoring disease incidence over time and, depending on the nature of the system, may be an appropriate instrument for detecting unusual patterns among incidence data. Strictly speaking, disease surveillance does not constitute early warning, even where surveillance is carried out within a specially designed network of sentinel sites. Surveillance provides a means of detecting rather than predicting the onset of an epidemic (there is therefore no lead-time as such). However, a properly designed system should bring forward significantly the point of intervention, thereby increasing the chances of intervention assisting disease control. As a means of validating disease predictions produced by climate-based models surveillance data constitute an integral part of any fully-fledged EWS. In most cases, the existence of accurate, validated predictive models depends on the availability of historical surveillance data. An important first step in EWS development at national level is to assess current approaches to disease surveillance and the quality, quantity and completeness of associated disease data. In many cases – and especially for notifiable diseases in well resourced health systems – existing disease data may be suitable for model development and the system itself quite appropriate for epidemic early detection. In other situations existing systems may need extensive modification, either in the way in which disease data are collected (e.g. diagnostics), or the manner in which data from individual health facilities are collected, aggregated and communicated to higher levels in the health system. Standard health management information system (HMIS) data, for example, commonly aggregate data from individual facilities to the extent that localized disease outbreaks may be obscured. Many standard surveillance approaches also may lack sufficient temporal resolution for epidemic detection, especially where data are reported monthly. Where appropriate disease surveillance systems are in place, tracking disease incidence with reference to expected normal levels of incidence can indicate the onset of an epidemic and (where surveillance data include information on the locality of cases) provide information about its geographical extent. However, aberrations in
surveillance data indicating abnormal levels of disease transmission should be investigated before implementation of large-scale interventions aimed at epidemic control. Such ab-errations may constitute artefacts within the surveillance system (e.g. due to changes in diagnostic practices, shifts in the levels of usage of individual health facilities by the general public etc.) and may not reflect changes in levels of disease transmission. It should also be borne in mind that there is no single, standard approach available for detecting aberrations (i.e. outbreaks) on the basis of surveillance data. A number of detection algorithms have been proposed (for example, Hay et al. 2003) and the sensitivity and specificity of each will vary depending on the nature of the temporal distribution of cases associated with each disease type. Similarly, a number of issues concerning how best to construct a ‘reference’ disease baseline have yet to be resolved fully. For example, what is the minimum number of years of data required to develop a reliable baseline? Should the baseline lengthen with each year of new data, or should older data be discarded? Should data from known epidemic years be omitted from the baseline calculation? These and many other issues await full clarification. 3.2.2. Monitoring disease risk factors As described in section 1.2, a range of weather monitoring datasets is available from earth observation satellites. These (and basic software for display and extraction of data) are free of charge but funds may need to be secured for GIS software capable of more advanced geographical processes and analysis. Also it is important to assess vulnerability indicators such as herd immunity, HIV prevalence, malnutrition and drug resistance at this stage. As discussed below these are difficult to monitor accurately, requiring much manpower and well-organized surveillance systems. There are several vector-related risk factors for vector-borne diseases. These include local vector species composition and the human blood index (i.e. tendency to bite humans). It has been suggested that vector densities may be sufficient to forecast changes in malaria transmission (Lindblade et al. 2000) where surpassing an ‘epidemic threshold’ could indicate a potential epidemic. Alternatively, measures of malaria
17

Using climate to predict infectious disease outbreaks: a review
transmission intensity such as the entomological inoculation rate (EIR – the product of the infection rate in vectors and the biting rate on humans) have been used to assess variation in malaria transmission risk in Africa (Snow et al. 1999, Hay et al. 2000b) and theoretically could be monitored as indicators of potential epidemics. Unfortunately, in most cases, monitoring both EIR and vector densities is too expensive to be feasible (Thomson and Connor 2001). In addition, the quantitative relationships between these variables and the probability and intensity of epidemics remain at the research stage. To our knowledge, there are no published examples where such a system has been put into operation. 3.2.3. Model forecasts Model forecasts can be based on relationships between disease and predictor variables to predict risk in both surveyed and unsurveyed areas. Inputs for such predictions can come from either direct monitoring of known risk factors (e.g. using rainfall measurements in one month to predict the probability of an epidemic of mosquito-borne disease in the next few months) or forecasting based on predictions of these risk factors (i.e. seasonal climate forecasts). The choice will depend on the relative importance of accuracy (usually maximized by using direct observations of risk factors) and lead-time (maximized by predictions of risk factors). Likely predictor climatic variables include temperature, rainfall and the El Niño Southern Oscillation (ENSO), all of which are available. Future climate-based predictions of disease variability require projections of climate events. It is possible to predict weather relatively accurately up to a week ahead using complex atmospheric models (Palmer and Anderson 1994). In some regions and under some existing climate conditions, predictions of climatic conditions up to several months ahead can be made (from similar models). In particular there has been considerable interest in predicting the interannual variations of the atmosphere-ocean system, such as the onset, development and breakdown of ENSO. ENSO is a periodic appearance of warm and cool sea surface water in the central and eastern Pacific ocean (Wang et al. 1999). ENSO events are associated with increased probability of drought in some areas
and excess rainfall in others, along with temperature increases in many regions. In the tropics, variability in the ocean-atmosphere associated with ENSO can be predicted with a lead-time of several seasons (Palmer and Anderson 1994). In Asia and south American regions, there is evidence that ENSO events have an intensifying effect on seasonal malaria transmission, including epidemics (Kovats et al. 2003). Seasonal forecasts of some of these climate variables are available for specific regions of the world2. Forecast lead-times vary for different climate parameters, from one to four months for rainfall in Africa to a year or more for the strength of an ENSO event. Although these forecasts allow relatively long potential lead-times which can be particularly useful for gathering resources necessary for control measures, forecasting climate introduces an additional source of uncertainty into the epidemic prediction. In addition, climate forecasts are not available at high spatial resolutions therefore the epidemic warning will be at a relatively coarse geographical scale. The EWS options presented above demonstrate a trade-off between warning time and specificity. In each case, the precision of predictions depends on how disease and climate indicators are selected – are they long-term projections or short-term active observations? The important question of whether predictions should be relatively general one-year forecasts or more precise predictions for the following week depends mostly on the public health requirements. It has been suggested that epidemic forecasting is most useful to health services when case numbers are predicted two to six months ahead, allowing tactical decision-making (Myers et al. 2000). When longer- term strategic disease control is the objective (e.g. the Onchocerciasis Control Programme in west Africa), longer-term forecasts may be more pertinent. The hierarchical system proposed for malaria EWS in Africa (Cox et al. 1999) takes account of all the different ranges of forecasts which can be developed to suit the various needs of the health sector: 2 e.g. NOAA Climate Prediction Center information at http://www.cpc.ncep.noaa.gov/products
18

Using climate to predict infectious disease outbreaks: a review
3. Is the system cost-effective and could resources have been used more effectively?
1. Long range predictions based on seasonal climate forecasts. The resulting epidemic risk assessments will cover wide areas and have lead-times greater than six months.
Despite many attempts to develop EWS for infectious diseases (and other areas), to our knowledge there are no practical guidelines for assessing the accuracy of an EWS. When an EWS is developed, end-users and researchers should agree on the required level of accuracy, although this may be difficult due to lack of communication and consultation between the different personnel involved in the various stages.
2. Short range predictions based on active monitoring of risk factors (e.g. temperature and rainfall). Geographical resolution is much more specific and lead-times can be measured in weeks rather than months. 3. Early detection of epidemics using disease monitoring. There is no lead-time. per se, but this approach provides specific information on timing and location of an epidemic.
There are two separate principal aims of an EWS: 1. Identify whether an epidemic will occur within a specific population, according to a pre-defined threshold of cases.
3.3. Response phase Appropriate forms of epidemic response will be geographically and disease specific and may consist of either chemo-therapeutic or vector control measures, or a combination of both. Ultimately, responsibility for arranging relief or other measures necessary to contain an epidemic lies with national governments or non-governmental bodies. Response to an epidemic warning ideally should follow a preparedness plan that has been developed through an integrated multisectoral approach (FEWS 2000). The majority of infectious disease outbreaks occur in developing countries where funds are (usually) of crucial importance, an effective response may require the extensive involvement of international organizations.
2. Predict the number of cases within a period of time. The relative importance of the two aims will depend on the control decisions to be taken and the degree of interannual variation in disease. For example, for diseases which are absent from the human population for long periods followed by explosive epidemics, early detection and/or predictions of the probability of an epidemic may be more important than predictions of epidemic size. Assessments should be performed as ‘value-of-information’ assessments; i.e. it must be determined whether collection and analysis of climate data adds sufficient predictive power, or if allocating the funds to collection of other information has a greater effect on predictive power. In terms of assessment, Woodruff et al. (2002) recommend that an EWS for arboviruses should predict an epidemic with at least 90% accuracy (assuming that an epidemic is defined as the number of cases exceeding the mean plus one standard deviation), while Abeku et al. (2002) proposed an assessment based on the forecast error (the log of the difference between observed and expected cases). It is the recommendation of this report that solid guidelines on determining and assessing the precision of EWS predictions should be established.
3.4. Assessment/evaluation phase After the onset of an epidemic (preferably during the response phase), the EWS should be evaluated technically in consultation with end-users. Questions that need to be addressed include: 1. How easy is the system to use? 2. Are the predictions accurate enough to contribute usefully to disease planning? (see below).
19

Figure 1. Framework for developing climate-driven early warning systems for infectious diseases
20
Preliminary phaseData requirements
Components of an Early Warning System
1. Evaluate the epidemic potential of the disease
2. Identify geographical location of epidemic areas
3. Identify climatic and non-climatic disease risk factors
4. Quantify the link between climate variability and disease outbreaks.
Output: predictive models
- Historical or current disease data (monthly or weekly incidence measures)
- Temperature and rainfall variability data (daily or weekly)
- Vegetation data (weekly or monthly)
- Also consider case definition, confounders, population distribution and other known factors
1. Disease surveillance - Non-existing lead-time Output: detection of epidemic
location
2. Monitoring of disease risk factors - Lead-time 1-3 weeks - High geographical resolution Output: early warning of outbreak
3. Model forecasts - > 6 months lead-time - Low geographical resolution Output: early warning of outbreak
- Continuous disease surveillance data - Continuous weather monitoring data (from
satellites) - Measures of vector densities, human biting
rate and entomological inoculation rate (EIR)
- Relationship between climate variability and disease outbreaks (from preliminary phase)
- How easy is the system to use? - Do the predictions fall within the level of accuracy agreed in the
preliminary phase? - Is the system cost-effective? Assess the costs incurred and lost
man-hours saved. This allows cost-effective implementation of control (i.e. before the epidemic peak)
MODEL ASSESSMENT/EVALUATION
1. Assess immediate needs 2. Health care, vector control 3. Epidemiological surveillance 4. Monitor environmental health 5. Public health information and education
- Establish new, or improve existing, surveillance centres
- Run forecasting models - Disseminate results of model
simulations to national stakeholders to ensure necessary response
- Determine most appropriate response action
- Ensure that planned response systems are in place
- Agree on accuracy needed for model predictions
- Identify a priori the availability of data
- Assess availability of funds for acquiring climate and vegetation data and setting up GIS systems
- Ensure that functioning detection and response systems exist
- Train personnel for epidemic preparedness
MEASURES TO BE TAKEN
RESPONSE

Using climate to predict infectious disease outbreaks: a review
4. Identifying candidate diseases for early warning systems
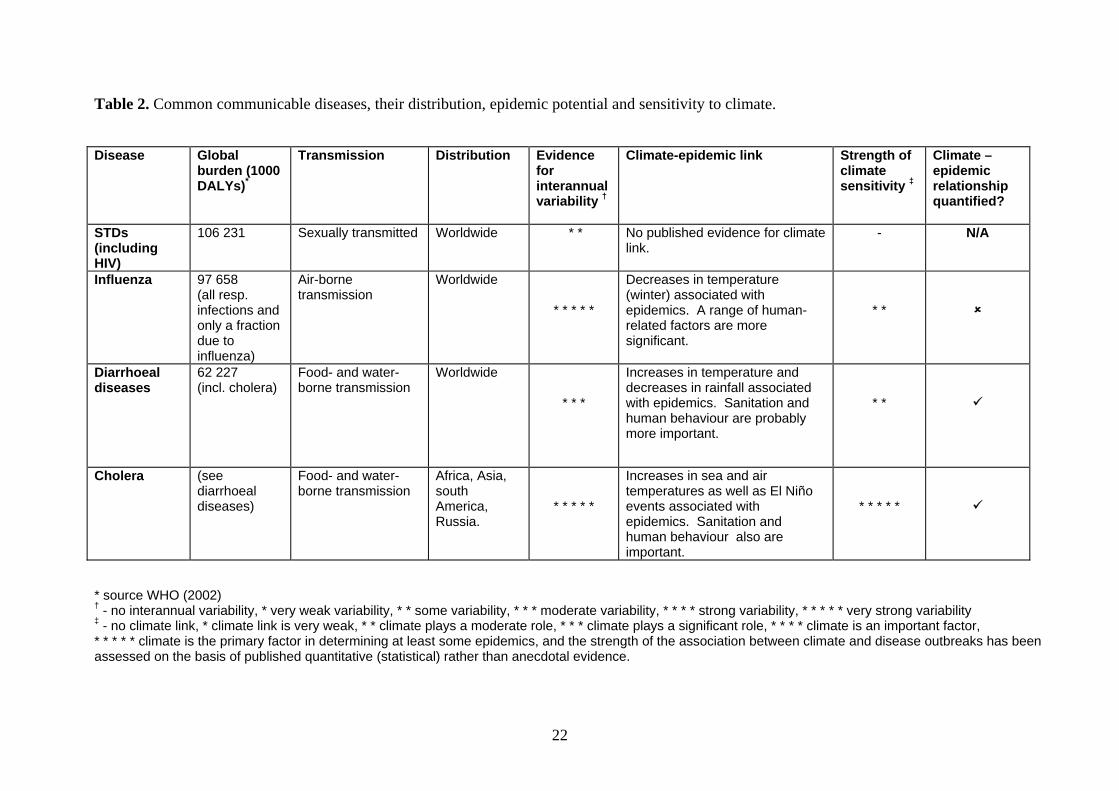
As described in previous sections, a number of preliminary steps are necessary in order to assess the viability of climate-based EWS for a given disease. Table 2 has been constructed by following each of the preliminary steps presented in the framework proposed above. It comprises a list of the most important infectious diseases from the WHO global burden of disease assessment (WHO 2002a), in descending order by global burden, i.e. disability adjusted life years (DALYs). Each disease has been assessed for inclusion in this review according to its associated disease burden, evidence of interannual variability and climate sensitivity. A detailed discussion of the various diseases in the context of this report is given in Appendix 1.
Table 2 indicates that the evidence for climate
sensitivity of a range of epidemic-prone infectious diseases varies both in terms of the number of studies undertaken
and the rigour with which apparent associations
have been tested. Although outbreaks of many infectious diseases have an apparent climate link, still there is a lack of solid statistical support to back up historical anecdotes on the occurrence of epidemics. On the basis of the evidence presented in the table, the following diseases have been selected for further examination in this report:
• Cholera • Malaria • Meningococcal meningitis • Dengue/dengue haemorrhagic fever • Yellow fever • Japanese and St. Louis encephalitis • Rift Valley fever • Leishmaniasis • African trypanosomiasis • West Nile virus • Murray Valley fever and Ross River virus
21
22
Table 2. Common communicable diseases, their distribution, epidemic potenti to climate. Disease Global
burden (1000 DALYs)*
Transmission Distribution Evidencefor interannuvariability
emic link Strength of climate sensitivity ‡
Climate –epidemic relationship quantified?
STDs (including HIV)
106 231 Sexually transmitted Worldwide * * evidence for climate - N/A
Influenza 97 658 (all resp. infections and only a fraction due to influenza)
Air-borne transmission
Worldwide
* * * * *
temperature ciated with range of human-
rs are more
* *
Diarrhoeal diseases
62 227 (incl. cholera)
Food- and water-borne transmission
Worldwide
* * *
temperature and rainfall associated cs. Sanitation and viour are probably nt.
* *
Cholera (see diarrhoeal diseases)
Food- and water-borne transmission
Africa, Asia, south America, Russia.
* * * * *
sea and air as well as El Niño iated with anitation and
viour also are
* * * * *
* source WHO (2002) † - no interannual variability, * very weak variability, * * some variability, * * * moderate strong variability, * * * * * very strong variability ‡ - no climate link, * climate link is very weak, * * climate plays a moderate role, * * * c ificant role, * * * * climate is an important factor, * * * * * climate is the primary factor in determining at least some epidemics, and the s ociation between climate and disease outbreaks has been assessed on the basis of published quantitative (statistical) rather than anecdotal evid
al and sensitivity
al †
Climate-epid
No publishedlink.
Decreases in(winter) assoepidemics. Arelated factosignificant.
Increases in decreases inwith epidemihuman behamore importa
Increases in temperaturesevents assocepidemics. Shuman behaimportant.
variability, * * * * limate plays a signtrength of the assence.

23
Disease Globalburden
Transmission
(1000 DALYs)
Distribution Epidemicpotential †
Climate-epidemic link Strength of climate sensitivity ‡
Climate –epidemic relationship quantified?
Childhood diseases
50 380 Transmitted by person to person contact.
Worldwide No published evidence for climate link
* * * *
-
N/A
Malaria 40 213 Transmitted by the bite of female Anopheles mosquitoes.
Currently endemic in >100 countries throughout the tropics and subtropics
* * * * *
Changes in temperature and rainfall associated with epidemics. Many other locally relevant factors include vector characteristics, immunity, population movements, drug resistance etc.
* * * * *
Tuberculosis
35 792 Air-borne transmission.
Worldwide * * No published evidence for climate link. - N/A
Meningococcal meningitis
5 751 Air-borne transmission
Worldwide Increases in temperature and decreases in humidity associated with epidemics.
* * * *
* * *
Lymphatic filariasis
5 549 Transmitted by the bite of female Culex and Anopheles mosquitoes.
Africa, India, south America and south Asia.
-
Temperature and rainfall determine the geographical distribution of vectors and disease.
* *
N/A
Intestinal nematodes
4 811 Soil and faecal-oral route transmission.
Worldwide Increases in temperature and soil humidity and changes in soil type can affect transmission and geographical distribution.
- *
Leishmaniasis 1 810 Transmitted by the bite of female sandflies.
Africa, central Asia, Europe, India, south America.
* *
Increases in temperature and rainfall associated with epidemics
* * *
* source WHO (2002) † - no interannual variability, * very weak variability, * * some variability, * * * moderate variability, * * * * strong variability, * * * * * very strong variability ‡ - no climate link, * climate link is very weak, * * climate plays a moderate role, * * * climate plays a significant role, * * * * climate is an important factor, * * * * * climate is the primary factor in determining at least some epidemics, and the strength of the association between climate and disease outbreaks has been assessed on the basis of published quantitative (statistical) rather than anecdotal evidence.
Table 2. continued

Table 2. continued
Disease Globalburden
Transmission
(1000 DALYs)
Distribution Epidemicpotential †
Climate-epidemic link Strength of climate sensitivity ‡
Climate –epidemic relationship quantified?
Schistosomiasis 1 713 Water-borne transmission involving intermediate snail host
Africa, east Asia, south America.
*
Increases in temperature and rainfall can affect seasonal transmission and geographical distribution.
*
African trypanosomiasis
1 585 Transmitted by the bite of male and female tsetse flies.
Sub-Saharan Africa
* * *
Changes in temperature and rainfall may be linked to epidemics. Cattle density and vegetation patterns also are relevant factors.
* *
Trachoma 1 181 Transmitted by person to person contact and flies
Africa, Asia, east Europe, south America
-
No published evidence for climate link.
-
N/A
Onchocerciasis 951 Transmitted by Simulid blackflies.
Africa, south-west Asia, south America.
*
Chagas Disease (American trypanosomiasis)
680 Transmitted by blood-feeding Reduviid bugs.
South and central America
*
Presence of bugs associated with high temperatures, low humidity and specific vegetation types.
*
Dengue 433 Transmitted by the bite of female Aedes mosquitoes.
Africa, Europe, south America, south-east Asia, west Pacific.
* * * *
High temperature, humidity and heavy rain associated with epidemic. Non-climatic factors may have more important impact.
* * *
* source WHO (2002) † - no interannual variability, * very weak variabilty, * * some variability, * * * moderate variability, * * * * strong variability, * * * * * very strong variability ‡ - no climate link, * climate link is very weak, * * climate plays a moderate role, * * * climate plays a significant role, * * * * climate is an important factor, * * * * * climate is the primary factor in determining at least some epidemics, and the strength of the association between climate and disease outbreaks has been assessed on the basis of published quantitative (statistical) rather than anecdotal evidence.
24
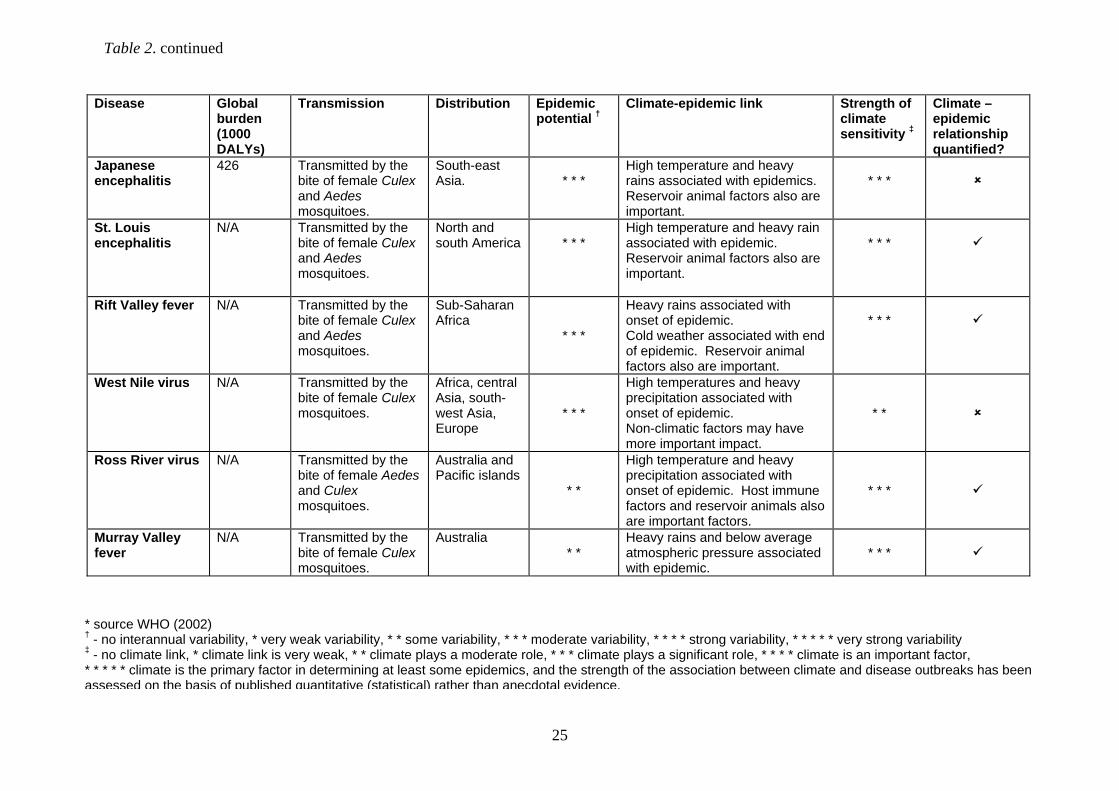
Table 2. continued
Disease Globalburden (1000 DALYs)
Transmission Distribution Epidemicpotential †
Climate-epidemic link Strength of climate sensitivity ‡
Climate –epidemic relationship quantified?
Japanese encephalitis
426 Transmitted by the bite of female Culex and Aedes mosquitoes.
South-east Asia.
* * *
High temperature and heavy rains associated with epidemics. Reservoir animal factors also are important.
* * *
St. Louis encephalitis
N/A Transmitted by the bite of female Culex and Aedes mosquitoes.
North and south America
* * *
High temperature and heavy rain associated with epidemic. Reservoir animal factors also are important.
* * *
Rift Valley fever N/A Transmitted by the bite of female Culex and Aedes mosquitoes.
Sub-Saharan Africa
* * *
Heavy rains associated with onset of epidemic. Cold weather associated with end of epidemic. Reservoir animal factors also are important.
* * *
West Nile virus N/A Transmitted by the bite of female Culex mosquitoes.
Africa, central Asia, south-west Asia, Europe
* * *
High temperatures and heavy precipitation associated with onset of epidemic. Non-climatic factors may have more important impact.
* *
Ross River virus N/A Transmitted by the bite of female Aedes and Culex mosquitoes.
Australia and Pacific islands
* *
High temperature and heavy precipitation associated with onset of epidemic. Host immune factors and reservoir animals also are important factors.
* * *
Murray Valley fever
N/A Transmitted by the bite of female Culex mosquitoes.
Australia * *
Heavy rains and below average atmospheric pressure associated with epidemic.
* * *
* source WHO (2002) † - no interannual variability, * very weak variability, * * some variability, * * * moderate variability, * * * * strong variability, * * * * * very strong variability ‡ - no climate link, * climate link is very weak, * * climate plays a moderate role, * * * climate plays a significant role, * * * * climate is an important factor, * * * * * climate is the primary factor in determining at least some epidemics, and the strength of the association between climate and disease outbreaks has been assessed on the basis of published quantitative (statistical) rather than anecdotal evidence.
25

26
Disease Globalburden (1000 DALYs)
Transmission Distribution Epidemicpotential †
Climate-epidemic link Strength of climate sensitivity ‡
Climate –epidemic relationship quantified?
Lyme disease
N/A Transmitted byixodid ticks.
North America, Europe and Asia.
*
Temperature and vegetation patterns associated with distribution of vectors and disease.
*
Yellow fever N/A Transmitted by the bite of female Aedes and Haemagogus mosquitoes.
Africa, south and central America.
* * * *
High temperature and heavy rain associated with epidemic. Intrinsic population factors also are important.
* *
* source WHO (2002) † - no interannual variability, * very weak variability, * * some variability, * * * moderate variability, * * * * strong variability, * * * * * very strong variability ‡ - no climate link, * climate link is very weak, * * climate plays a moderate role, * * * climate plays a significant role, * * * * climate is an important factor, * * * * * climate is the primary factor in determining at least some epidemics, and the strength of the association between climate and disease outbreaks has been assessed on the basis of published quantitative (statistical) rather than anecdotal evidence.
Table 2. continued

Using climate to predict infectious disease outbreaks: a review
5. Climate-based early warning systems for infectious diseases This section presents an overview of the diseases highlighted in section 4 with respect to their climate sensitivity and the existence or potential development of EWS following the framework previously presented. On the basis of a literature review, each disease is assessed according to the progress made – i.e. which steps of the proposed framework have been completed successfully. 5.1 Cholera The strong, well-studied link between cholera epidemics and fluctuations in climate, suggests potential for constructing climate-based EWS for this disease. Cholera was the first disease for which surveillance and reporting was initiated on a large scale (WHO 2000). Due to its high impact (Table 2) it is one of three diseases currently reportable under the International Health Regulations (IHR) of 1969, which state that the first cases of cholera (both indigenous and imported) should be reported to WHO within 24 hours. Weekly notifications of these reports are published in WHO’s Weekly Epidemiological Records which are freely available. Annual cases and the number of deaths reported to WHO (with substantial gaps) are available for Africa, the Americas and Europe from 1970 onwards and for Asia from 1949. In 1998, 74 countries reported annual cholera cases and deaths. It has been suggested that epidemics of cholera may be predicted by monitoring or forecasting the seasonal abundance of zooplankton in aquatic environments using remotely sensed vegetation images (Colwell 1996; Lobitz et al. 2000). Colwell (1996) suggested a positive relationship between the monthly abundance of Vibrio cholerae and the abundance of copepods in ponds in Bangladesh and presented graphical evidence that cholera cases occurred following rises in sea surface temperature (SST). Lobitz et al. (2000) used weekly 1 km resolution NOAA AVHRR data for SST and sea surface height (SSH) in combination with weekly cholera cases in Bangladesh and found a significant correlation between cycles of cholera cases and
SST during 1992, 1994 and 1995, but did not attempt to construct a predictive model. The authors state that a predictive model for cholera in the Bay of Bengal is currently under development, but to date this model has not been peer reviewed. Despite the immense public health impact of cholera and the large amounts of data available, attempts to develop climate-based cholera predictions remain at an early research stage of development. Possible next steps include evaluating the ability of existing quantitative models for Bangladesh and Peru (based on SST anomalies - Colwell 1996, Lobitz et al. 2000, Pascual et al. 2000, 2002) to predict historical epidemics, and extending similar approaches to test and quantify climate-epidemic links in Africa. Formal tests of predictive accuracy would indicate whether there should be further efforts to incorporate climate-based predictions into operational surveillance systems. In either case, clearly it is important for national health services and their partners (e.g. NGOs and international donors) to ensure that existing disease monitoring and surveillance is improved, particularly in Africa. 5.2 Malaria The early detection, containment and prevention of malaria epidemics constitute one of the four main elements of WHO’s global malaria control strategy3. Within the past 20 years, a few countries have begun to develop EWS which use climatic transmission risk indicators. Progress towards operational systems has been limited, however, because of poor inter-sectoral collaborations and lack of evidence of the cost-effectiveness of malaria EWS. WHO has supported the development of malaria EWS by establishing a technical support network together with a framework that not only defines generic concepts but also identifies early warning and detection indicators which potentially could predict the timing and severity of malaria epidemics (WHO 2001, 2002b). Several field
3 http://www.rbm.who.int
27

Using climate to predict infectious disease outbreaks: a review
projects have been initiated (e.g. in Ethiopia, Kenya and Sudan) but it is not possible to draw definite conclusions from these studies, as the results have yet to be analysed carefully. Quantitative spatial models of the relationship between malaria and climatic factors have been used numerous times for geographical mapping of disease risk, with an overwhelming focus on Africa (e.g. Craig et al. 1999, Snow et al. 1999, Kleinschmidt et al. 2000, 2001). Such risk mapping is a useful preliminary stage, as it can be used to differentiate areas that experience epidemic or highly seasonal transmission, from those with more stable transmission patterns where EWS are likely to be less useful. Monitoring of malaria cases can be used for early detection of an epidemic if collection and notification are timely (i.e. weekly). There are functioning weekly notification systems from sentinel sites in Zimbabwe, Uganda, Kenya, and Madagascar (Cox et al. 1999, WHO 2001). Computerized collection and organization of surveillance of data have begun in Niger and is proposed elsewhere (WHO 2001). However, in most epidemic regions there remains a lack of regular surveillance. Disease surveillance for early detection of malaria epidemics has been used in Thailand where deviations from seasonal averages were used to detect outbreaks (i.e. where monthly case numbers exceed the long-term mean plus two standard deviations). This approach detected 228 out of 237 epidemics in 114 districts from 1973-1981 (Cullen et al. 1984). Using data for Ethiopia, Abeku et al. (2002) have since demonstrated that this simple approach outperforms more advanced methods – although the authors concluded that epidemic early warnings could be improved further by including meteorological factors. As outlined in section 3, early detection of malaria epidemics potentially can be supplemented by prediction. Monitoring data on the various risk factors (e.g. temperature and precipitation measurements from remotely sensed images and ground-based meteorological measurements) can be used as an input to mathematical models, based on correlations between risk factors and disease rates in the past. Currently there are several constraints on this approach for malaria. The first is the relative
paucity of long-term disease datasets for model construction. The most extensive collection of data has been undertaken by the Malaria Risk in Africa (MARA) project, which has established a database on all available malaria data in Africa4. Extensive historical datasets (with gaps) also are available for Europe (Kuhn 2002), India (D. Bradley personal communication) and north America (A. Ter Veen personal communication). However, these data sets lack continuous long time-series at high temporal resolution and therefore have been used principally for mapping geo-graphical variation in risk (e.g. Craig et al. 1999) or investigating relatively long-term trends (Kuhn et al. 2003), rather than epidemic prediction. In addition, non-climatic risk factors such as vector abundance, population immunity and control activities are known to have a strong influence on the potential occurrence of an epidemic (e.g. Thomson and Connor 2001, Lindblade et al. 2000). At present, however, these relationships are not sufficiently well quantified to incorporate into mathematical models that can be widely applied. In addition, it may be impractical or too expensive continually to monitor these risk factors in many endemic regions. Perhaps because of these constraints, relatively few studies have attempted to predict malaria epidemics by either monitoring or advance forecasting of the risk factors (i.e. seasonal climate forecasts)5. Within Africa, Hay et al. (1998) used a model containing NDVI to predict malaria seasons in Kenya, but there was no formal assessment of the accuracy of predictions (apart from a visual comparison to historical maps). More recently, Hay et al. (2002b, 2003) concluded that a malaria emergency in four districts in western Kenya could have been predicted on the basis of rainfall data available in the previous month. In contrast, they suggest that early epidemic detection through case monitoring would not have been possible, due to the weakness of the surveillance system, and that seasonal rainfall forecasts were too unreliable to predict the epidemic with a longer lead-time
4 http://www.mara.org.za/ 5 http://edcsnw4.cr.usgs.gov/adds/imgbrowses1.php?img1='ml'
28
Using climate to predict infectious disease outbreaks: a review
(although Thomson et al. (2003) suggest that seasonal forecasting remains a promising tool). Outside Africa, the only quantitative models which could be used for predicting malaria seasons based on climatic variables are those developed for the Punjab and Sri Lanka (Bouma et al. 1996, Bouma and Van der Kaay 1996), Venezuela (Bouma and Dye 1997) and Colombia (Bouma et al. 1997). These models are not very robust, however, mainly because they operate at a very low resolution for both climate and disease data. As concluded by previous authors, the recent advances in satellite imagery and GIS should provide sufficient environmental data to build satisfactory models of malaria transmission (Thomson and Connor 2001, Rogers et al. 2002). However, there are no existing climate-based EWS in use for malaria. In research terms, the main limitations have been a lack of high-resolution long-time series of malaria cases, insufficient explanatory (climate) data at an appropriate resolution and lack of funds for in-depth studies. Further progress towards accurate predictive models is likely to come through using a wider range of long-term datasets to quantify the links between climatic factors and interannual variability in malaria cases and/or deaths. Although most easily accessible datasets already have been investigated, there are non-computerized surveillance records in Africa, Asia and potentially elsewhere, that could add to the evidence base relating variations in climate to malaria incidence. Additional steps are necessary if research on EWS is to be implemented in control activities in the field. As for other diseases, these include strengthening of reporting systems to promote early detection of epidemics, and better definition of the control responses that should follow an epidemic warning. For example, it may be important to differentiate between maintenance or intensification of regular control activities (Hay et al. 2003), as compared to a qualitatively different response. In east Africa, a major project to develop and test operational EWS within national malaria control programmes was initiated in 2001 and is exploring these and other operational issues6. Preliminary results from this project are expected in 2004. 6 http://www.himal.net.uk
5.3 Meningococcal meningitis Climate’s role in meningitis outbreaks is poorly understood; as yet there have been no attempts to initiate the development of climate-based EWS for this disease. Although the transmission of meningococci has been linked to areas with low absolute humidity, this relationship has not been quantified. However, it is well-known that more important risk factors for meningitis outbreaks are human-related, including vaccination programmes and socioeconomic determinants. In 1998, a total of 98 countries regularly reported meningitis cases to WHO (WHO 2000). Since 1997, countries in the African meningitis belt have undertaken weekly surveillance of disease activity during the meningitis season and provided total annual case numbers to WHO as input for the International Coordinating Group on Vaccine Provision for Epidemic Meningitis Control (ICG). In addition, various NGOs in vulnerable areas regularly supply information on meningitis outbreaks. For modelling purposes, WHO holds non-continuous annual data on meningitis cases from 1966 onwards from reporting countries as well as the (more or less continuous) weekly reports from countries in the African meningitis belt. Although reporting differences mean that the data are not always completely reliable, they should still allow testing of potential correlations with climate variables at low resolution. Currently there is little basis for the development of climate-based EWS for meningococcal meningitis, as a link between epidemics and climate variability has not been established. However, the existence of the long-term datasets would allow such associations to be tested. Progress could be made by testing and quantifying the link between historical outbreaks of meningitis and climate variables using (1) annual data collected worldwide from 1966 onwards and (2) weekly data from the meningitis belt from 1997 onwards. Depending on the results of these analyses, prediction models could be constructed and tested. As for all other diseases, strengthening of surveillance is essential to further develop and test predictive models and, more importantly, support control responses.
29

Using climate to predict infectious disease outbreaks: a review
The MALSAT group, at the Liverpool School of Tropical Medicine in the United Kingdom of Great Britain and Northern Ireland, is currently developing a climate-based system for predicting meningococcal meningitis in Africa. This involves the collection and quantitative analysis of epidemiological data as the baseline for developing a predictive model. The results of this study are not yet available. 5.4 Dengue / dengue haemorrhagic fever (DHF) There has been considerable discussion of the development of dengue early warning systems because of its comparatively high impact in epidemic and endemic areas. Significant progress was made towards the construction of EWS for this disease during the 1990s . Today, passive surveillance of dengue and DHF cases is undertaken in most endemic countries (Gubler 1989). In the United States, local health departments monitor cases which are reported to the Centers for Disease Control and Prevention (CDC) and distributed by the VECTOR list server (Gubler et al. 2001). There has been particular interest in surveillance in Florida and Texas due to recent introductions of cases from nearby Mexico (Gill et al. 2000). In Puerto Rico, an active, laboratory-based surveillance programme receives serum specimens from ambulatory and hospitalized patients throughout the island, clinical reports on hospitalized cases, and copies of death certificates that list dengue as a cause of death. The WHO-managed DengueNet is a global surveillance of dengue and DHF which collects and analyses case data reported from participating partners. Data can be entered directly and accessed via the Internet. Using the extensive dengue database from Puerto Rico, Schreiber (2001) developed a model to predict dengue cases with two week intervals and a three week lead-time. The model uses a quantified relationship between dengue cases and daily temperatures, precipitation and water budget to make predictions. Although this approach is promising, the predictive power is very low for epidemic years (definition of which also is unclear). Additionally, the authors do not indicate whether the assessment was made on
independent data (i.e. data not included in the model). A relatively basic system, the dengue early warning system (DEWS) is based on a malaria EWS, where simple comparisons of the monthly observed number of cases and the epidemic threshold (mean + 2SD, as above) provides information on the onset of an epidemic (Cullen et al. 1984). DEWS uses data from Bangkok and the four main regions of Thailand in combination with remotely sensed environmental data to identify vulnerable areas. Forecasts are made on the basis of time-series analysis of past case numbers, but although the model accurately describes historical epidemics, as yet it is unable to capture epidemic cycles (Myers et al. 2000). A more complicated two-part model has been developed to predict various parameters of the dengue transmission cycle (Focks et al. 1993 a,b). The model consists of the CIMSiM (mosquito) and the DENSiM (dengue) and estimates mosquito density and survival as well as the prevalence and incidence of dengue in a human population, according to site-specific variables such as microclimate. Model simulations have been validated in Bangkok, New Orleans and Honduras during epidemics and overall predictive accuracy of the number of cases ranged from 30-85 % (Focks et al. 1993a, 1993b, Focks et al. 1995). This model represents a full biological approach to an EWS, and requires specific information on a range of parameters such as mosquito breeding, population density, virus serotypes, vertebrate hosts etc. Such monitoring may be costly and time consuming for use in developing countries. Also, there is no attempt to predict deviations from the seasonal pattern (i.e. epidemics) although the authors mention that this may be a future use of the model. The development of EWS for dengue have reached an important stage. In the context of this report, it is necessary to stress that the likelihood and severity of dengue epidemics probably depend at least as much on socioeconomic factors, virus characteristics and human-related variables such as immunity as on climatic factors (Gubler et al. 2001). In light of this, the most important next steps for the establishment of climate-based dengue EWS are to:
30

Using climate to predict infectious disease outbreaks: a review
• properly identify and quantify the re-
lationship between climatic factors and the occurrence of dengue epidemics in vulnerable locations above that explained by other variables,
• simplify the CIMSiM and DENSiM models in order to make them more suitable for use in developing countries where funds and time resources are restricted,
• ensure that local surveillance centres are maintained and expanded to facilitate case reporting at regular intervals (weekly or monthly). If possible, active case detection should be employed.
5.5 African trypanosomiasis During the twentieth century there were three severe epidemics of African trypanosomiasis; the third began in the 1970s and is continuing. In endemic countries, systematic population screening is under-taken currently for Gambiense sleeping sickness (i.e. the non-epidemic form of disease). Although there are extensive national datasets on the annual prevalence of Rhodesiense trypanosomiasis in individual African countries, they are not reported automatically to WHO. Ge-nerally, these data date back to the beginning of the twentieth century but it is expected that they contain large gaps: in Uganda, for example, no data are available for 1970 to 1975 (WHO 2000). In order to assess the quality of these data, first it is necessary to inspect national databases. The DAVID (disease and vector integrated database), which started in the 1990s, contains data on trypanosomiasis cases, tsetse distribution and abundance and cattle densities for Mozambique, Malawi, Zimbabwe, Zambia, South Africa and Ethiopia. It provides a promising means for linking long-term disease data with climate (Robinson 2002). A major limitation of this database, however, is the fact that it does not cover the areas most severely affected by human sleeping sickness (i.e. central and west Africa). Currently there is little evidence to suggest that outbreaks of African trypanosomiasis are linked to climatic factors. However, the DAVID database and WHO data from the early twentieth century should be used to investigate rigorously any potential link between climatic variables, non-climate factors (such as cattle density and environmental modifications) and sleeping
sickness epidemics. The results of such analyses would indicate whether there is any potential to develop and test climate-based warning systems. 5.6 Yellow fever Yellow fever is reportable to WHO under the International Health Regulations. Annual reports of cases and deaths date back to 1948, although it is thought that only a small fraction of cases are reported (WHO 2000). In 1998, only 10 out of a total of approximately 40 epidemic countries reported yellow fever cases and deaths to WHO. . Despite the current lack of quantitative evidence to support the role of climate in driving yellow fever epidemics, there is a biologically plausible link that could be explored using the extensive historical dataset. Statistical modelling could be used to test for and quantify climatic influences on the interannual variation of yellow fever cases and deaths. Where other potential predictor data are available (e.g. monitoring mosquito abundances in many affected urban areas of Asia, Africa and south America, and infection rates in sylvatic monkeys) they should be included in statistical models. 5.7 Japanese encephalitis and St. Louis encephalitis To date, the only EWS for Japanese encephalitis (JE) is based on passive surveillance of human cases which are reported to national reference laboratories in endemic countries. To our knowledge, the most extensive long-term datasets of cases exist in Japan and Thailand (IDSC 2002). A quantitative model has been developed to predict JE epidemics in Thailand using remotely sensed vegetation, rainfall and temperature (Suwannee et al. 1997). It was estimated that increases in rainfall and temperature, of 10% and 20% respectively, would increase the expected number of JE cases by 2-5% in relation to the annual mean. However, there was no attempt to predict future inter-annual variation in JE. Surveillance of St. Louis encephalitis (SLE) in north and South America is part of the CDC
31

Using climate to predict infectious disease outbreaks: a review
arbovirus surveillance programme7 which consists of vector abundance monitoring, surveillance of sentinel chickens and human case monitoring. In Florida, a state-wide sentinel chicken arbovirus surveillance system has been in place since 1978 (Day 2001). Human cases are detected by active surveillance either weekly or monthly, but so far there have been no attempts to develop climate-based EWS for SLE. This is due mainly to the success of bird monitoring in providing warnings a few weeks in advance of an epidemic, sufficient to initiate control responses (Day 2001). It also reflects the fact that links between climate and SLE epidemics still have to be quantified. The feasibility of developing EWS for both JE and SLE should be relatively easy to investigate using available datasets. Existing long-term JE datasets from Thailand and Japan and SLE datasets from north American states could be used to build statistical models to quantify the role of climate. For SLE, it would be important to compare the predictive accuracy with that obtained from current bird monitoring, and evaluate the added-value of incorporating climate inputs. In addition, efficient monitoring programmes in some areas could be expanded to include other endemic countries with less developed programmes (e.g. all affected south American countries for SLE, India and China for JE). 5.8. Rift Valley fever There are no existing EWS in use for Rift Valley fever (RVF), although their development has been proposed and some important steps of the preliminary phase have been completed or are under way. In Kenya, the RVF activity database has facilitated initial risk mapping studies. The database contains monthly information on clinical RVF cases, infected mosquitoes, and antibodies in humans and animals dating back to 1950 (Linthicum et al. 1999, Anyamba et al. 2002). A similar database exists in Zimbabwe (with gaps from the mid 1950s to early 1990s) but information about the maintenance of this database is not available. The successful
7 http://www.cdc.gov/ncidod/dvbid
prediction (but not prevention) of the 1987 epidemic with a lead-time of only a week in Senegal, using only surveillance data on virus activity, indicates that such databases potentially are useful in determining the onset of an epidemic. More work is needed to assess whether the lead-times obtained through this approach are sufficient for planning effective epidemic response. To date the only attempt to predict RVF outbreaks using a quantitative, climate-based model, was published by Linthicum et al. (1999). Their model incorporated SST and NDVI and successfully predicted three out of three RVF outbreaks between 1982 and 1998. Although this approach is promising, the predictive power of the model should now be assessed by its ability to forecast future epidemics. The main limitation of this model is the fact that it was not validated independently (i.e. the epidemics predicted were included in the model). Additionally there is no information on how an epidemic was defined. Recently, the CDC in the United States has established RVF International Programmes in south and east Africa with the aims of (1) assessing the relative importance of climatic and environmental factors on RVF transmission and (2) constructing an environmentally driven model to predict future RVF activity in these areas. These programmes are designed to use recent Landsat satellite images as well as historical climate and vegetation data from the FEWS database (see above). From the information provided, however, it is unclear whether active or passive disease surveillance will be included in the project. Another project, organized by FAO, is using environmental predictors to model RVF seroprevalence in domestic animal species. This project will use existing databases from Senegal and Ethiopia and begin new surveys in Ethiopia (D. Pfeiffer, Royal Veterinary College, personal communication). The development of EWS for RVF is at an early stage. Further progress could be made by ensuring that RVF activity surveillance is maintained in Kenya and Zimbabwe, and expanded to South Africa (where RVF research has been strong for many decades). In addition, it is important to assess the value of sentinel animal (lamb) surveillance to provide epidemic warning (see St. Louis encephalitis), and test the ability of the Linthicum model, using SST and NDVI, to
32
Using climate to predict infectious disease outbreaks: a review
predict historical epidemics outside Kenya, and epidemics within Kenya not included in the model building process. 5.9 Leishmaniasis As discussed above, there is some evidence that climatic factors can influence epidemics of visceral leishmaniasis (VL) and cutaneous leishmaniasis (CL) in Asia. The existence of current surveillance systems, at least for VL, provide the possibility to develop EWS for this disease. The worldwide increase in VL prevalence over the past 20 years has caused a renewed interest in disease surveillance that has generated considerable datasets useful for modelling purposes. In Europe, this increase has been attributed mainly to the increase in HIV. VL is notifiable in 33 out of 88 endemic countries and, since 1994, WHO has received annual data from 13 countries, most of which are in Europe (WHO 2000). Surveillance for CL, and VL in tropical countries, is patchy and the existence of full datasets is questionable. Because of the lack of long-term time series there have been no attempts to quantify the role of climate in the epidemics of leishmaniasis and no EWS have been developed. Leishmaniasis is similar to other diseases described above, in that there is a likely link to climate, but no quantitative studies to test the relative importance of climatic and non-climatic influences have been carried out. This could be addressed by quantifying climate’s role in the interannual variation in VL using the existing datasets from southern and eastern Europe, and the output from these models to predict epidemics of both human and canine VL in selected areas of the Mediterranean. It is also important to strengthen surveillance in other areas subject to epidemics, particularly for VL in south Asia, east Africa and south America, and for CL in Asia. In these areas, it would be useful to identify possible long-term datasets which could be used to quantify climate-epidemic links. 5.10 West Nile virus The well-publicised recent epidemics of West Nile virus (WNV) in the United States have all
occurred during years with warm winters followed by hot, dry summers (Epstein 2001). Although there has been much debate about the role of climate changes in the emergence of WNV in north America (Epstein 2000, Reiter 2000, Epstein 2001) the relative importance of direct climate influences, as opposed to factors such as the availability of mosquito breeding sites and avian hosts, remains a matter of speculation. Since the first outbreak in 1999, surveillance of WNV in the United States has reached a highly efficient stage. A total of 49 states, five cities (e.g. New York) and the District of Colombia have initiated special WNV surveillance programmes which include active monitoring of dead or ill birds, active surveillance of mosquitoes and passive detection of human cases (CDC 2001). Virus activity is reported regularly by state health departments of the CDC from which data are freely available via the Internet. Reports of infected birds, mosquitoes, humans and horses are accumulated at state level and used to produce retrospective maps of disease occurrence (Figure 2). To date, no climate-based EWS have been developed for WNV mainly because the link between climate and WNV epidemics remains unquantified. Instead there has been much focus on predicting outbreaks using surveillance of animal hosts. Eidson et al. (2001) evaluated a system of dead bird surveillance as an EWS for WNV in the state of New York. They found that dead bird reports preceded confirmation of viral activity in humans by at least three months. In 2000, a system based on dead bird surveillance (both sightings and laboratory testing of birds) provided temporal and geographical early warning of virus activity before the first human cases (Eidson et al. 2001). The emphasis on animal surveillance so far has provided encouraging results, but it is not clear whether climate-based models would improve predictive accuracy. However, the extensive data collected in North America show continuous monthly trends in virus activity and can be combined easily with low (state-level) resolution climate and vegetation data to test for possible associations. This analysis could be used to identify climatic risk factors which should be monitored in order to make predictions about coming outbreaks. As for other diseases, if
33

Using climate to predict infectious disease outbreaks: a review
climate variables are shown to be important they should be incorporated into predictive models, and their precision and economic costs compared to predictions from bird surveillance alone. Again as with many other diseases, ongoing
surveillance could be expanded to other epidemic-prone areas, such as southern Europe, North Africa and Asia.
Figure 2. Spread of West Nile Virus by State, 1999-2002. West Nile Virus Activity in the U.S. in Birds, Horses, Mosquitoes, Animals, or Humans (based on information form the United States Centers for Disease Control, CDC ) 5.11 Ross River virus and Murray Valley encephalitis Ross River virus (RRV) is the most important arbovirus in Australia so there has been significant regional interest in both surveillance and epidemic prediction of this disease. Since 1991, RRV has been a notifiable disease in all Australian states and territories, from which monthly and annual cases are reported directly to the Communicable Diseases Network Australia (CDNA). The CDNA now possesses annual and monthly data at national and state level from 1991 to the present, freely available via the Internet8. These data serve partly as an EWS in their own right, but also have provided the basis for the development of early warning models based on rainfall (Woodruff et al. 2002). The models were constructed for early and late season and predicted 62-96% correct in 38 districts, with non-epidemics predicted more successfully 8 http://www.cda.gov.au/cdna/index.htm
than epidemics. This shortcoming most likely is due to the lack of data (because of passive disease surveillance) and the non-inclusion of host-related factors such as virus population dynamics (Woodruff et al. 2002). In spite of the limitations, this study shows that a relatively simple method based on easily obtained variables can be used to construct a functioning EWS. Murray Valley encephalitis (MVE) also is a notifiable disease in Australia with monthly and annual cases reported to the CDNA at state and national level. However, this disease became separately notifiable only in January 2001 therefore the reliability of data before this date may be questionable. The potential for assessing the impact of climate on the interannual variability of MVE is therefore weaker than for RRV. Nicholls (1986) suggested that Darwin spring pressure could be used for predicting MVE epidemics (with a lead-time of weeks rather than months) but made no attempt to develop a predictive model. However, as Kay
34

Using climate to predict infectious disease outbreaks: a review
(1980) concluded, mammalian host and mosquito factors also play a crucial role in transmission; ideally these should be included in an EWS if the improvements to predictive power justify the costs of data collection. Clear climatic influences, coupled with relatively long-term, reliable datasets, suggest that RRV and MVE are strong potential candidates for the development of climate-based EWS. Progress towards this could be made through: 1. Expanding the RRV model to include non-
climatic factors and assess whether this improves the predictive ability of epidemics.
2. Developing a similar model, initially based
on Darwin spring pressure, to predict epidemics of MVE using existing data from 1991 onwards.
3. Improving surveillance of RRV particularly
in the affected southern states of Australia, continuing the separate surveillance of MRV to establish a longer running dataset, and if feasible, changing passive case detection to active surveillance.
5.12 Influenza Although influenza epidemics are associated with winter and thus lower temperatures (Fleming and Cohen 1996), the existing EWS relies on the constant monitoring of virus activity in humans and animals (WHO 2000). The international network for influenza surveillance was established with WHO in 1948. It now consists of 110 National Influenza Centres in 83 countries and 4 WHO Collaborating Centres for Virus Reference and Research (Figure 3). The network is complemented by a
web-based database (FluNet) in which weekly reports of influenza activity in each location are entered9. Results from the network are reviewed by WHO in February and September in order to assess the likelihood of an influenza epidemic and make recommendations to vaccination manufacturers about the antigenic strain likely to be prevalent in the following year. This system has operated for more than 50 years and generally is considered to be successful (WHO 2000), although there have been no formal assessments of the accuracy of epidemic prediction. A collaboration of eight European networks, The European Influenza Surveillance Scheme is an integral part of WHO’s influenza surveillance system which collects information on, among other things, the number of influenza encounters per general practitioner, virus isolation and mortality (Snacken et al. 1992). These data are assessed in comparison to the epidemic threshold discussed above and previous background rates of influenza (Fleming and Cohen 1996) in order to provide early warning of an outbreak. This system of influenza surveillance and early warning is a useful example of how similar systems can be set up for other infectious diseases. Indeed, it is feasible to envisage a scenario where these influenza centres could be equipped to monitor other infectious diseases in the region: for instance, the National Center for Infectious Diseases Surveillance Resources esta-blished by the CDC in Atlanta, Public Health Laboratory Services (PHLS) in the United Kingdom and Agence Française de Sécurité Sanitaire des Aliments in France. However, the WHO influenza network suffers from a lack of geographical coverage, and could be expanded.
9 http://rhone.b3e.jussieu.fr/flunet/www/
35
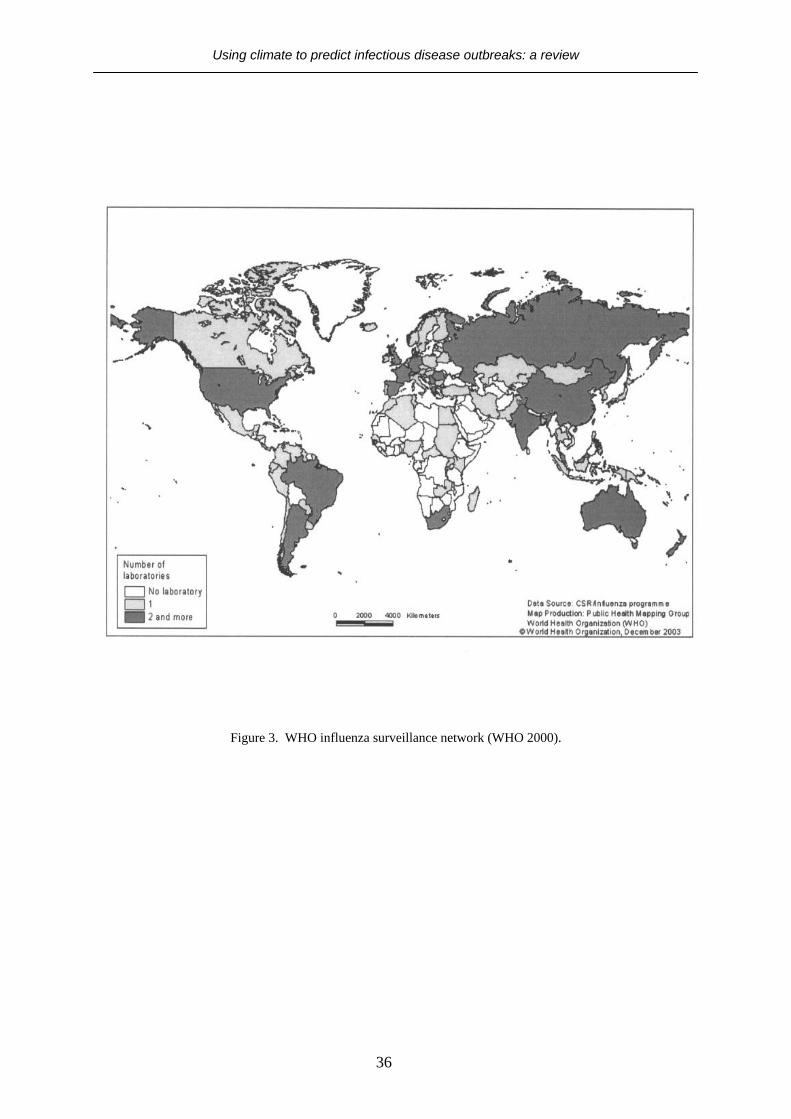
Using climate to predict infectious disease outbreaks: a review
Figure 3. WHO influenza surveillance network (WHO 2000).
36
Using climate to predict infectious disease outbreaks: a review
6. General discussion and conclusions It is generally accepted that the transmission of many infectious diseases is affected by climatic conditions. Diseases caused by pathogens which spend part of their life cycle outside of human, or other warm-blooded, hosts are particularly climate-sensitive. Some of these diseases are among the most important global causes of mortality and morbidity, particularly in poorer populations in developing countries. In many environments, these diseases occur as epidemics, possibly triggered by changes in climatic conditions favouring higher transmission rates. Efforts to develop climate-based disease EWS date back to the work of Gill and co-workers in India in the 1920s. Interest has been rekindled in recent years, however, reflecting in part increasing levels of concern over possible future impacts of climate change on human society. At the same time climate and other environmental data have become widely available and relatively inexpensive, as have GIS and other tools required to link these observations with disease data. There is, therefore, clear justification for in-vestigating climate based EWS’ potential to allow advance planning of control interventions. The case for such EWS has been made repeatedly in review papers, particularly in the context of malaria. In this report, we have reviewed the degree to which important infectious diseases are sensitive to climate variations, and used this as a basis for identifying diseases for which climate EWS may be most useful. We have adapted existing work on malaria to form a generalized framework for developing EWS for infectious diseases. Subsequently we review the extent to which existing systems provide accurate advance warnings of the likelihood and size of epidemics, which are useful in making control decisions. These sections show that there is considerable research activity in this area. Of the diseases that meet our criteria for having the potential for climate-based EWS, only a few (African trypanosomiasis, leishmaniasis, yellow fever and Murray Valley encephalitis) have no reports of an EWS being developed. For others (St. Louis encephalitis and West Nile virus in the United States) there are operational and effective
warning systems, but these rely solely on rapid detection of virus activity – i.e. similar to the strategy employed for early detection and pre-diction of influenza outbreaks. It remains unclear whether adding climatic predictors would improve predictive accuracy or the lead-times associated with these systems. For the remaining diseases (cholera, malaria, meningitis, dengue, Japanese encephalitis, Rift Valley fever and Ross River virus) research projects have demonstrated a temporal link between climatic factors and variation in disease rates. In some of these projects the power to predict epidemics has been tested already, although in many cases the tests are preliminary, based either on a very limited dataset, or with little description of the methods used. There are no published reports indicating that any of these systems currently are used for influencing control decisions (see Table 3), although efforts are being made to set up and validate such EWS for malaria (Southern Africa Malaria Control (SAMC), unpublished reports). It is not clear why such systems are not widely used, but we suggest a number of likely explanations. Firstly, affordable and accessible data and analytical tools have become widely available only recently so that the field is at a relatively early stage of development. Many more studies should be available in the next two to three years as systems are completed and tested in other locations. Secondly, as few studies have been published there are no generally agreed criteria for accessing predictive accuracy. Consequently it is difficult to judge the utility of existing systems. Thirdly, most research projects have been carried out on relatively limited resources and therefore have not been tested in locations outside of the original study area. Fourthly, most studies in this area focus solely on climate factors and do not explicitly test other explanations for variations in disease rates through time. Finally, as such studies are often under-taken as pure research it is not clear to what extent they address specific control decisions and are of use to health policy-makers. Of the several possible ways to help to address these issues, perhaps the most urgent is the need to maintain and strengthen systems for reporting incidence of epidemic diseases. High-quality, long-term disease data are essential for
37

Using climate to predict infectious disease outbreaks: a review
38
generating models relating climate to infectious disease. It is probably true to say that development of EWS for some diseases has stalled because of a shortage of suitable epidemiological data. More commonly, disease/climate modelling has been restricted to discrete datasets for relatively small areas. These exercises are useful for exploring methodological issues and in many cases have produced promising results although there are questions concerning the extent to which findings from these studies can be generalized. The implications of this are that before EWS can be widely tested or applied, usually it will be necessary to bolster existing disease surveillance systems. In some cases there may be a need to begin this process from scratch – in others, viable systems may exist but require modification to ensure timely transfer of data from the point of collection to the point of analysis. For diseases such as malaria, which often are diagnosed clinically, further work needs to be carried out to determine the extent to which quality of diagnosis affects our ability to recognise (and predict) epidemics. There is a need for clear definitions of terminology and methods for assessing predictive accuracy. If the aim of an EWS is to predict epidemic versus non-epidemic time periods, the definition of an epidemic (i.e. number of cases in a specific population over a specified time) should be determined before the modelling process is carried out. The accuracy of such systems could be measured using standard epidemiological measures such as sensitivity, specificity, positive and negative predictive value, and kappa statistics. The accuracy of models which attempt to predict case numbers could be measured as the root mean square error, or as correlation coefficients between observed and predicted case numbers. In all cases, model accuracy should be assessed against independent data (i.e. not included in the original model building process) to give an accurate replication of an attempt to predict a future epidemic.
Predictive models ideally should be tested in a wide range of locations and, if necessary, adjusted to take account of geographical variations in climate-disease relationships. It is important for any EWS to test for non-climatic influences (e.g. the effects of population immunity, migration rates, drug resistance) on variations in disease rates. Thorough testing of alternative explanatory factors should avoid incorrectly attributing disease variations to climate. More importantly in practical terms, measurements of all relevant factors for which data are available should allow the generation of more accurate predictive models. As research into EWS moves beyond the pure research stage, it becomes increasingly important to include health policy-makers in all stages of system design. For example, local disease control personnel should be involved in defining an epidemic and in determining the most appropriate lead-times over which predictive accuracy should be assessed (e.g. whether it is more important to have an accurate prediction with a lead-time of one to two weeks, or a more uncertain prediction with a lead-time of several months). These discussions should take place in relation to specific control decisions, and consider local (particularly resource) constraints on the implementation of the EWS. Experience with the famine EWS in the 1990s showed that its effectiveness depended less on the accuracy of warnings than on political factors. The final decision over whether an EWS should be implemented ideally should be made on the basis of a cost-effectiveness analysis. This should measure the value of information in collecting data on the various climatic and non-climatic influences, in terms of both predicting the occurrence and size of epidemics and increasing the effective use of control resources. In some situations, for example, adding climatic information to an early warning system may give only a small increase in predictive power and therefore cost-effectiveness of control: however it may be sufficiently cheap and simple to collect to justify inclusion.

Disease
Current areas of interest
Data availability Early warning systems
Lead- time
Future areas of interest
Key variables of interest
Action plan
Influenza Worldwide Ongoing surveillance(weekly). Historical data 1948 -
Active disease surveillance in 83 countries. Separate system in Europe
Weeks Worldwide Virus type and subtype
Improve surveillance in Africa and central Asia
Cholera Asia, south America
Ongoing surveillance (weekly). Historical data 1949 -
Passive disease surveillance in 74 countries
Weeks Africa, Asia,south America
Zooplankton abundance, SST, ENSO, human factors, socioeconomic variables
1. Use models for Bangladesh and Peru to predict epidemics 2. Maintain and improve surveillance (Africa) 3. Quantify the role of climate in Africa
Malaria Sub-Saharan Africa, south America, Asia
Ongoing surveillance (weekly) in Zimbabwe, Uganda, Kenya and Tanzania. Historical datasets (India, Africa, south America, Europe)
1. Passive disease surveillance 2. Model-based EWS development under way
1. Weeks 2. Months
Sub-Saharan Africa, south America, Asia
Temperature, rainfall, ENSO, EIR, vector abundance, population immunity, control activities.
1. Maintain surveillance and extend to new areas 2. Quantify role of climate (Africa and Asia) 3. Use models to predict epidemics
Meningococcal meningitis
Sub-Saharan Africa
Ongoing surveillance (weekly). Historical data 1966-
Passive disease surveillance
Weeks Sub-Saharan Africa
Humidity, socioeconomy, vaccination coverage
1.Quantify role of climate 2. Maintain and improve surveillance 3. Construct predictive models
Table 3. Summary of the development of EWS for infectious diseases: current state of the art and future requirements
39

Disease
Current areas of interest
Data availability Early warning systems
Lead- time
Future areas of interest
Key variables of interest
Action Plan
Leishmaniasis South and east Europe
Ongoing surveillance (monthly/annually). Historical data 1994 -
Passive disease surveillance but no warning
N/A Europe,south America, central Asia
Temperature, precipitation, soil humidity, vegetation, HIV, socioeconomy
1. Quantify role of climate 2. Improve surveillance in tropics 3. Identify long-term datasets from tropics
African Trypanosomiasis
Sub-Saharan Africa
Population screening (for non-epidemic form of disease). Historical datasets 1900 -
No warning N/A Sub-Saharan Africa
Temperature, precipitation, vegetation, reservoir animals
1. Quantify role of climate 2. Improve surveillance 3. Construct predictive models
Dengue/Dengue Haemorrhagic Fever
South America, north America, Thailand
Ongoing surveillance in all areas, but data quality (active vs. passive detection) and timing varies greatly.
1.Active disease surveillance in Puerto Rico 2.DEWS testing underway 3.CIMSiM and DENSiM models predict dengue prevalence
1. Weeks 2. 6-12 months 3. Weeks
South America, north America, Thailand
Dengue seroprevalence, socioeconomy, virus type, human immunity, precipitation, temperature and humidity
1. Quantify role of climate 2. Maintain and improve surveillance 3. Simplify CIMSiM and DENSiM models 4. Construct predictive models
Japanese Encephalitis
Japan. Thailand
Ongoing surveillance (monthly/annually). Historical data
1. Passive disease surveillance 2. Predictive model
1.Weeks 2.Months/ years
China, Japan, Thailand
Temperature, rainfall, reservoir animals
1. Quantify role of climate 2. Maintain, improve and extend surveillance 3. Construct predictive models
Table 3. Continued
40
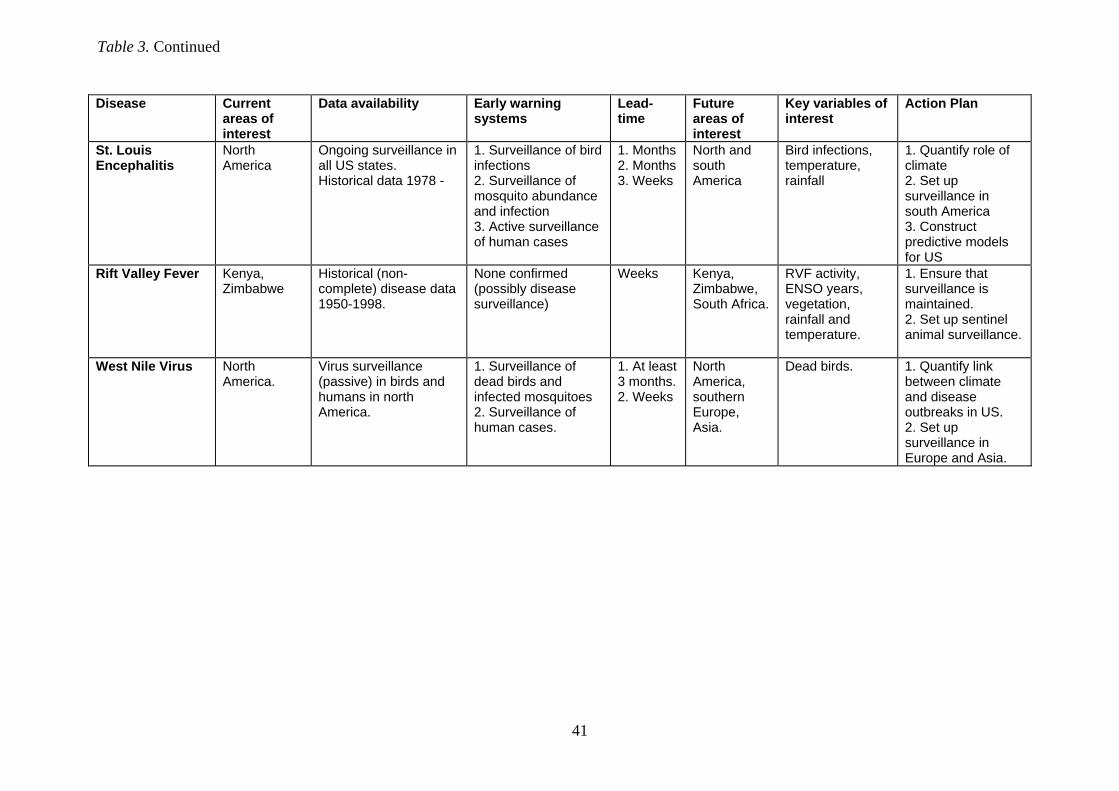
Disease
Current areas of interest
Data availability Early warning systems
Lead- time
Future areas of interest
Key variables of interest
Action Plan
St. Louis Encephalitis
North America
Ongoing surveillance in all US states. Historical data 1978 -
1. Surveillance of bird infections 2. Surveillance of mosquito abundance and infection 3. Active surveillance of human cases
1. Months 2. Months 3. Weeks
North and south America
Bird infections, temperature, rainfall
1. Quantify role of climate 2. Set up surveillance in south America 3. Construct predictive models for US
Rift Valley Fever Kenya, Zimbabwe
Historical (non-complete) disease data 1950-1998.
None confirmed (possibly disease surveillance)
Weeks Kenya,Zimbabwe, South Africa.
RVF activity, ENSO years, vegetation, rainfall and temperature.
1. Ensure that surveillance is maintained. 2. Set up sentinel animal surveillance.
West Nile Virus North America.
Virus surveillance (passive) in birds and humans in north America.
1. Surveillance of dead birds and infected mosquitoes 2. Surveillance of human cases.
1. At least 3 months. 2. Weeks
North America, southern Europe, Asia.
Dead birds. 1. Quantify link between climate and disease outbreaks in US. 2. Set up surveillance in Europe and Asia.
Table 3. Continued
41
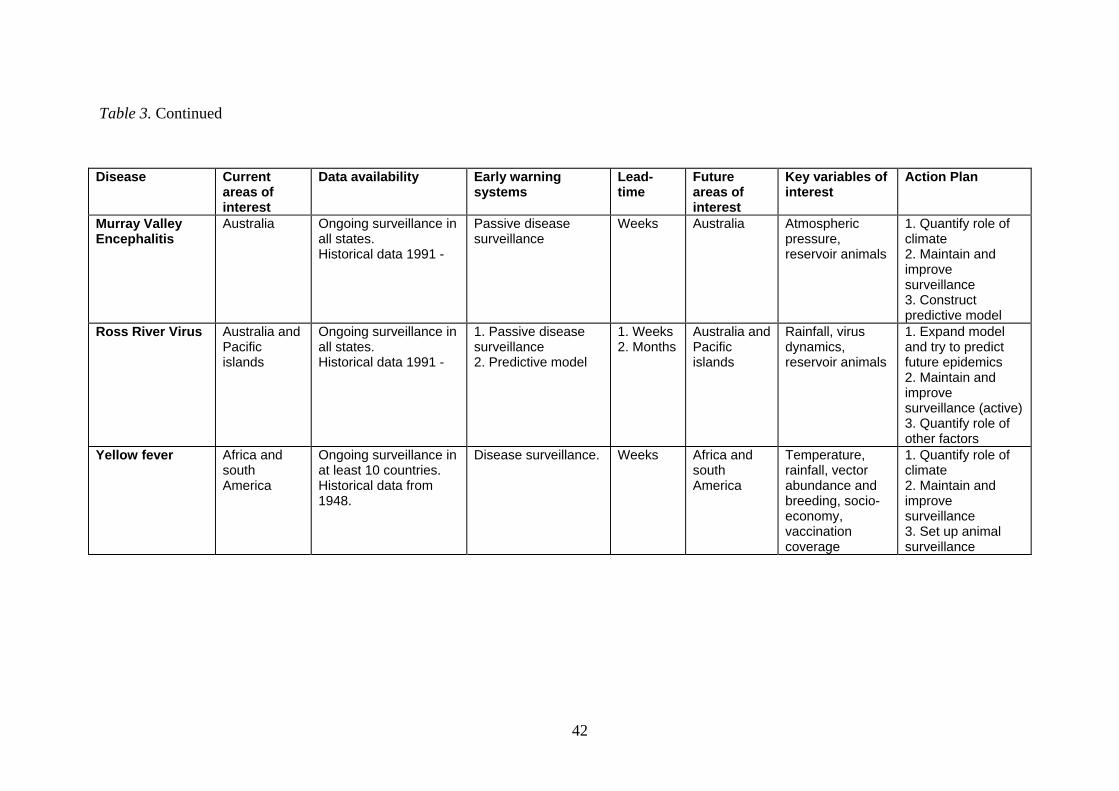
42
Disease
Current areas of interest
Data availability Early warning systems
Lead- time
Future areas of interest
Key variables of interest
Action Plan
Murray Valley Encephalitis
Australia Ongoing surveillance in all states. Historical data 1991 -
Passive disease surveillance
Weeks Australia Atmosphericpressure, reservoir animals
1. Quantify role of climate 2. Maintain and improve surveillance 3. Construct predictive model
Ross River Virus Australia and Pacific islands
Ongoing surveillance in all states. Historical data 1991 -
1. Passive disease surveillance 2. Predictive model
1. Weeks 2. Months
Australia and Pacific islands
Rainfall, virus dynamics, reservoir animals
1. Expand model and try to predict future epidemics 2. Maintain and improve surveillance (active) 3. Quantify role of other factors
Yellow fever Africa and south America
Ongoing surveillance in at least 10 countries. Historical data from 1948.
Disease surveillance. Weeks Africa and south America
Temperature, rainfall, vector abundance and breeding, socio-economy, vaccination coverage
1. Quantify role of climate 2. Maintain and improve surveillance 3. Set up animal surveillance
Table 3. Continued

Using climate to predict infections disease outbreaks: a review
7. Bibliography Abeku TA, et al. (2002) Forecasting malaria incidence from historical morbidity patterns in epidemic-prone areas of Ethiopia: a simple seasonal adjustment method performs best. Tropical Medicine and International Health, 7(10): 851-857. Altekruse SF, Swerdlow DL, Wells SJ. (1998) Factors in the emergence of food borne diseases. Veterinary Clinics of North America Food Animal Practice, 14(1):1 - 15. Anyamba AK, et al.(2002) Mapping potential risk of Rift Valley fever outbreaks in African savannas using vegetation index time series data. Photogrammetric Engineering and Remote Sensing, 68(2): 137-145. Barrera R, et al.(1999) Temporal and spatial patterns of malaria reinfection in northeastern Venezuela. American Journal of Tropical Medicine and Hygiene, 61(5): 784-790. Besancenot JP, Boko M, Oke PC. (1997)Weather conditions and cerebrospinal meningitis in Benin (Gulf of Guinea, West Africa). European Journal of Epidemiology,13(7): 807-815. Bouma MJ, Dye C, van der Kaay HJ. (1996) Falciparum malaria and climate change in the Northwest Frontier Province of Pakistan. American Journal of Tropical Medicine and Hygiene, 55(2): 131-137. Bouma MJ, van der Kaay HJ. (1996) The El Niño Southern Oscillation and the historic malaria epidemics on the Indian subcontinent and Sri Lanka: An early warning system for future epidemics? Tropical Medicine and International Health, 1(1): 86-96. Bouma MJ, Dye C. (1997) Cycles of malaria associated with El Niño in Venezuela. Journal of the American Medical Association, 278(21): 1772-4. Bouma MJ, et al. (1997) Predicting high-risk years for malaria in Colombia using parameters of El Niño Southern Oscillation. Tropical Medicine and International Health, 2(12): 1122-7.
Brightwell R, Dransfield RD, Williams BG. (1992) Factors affecting seasonal dispersal of the tsetse-flies Glossina pallidipes and G. Longipennis (Diptera, Glossinidae) at Nguruman, South-West Kenya. Bulletin of Entomological Research, 82(2): 167-182. Brooker S, Hay SI, Bundy DAP. (2002a) Tools from ecology: useful for evaluating infection risk models? Trends in Parasitology, 18(2): 70-74. Brooker S, et al.(2002b) Using NOAA-AVHRR data to model human helminth distributions in planning disease control in Cameroon, West Africa. Photogrammetric Engineering and Remote Sensing, 68(2): 175-179. Brooker S, Michael E.(2000) The potential of geographic information systems and remote sensing in the epidemiology and control of human helminth infections. Advances in Parasitology, 47: 245-288. Broutet N, et al.(1994) Analysis of the monthly incidence of cutaneous leishmaniasis in Ceara, Brazil, between 1986 and 1990. Sante, 4: 87-94. Buchanan-Smith M, Davies S. (1995) Famine early warning and response: the missing link. London, IT Publications. Campbell-Lendrum D, et al. (2001) Domestic and peridomestic transmission of American cutaneous leishmaniasis: Changing epidemiological patterns present new control opportunities. Memorias Do Instituto Oswaldo Cruz, 96(2): 159-162. Callejas D, et al.(1999) Effect of climatic factors on the epidemiology of rotavirus infection in children under 5 years of age in the city of Maracaibo, Venezuela. Investigaciones Clini-cas,40: 81-94. Carcavallo R.U. (1999) Climatic factors related to Chagas disease transmission. Memorias do Instituto Oswaldo Cruz, 94: 367-369. CDC (2001) West Nile Virus activity – United States 2001. Morbidity and Mortality Weekly Report, 51: 497-498.
43

Using climate to predict infectious disease outbreaks: a review
Checkley W, et al. (2000) Effects of El Niño and ambient temperature on hospital admissions for diarrhoeal diseases in Peruvian children. Lancet, 355(9202): 442-450. Cheesbrough JS, Morse AP, Green SD. (1995) Meningococcal meningitis and carriage in western Zaire: a hypoendemic zone related to climate? Epidemiology and Infection, 114(1):75-92. Colwell RR. (1996) Global climate and infectious disease: The cholera paradigm. Science, 274(5295): 2025-2031. Colwell RR, Patz JA. eds. (1998) Climate, infectious disease and human health: an interdisciplinary perspective. Report from the American Academy of Microbiology, Washington. Cox J, et al. (1999) Mapping malaria in the African highlands. Durban: MARA Technical Report. Craig MH, Snow RW, le Sueur D. (1999) A climate-based distribution model of malaria transmission in sub-Saharan Africa. Parasitology Today, 15(3): 105-111. Crook PD, Crowcroft NS, Brown DW. (2002) West Nile virus and the threat to the UK. Communicable Disease and Public Health, 5(2): 138-143. Cross ER, Bailey RC. (1984) Prediction of areas endemic for schistosomiasis through use of discriminant analysis of environmental data. Military Medicine, 149(1): 28-30. Cross ER, Hyams KC. (1996) The potential effect of global warming on the geographic and seasonal distribution of Phlebotomus papatasi in southwest Asia. Environmental Health Perspectives, 104(7): 724-727. Cross ER, Newcomb WW, Tucker CJ. (1996) Use of weather data and remote sensing to predict the geographic and seasonal distribution of Phlebotomus papatasi in southwest Asia. American Journal of Tropical Medicine and Hygiene, 54(5): 530-536.
Cullen JR, et al. (1984) An epidemiological early warning system for malaria control in northern Thailand. Bulletin of the World Health Organization, 62(1): 107-114. Davies FG, Linthicum KJ, James AD. (1985) Rainfall and epizootic Rift-Valley fever. Bulletin of the World Health Organization, 63(5): 941-943. Davies S, Buchanan-Smith M, Lambert R. (1991) Early warning in the Sahel and Horn of Africa: the state of the art. A review of the literature. Volume One. Brighton: Institute of Development Studies. Day JF. (2001) Predicting St. Louis encephalitis virus epidemics: lessons from recent, and not so recent, outbreaks. Annual Review of Entomology, 46: 111-138. Day JF, Stark LM. (2000) Frequency of Saint Louis encephalitis virus in humans from Florida, USA: 1990-1999. Journal of Medical Entomology, 37(4): 626-633. Dister SW, et al. (1997) Landscape characterization of peridomestic risk for Lyme disease using satellite imagery. American Journal of Tropical Medicine and Hygiene, 57(6): 687-692. Dumonteil E, et al. (2002) Geographic distribution of Triatoma dimidiata and transmission dynamics of Trypanosoma cruzi in the Yucatan Peninsula of Mexico. American Journal of Tropical Medicine and Hygiene, 67(2): 176-183. Eidson, M, et al. (2001) Dead bird surveillance as an early warning system for West Nile virus. Emerging Infectious Diseases, 7(4): 631-635. Elsafi SH, Peters W. (1991) Studies on the leishmaniases in the Sudan.1. Epidemic of cutaneous leishmaniasis in Khartoum. Transactions of the Royal Society of Tropical Medicine and Hygiene, 85(1): 44-47. Epstein PR, (1993) Algal Blooms in the spread and persistence of cholera. Biosystems, 1(2-3): 209-221. Epstein PR, (2000) Is global warming harmful to health? Scientific American, 283(2): 50-57.
44

Using climate to predict infectious disease outbreaks: a review
Epstein PR, (2001) West Nile virus and the climate. Journal of Urban Health-Bulletin of the New York Academy of Medicine, 78(2): 367-371. Estrada-Peña A. (1998) Geostatistics and remote sensing as predictive tools of tick distribution: a cokriging system to estimate Ixodes scapularis (Acari : Ixodidae) habitat suitability in the United States and Canada from advanced very high resolution radiometer satellite imagery. Journal of Medical Entomology, 35(6): 989-995. Estrada- Peña A. (2002) Increasing habitat suitability in the United States for the tick that transmits Lyme disease: A remote sensing approach. Environmental Health Perspectives, 110(7): 635-640. Fevre EM, et al. (2001) The origins of a new Trypanosoma brucei rhodesiense sleeping sickness outbreak in eastern Uganda. Lancet, 358(9282): 625-628. FEWS (2000) Framework for food crisis contingency planning and response. Famine early warning system. Washington, United States Agency for International Development. Fleming DM, Cohen JM. (1996) Experience of European collaboration in influenza surveillance in the winter of 1993-1994. Journal of Public Health Medicine, 18(2): 133-142. Focks DA, et al.(1993a) Dynamic life table model for Aedes aegypti (Diptera, Culcidae) - analysis of the literature and model development. Journal of Medical Entomology, 30(6): 1003-1017. Focks DA, et al. (1993b) Dynamic life table model for Aedes aegypti (Diptera, Culicidae) - simulation and validation. Journal of Medical Entomology, 30(6): 1018-1028. Focks DA, et al. (1995) A simulation-model of the epidemiology of urban dengue fever - literature analysis, model development, preliminary validation, and samples of simulation results. American Journal of Tropical Medicine and Hygiene, 53(5): 489-506. Franke CR, et al. (2002) Impact of the El Niño/Southern Oscillation on visceral
leishmaniasis, Brazil. Emerging Infectious Diseases, 8(9): 914-917. Gill CA. (1921) The role of meteorology in malaria. Indian Journal of Medical Research, 8: 633-693. Gill CA, (1923) The prediction of malaria epidemics. Indian Journal of Medical Research, 10: 1136-1143. Gill J, Stark LM, Clark GC. (2000) Dengue surveillance in Florida, 1997-98. Emerging Infectious Diseases, 6(1): 30-35. Greenwood B, Mutabingwa T. (2002) Malaria in 2002. Nature, 415(6872): 670-672. Gubler DJ, Trent DW. (1993) Emergence of epidemic dengue/dengue haemorrhagic fever as a public health problem in the Americas. Infectious Agents and Disease, 2(6): 383-393. Gubler DJ, (1989) Surveillance for dengue and dengue haemorrhagic fever. Bulletin of the Pan American Health Organization, 23: 397-404. Gubler DJ, et al. (2001) Climate variability and change in the United States: Potential impacts on vector- and rodent-borne diseases. Environmental Health Perspectives, 109: 223-233. Guthmann JP, et al. (2002) Environmental factors as determinants of malaria risk. A descriptive study on the northern coast of Peru. Tropical Medicine and International Health, 7(6): 518-525. Hales S, Hearnden M. (1999) Modelling the potential distribution of disease vectors in New Zealand. Presented at the SIRC 99 – The 11th Annual Colloquium of the Spatial Information Research Centre. University of Otago, Dunedin, New Zealand 13 - 15th December, 1999. Hales S, et al. (1999) El Niño and the dynamics of vector-borne disease transmission. Environmental Health Perspectives, 107(2): 99-102. Halstead SB. (1996) Human factors in emerging infectious disease. WHO EMRO, 2: 21-29.
45

Using climate to predict infectious disease outbreaks: a review
Hay SI, et al. (1996) Remotely sensed surrogates of meteorological data for the study of the distribution and abundance of arthropod vectors of disease. Annals of Tropical Medicine and Parasitology, 90(1): 1-19. Hay SI, Snow RW, Rogers DJ. (1998) From predicting mosquito habitat to malaria seasons using remotely sensed data: practice, problems and perspectives. Parasitology Today, 14(8): 306-313. Hay S I, Lennon JJ. (1999) Deriving meteorological variables across Africa for the study and control of vector-borne disease: a comparison of remote sensing and spatial interpolation of climate. Tropical Medicine and International Health, 4(1): 58-71. Hay SI, et al. (2000a) Etiology of interepidemic periods of mosquito-borne disease. Proceedings of the National Academy of Sciences of the United States of America, 97(16): 9335-9339. Hay SI, et al. (2000b) Annual Plasmodium falciparum entomological inoculation rates (EIR) across Africa: literature survey, internet access and review. Transactions of the Royal Society of Tropical Medicine and Hygiene, 94(2): 113-127. Hay SI, et al. (2002a) Clinical epidemiology of malaria in the highlands of western Kenya. Emerging Infectious Diseases, 8(6): 543-548. Hay SI, et al. (2002b) Defining and detecting malaria epidemics in the highlands of western Kenya. Emerging Infectious Diseases, 8(6): 555-562. Hay SI, et al. (2003) Forecasting, warning, and detection of malaria epidemics: a case study. Lancet, 361(9370): 1705-1706. Hendrickx G, et al. (1999) A systematic approach to area-wide tsetse distribution and abundance maps. Bulletin of Entomological Research, 89(3): 231-244. Hubalek Z, Halouzka J. (1999) West Nile fever - a re-emerging mosquito-borne viral disease in Europe. Emerging Infectious Diseases, 5(5): 643-650. Hurlbut HS. (1973) The effect of environmental temperature upon the transmission of St. Louis
encephalitis virus by Culex pipiens quinquefasciatus. Journal of Medical Entomology, 10: 1-12. IDSC. (2002) Japanese Encephalitis. Infectious Disease Surveillance Centre, National Institute of Infectious Diseases, Japan. IPCC. (2001) Climate change 2001: impacts, adaptation and vulnerability. Contribution of working group II to the third assessment report of the Intergovernmental Panel on Climate Change (IPCC). McCarthy JJ, et al., eds. Cambridge: Cambridge University Press. Jetten TH, Takken W. (1994) Anophelism without malaria in Europe: A review of the ecology and distribution of the genus Anopheles in Europe. Wageningen: Wageningen Agricultural University, The Netherlands. Kay BH. (1980) Towards prediction and surveillance of Murray Valley encephalitis activity in Australia. Australian Journal of Experimental Biology and Medical Science, 58: 67-76. Kilian AHD, et al. (1999) Rainfall pattern, El Niño and malaria in Uganda. Transactions of the Royal Society of Tropical Medicine and Hygiene, 93(1): 22-23. Kitron U, et al. (1997) Spatial analysis of the distribution of lacrosse encephalitis in Illinois, using a geographic information system and local and global spatial statistics. American Journal of Tropical Medicine and Hygiene, 57(4): 469-475. Kleinschmidt I, et al. (2000) A spatial statistical approach to malaria mapping. International Journal of Epidemiology, 29(2): 355-361. Kleinschmidt I, et al. (2001) An empirical malaria distribution map for West Africa. Tropical Medicine and International Health, 6(10): 779-786. Kovats RS, et al. (2003). El Niño and health. Lancet. In press. Kuhn, KG, Campbell-Lendrum DH, Davies CR. (2002) A continental risk map for malaria mosquito (Diptera: Culicidae) vectors in Europe. Journal of Medical Entomology, 39(4): 621-630.
46

Using climate to predict infectious disease outbreaks: a review
Kuhn KG, et al. (2003) Malaria in Britain: past, present, and future. Proceedings of the National Academy of Sciences of the United States of America, 100(17): 9997-10001. Last JM, (2001) A dictionary of epidemiology. London: Oxford University Press. Lina B, et al. (1996) Surveillance of community-acquired viral infections due to respiratory viruses in Rhone-Alpes (France) during winter 1994 to 1995. Journal of Clinical Microbiology, 34(12): 3007-3011. Lindblade KA, Walker ED, Wilson ML. (2000) Early warning of malaria epidemics in African highlands using Anopheles (Diptera: Culicidae) indoor resting density. Journal of Medical Entomology, 37(5): 664-674. Lindsay SW, Thomas C J. (2000) Mapping and estimating the population at risk from lymphatic filariasis in Africa. Transactions of the Royal Society of Tropical Medicine and Hygiene, 94: 37-45. Linthicum KJ, et al. (1999) Climate and satellite indicators to forecast Rift Valley fever epidemics in Kenya. Science, 285(5426): 397-400. Linthicum KJ, et al. (1990) Application of polar-orbiting, meteorological satellite data to detect flooding in Rift Valley fever virus vector mosquito habitats in Kenya. Medical and Veterinary Entomology, 4: 433-438. Lipp EK, Huq A, Colwell RR. (2002) Effects of global climate on infectious disease: the cholera model. Clinical Microbiology Reviews, 15(4): 757-770. Lobitz B, et al. (2000) Climate and infectious disease: Use of remote sensing for detection of Vibrio cholerae by indirect measurement. Proceedings of the National Academy of Sciences of the United States of America, 97(4): 1438-1443. Lorenzo MG, Lazzari CR. (1999) Temperature and relative humidity affect the selection of shelters by Triatoma infestans, vector of Chagas disease. Acta Tropica, 72(3): 241-249.
MacDonald G. (1957) The epidemiology and control of malaria. London: Oxford University Press. Maelzer D, et al. (1999) El Niño and arboviral disease prediction. Environmental Health Perspectives, 107(10): 817-818. Malone JB, et al. (1994) Temperature data from satellite imagery and the distribution of schistosomiasis in Egypt. American Journal of Tropical Medicine and Hygiene, 50(6): 714-722. Mansour NS, et al. (1989) Cutaneous leishmaniasis in the peace keeping force in East Sinai. Journal of the Egyptian Society for Parasitology, 19:725-32. McMichael AJ. (2001) Human frontiers, environments and disease. Past patterns, uncertain futures. Cambridge: Cambridge University Press. Mellor PS, Leake CJ. (2000) Climatic and geographic influences on arboviral infections and vectors. Revue Scientifique et Technique de l’Office International des Epizooties, 19(1): 41-54. Molesworth AM, et al. (2002) Where is the meningitis belt? Defining an area at risk of epidemic meningitis in Africa. Transactions of the Royal Society of Tropical Medicine and Hygiene, 96(3): 242-249. Molineaux L, Gramiccia G. (1980). Garki project: research on the epidemiology and control of malaria in the Sudan Savana of west Africa. World Health Organization, Geneva. (OMS Op.103). Molyneux DH. (1997) Patterns of change in vector-borne diseases. Annals of Tropical Medicine and Parasitology, 91(7): 827-839. Myers MF, et al. (2000) Forecasting disease risk for increased epidemic preparedness in public health. Advances in Parasitology, 47: 309-330. Neronov VV, Malkhazova SM. (1999) Relationship between zoonotic cutaneous leishmaniasis morbidity in the Murgab oasis and hydrometeorological factors. Meditzinskaya Parazitol (Moscow), 4: 22-26.
47

Using climate to predict infectious disease outbreaks: a review
Nicholls N. (1986) A method for predicting Murray Valley encephalitis in southeast Australia using the Southern Oscillation. Australian Journal of Experimental Biology and Medical Science, 64: 587-594. Nicholson MC, Mather TN. (1996) Methods for evaluating Lyme disease risks using geographic information systems and geospatial analysis. Journal of Medical Entomology, 33(5): 711-720. Okuno T, et al. (1975) Japanese encephalitis surveillance in China (Province of Taiwan) during 1968-1971. Geographical and seasonal features of case outbreaks. Japanese Journal of Medical Science and Biology, 28: 235-253. Orloski KA, et al. (2000) Surveillance for Lyme disease - United States 1992-1998. Morbidity and Mortality Weekly Report, Centres for Disease Control, Atlanta, 28: 1-11. Palmer T, Anderson D. (1994) The prospects for seasonal forecasting – a review paper. Quarterly Journal of the Royal Meteorological Society, 120: 755-796. Pascual M, Bouma MJ, Dobson AP. (2002) Cholera and climate: revisiting the quantitative evidence. Microbes and Infection, 4(2): 237-245. Pascual M, et al.(2000) Cholera dynamics and El Niño-Southern Oscillation. Science, 289(5485): 1766-9. Peterson AT, et al. (2002) Ecologic niche modeling and potential reservoirs for Chagas disease, Mexico. Emerging Infectious Diseases, 8(7): 662-667. Pinfold JV, Horan NJ, Mara DD. (1991) Seasonal effects on the reported incidence of acute diarrhoeal disease in northeast Thailand. International Journal of Epidemiology, 20(3): 777-786. Poveda G, et al. (2001) Coupling between annual and ENSO timescales in the malaria-climate association in Colombia. Environmental Health Perspectives, 109(5): 489-493. Randolph SE. (2001). The shifting landscape of tick-borne zoonoses: tick-borne encephalitis and Lyme borreliosis in Europe. Philosophical
Transactions of the Royal Society of London Series B Biological Sciences.; 356:1045-56 Randolph SE. (2000) Ticks and tick-borne disease systems in space and from space. Advances in Parasitology, 47: 217-243. Randolph SE, Rogers DJ. (1997) A generic population model for the African tick Rhipicephalus appendiculatus. Parasitology, 115: 265-279. Rao JS, et al. (2000) Japanese encephalitis epidemic in Anantapur district, Andhra Pradesh (October-November 1999). Journal of Communicable Disease, 32: 306-312. Reiter P. (2000) From ague to West Nile. Scientific American, 283(6): 10-10. Reiter P. (2001) Climate change and mosquito-borne disease. Environmental Health Perspectives, 109: 141-161. Rickman R. (2002) Controlling epidemic sleeping sickness. Trends in Parasitology, 18(2): 61-62. Robinson TP. (1998) Geographic information systems and the selection of priority areas for control of tsetse-transmitted trypanosomiasis in Africa. Parasitology Today, 14(11): 457-461. Robinson TP. (2002) DAVID, a disease and vector integrated database. Programme Against African Trypanosomiasis Newsletter, February 2002, FAO, Rome, Italy. Robinson TP, Rogers DJ, Williams B. (1997) Mapping tsetse habitat suitability in the common fly belt of southern Africa using multivariate analysis of climate and remotely sensed data. Medical and Veterinary Entomology, 11: 223-234. Rodo X, et al. (2002) ENSO and cholera: a nonstationary link related to climate change? Proceedings of the National Academy of Sciences of the United States of America, 99(20): 12901-12906. Rogers DJ. (2000) Satellites, space, time and the African trypanosomiases. Advances in Parasitology, 47: 129-171.
48

Using climate to predict infectious disease outbreaks: a review
Rogers DJ, et al. (2002) Satellite imagery in the study and forecast of malaria. Nature, 415(6872): 710-715. Rogers DJ, Hay SI, Packer MJ. (1996) Predicting the distribution of tsetse flies in West Africa using temporal Fourier processed meteorological satellite data. Annals of Tropical Medicine and. Parasitology, 90(3): 225-41. Rogers DJ, Randolph SE. (1993) Distribution of tsetse and ticks in Africa - past, present and future. Parasitology Today, 9(7): 266-271. Rogers DJ, Williams B. (1994) Tsetse distribution in Africa: seeing the wood and the trees. In: Edwards PJ, May R, Webb NR., eds. Large-scale ecology and conservation biology. London: Blackwell Scientific. Rogers L. (1923) The world incidence of leprosy in relation to meteorological conditions and its bearings on the probable mode of transmission. Transactions of the Royal Society of Tropical Medicine and Hygiene, 16: 440-464. Rogers L. (1925) Climate and disease incidence in India with special reference to leprosy, phthisis, pneumonia and smallpox. Journal of State Medicine, 33: 501-510. Rogers L. (1926) Small-pox and climate in India: forecasting of epidemics. Medical Research Council Reports, 101: 2-22. Schreiber KV. (2001) An investigation of relationships between climate and dengue using a water budgeting technique. International Journal of Biometeorology, 45(2): 81-89. Seaman J, Mercer AJ, Sondorp E. (1996) The epidemic of visceral leishmaniasis in western upper Nile, southern Sudan: course and impact from 1984 to 1994. International Journal of Epidemiology, 25(4): 862-871. Shaman J, Day JF, Stieglitz M. (2002) Drought-induced amplification of Saint Louis encephalitis virus, Florida. Emerging Infectious Diseases, 8(6): 575-580. Shanks GD, et al. (2000) Changing patterns of clinical malaria since 1965 among a tea estate population located in the Kenyan highlands.
Transactions of the Royal Society of Tropical Medicine and Hygiene, 94(3): 253-255. Shope R. (1991) Global climate change and infectious diseases. Environmental Health Perspectives, 96: 171-174. Singh RBK, et al.(2001) The influence of climate variation and change on diarrhoeal disease in the Pacific Islands. Environmental Health Perspectives, 109(2): 155-159. Smith T, et al. (1995) Mapping the densities of malaria vectors within a single village. Acta Tropica, 59(1): 1-18. Snacken R, et al. (1992). Five years of sentinel surveillance of acute respiratory infections (1985-1990) - the benefits of an influenza early warning system. European Journal of Epidemiology, 8(4): 485-490. Snow RW, et al. (1999) A preliminary continental risk map for malaria mortality among African children. Parasitology Today, 15(3): 99-104. Speelmon EC, et al. (2000) Cholera incidence and El Niño-related higher ambient temperature. Journal of the American Medical Association, 283(23): 3072-3074. Sundar S, et al. (2000) Failure of pentavalent antimony in visceral leishmaniasis in India: report from the center of the Indian epidemic. Clinical Infectious Diseases, 31:1104-7. Suwannee A et al. (1997). Application of Remote Sensing and Geographic Information System for Vector-Borne Disease in Humans Through Rice Agroeco System. Asian Conference on Remote Sensing. October 20-24, 1997, Malaysia. Swaroop S. (1949) Forecasting of epidemic malaria in the Punjab, India. American Journal of Tropical Medicine, 29: 1-17. Thomson MC, Connor SJ. (2001) The development of malaria early warning systems for Africa. Trends in Parasitology, 17(9): 438-445. Thomson MC, et al. (2003) Malaria early warning in Kenya and seasonal climate forecasts. Lancet, 362(9383): 580-580.
49

Using climate to predict infectious disease outbreaks: a review
WHO (2000). WHO report on global surveillance of epidemic-prone infectious diseases. Geneva: World Health Organization. (WHO/CDS/CSR/ISR/2000.1.).
Tong SL, Hu WB.(2001) Climate variation and incidence of Ross River virus in Cairns, Australia: a time-series analysis. Environmental Health Perspectives, 109(12): 1271-1273.
WHO (2001). Malaria early warning systems. Concepts, indicators and partners. A framework for field research in Africa. Geneva: World Health Organization. (WHO/CDS/RBM 2001.32.).
Vasconcelos PF, et al. (2001) Epidemic of jungle yellow fever in Brazil, 2000: implications of climatic alterations in disease spread. Journal of Medical Virology, 65: 598-604.
Wang HJ, et al.(1999) El Niño and the related phenomenon Southern Oscillation (ENSO): the largest signal in interannual climate variation. Proceedings of the National Academy of Sciences of the United States of America, 96(20): 11071-11072.
WHO (2002a). The World Health Report 2002. Reducing risks, promoting healthy life. Geneva: World Health Organization. WHO (2002b). Prevention and control of malaria epidemics. 3rd meeting of the Technical Support Network. Geneva: World Health Organization. (WHO/CDS/RBM/2002.40.).
Werneck GL, et al. (2002) The burden of Leishmania chagasi infection during an urban outbreak of visceral leishmaniasis in Brazil. Acta Tropica, 83(1): 13-18.
Woodruff RE, et al. (2002) Predicting Ross River virus epidemics from regional weather data. Epidemiology, 13(4): 384-393.
50

Using climate to predict infections disease outbreaks: a review
Appendix 1. Selection of infectious diseases for inclusion in the report, starting with the diseases with the strongest evidence for interannual variability and link between climatic factors and disease outbreaks. Cholera Cholera is a bacterial infection causing both local outbreaks and worldwide pandemics of which the current, and longest running, began in 1961 (Colwell and Patz 1998). Regional epidemics occur seasonally and are associated with periods of excessive rainfall, warm temperatures and increases in plankton populations (Colwell and Patz 1998, Shope 1991, Lipp et al. 2002). The plankton link is due to cholera-carrying algae which are eaten by shellfish and other crustacea and thereby incorporated into the human food chain (Colwell 1996). To date it has been suggested that monthly and annual cholera deaths are positively correlated with SST (an ENSO correlate) in Bangladesh (Pascual et al. 2000, Rodo et al. 2002) and Peru (Epstein 1993, Colwell 1996, Speelmon et al. 2000). Air temperatures also have been positively associated with outbreaks in Peru (Speelmon et al. 2000). Malaria Malaria is the most important vector-borne disease in the world today, causing an estimated annual one million deaths worldwide, 90% of which occur in sub-Saharan Africa (Greenwood and Mutabingwa 2002). It is a disease of tropical and temperate countries between the latitudinal limits of northern Korea and southern Africa with prevalence increasing generally towards the equator. Often outbreaks occur following periods of increased rain and temperatures. It is thought that primarily this is due to positive effects on vector breeding (e.g Kilian et al. 1999), development rates (e.g Jetten and Takken 1994), parasite sporogony (MacDonald 1957) and ultimately entomological inoculation rates. Several studies have demonstrated a positive association between the abundance of Anopheles gambiae s.l and rainfall (e.g. Molineaux and Gramiccia 1980, Smith et al. 1995). Gill (1921) found that increased malaria mortality in the Punjab correlated with high rainfall the previous
month. More recent studies have shown a significant relationship between fluctuations of SST (associated with ENSO) and malaria cases or mortality rates in south America (Barrera et al. 1999, Bouma et al. 1997, Bouma and Dye 1997, Poveda et al. 2001) and Asia (Bouma et al. 1996, Bouma and van der Kaay 1996). Hay et al. (2002a) concluded that there is no similar connection between malaria in Kenya and ENSO. The role of climate as a driving force for malaria epidemics still is fiercely debated, mainly because in some areas the link is clear (e.g. fringe areas) while in others it is more complicated or absent. In this respect, the importance of intrinsic population and extrinsic non-climatic factors also should be assessed when deciding whether to proceed with the construction of operational climate-based EWS. Meningococcal meningitis Meningococcal meningitis is an air-borne bacterial disease which shows a highly seasonal and epidemic pattern in sub-Saharan Africa where outbreaks occur during the hot, dry season and decline when the rainy season begins (Colwell and Patz 1998, Molesworth et al. 2002). In northern Benin, Besancenot et al. (1997) suggested a positive relationship between low absolute humidity and interannual variability in meningitis. Cheesbrough et al. (1995) reviewed geographical locations of epidemics and found that outbreaks were concentrated within a zone where absolute humidity remained below 10 g/m3
throughout the year. Dengue / dengue haemorrhagic fever Dengue epidemics in urban areas are due to transmission by Aedes aegypti and can involve up to 70-80% of the population (Gubler and Trent 1993). Historical outbreaks of dengue and DHF characteristically have been associated with high rainfall as well as elevated temperatures and
51

Using climate to predict infectious disease outbreaks: a review
humidity (Gubler et al. 2001) due to direct and indirect effects on pathogen and vector biology. Hales et al. (1999) suggested a positive relationship between monthly dengue incidence and temperature and rainfall in the south Pacific. More recently, Hay et al. (2000a) analysed monthly time series of DHF in Bangkok in correlation with mean monthly temperature and precipitation and found that the interannual periodicity of dengue was not matched by similar periodic cycles in temperature and rainfall. The authors concluded that intrinsic factors such as population immunity were more likely than climate to be the driving factors behind the epidemics. Yellow fever Yellow fever is a zoonotic viral disease which causes severe epidemics among humans in urban settings where Ae. aegypti is the only vector. The recent expansion of the geographical distribution of Ae. aegypti in many parts of the world (e.g. Asia and Europe) has caused concern about the emergence of yellow fever transmission, particularly in relation to climate changes (IPCC 2001). The development of Ae. aegypti as well as the extrinsic incubation period of the yellow fever virus are highly dependent on temperature (Shope 1991) but the importance of temperature fluctuations in the inter-annual variation of disease is unclear (Reiter 2001). Vasconcelos et al. (2001) recently suggested that an increase in temperatures and rainfall in Bahia State, Brazil, may have contributed significantly to the epidemic in 2000. The role of rainfall in yellow fever epidemics also remains unquantified, but increases in precipitation are thought to be the principal driving factor behind epidemics by increasing the number of mosquito breeding sites (Reiter 2001). African trypanosomiasis Large scale epidemics of Rhodesiense African trypanosomiasis (sleeping sick-ness) are currently spreading across central and eastern Africa (Rickman 2002). There has been much recent interest in analysing the relationship between spatial patterns of African trypanosomiasis and climatic factors (Rogers 2000), with particular focus on constructing predictive maps of tsetse distributions and abundance for future control purposes (e.g.
Rogers et al. 1996, Robinson 1998, Hendrickx et al. 1999). Past studies have suggested a link between temperature and vegetation and the distribution of tsetse in Africa (e.g. Robinson et al. 1997, Rogers and Williams 1994, Brightwell et al. 1992). At present there is no clear link between climate and interannual variability of sleeping sickness. Rogers (2000) reported a significant correlation between monthly cases of sleeping sickness and LST in Uganda. Also it is likely that rainfall patterns may be related to temporal distribution of disease. However, because of the strong association between cattle and human infections (e.g. Fevre et al. 2001, Rogers 2000) and other non-climatic factors such as population movements, deforestation and drug resistance, the climate’s exact role in sleeping sickness epidemics remains unclear. Japanese encephalitis and St. Louis encephalitis Japanese encephalitis (JE) is the leading cause of viral encephalitis in Asia with 30 000 – 50 000 cases reported annually10. The disease is transmitted by Culex mosquitoes and maintained in a zoonotic system of pigs, water birds and humans. JE causes severe epidemics which are highly seasonal, occurring during the monsoon season when temperatures reach 30 °C or above (Mellor and Leake 2000). Rao et al. (2000) observed that JE cases peaked with an increase in temperature and rainfall in India while epidemics in China have been shown to be associated with rice cultivation (Okuno et al. 1975). St. Louis encephalitis (SLE) is transmitted by Culex mosquitoes and normally circulates in wild birds with occasional outbreaks in humans. Before an SLE epidemic, the number of virus-infected mosquitoes increases through amplifi-cation, resulting in a rapidly increasing number of infected birds and humans (Day and Stark 2000). It has been proposed that certain biotic and abiotic conditions favour early season virus amplification and transmission. For instance, an increase in temperature favours the development of mosquitoes and virus incubation (Hurlbut 1973). The 1999 outbreak in New York City occurred during the hottest and driest summer on record (Day 2001). Recently, Shaman et al. 10 http://www.cdc.gov/ncidod/dvbid/jencephalitis/index.htm
52

Using climate to predict infectious disease outbreaks: a review
(2002) suggested a positive relationship between droughts and SLE in chickens in Florida, indicating that periods of drought followed by heavy rain may be a driving factor behind SLE epidemics (Day 2001). Rift Valley fever Rift Valley fever (RVF) is a zoonotic disease which is transmitted by female culicine mosquitoes and causes occasional serious outbreaks in humans. Throughout history, these epidemics have been associated with above average rainfall and temperatures but until the late 1980s this link was based mainly on observations and anecdotal evidence (Davies et al. 1985). Linthicum et al. (1990) were among the first to provide evidence that significant increases in rainfall results and associated flooding were linked to RVF outbreaks. Recently, it has been shown (Anyamba et al. 2002) that RVF outbreaks are positively associated with warm ENSO events and above-normal precipitation (indicated by remotely sensed vegetation patterns). A quantitative analysis of Kenya data from 1950 to 1998 suggested that RVF activity was significantly correlated with SST and NDVI obtained from satellite images (Linthicum et al. 1999). Leishmaniasis Leishmaniasis is caused by a protozoan parasite which is transmitted by the bite of phlebotomine sandflies. Visceral leishmaniasis (VL) is highly epidemic in certain areas such as Afghanistan, where a serious epidemic was reported recently11, and in large areas of north Africa, south-west Asia and south America (e.g. Seaman et al. 1996, Sundar et al. 2000, Werneck et al. 2002). Outbreaks of VL have been associated with population movements (Mansour et al. 1989), environmental modifications such as dam constructions and deforestation (Molyneux 1997) and changes in the availability of zoonotic reservoirs. Climatic factors are thought to have been responsible for outbreaks in Sudan in 1985 and 1986 where heavy rains favoured sandfly breeding (Elsafi et al. 1991). Franke et al. (2002) demonstrated a positive relationship between the incidence of VL and ENSO in Brazil. In
11 http://www.who.int/emc/diseases/leish/leisdis1.html
Turkmenistan, Neronov and Malkhazova (1999) suggested a significant positive relationship between the incidence of zoonotic cutaneous leishmaniasis, soil moisture and temperatures. Broutet et al. (1994) concluded that epidemics of CL in Brazil between 1986 and 1990 may have been attributable to climatic factors. In addition, the seasonal abundance of sand-flies in south-west Asia also has been shown to be dependent on temperature and humidity (Cross and Hyams 1996, Cross et al. 1996). West Nile virus West Nile virus (WNV) is a zoonotic arbovirus which is transmitted by urban culex mosquitoes and occasionally produces illness in humans. Despite the relatively low importance to human health, WNV has received intense attention during the past two to three years because of much publicised outbreaks in United States’ cities (e.g. Crook et al. 2002, Epstein 2001). All recent WNV epidemics have occurred during unusually hot and dry periods (Epstein 2001), fuelling speculation about a strong climate-disease link. It has been suggested that the emergence of virus transmission in north America and parts of Europe (Hubálek and Halouzka 1999) may be due to climate change (Epstein 2001). Although there have been no attempts to identify and quantify statistically the link between climate and outbreaks of WNV, the disease is considered relevant to this report. Ross River virus and Murray Valley encephalitis Ross River virus (RRV) is an enzootic arthritic infection transmitted by Aedes and Culex mosquitoes with occasional spill-over to humans following virus amplification (see above). Epidemics of RRV occur mainly in southern Australia (Hales and Hearnden 1999) and typically are initiated in early summer. Previous studies have suggested a positive association between interannual RRV fluctuations and rainfall and temperatures (Tong and Hu 2001, Woodruff et al. 2002) as well as ENSO patterns (Maelzer et al. 1999). Woodruff et al. (2002) undertook the first quantitative analysis of monthly RRV cases and climatic factors which suggested that excess winter and summer rainfall were significantly associated with RRV cases.
53

Using climate to predict infectious disease outbreaks: a review
Murray Valley encephalitis (MVE) is caused by a JE-related flavivirus, transmitted by culex mosquitoes in Australia. Epidemics have been associated with above average rainfall (e.g. Kay 1980). Nicholls (1986) suggested that below average atmospheric pressure (an index of the Southern Oscillation and a precursor of heavy rainfall) was positively related to the occurrence of MVE the following year. Epidemic diseases with a weak or non-existing climate link Influenza is highly epidemic and local outbreaks or pandemics occur due to changes in the viral antigenic proteins. Although seasonal flu-ctuations are associated with decreases in temperatures (Lina et al. 1996), non-climatic factors such as virus type, vaccination pro-grammes, human behaviour etc. are more strongly related to epidemics. Non-cholera diarrhoeal diseases present a very strong seasonal pattern with an increase in cases during hotter seasons in developing countries with poor sanitation. Studies have indicated that hospital admissions for diarrhoea can increase with increasing temperatures in Asia and south America (e.g. Pinfold et al. 1991, Callejas et al. 1999). Checkley et al. (2000) demonstrated that temperature increases related to an ENSO event in Peru coincided with a 200 % increase in diarrhoea-related admissions. Singh et al. (2001) suggested a negative association between water availability and diarrhoea rates indicating that non-climatic factors such as sewage system quality and general sanitation also are strongly related to outbreaks, both independently, and through interaction with climate effects. Childhood diseases, including measles, pertussis and poliomyelitis, are highly epidemic in nature with outbreaks in the western world concentrated mainly during the school season. There is no direct link between climate factors and epidemics of these diseases which are strongly influenced by vaccination programmes, human behaviour (contact rates) and population movements. Sexually transmitted diseases, including HIV, are listed as the most important infectious diseases worldwide. Although moderately epidemic in nature, there is no evidence that the prevalence or outbreaks of these diseases are associated in any
way with climatic factors. The most important determinants of outbreaks are human-related and include sexual habits, contraception use and a range of socioeconomic variables. Tuberculosis (TB) is a contagious air-borne disease which kills approximately two million people each year. The current worldwide epidemic is increasing and becoming more dangerous due to the emergence of multi-drug resistant TB and the spread of HIV/AIDS. Epidemics of TB are strongly linked to drug resistance, HIV prevalence and general socioeconomic conditions but there is no immediate connection to climatic factors. Non-epidemic diseases with some climate link Intestinal nematodes develop in soil and it is known that factors such as soil humidity and temperature have a strong influence on the developmental rates of the immature stages (Brooker and Michael 2000). As there is little or no interannual variation in helminth infection incidence, research has focused on developing geographical risk maps (Brooker et al. 2002a). Thus, remotely sensed and ground-measured climate data have been used to construct risk maps of helminth infections in west Africa (Brooker et al. 2002b) with the aim of designing mass treatment programmes. The geographical distribution of schistosomiasis is related to environmental factors such as rainfall, temperature and water body composition (Brooker and Michael 2000). Remotely sensed surrogates of these climatic variables have been used for preliminary risk mapping of schistosomiasis in the Caribbean, Philippines and Egypt (Malone et al. 1994, Cross and Bailey 1984, Cross et al. 1984). Although infection patterns in most areas show a seasonal trend, following rainfall and temperature fluctuations (Brooker and Michael 2000), transmission is usually relatively stable from year to year. Lymphatic filariasis is transmitted by a range of culicine and anopheline mosquito species in the tropics. Epidemics do not occur because the disease is chronic and clinical symptoms usually do not arise until years after infection. Recent studies have demonstrated that the geographical distribution of filariasis and its vectors in Africa
54
Using climate to predict infectious disease outbreaks: a review
is related to temperature and precipitation (Lindsay and Thomas 2000). This information was used to predict the distribution of lymphatic filariasis and construct disease risk maps for Africa. Chagas disease (South American trypano-somiasis) is caused by the protozoan parasite Trypanosoma cruzi. The disease is primarily a zoonotic infection with small sylvatic mammals such as opossums and rodents acting as reservoirs. Human disease is chronic with a long latency period and infection often can be asymptomatic. Chagas disease is not epidemic in nature and therefore EWS are not considered important for this disease. As with the other examples discussed above, there has been much interest in identifying the climatic correlates of disease and vector distributions (Peterson et al. 2002). Thus, it has been demonstrated that the presence of triatomine bugs is associated with high temperatures and low humidity (Carcavallo 1999, Lorenzo and Lazzari 1999) as well as particular types of vegetation (Dumonteil et al. 2002).
Lyme disease is widely distributed in endemic foci in north America, Europe and Asia and limited only by the distribution of the ixodid tick vector. The relationship between environmental factors and the distribution of ticks and Lyme disease is well understood. A series of studies in north America have suggested that NDVI and temperatures are good predictors of both tick distributions and Lyme disease risk (Kitron et al. 1997, Estrada-Peña 2002) and these relationships have been used for predictive risk mapping at state and national level (Nicholson and Mather 1996, Dister et al. 1997, Kitron et al. 1997, Estrada-Peña 1998). Similar approaches, using remotely sensed vegetation data, have been taken for Europe (Randolph 2001, Randolph 2000). The incidence of Lyme disease shows a peak during the summer months (Orloski et al. 2000). There is no evidence that such peaks are climate-related and it is commonly accepted that seasonal increases are due to changes in human behaviour (i.e. outdoor activities) which increase the rate of contact between humans and ticks.
55