using clinical trial data to construct policies for guiding clinical decision making s. murphy &...
TRANSCRIPT
Using Clinical Trial Data to Construct Policies for Guiding
Clinical Decision Making
S. Murphy & J. Pineau
American Control Conference Special Session
June, 2009
2
Outline
– Sequential Clinical Decision Making– Clinical Trials– Challenges
• Incomplete, primitive, mechanistic models
• Measures of Confidence
– Illustration
Long Term Goal: Improving Clinical Decision Making Using Data

3

4
Critical Decisions
• Which treatments should be offered first?
• How long should we wait for these treatments to work?
• How long should we wait before offering a transition to a maintenance stage?
• Which treatments should be offered next?
• All of these questions relate to the formulation of a policy.

5
Examples of Clinical Trials
• Sequenced RBT: Goal is to improve neonatal outcomes
• STAR*D: Goal is to achieve depression remission.
6
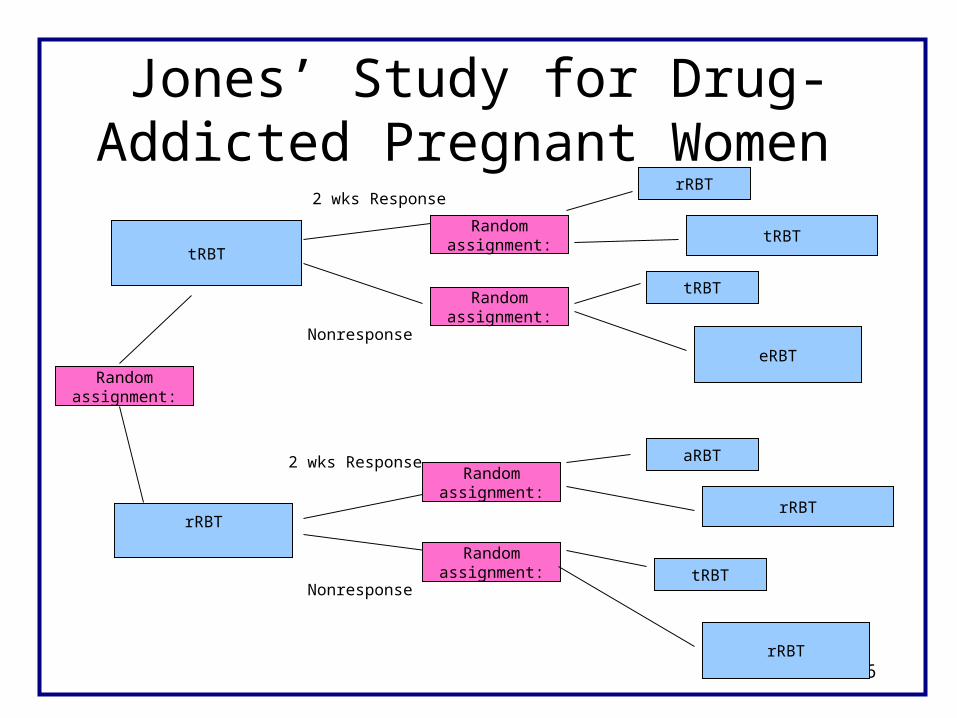
Jones’ Study for Drug-Addicted Pregnant Women
rRBT
2 wks Response
rRBT
tRBTRandom
assignment:
rRBT
Nonresponse
tRBT
Randomassignment:
Randomassignment:
Randomassignment:
aRBT
2 wks Response
Randomassignment:
eRBT
tRBT
tRBT
rRBT
Nonresponse

7
Stage 1 Intermediate Stage 2Preference Treatment Outcome Preference Treatment
Bup Continue Remission on Present
Switch R Ven Treatment
Ser MIRT Switch R
+ Bup No NTPAugment R Remission
+ Bus +LI
Augment R +THY
STAR*D

8
Challenges
• Incomplete Mechanistic Models– non-causal “associations” in data occur due to
the unknown causes of the observations
• Small, Expensive, Data Sets with High Noise to Signal Ratio– Measures of confidence are essential

9
Unknown Unknown Causes Causes
Observations Action Observations Action RewardStage 1 Stage 2
Stage 2
Conceptual Structure in the Behavioral Sciences (clinical trial data)

10
Maturity/
Unknown DecisionCauses to join "Adult"
Society
+ -
Binge Drinking Counseling on - Binge Drinking Sanctions FunctionalityYes Health Yes/No + counseling
Consequences Time 2 Yes/No Time 3 Yes/No
Unknown, Unobserved Causes (Incomplete Mechanistic Models)

11
• The problem: Even when treatments are randomized, non-causal associations occur in the data.
• Solutions:– Recognize that parts of the transition probabilities
(“system dynamics”) can not be informed by domain expertise as these parts reflect non-causal associations
– Or use methods for constructing policies that “average” over the non-causal associations between action and cost or reward.
Unknown, Unobserved Causes (Incomplete Mechanistic Models)
12
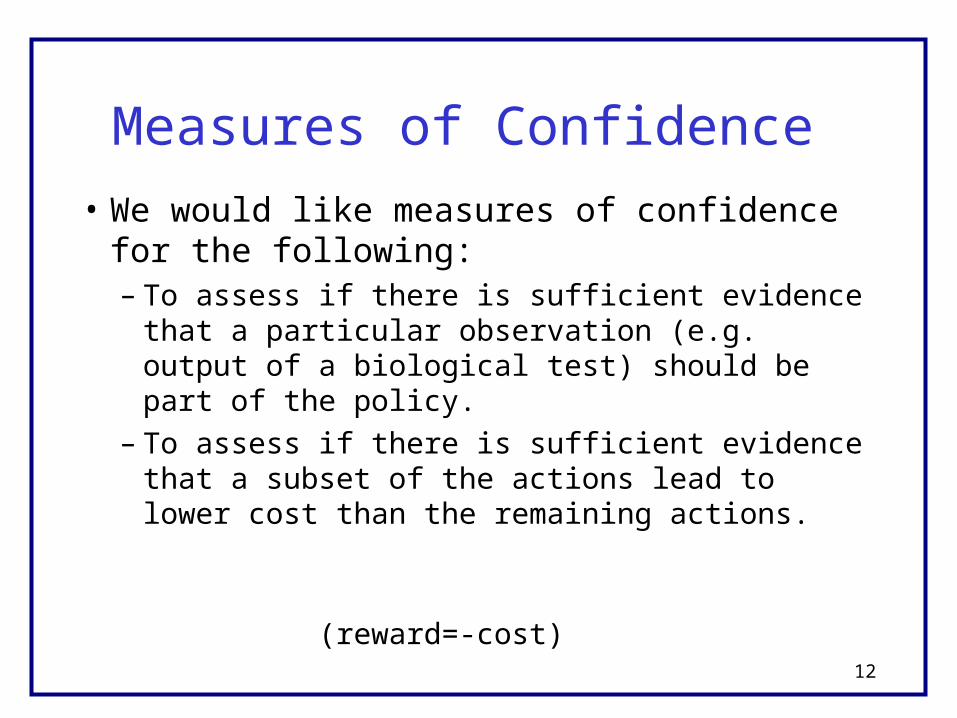
Measures of Confidence
• We would like measures of confidence for the following:– To assess if there is sufficient evidence that a
particular observation (e.g. output of a biological test) should be part of the policy.
– To assess if there is sufficient evidence that a subset of the actions lead to lower cost than the remaining actions.
(reward=-cost)

13
Measures of Confidence
• Traditional methods for constructing measures of confidence require differentiability (if frequentist properties are desired).
• Optimal policies are constructed via non-differentiable operations (e.g. minimization/maximization).

14
Stage 1 Intermediate Stage 2Preference Treatment Outcome Preference Treatment
Bup Continue Remission on Present
Switch R Ven Treatment
Ser MIRT Switch R
+ Bup No NTPAugment R Remission
+ Bus +LI
Augment R +THY
STAR*D

15
STAR*D • Stage 1 Observation:
• QIDS: low score is desirable• Preference for type of Stage 1 treatment: Switch or Augment
• Stage 1Treatment Action: If Stage 1 preference is Switch then randomize switch to either Ser, Bup or Ven; if Stage 1 preference is Augment then randomize to augment with Bup or Bus.
• Stage 2 Observation:• QIDS: low score is desirable• Preference for type of Stage 2 treatment: Switch or Augment
• Stage 2 Treatment Action: If Stage 2 preference is Switch then randomize switch to either Mirt or Ntp: if Stage 2 preference is Augment then randomize to augment with Li or Thy
• Patients exit to follow-up if remission is achieved (QIDS ≤ 5).

16
Construct the policy to minimize cost (or maximize reward)
•Cost: minimum of time to remission and 30 weeks.
•Construct policy so as to minimize average cost
17
Algorithm
• Fitted Q-iteration with linear function approximation. One estimates the “state-action cost” function at stages 1,2 via a linear model.
•Use voting across bootstrap samples (approximate double bootstrap) to assess confidence that a particular action is best.
(cost=-value=-benefit-to-go)

18

19
Conclusion for Stage 1(level 2)
• If QIDS is >13 then both Ven and Bup are best treatment actions
• If QIDS is <9 then Ser is best treatment action.
• If QIDS is around 10-13 then no real winner(s).
20
Discussion
If modern control methods are to be used with clinical trial data then these methods
•must accommodate the existence of unknown, unobserved variables influencing observations at multiple stages,
•should provide measures of confidence and
•must be combined with modern missing data methods.

21
This seminar can be found at:http://www.stat.lsa.umich.edu/~samurphy/
seminars/ACC06.09.ppt
Email me with questions or if you would like a copy!

22
The Problem
• Many patients dropout of the study.
Stage 1 Stage 2
Remit 383 36
Move to next stage
456 260
Dropout 362 160
Sum 1201 456