using combined descriptive and predictive methods of data...
TRANSCRIPT

Journal of AI and Data Mining
Vol 7, No 1, 2019, 47-58 DOI: 10.22044/JADM.2017.4992.1599
Using Combined Descriptive and Predictive Methods of Data Mining for
Coronary Artery Disease Prediction: a Case Study Approach
M. Shamsollahi, A. Badiee
* and M. Ghazanfari
Industrial Engineering Department, University of Science & Technology, Tehran, Iran.
Received 07 November 2016; Revised 18 September 2017; Accepted 10 December 2017
*Corresponding author: [email protected] (A. Badiee).
Abstract
Heart disease is one of the major causes of morbidity in the world. Currently, large proportions of the
healthcare data are not processed properly, and thus fail to be effectively used for decision-making purposes.
The risk of heart disease may be predicted via investigation of heart disease risk factors coupled with data
mining knowledge. This paper presents a model developed using the combined descriptive and predictive
techniques of data mining that aims to aid specialists in the healthcare system to effectively predict patients
with Coronary Artery Disease (CAD). In order to achieve this objective, some clustering and classification
techniques are used. First, the number of clusters are determined using clustering indices. Next, some types
of decision tree methods and artificial neural network are applied to each cluster in order to predict the CAD
patients. The results obtained show that the C&RT decision tree method performs best on all the data used in
this work with 0.074 error. The data used in this work is real, and was collected from a heart clinic database.
Keywords: Data Mining, Coronary Heart Disease, Clustering, Classification, Decision Tree.
1. Introduction
Coronary artery disease (CAD) is the most
common type of heart disease in the United
States. For some people, the first sign of CAD is a
heart attack. CAD is caused by plaque build-up in
the walls of the arteries that supply blood to the
heart (called coronary arteries) and other parts of
the body. Plaque is made up of deposits of
cholesterol and other substances in the artery.
Plaque build-up causes the inside of the arteries to
narrow over time, which could partially or totally
block the blood flow. This process is called
atherosclerosis. Excessive plaque build-up and
narrowed artery walls can make it harder for
blood to flow through the body. When the heart
muscle does not get enough blood, it may cause
chest pain or discomfort, called angina. Angina is
the most common symptom of CAD.
Over time, CAD can weaken the heart muscle.
This may lead to heart failure, a serious condition
where the heart fails to pump blood the way it
should. An irregular heartbeat or arrhythmia can
also develop. Coronary Heart Disease (CHD) is a
result of CAD. The prediction of CHD risk is a
vital and complicated task of medicine, which is
closely linked with lifestyle behaviors [1].
Narrowing of the coronary arteries results from
the reduction of blood and oxygen supply to the
heart and leads to CHD. Myocardial infarctions,
generally known as heart attack and angina
pectoris or chest pain, are encompassed in CHD.
A sudden blockage in the coronary artery
generally due to a blood clot results in heart
attack. Chest pains arise when the blood received
by the heart muscles is inadequate [2].
Knowledge discovery is the process of the
effort to understand, analyze, and eventually
make use of the huge volume of data available.
According to Fayyad et al., Knowledge
Discovery in Databases (KDDs) is the non-trivial
process of identifying valid, novel, potentially
useful, and ultimately understandable patterns
of data. Data mining is the process of
applying machine learning and other
techniques to classical databases in order to
extract implicit, previously unknown, and
potentially useful patterns from a database. Data
mining can be viewed as an essential step in
knowledge discovery. It combines statistical

Shamsollahi et al./ Journal of AI and Data Mining, Vol 7, No 1, 2019.
48
analysis and machine learning to extract hidden
patterns and relationships from large datasets [3].
Data mining is an essential step in knowledge
discovery. It is the exploration of large datasets to
discover hidden and previously unknown patterns,
relationships, and knowledge that are otherwise
difficult to detect with the traditional statistical
methods.
Data mining in healthcare is an emerging field of
high importance that has a potential for providing
a deeper understanding of the medical data [4].
The CAD risk factors could be identified by
physicians to prevent the occurrence of CAD in a
near future. Invasive coronary angiography, a
current diagnostic method, is costly and
associated with morbidity and mortality in CAD
patients [5].
In what follows, efforts for identification of
patients with CHD in historical datasets using
different algorithms and techniques are discussed.
Mobley et al. have studied the Artificial Neural
Network (ANN) methods and designed an ANN
model for the prediction of CHD in 2000, 2002,
and 2005 [6-8]. Two years later, Lee et al. used
various experiments on the linear and non-linear
features of Heart Rate Variability (HRV) indices
to evaluate several classifiers, e.g. Bayesian
classifiers, CMAR, C4.5, and Support Vector
Machine (SVM). In their
experiments, SVM outperformed its counterparts
[9].
In 2008, Tsipouras et al. provided CAD diagnosis
based on easily acquired features. This tool is
capable of providing interpretations on decisions
made using the decision tree and fuzzy modeling
algorithms [10]. In the same year, Kurt et al.
compared the performance of various machine
learning approaches, namely logistic regression,
classification and regression tree, multi-layer
perceptron, radial basis function, and self-
organizing feature maps in order to predict the
presence of CAD using demographic and medical
data [11]. Sitar-taut et al. used the Weka tool to
investigate naïve Bayes and J4.8 decision trees
for the detection of CHD. The results obtained
demonstrated no significant difference between
naïve Bayes and decision trees in the correct
prediction of CHD in 2009 [12]. A year later,
Karaolis et al. used the C4.5 decision tree
algorithm targeted towards the three
aforementioned events. The most important risk
factors as extracted from the classification rules
analysis were: 1) age, smoking history, and
history of hypertension for myocardial infarction
(MI); 2) family history, history of hypertension,
and history of diabetes for percutaneous coronary
intervention (PCI); and 3) age, history of
hypertension, and smoking history for Coronary
Artery Bypass Graft (CABG). Data-mining
analysis was performed using the C4.5 decision
tree algorithm [13].
In 2012, A. Sheik Abdullah et al. developed a
mining model capable of predicting the
occurrence of various events corresponding to the
record of each patient. This model was developed
based on the random forest classification
algorithm, whose accurate performance requires
the patient history to comprise at least one of
the followings: Angina, Acute Myocardial
Infarction (AMI), PCI, and CABG. The
developed model will have functionalities such
as prediction of the occurrence of various
events related to each patient record,
prevention of risk factors and its associated
cost metrics, and improvement in the overall
prediction accuracy [14]. Muthukaruppan & E
presented a particle swarm optimization (PSO)-
based fuzzy expert system for the diagnosis of
CAD in 2012 [15].
In 2013, Nitin Kumari et al. presented a survey on
the diagnosis of CHD using ANN, fuzzy logic,
and neuro-fuzzy integrated approaches. Here,
these approaches were compared in an attempt to
identify the most appropriate approach. For
instance, ANN and fuzzy logic both exhibit
numerous advantages but also some
disadvantages. Neuro-fuzzy approaches consist of
the combination of ANN and fuzzy logic. They
combine the advantages of both ANN and fuzzy
logic. Advantages of ANNs include massive
parallelism, robustness, and learning in data-rich
environments. The authors also presented a survey
on the diagnosis of coronary heart disease using
three soft computing techniques [16].
Later, in 2015, a model for CHD prediction was
designed by Kim et al. according to the rule-based
guidelines. In their study, a fuzzy logic and
decision tree (classification and regression tree
[CART])-driven CHD prediction model was
developed for the Korean population [17]. Akila
et al. presented a two-stage hybrid method for
CHD identification and prediction in 2015. In the
first stage, risk identification was carried out via
classification of physical and biochemical factors
using the C4.5 algorithm in DT, and in the second
stage, the level prediction was performed via
analysis of CHD risk instances identified from DT
using MLP with habitation and medical history
attributes [1]. In 2015, Jonnagaddala et al. also
presented methods to extract Framingham risk
factors of unstructured electronic health records
using clinical text mining and calculated 10-year

Shamsollahi et al./ Journal of AI and Data Mining, Vol 7, No 1, 2019.
49
CAD risk scores in a cohort of diabetic patients
[18]. In 2016, Wiharto et al. provided an
intelligence system for the diagnosis of CHD
stage by taking into account the problem of data
imbalance using K-star algorithms [19]. These are
briefly shown in Table 1.
Table 1. A sample of data mining techniques used on different coronary heart disease datasets. Author Year Title Techniques
B. A. Mobley, Schechter,
Moore, McKee, & Eichner 2000 Predictions of coronary artery stenosis by artificial neural network
Decision trees,
Fuzzy model
Lee, Noh, & Ryu 2007 Mining biosignal data: coronary artery disease diagnosis using linear
and non-linear features of HRV
Bayesian classifiers, CMAR,
C4.5, and SVM
Kurt, Ture, & Kurum 2008 Comparing performances of logistic regression, classification and regression tree, and neural networks for predicting coronary artery
disease
logistic regression, classification and regression tree, multi-layer
perceptron, radial basis
Tsipouras et al. 2008 Automated Diagnosis of Coronary Artery Disease based on Data Mining and Fuzzy Modeling
Decision tree, fuzzy model
Sitar-tăut, Zdrenghea, Pop,
& Sitar-tăut 2009
Using machine learning algorithms in cardiovascular disease risk
evaluation naïve bayes, J4.8 decision trees
Karaolis, Moutiris,
Hadjipanayi, & Pattichis 2010
Assessment of risk factors of coronary heart events based on data
mining with decision trees C4.5 Decision tree
Abdullah & Rajalaxmi 2012 A data mining model for predicting Coronary Heart Disease using Random Forest Classifier
Random Forest
Muthukaruppan & Er 2012 A hybrid particle swarm optimization based fuzzy expert system for
diagnosis of coronary artery disease fuzzy expert system
Kumari & Sunita 2013 Comparison of ANNs, Fuzzy Logic, and Neuro-Fuzzy Integrated
Approach for Diagnosis of Coronary Heart Disease: A Survey
ANN, fuzzy logic, and neuro-
fuzzy integrated approach
Kim, Lee, & Lee 2015 Data-Mining-Based Coronary Heart Disease Risk Prediction Model using Fuzzy Logic and Decision Tree
Fuzzy logic, CART
Akila & Chandramathi 2015 A Hybrid Method for Coronary Heart Disease Risk Prediction using
Decision Tree and Multi-Layer Perceptron C4.5 Decision tree and MLP
Jonnagaddala, Liaw, Ray,
Kumar, Chang, & Dai 2015
Coronary artery disease risk assessment from unstructured electronic
health records using text mining Text mining
Wiharto, Kusnanto, & Herianto
2016 Intelligence System for Diagnosis Level of Coronary Heart Disease with K-Star Algorithm, Healthcare informatics research
K-Star algorithms
Investigation of the previous works done on the
prediction of CAD patients shows that only a
single predictive or descriptive method have been
used in these studies. In this work, a total of 282
records with 58 attributes were obtained from an
actual clinical dataset as the case study. Therefore,
we first divided the data into three clusters using
clustering indices, and then used different
decision tree algorithms for the three clusters. The
results obtained showed that C&RT performed
best on all data in terms of the CAD patient
prediction.
In cluster 1&2, C&RT is the best decision tree
algorithm, whereas in cluster 3, CHAID has a
minimum error for predicting CAD patients. Here,
we used combined descriptive and predictive
methods for prediction of CAD patients, which
showed a better performance than the other purely
descriptive or merely predictive methods in
working with real data and its analysis. Totally, it
can be said that the novelty of this paper is seen in
the definition of the problem, the combined
prediction method as a new solving method, and
its actual application based on the case study.
The remainder of this paper is organized as what
follows. In Section 2, data preparation and study
methods are briefly explained. The data used in
this work is driven from a clinical dataset. In
Section 3, results of the clustering and
classification methods are presented. In Section 4,
discussion is clearly noted. Finally, in Section 4,
the work is concluded.
2. Materials and methods
2.1. Data description
For the automatic diagnosis of normal and CAD
conditions, the HRV signal extracted from
electrocardiogram (ECG) can be used but here, no
patient had a history or electrocardiographic
evidence of prior myocardial infarction or known
valvular or cardiomyopathy diseases.
Therefore, we had to find another method to
predict CAD patients. Marateb et al. [5] used the
following 21 attributes in their work: age, gender,
resting blood pressure (trestbps), CHOL, fasting

Shamsollahi et al./ Journal of AI and Data Mining, Vol 7, No 1, 2019.
50
blood sugar (FBS), resting electrocardiographic
results (restecg), active smoker type, number of
cigarettes per day, number of years as a smoker,
family history of CAD (famhist), and chest pain
type (cp). In addition, patients underwent 3 non-
invasive tests as defined in the research protocol.
The results of these tests (exercise
electrocardiogram, thallium scintigraphy, and
cardiac fluoroscopy) were not interpreted until
after the invasive gold standard test (coronary
angiograms) had been read. The CAD status was
considered when narrowing of at least one of the
coronary arteries was more than 50%, as indicated
by angiography.
In this work, a total of 282 records with 58
attributes were obtained from an actual clinical
dataset as the case study. Based on the literature, a
set of cut points were extracted in this work for
the properties of attributes for every individual, as
shown in Table 2, in order to create ordinal-scale
variables.
Table 2. Attributes of raw CAD dataset.
Attribute Measurement
scale Definition Value
Age Interval Age in years
Gender Nominal Sex 1 = male; 0 = female
Trestbps Interval Resting blood pressure (mmHg)
CHOL Interval Serum CHOL (mg/dL)
FBS Nominal FBS >120 (mg/dL)
Value (1): true; If
greater than 120 mg/dl the attribute; Value (0): False; Other wise
Restecg Nominal Resting electrocardiographic results
Value 0: normal;
Value 1: having ST-T wave abnormality (T wave
inversions and/or ST elevation or depression of > 0.05 mV);
Value 2: showing probable or definite left ventricular
hypertrophy
Thalrest Nominal Resting heart rate (bpm)
Smoke Nominal Active smoker type
Cigs Interval Number of cigarettes per day
Years Interval Number of years as a smoker
Famhist Nominal Family history of CAD
Cp Nominal Chest pain type
Tpeakbps Interval Peak exercise systolic blood pressure (mmHg)
Tpeakbpd Interval Peak exercise diastolic blood pressure (mmHg)
Thalach Interval Maximum exercise heart rate
achieved (bpm)
Exang Nominal Exercise-induced angina Value 1= Yes
Value 0= No
Oldpeak Interval ST depression induced by exercise relative to rest
Slope Nominal Slope of the peak exercise ST segment Value 1: up sloping Value 2: flat
Value 3: down sloping
Ca Interval Number of major vessels (0–3) colored by
fluoroscopy
Thal Nominal Thallium-201 stress scintigraphy
Value 3: normal
Value 6: fixed defect Value 7: reversible defect
Num Nominal Diagnosis of heart disease (angiographic disease
status) Value 0: Normal: < 50% diameter narrowing
Value 1: CAD > 50% diameter narrowing

Shamsollahi et al./ Journal of AI and Data Mining, Vol 7, No 1, 2019.
51
2.2. Proposed method
As mentioned earlier, the authors seeked to
provide a combination model of descriptive and
predictive methods of data mining tools for
predicting coronary artery disease. Thus they first
received the real data, along with their
characteristics from the heart clinic. Then the
received data was pre-processed in order to
eliminate their annoying contamination. The pre-
processing of the received actual data included the
removal of records whose fields were missing
values or appeared to be outliers. In the following,
with a review of the literature on the topic, we
found the descriptive and predictive methods of
data mining that were possible to combine, and in
previous literature, not considered significantly to
diagnose CAD.
In order to better understand the subject, it should
be mentioned that some data mining tools such as
clustering methods, association rules, data
summarization, and statistics are in the category
of data mining descriptive methods because they
can describe the current data interpretation but
data mining tools such as regression, and
classification are in the category of predictive
methods because they are capable of being used
for prediction and not limited to the current status
of data.
Finally, after studying the literature, the k-means
method was chosen as the clustering method
(descriptive), and various types of classification
methods (predictive) including CHAID, Quest,
C5.0, C&RT decision tree, and ANN method for
combination with the previous method.
In the clustering method, the number of clusters
must be pre-defined. Therefore, various indices
were used to determine the suitable number of
clusters. Indices indicate that the optimal cluster
number is 3. After the clean data was split into
three clusters, we applied each of the five
classification methods to each cluster for getting
the optimal predictive approach in the next step
and analyzed the results. Clean data refers to the
data that has been pre-processed and does not
have fluctuations such as noise, turbulence,
outlier, and missing values.
The results obtained showed that according to the
results, the C&RT decision tree method
performed better than the other classification
methods in predicting CAD patients in the entire
database including CHAID, Quest, C5.0 decision
tree, and ANN method. Figure 1 also shows the
steps of the proposed methodology. In the
following, it is briefly explained in relation to the
data mining tools used.
Start
Finding appropriate data mining tools for
combined prediction method suggestion
Selection of K-means method as descriptive
method and decision tree and artificial
neural network as predictive methods
Data gathering from
heart disease clinic (case study)
Preprocessing and cleaning data
Defining appropriate number of clusters by
using several indexes
Clustering data into the best number of
clusters (applying descriptive method)
Classification of each clusters by using
several types of decision trees and ANN
(applying predictive methods)
Comparison and analysis of results
Getting the best classification method for
the entire dataset
End
Figure 1. Proposed methodology steps.
2.2.1. Clustering
Cluster analysis is an unsupervised machine
learning method. It offers the means for
partitioning a dataset into subsets with similar
patterns. Clustering methods partition objects
into groups so that objects in one group are
similar to each other, and as dissimilar as
possible to objects in other groups. The
similarity or dissimilarity between two data
objects is typically measured as the distance
between the multi-dimensional feature vectors
that represent the objects.The feature vectors are
also called data points. A large distance between

Shamsollahi et al./ Journal of AI and Data Mining, Vol 7, No 1, 2019.
52
the data points encodes a greater dissimilarity.
Here, a number of available clustering methods
are described [20]. Clustering is the process of
partitioning a dataset with „n‟ data points into „k‟
groups or clusters. As a result, each cluster
should have at least one data point, and each
data point must belong to only one cluster. In
this clustering approach, the number of clusters
should be defined prior to partitioning. The
partition clustering method is divided into two
categories; K-means and K-mediods are based
upon the choice of cluster centroid and similarity
measures [21].
K-Means clustering is one of the most widely
used clustering approaches that partition „n‟ data
points into „k‟ clusters based on a similarity
measure so that the data points in the same cluster
exhibit a high similarity as compared to the data
points of the other clusters [20].
An appropriate value of k must be somehow
chosen if it cannot be inferred from a prior
knowledge of the dataset properties. Several
methods are available for selection of an
appropriate k value, many of which rely on cluster
evaluation metrics. In reference [22], during the
presentation of an algorithm, the different values
of the number of clusters are evaluated and the
best number is determined. Thus in this work, a
clustering algorithm was run with different values
of k, and the value of k that provided the best
results was chosen like [22], and the average
silhouette method [23], gap statistic method [24],
dunn Index [25], within sum of square [26], and
elbow algorithms [27] were used for detecting the
number of clusters. The results obtained for each
method are shown in Section 3.
2.2.2. Classification
Classification and prediction are two forms of
data analysis. Classification is the analysis of a
training dataset in order to identify the typical
characteristics of data in the same class based on
the characteristics of the data, and the subsequent
use of these characteristics to classify the new
data. The key in classification is to export
functions or models for classification. On the
other hand, the term prediction is used when data
objects are continuous rather than discrete [28]. In
this work, decision trees and neural networks were
used.
Classification methods are one of the predictive
models in data mining. The inputs of predictive
models are data of patients referring to the clinic
in the form of the attributes of the raw CAD
dataset in each cluster, and output of the
predictive models is a decision tree or ANN that
shows probability of CAD in the form of “Yes”
and “No” labels. This process was applied to each
cluster separately.
- Decision Tree Decision tree is a data classification process that
consists of a series of rules [29]. Determined by a
series of “if then” logic (branching) relationships,
this method infers a set of classified rules from a
set with no order and no rule examples, and
expresses the probabilities of all possible
outcomes with a tree chart in the form of a
decision tree so as to yield an accurate prediction
or a correct classification [30]. The decision tree
method is finding more and more application in
the clinical studies, especially clinical diagnosis.
Decision tree has many different algorithms, and
this study uses the CHAID, C&RT, Quest, and
C5.0 algorithms.
- Neural Network ANN, often referred to as "neural network", is a
mathematical or computational model developed
based on the biological neural networks. In other
words, it is the simulation of biological neural
systems that are made up of inter-connections
between the artificial neural information units. In
most cases, neural networks are based upon
adaptive systems in the learning stage where
external or internal information flows through the
network, thus changing its structure [31].
The structure of artificial neural network in the
proposed methodology is as what follows.
- ANN type = one-layer perceptron
- Number of inputs = 20 (attributes of the raw
CAD dataset)
- Number of hidden layers = 1
- Number of nodes in the hidden layer = 3
- Number of outputs = 1 (probability of CAD in
the form of “Yes” and “No” labels)
3. Results
When we use clustering methods, we need to
define the number of clusters by using the indices
for getting the appropriate number. Various types
of indices help us to define the optimal cluster
number regarding some indicators like
minimizing the distance between data in clusters
and maximizing the distances between clusters.
After using some indices, we found that the
appropriate number of clusters in our data was k =
3. The results obtained are shown in table 3 and
figure 2. Figure 2 shows the charts of the average
silhouette method, gap statistic method, dunn
index, within sum of square, and elbow
algorithms that are used for detecting the number
Shamsollahi et al./ Journal of AI and Data Mining, Vol 7, No 1, 2019.
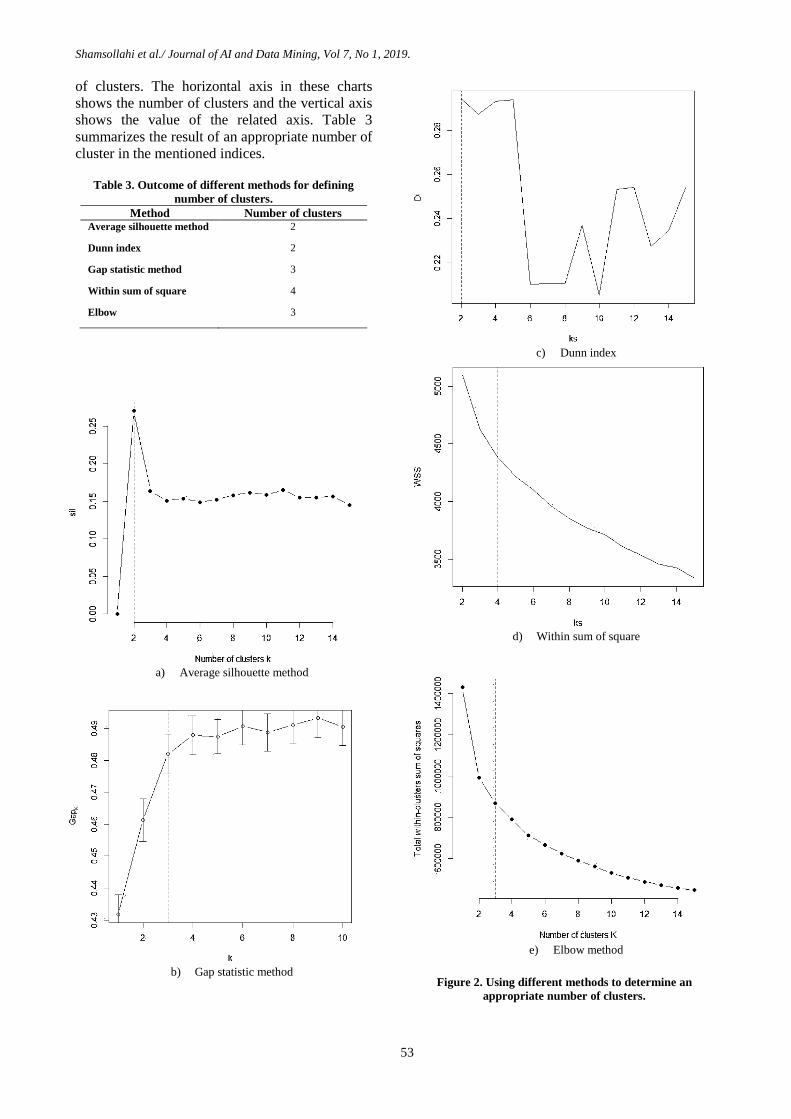
53
of clusters. The horizontal axis in these charts
shows the number of clusters and the vertical axis
shows the value of the related axis. Table 3
summarizes the result of an appropriate number of
cluster in the mentioned indices.
Table 3. Outcome of different methods for defining
number of clusters.
Method Number of clusters Average silhouette method 2
Dunn index 2
Gap statistic method 3
Within sum of square 4
Elbow 3
a) Average silhouette method
b) Gap statistic method
c) Dunn index
d) Within sum of square
e) Elbow method
Figure 2. Using different methods to determine an
appropriate number of clusters.

Shamsollahi et al./ Journal of AI and Data Mining, Vol 7, No 1, 2019.
54
As mentioned earlier, to define an appropriate
number of clusters, some indices were used.
Recall that the basic idea behind partitioning
methods such as k-means clustering is to define
clusters such that the total intra-cluster variation
[or total within-cluster sum of square (WSS)] is
minimized. The total WSS measures the
compactness of the clustering, and we want it to
be as small as possible. The elbow method looks
at the total WSS as a function of the number of
clusters. One should choose a number of clusters
so that adding another cluster does not improve
much better the total WSS. Therefore, the location
of a bend (knee) in the plot is generally
considered as an indicator of the appropriate
number of clusters. Also the dunn index is a well-
established cluster index that identifies “compact,
separate” clusters. If a dataset is well-separated by
a clustering scheme, the distance among the
clusters is usually large, and the diameters of the
clusters are expected to be small. Therefore, a
large value for dunn index corresponds to a good
clustering scheme.
On one hand, a high average silhouette width
indicates a good clustering. The optimal number
of clusters k is the one that maximizes the average
silhouette over a range of possible values for k.
On the other hand, the gap statistic compares the
total within intra-cluster variation for different
values of k with their expected values under null
reference distribution of the data. The estimate of
the optimal clusters will be the value that
maximizes the gap statistic (i.e. that yields the
largest gap statistic). For getting the best number
of clusters, we must choose the number of clusters
as the smallest value of k such that the gap
statistic is within one standard deviation of the
gap at k + 1, where the number of clusters are
from k = 1, ..., kmax. The enthusiasts can refer to
reference [32] for a further study.
Using k = 3 as the number of clusters, the data
was divided into groups of 90, 88, and 104 data
points. Data points mean the number of data
records. In fact, after applying the clustering
method, the number of records in clusters 1, 2, &
3 was 90, 88, and 104, respectively. The results
of applying the clustering method indicate that
each cluster includes how people are:
- cluster 1: This cluster includes people who
have smoked a lot over many years every day. So
many of their major vessels were clogged up.
These people had a lower age than the other
people who referred to the clinic. Also totally,
they had less chest pain, blood pressure, and
depression.
- cluster 2: This cluster includes people who
have smoked amusingly every day for few years.
So few of their major vessels were clogged up.
These people were older than cluster 1, and had
more chest pain, blood pressure, and depression
but compared to cluster 3 that had a lower age,
and less chest pain, blood pressure, and
depression.
- cluster 3: Persons in cluster number 3 are
high-age people who smoked less for years
compared to cluster 1. Therefore, fewer of their
major vessels were clogged up. However, they
smoked more than cluster 2. Therefore, many of
their major vessels were clogged up. These people
had more chest pain, blood pressure, and
depression than the other people who referred to
the clinic.
I. Table 4 shows the average of each factor in
these three clusters, which emphasizes the
above-mentioned explanations, and
TABLE 5 shows the distance between centers of
clusters. For example, distance between center of
cluster 1 and center of cluster 2 was 1.214. These
calculated values somehow represent dissimilarity
between two classes. With these interpretations,
the similarity between clusters 1 and 2 was greater
than the similarity between cluster 1 and 3 and the
similarity between clusters 2 and 3. Also the
similarity between clusters 1 and 3 was more than
the similarity between clusters 2 and 3.
Table 4. Average of each factor in each cluster.
Factors Cluster 1 Cluster 2 Cluster 3 age 52.033 54.727 56.202
gender 0.711 0.386 0.894
cp 2.778 2.875 3.740
trestbps 128.422 131.784 134.096
chol 239.356 252.659 254.500
smoke 1.000 0.011 0.683
cigs 28.144 0.034 20.683
cigsyear 25.411 0.068 18.606
fbs 0.167 0.125 0.154
famhist 0.556 0.614 0.683
restecg 0.644 1.080 1.279
thalach 160.322 154.080 136.981
thalrest 75.533 76.420 73.654
tpeakbps 171.156 169.375 164.260
tpeakbpd 75.033 81.284 79.808
exang 0.100 0.159 0.663
oldpeak 0.571 0.759 1.648
slope 1.322 1.523 1.865
ca 0.411 0.284 1.212
thal 3.856 3.466 6.404
num No 88.89 % No 84.09% Yes 97.12%

Shamsollahi et al./ Journal of AI and Data Mining, Vol 7, No 1, 2019.
55
Table 5. Approximately distance between clusters.
Clusters 1 2 3
1
2 1.214
3 1.436 1.608
4. Discussion In order to derive a classifier or predictor, we can
use training dataset, and then to estimate the
accuracy of the resulting learned model, we can
use that classifier.
Sometimes due to over-fitting of the learning
algorithm to the data, this accuracy is estimated
over-optimistically but in fact, it is misleading.
Instead, accuracy is better measured on a test set
consisting of class-labeled tuples that were not
used in the process of training the model. The
accuracy of a classifier on a given test set is the
percentage of test set tuples that are correctly
classified by the classifier. Accuracy refers to the
overall recognition rate of the classifier, i.e. it
reflects how well the classifier recognizes tuples
of the various classes.
Sometimes we would like to be able to assess how
well the classifier can recognize “CAD” tuples
(the positive tuples) and how well it can recognize
“normal” tuples (the negative tuples). The
sensitivity and specificity measures can be used
for this purpose, respectively. Sensitivity is also
referred to as the true positive rate, while
specificity is the true negative rate. In addition,
we may use precision to assess the percentage of
tuples labeled as “CAD” that actually are “CAD”
tuples. These measures are defined in [21].
The confusion matrix for positive and negative
tuples is shown in Table 6. Also, accuracy,
sensitivity, precision, and specificity are given in
Equations 1-4.
Sensitivity =
(1)
Specificity =
(2)
Precision =
(3)
Accuracy =
(4)
Table 6. A confusion matrix for positive and negative
tuples.
Predicted Class
= Yes
Predicted Class
= No
Actual Class = Yes True Positives
(TP)
False Negative
(FN)
Actual Class = No False Positives
(FP)
True Negative
(TN)
II. The results of comparing the performance of
different algorithms on all data is shown in
Table 7. According to the results obtained, the
C&RT method has the minimum prediction
error. Then
Table 8 shows the results of using different
decision tree methods in three clusters.
III. According to the results, C&RT and CHAID
perform best in predicting the CAD patients in
clusters 1 & 2 and cluster 3, respectively.
Figure 3 shows the comparison error in all
different methods for the three clusters. In this
figure, the horizontal axis shows the methods used
for analyzing three clusters and the vertical axis
shows the error of each method in three clusters
separately.
In general, clustering has helped us to put people
who have the same features together, with the aim
that the predictive method applied separately for
each cluster would be a less predictive error.
In other words, if we only used the predictive
method and removed the clustering phase, the
proposed methodology had more error in the
diagnosis of CAD patients.
Table 7. Comparison of different algorithm results for all data.
TP FN FP TN Sensitivity Specificity Precision Accuracy Error
Neural network 101 24 3 154 0.808 0.981 0.971 0.904 0.096
Quest 101 24 3 154 0.808 0.981 0.971 0.904 0.096
C&RT 113 12 9 148 0.904 0.943 0.926 0.926 0.074
C5.0 104 21 3 154 0.832 0.981 0.972 0.915 0.085
CHAID 106 19 5 152 0.848 0.968 0.955 0.915 0.085

Shamsollahi et al./ Journal of AI and Data Mining, Vol 7, No 1, 2019.
56
Table 8. Comparison of different algorithm results for different clusters.
TP FN FP TN Sensitivity Specificity Precision Accuracy Error
Cluster1 Neural network 0 10 0 80 0 1 1 0.889 0.111
Quest 2 8 0 80 0.200 1 1 0.911 0.089
C&RT 9 1 1 79 0.900 0.988 0.900 0.978 0.022
C5.0 3 7 2 78 0.300 0.975 0.600 0.900 0.100
CHAID 0 10 0 80 0 1 1 0.889 0.111
Cluster2 Neural network 0 14 0 74 0 1 1 0.841 0.159
Quest 4 10 0 74 0.286 1 1 0.886 0.114
C&RT 12 2 0 74 0.857 1 1 0.977 0.023
C5.0 0 14 0 74 0 1 1 0.841 0.159
CHAID 9 5 8 66 0.643 0.892 0.529 0.852 0.148
Cluster3 Neural network 101 0 3 0 1 0 0.971 0.971 0.029
Quest 101 0 3 0 1 0 0.971 0.971 0.029
C&RT 100 1 1 2 0.990 0.667 0.990 0.981 0.019
C5.0 101 0 3 0 1 0 0.971 0.971 0.029
CHAID 104 0 0 0 1 1 1 1 0
Figure 3. Error of different methods in three clusters.
5. Conclusion
In this work, a total of 282 patient records with 58
attributes were acquired from a clinical dataset
and combined descriptive, and the predictive
methods were applied for prediction of CAD in
these patients. For this, the k-means method was
chosen as the clustering method (descriptive) and
various types of classification methods
(predictive) including CHAID, Quest, C5.0,
C&RT decision tree, and ANN method for
combination with the previous method. Here, the
appropriate number of clusters was first
determined as 3 using several clustering indices.
Then the decision tree methods were applied to
each cluster to define the best prediction
algorithm for each cluster. Briefly, we can say
cluster 1 includes people who have smoked a lot
over many years every day. Cluster 2 includes
people who have smoked amusingly every day for
few years, and persons in cluster number 3 were
high-age people who smoked less for years
compared to cluster 1 but they smoked more than
cluster 2.
Finally, C&RT appeared as the best method for
the entire dataset with 0.074 error. However, the
results obtained for each of the three clusters were
different. The best method for prediction in
clusters 1 and 2 was C&RT with 0.022 and 0.023
error, respectively, and CHAID appeared as the
most appropriate method for cluster 3 with zero
error.
Also as clinical implications of the suggested
procedure, we can point out that a software can be
designed easily in every heart clinic for entering
new patient‟s data. For this, using the result of
actual data analysis and applying the proposed
11.11%
15.91%
2.88%
8.89%
11.36%
2.88% 2.22% 2.27% 1.92%
10.00%
15.91%
2.88%
11.11%
14.77%
0.00% 0.000
0.050
0.100
0.150
0.200
Cluster 1 Cluster 2 Cluster 3
Err
or
val
ue
Neural Network Quest C&RT C5.0 CHAID

Shamsollahi et al./ Journal of AI and Data Mining, Vol 7, No 1, 2019.
57
combined method are sufficient to diagnose the
CAD patients. If a patient is exposed to CAD, the
new designed software-based system will alert
and aware physicians.
As future suggestions, we can consider a
combination of other descriptive and predictive
methods for prediction of CAD patients. Also the
use of real data from other clinics with
complementary features can also provide better
and more realistic analytical results.
Acknowledgment
Authors would like to thank Dr. Zahra Hoseini for
supporting access to aforesaid clinical dataset.
References [1] Akila, S. & Chandramathi, S. (2015). A Hybrid
Method for Coronary Heart Disease Risk Prediction
using Decision Tree and Multi Layer Perceptron,
Indian Journal of Science and Technology, vol. 8, no.
34, pp. 1-7.
[2] Cheng, J. & Greiner, R. (1999). Comparing
Bayesian network classifiers. Proceedings of the
Fifteenth conference on Uncertainty in artificial
intelligence: Morgan Kaufmann Publishers Inc., pp.
101-108.
[3] Fayyad, U., Piatetsky-Shapiro, G. & Smyth, P.
(1996). From data mining to knowledge discovery in
databases, AI magazine, vol. 17, no. 3, pp. 37-54.
[4] Al-batah, M. S. (2014). Testing the Probability of
Heart Disease Using Classification and Regression
Tree Model, Annual Research & Review in Biology,
vol. 4, no. 11, pp. 1713-1725.
[5] Marateb, H. R. & Goudarzi, S. (2015). A
noninvasive method for coronary artery diseases
diagnosis using a clinically-interpretable fuzzy rule-
based system, Journal of research in medical sciences:
the official journal of Isfahan University of Medical
Sciences, vol. 20, no. 3, pp. 214-223.
[6] Mobley, B., Moore, W., Schechter, E., Eichner, J.
& McKee, P. (2002). Neural network predictions of
significant coronary artery stenosis in women,
Computational intelligence processing in medical
diagnosis: Springer, vol. 96, pp. 261-290.
[7] Mobley, B. A., Schechter, E., Moore, W. E.,
McKee, P. A. & Eichner, J. E. (2000). Predictions of
coronary artery stenosis by artificial neural network,
Artificial intelligence in medicine, vol. 18, no. 3, pp.
187-203.
[8] Mobley, B. A., Schechter, E., Moore, W. E.,
McKee, P. A. & Eichner, J. E. (2005). Neural network
predictions of significant coronary artery stenosis in
men, Artificial intelligence in medicine, vol. 34, no. 2,
pp. 151-161.
[9] Lee, H. G., Noh, K. Y. & Ryu, K. H. (2007).
Mining biosignal data: coronary artery disease
diagnosis using linear and nonlinear features of HRV,
Emerging Technologies in Knowledge Discovery and
Data Mining: Springer, vol. 4819, pp. 218-228.
[10] Tsipouras, M. G., Exarchos, T. P., Fotiadis, D. I.,
Kotsia, A. P., Vakalis, K. V., Naka, K. K. & Michalis,
L. K. (2008). Automated Diagnosis of Coronary Artery
Disease Based on Data Mining and Fuzzy Modeling,
IEEE Transactions on Information Technology in
Biomedicine, vol. 12, no. 4, pp. 447-458.
[11] Kurt, I., Ture, M. & Kurum, A. T. (2008).
Comparing performances of logistic regression,
classification and regression tree, and neural networks
for predicting coronary artery disease, Expert Systems
with Applications, vol. 34, no. 1, pp. 366-374.
[12] Sitar-tăut, A., Zdrenghea, D., Pop, D. & Sitar-tăut,
D. (2009). Using machine learning algorithms in
cardiovascular disease risk evaluation, Journal of
Applied Computer Science & Mathematics, vol. 3, no.
5, 2009, pp. 29-32(4).
[13] Karaolis, M. A., Moutiris, J. A., Hadjipanayi, D.
& Pattichis, C. S. (2010). Assessment of the risk
factors of coronary heart events based on data mining
with decision trees, Information Technology in
Biomedicine, IEEE Transactions on, vol. 14, no. 3, pp.
559-566.
[14] Abdullah, A. & Rajalaxmi, R. (2012). A data
mining model for predicting the coronary heart disease
using random forest classifier'. International
Conference in Recent Trends in Computational
Methods, Communication and Controls.
[15] Muthukaruppan, S. & Er, M. (2012). A hybrid
particle swarm optimization based fuzzy expert system
for the diagnosis of coronary artery disease, Expert
Systems with Applications, vol. 39, no. 14, pp. 11657-
11665.
[16] Kumari, N. and Sunita, S. (2013). Comparison of
ANNs, Fuzzy Logic and Neuro-Fuzzy Integrated
Approach for Diagnosis of Coronary Heart Disease: A
Survey. International Journal of Computer Science and
Mobile Computing, IJCSMC, vol. 2, no. 6, pp. 216-
224.
[17] Kim, J., Lee, J. & Lee, Y. (2015). Data-Mining-
Based Coronary Heart Disease Risk Prediction Model
Using Fuzzy Logic and Decision Tree, Healthcare
informatics research, vol. 21, no. 3, pp. 167-174.
[18] Jonnagaddala, J., Liaw, S.-T., Ray, P., Kumar, M.,
Chang, N.-W. & Dai, H.-J. (2015). Coronary artery
disease risk assessment from unstructured electronic
health records using text mining, Journal of biomedical
informatics, vol. 58, pp. S203-S210.
[19] Wiharto, W., Kusnanto, H. & Herianto, H. (2016).
Intelligence System for Diagnosis Level of Coronary
Heart Disease with K-Star Algorithm, Healthcare
informatics research, vol. 22, no. 1, pp. 30-38.
[20] Han, J., Kamber, M. & Pei, J. (2011) Data mining:
concepts and techniques. Elsevier.

Shamsollahi et al./ Journal of AI and Data Mining, Vol 7, No 1, 2019.
58
[21] Velmurugan, T. & Santhanam, T. (2011). A
survey of partition based clustering algorithms in data
mining: An experimental approach, Information
Technology Journal, vol. 10, pp. 478-484.
[22] Debatty, T., Michiardi, P., Mees, W. & Thonnard,
O. 'Determining the k in k-means with MapReduce'.
EDBT/ICDT Workshops, pp. 19-28.
[23] Rousseeuw, P. J. (1987). Silhouettes: a graphical
aid to the interpretation and validation of cluster
analysis, Journal of computational and applied
mathematics, vol. 20, pp. 53-65.
[24] Tibshirani, R., Walther, G. & Hastie, T. (2001).
Estimating the number of clusters in a data set via the
gap statistic, Journal of the Royal Statistical Society:
Series B (Statistical Methodology), vol. 63, no. 2, pp.
411-423.
[25] Dunn, J. C. (1973). A fuzzy relative of the
ISODATA process and its use in detecting compact
well-separated clusters. vol. 3, no. 3, pp. 32-57.
[26] Clarke, B., Fokoue, E. & Zhang, H. H. (2009)
Principles and theory for data mining and machine
learning. Springer Science & Business Media.
[27] Thorndike, R. L. (1953). Who belongs in the
family?, Psychometrika, vol. 18, no. 4, pp. 267-276.
[28] Balakrishnan, J. M. D. (2010). Significance of
classification techniques in prediction of learning
disabilities, arXiv preprint arXiv: 1011.0628.
[29] Luo, L. & Chen, J. (2008). Data mining and
investigation of surgical operation information based
on decision tree, Medical Information, vol. 21, no. 11,
pp. 1936-1939.
[30] Jun-qun, F., Jia-you, L. & Kuan-bao, Y. (2009).
Application of decision tree C5. 0 in the pre-warning of
birth defects, Chinese Journal of Health Statistic, vol.
18, no. 3, pp. 473-476.
[31] Su, C., Andrew, A., Karagas, M. & Borsuk, M.
(2012) Overview of Bayesian network approaches to
model gene-environment interactions and cancer
susceptibility. International Environmental Modelling
and Software Society (iEMSs).
[32] Kassambara, A. (2017). Practical Guide to Cluster
Analysis in R: Unsupervised Machine Learning. vol. 1,
STHDA.

نشرهی هوش مصنوعی و داده کاوی
: یکرونر عروق هایبیماری بینیپیش برای کاویداده بینانهپیش و توصیفی هایروشترکیب از استفاده
موردی مطالعه رویکرد
مهدی غضنفری و *اقدس بدیعی، اللهی شمس مهسا
.ایران تهران، صنعت، و علم دانشگاه صنایع، مهندسیدانشکده
17/16/6710 پذیرش؛ 11/70/6710بازنگری؛ +70/11/6712 ارسال
چکیده:
قررار پردازشمورد درستی به بهداشتی هایمراقبت هایداده از بخش وسیعی حاضر، حال در. است جهان در میر و مرگ عمده علل از یکی قلبی بیماری
طریر از تروانمری را قلبری هرایبیمراری بره ابتال خطردر حالیکه، . استفاده نمود گیریتصمیم جهت موثر طور ها بهاز آنتوان متعاقباً نمی و گیردنمی
انرهبینپریش و توصیفی هایترکیب روش از استفاده با مقاله، این درمدل پیشنهادی . کرد بینیپیش کاویداده دانشاستفاده از با آن خطر عوامل بررسی
عررو بیماری به مبتال بیماران یموثر طور بهبتوانند تا باشدمی بهداشتی هایمراقبت سیستم متخصصان به کمک آن هدف و است شده ارائه کاویداده
تعرداد ،در ابتردا. کار برده شده اسرتبه بندیدسته و بندیخوشه هایروش از برخی هدف، این به دستیابی منظور به. بینی نمایندرا پیش (CAD) کرونر
هرای مختلرد درخرت روش ،خوشره هرر بررای CAD بیمراران بینیپیش منظور به سپس. شودمی تعیین یبندخوشه هایشاخص از استفاده با هاخوشه
در C & RT تصرمیم درخت روش که دهدمی نشان آمده بدست نتایج نهایت، در. گیرندمی قرار استفاده مورد (ANN) مصنوعی عصبی شبکه تصمیم و
داده پایگراه از و هسرتند واقعریکار این در استفاده مورد هایداده تمام. است بهترین 77700 یخطا با تحقیقاتی کار این در استفاده مورد هایداده تمام
.نداشده آوری جمع قلب کلینیک
.تصمیم درخت بندی،طبقه بندی،خوشه عروقی، قلبی هایبیماری کاوی،داده :کلمات کلیدی