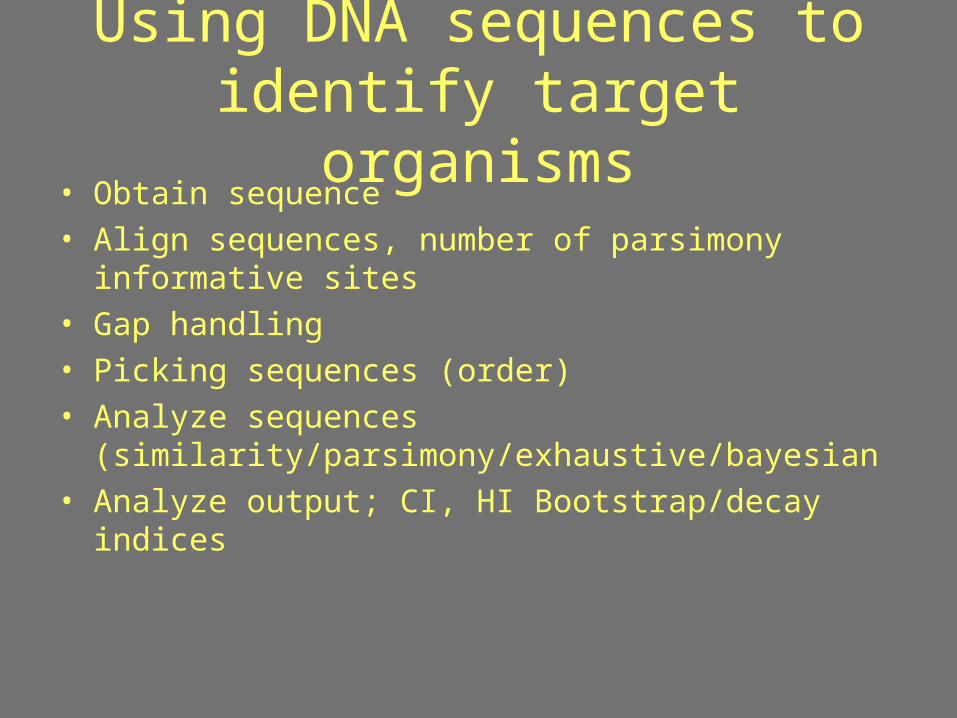
using dna sequences to identify target organisms obtain sequence align sequences, number of...
Post on 20-Dec-2015
231 views
TRANSCRIPT
Using DNA sequences to identify target organisms
• Obtain sequence• Align sequences, number of parsimony informative sites• Gap handling• Picking sequences (order)• Analyze sequences
(similarity/parsimony/exhaustive/bayesian• Analyze output; CI, HI Bootstrap/decay indices

2
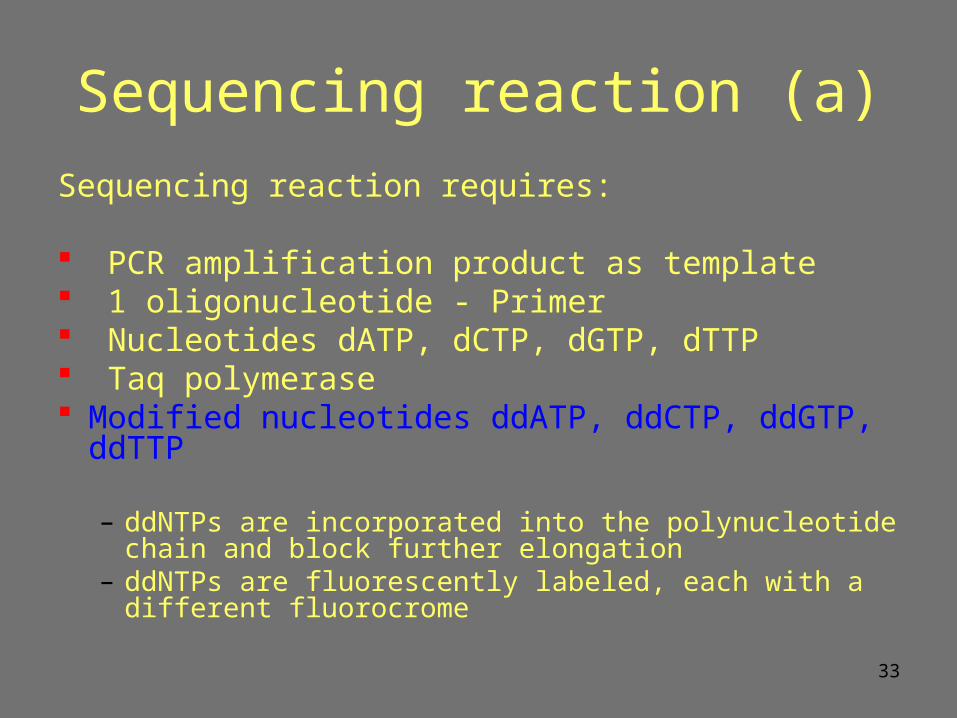
Sequencing reaction (a)
Sequencing reaction requires:
PCR amplification product as template 1 oligonucleotide - Primer Nucleotides dATP, dCTP, dGTP, dTTP Taq polymerase Modified nucleotides ddATP, ddCTP, ddGTP, ddTTP
– ddNTPs are incorporated into the polynucleotide chain and block further elongation
– ddNTPs are fluorescently labeled, each with a different fluorocrome

3
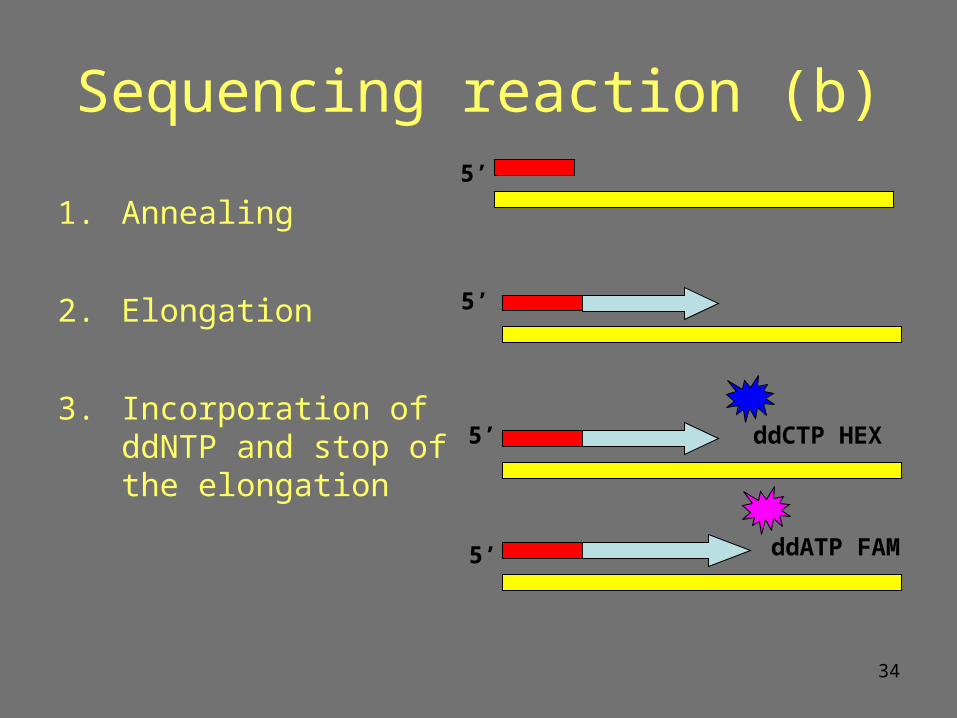
Sequencing reaction (b)
1. Annealing
2. Elongation
3. Incorporation of ddNTP and stop of the elongation
ddATP FAM
ddCTP HEX
5’
5’
5’
5’

4
5
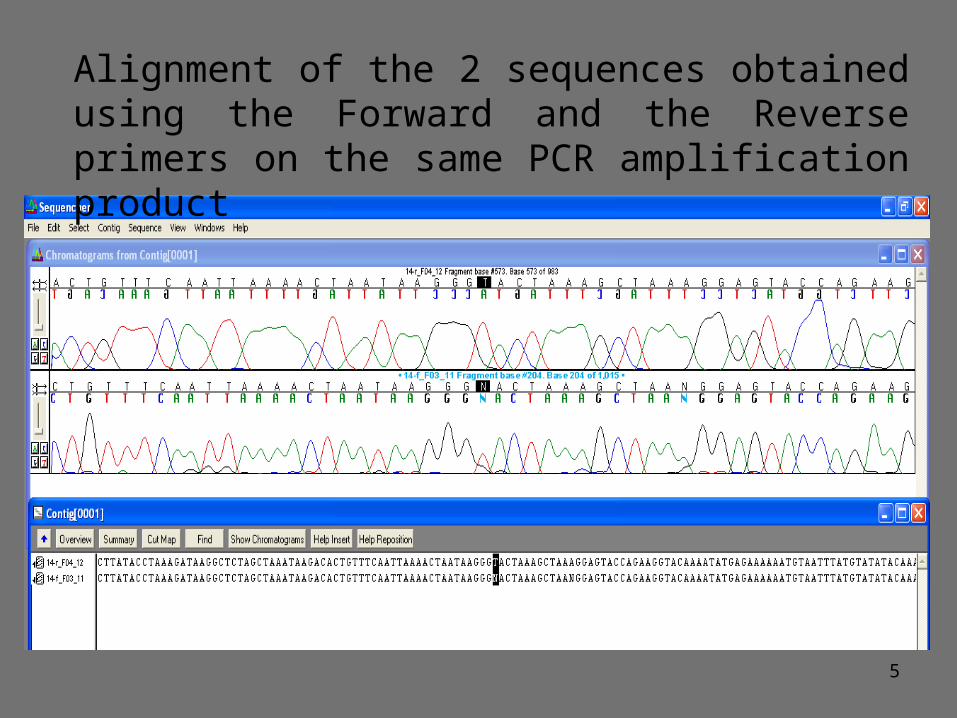
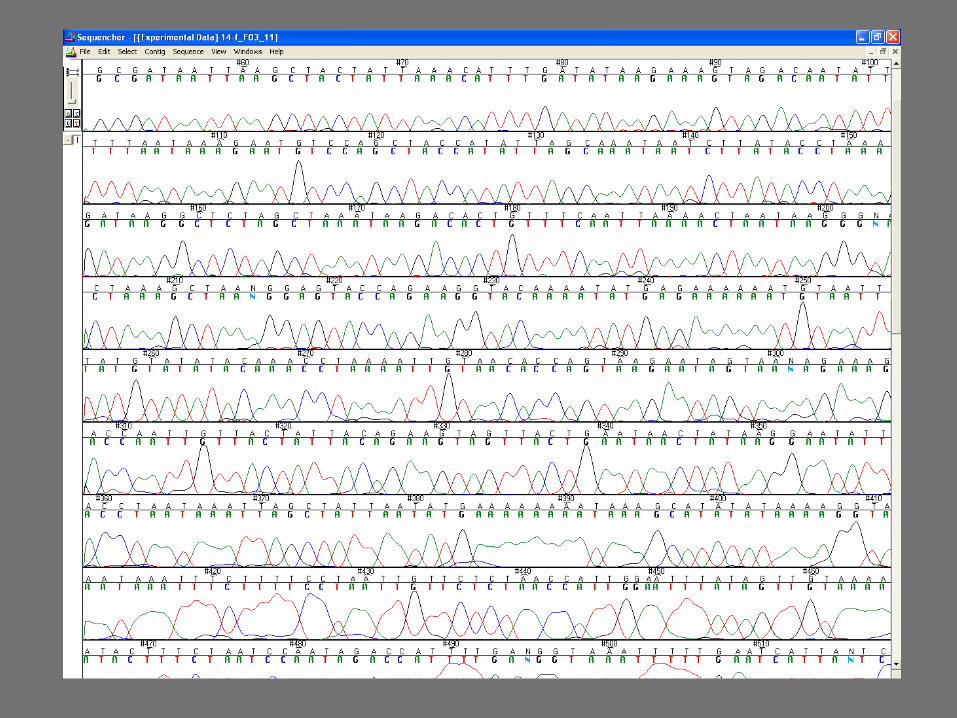
Alignment of the 2 sequences obtained using the Forward and the Reverse primers on the same PCR amplification product
6
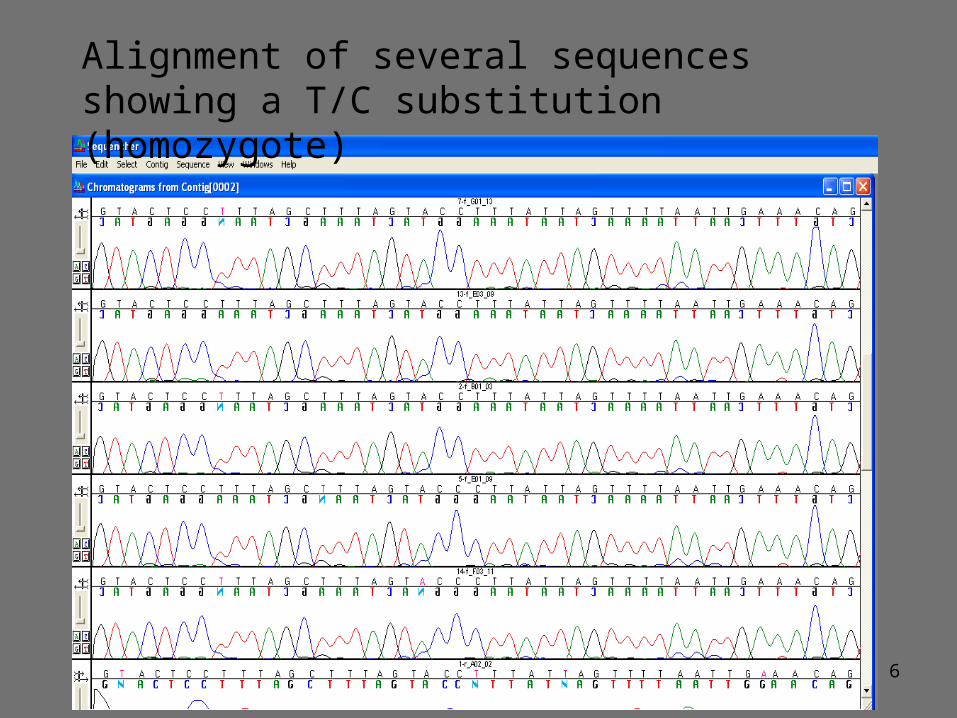
Alignment of several sequences showing a T/C substitution (homozygote)
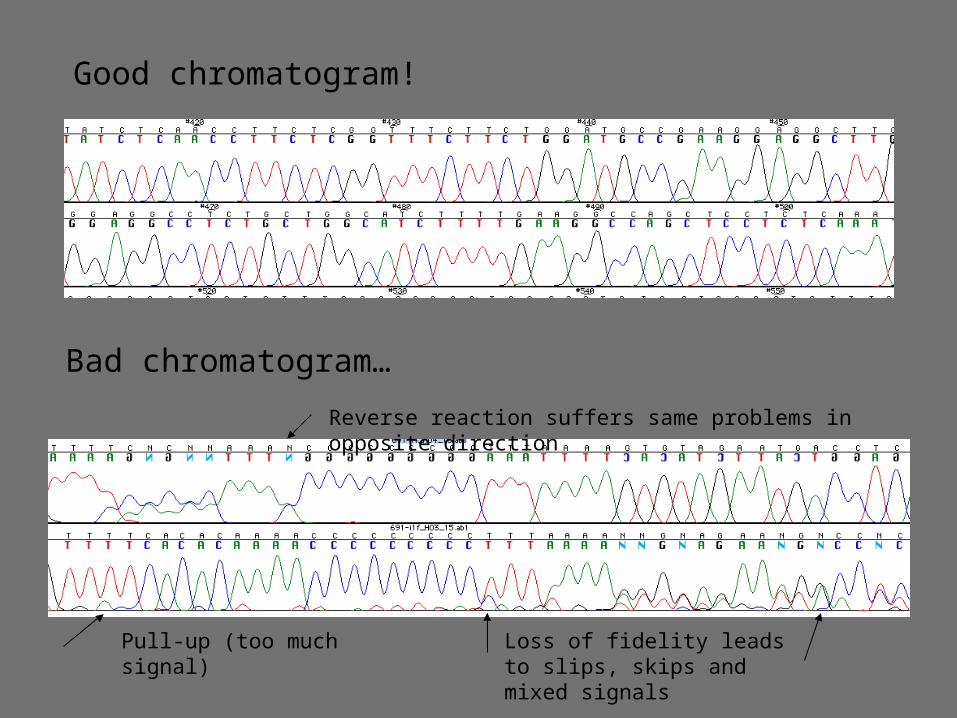
Good chromatogram!
Bad chromatogram…
Pull-up (too much signal) Loss of fidelity leads to slips, skips and mixed signals
Reverse reaction suffers same problems in opposite direction
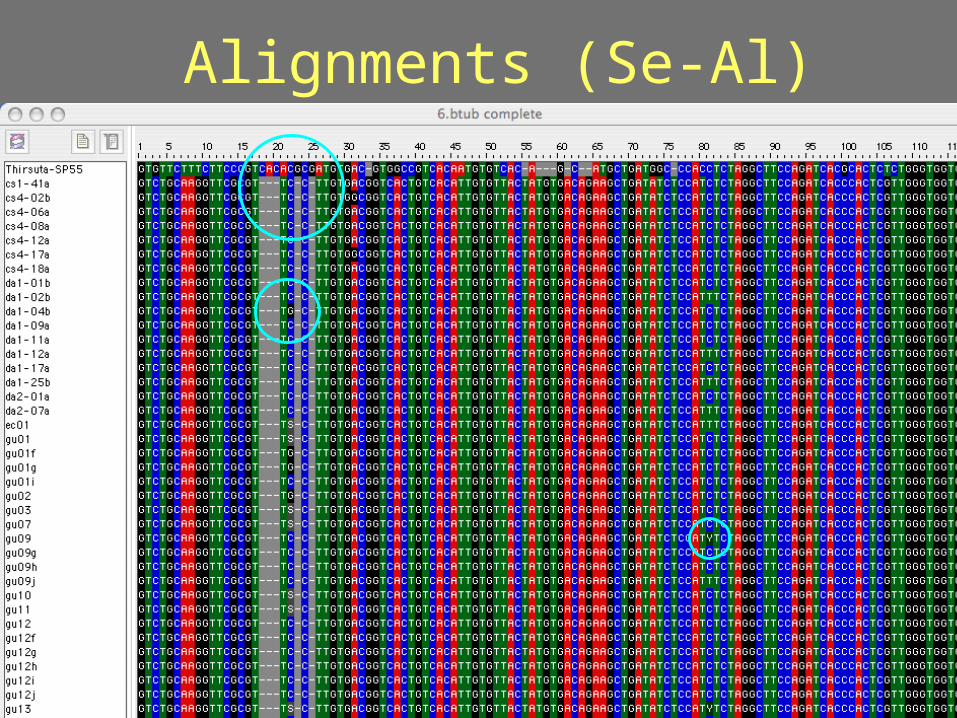
Alignments (Se-Al)
Using DNA sequences
• Bootstrap: the presence of a branch separating two groups of microbial strains could be real or simply one of the possible ways we could visualize microbial populations. Bootstrap tests whether the branch is real. It does so by trying to see through iterations if a similar branch can come out by chance for a given dataset
• BS value over 65 ok over 80 good, under 60 bad

10
Statistical support
Re-sampling (~ 10000 times)Bootstrap analysis
The original loci are randomly re-sampled with replacement
Jacknife analysis
From the original data 1 locus is randomly removed
Using DNA sequences
• Testing alternative trees: kashino hasegawa • Molecular clock• Outgroup• Spatial correlation (Mantel)
• Networks and coalescence approaches
Genotype
• A unique individual as defined by an array of genetic markers. (the more markers you have the less mistaken identity you will have.
blonde

• Blonde
• Blue-eyed

• Blonde
• Blue-eyed
• Hairy
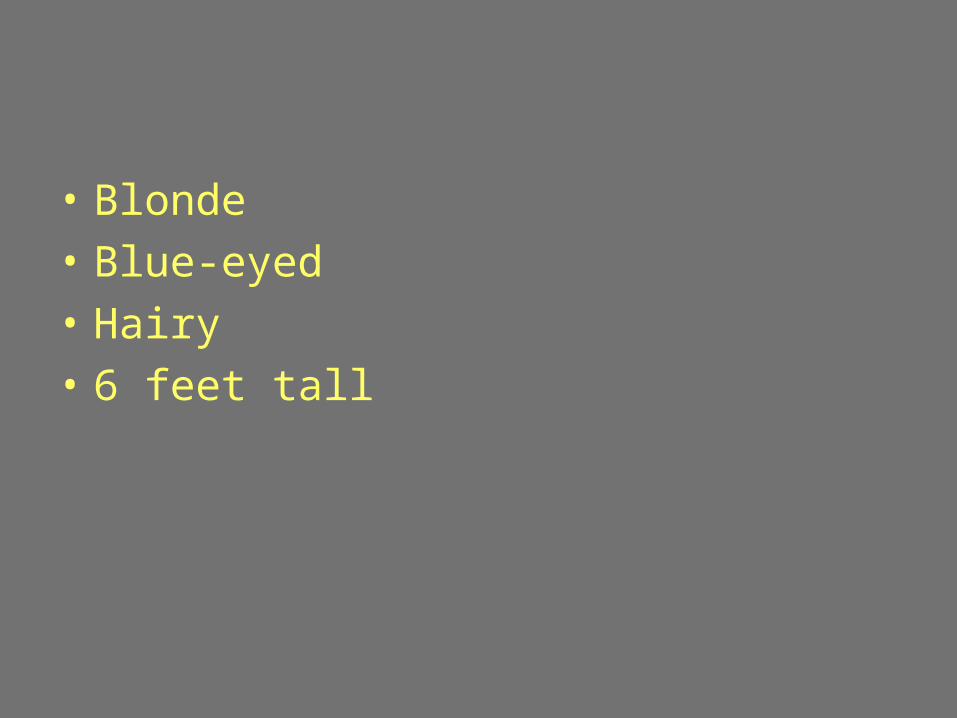
• Blonde
• Blue-eyed
• Hairy
• 6 feet tall

• Blonde
• Blue-eyed
• Hairy
• 6 feet tall
• Missing two molars
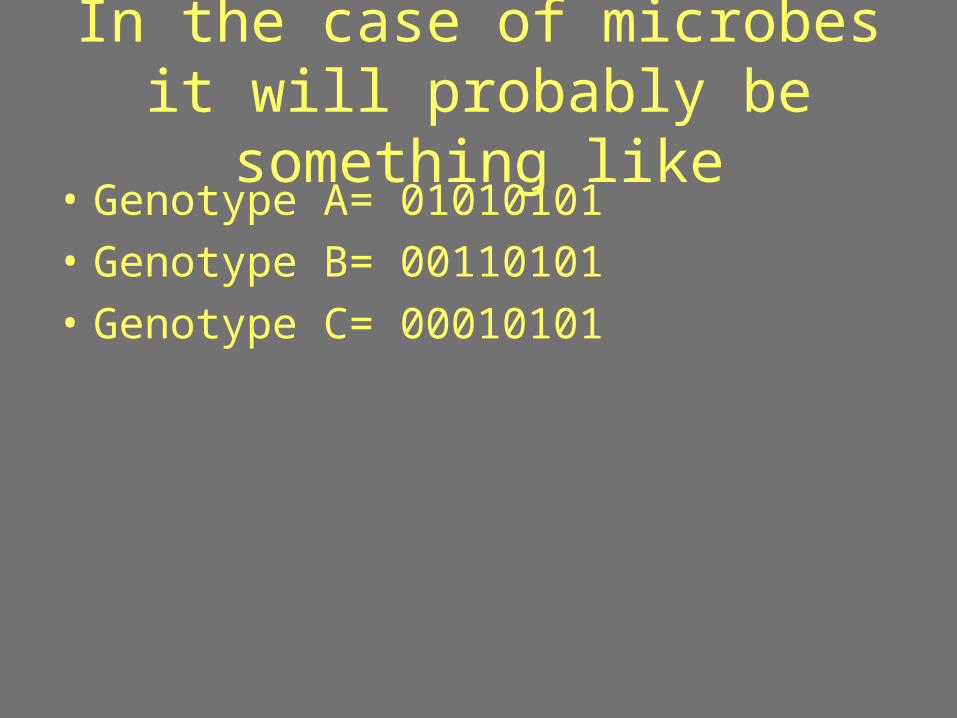
In the case of microbes it will probably be something like
• Genotype A= 01010101
• Genotype B= 00110101
• Genotype C= 00010101
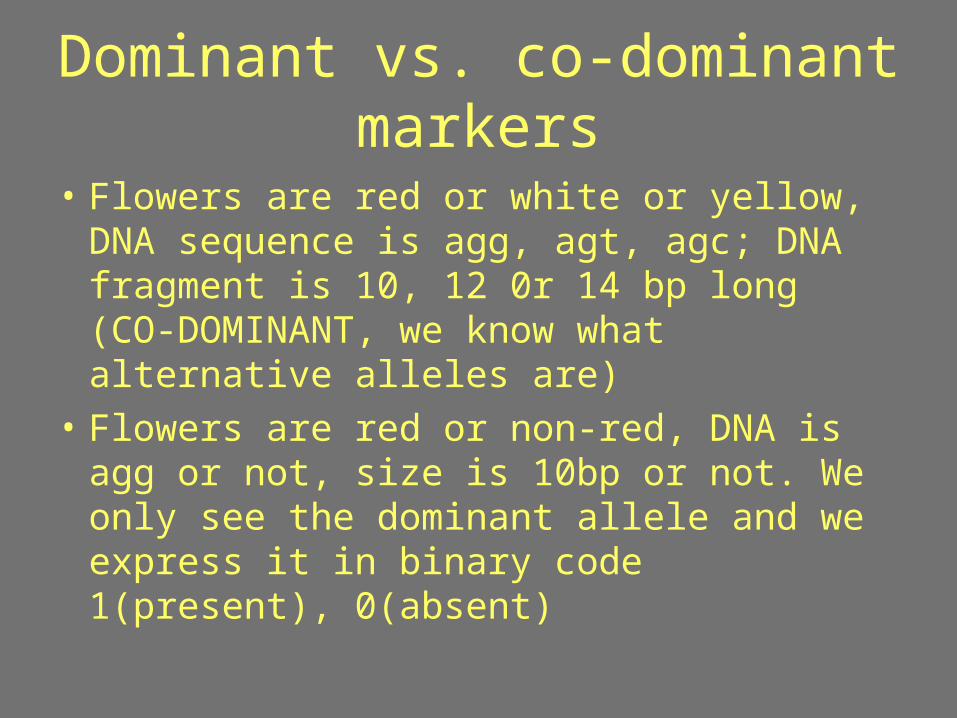
Dominant vs. co-dominant markers
• Flowers are red or white or yellow, DNA sequence is agg, agt, agc; DNA fragment is 10, 12 0r 14 bp long (CO-DOMINANT, we know what alternative alleles are)
• Flowers are red or non-red, DNA is agg or not, size is 10bp or not. We only see the dominant allele and we express it in binary code 1(present), 0(absent)

Limitations of co-dominant markers
• Not all non-red flowers are the same, but we assume they are (non red flowers can be orange or yellow)
• If at one locus we have a dominant A allele and a recessive a allele, using a codominant marker we would say AA=Aa but not aa. We know in reality AA and Aa are quite different.
20
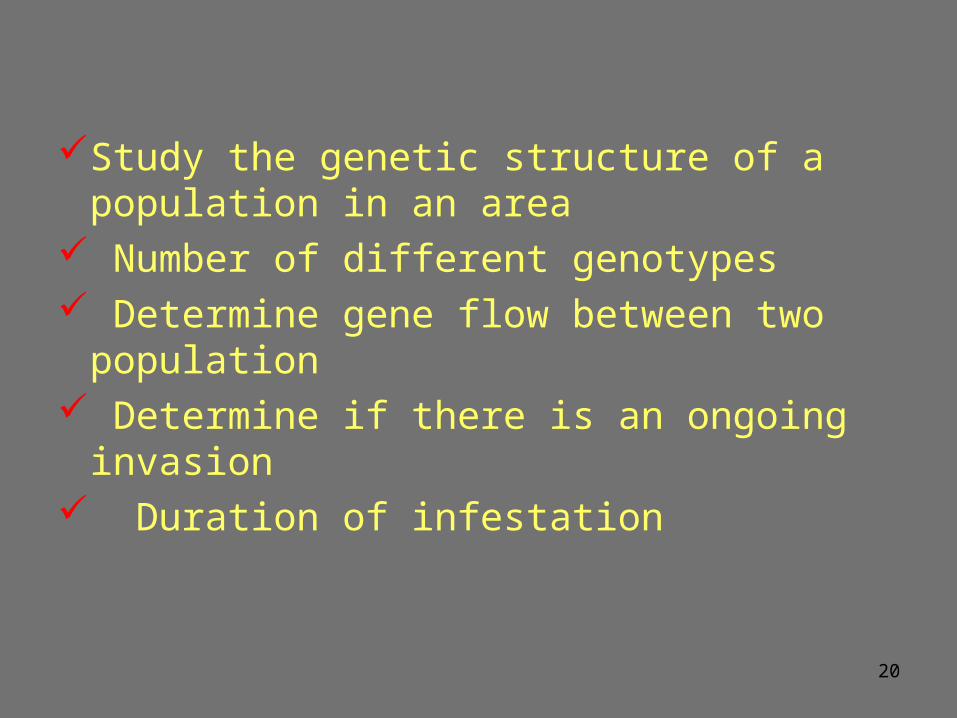
Study the genetic structure of a population
in an area Number of different genotypes Determine gene flow between two
population Determine if there is an ongoing invasion Duration of infestation

21
Some Considerations in Choosing a Genotyping Method• Level of taxonomic resolution desired
(Populations? Species? Phyla?)• Level of genotypic resolution desired
– Dominant vs. codominant markers– Fine (e.g., nucleotide-level) data vs. coarse
(e.g., fragment size) genomic scale
• Previous sequence knowledge• Cost and labor constraints
22
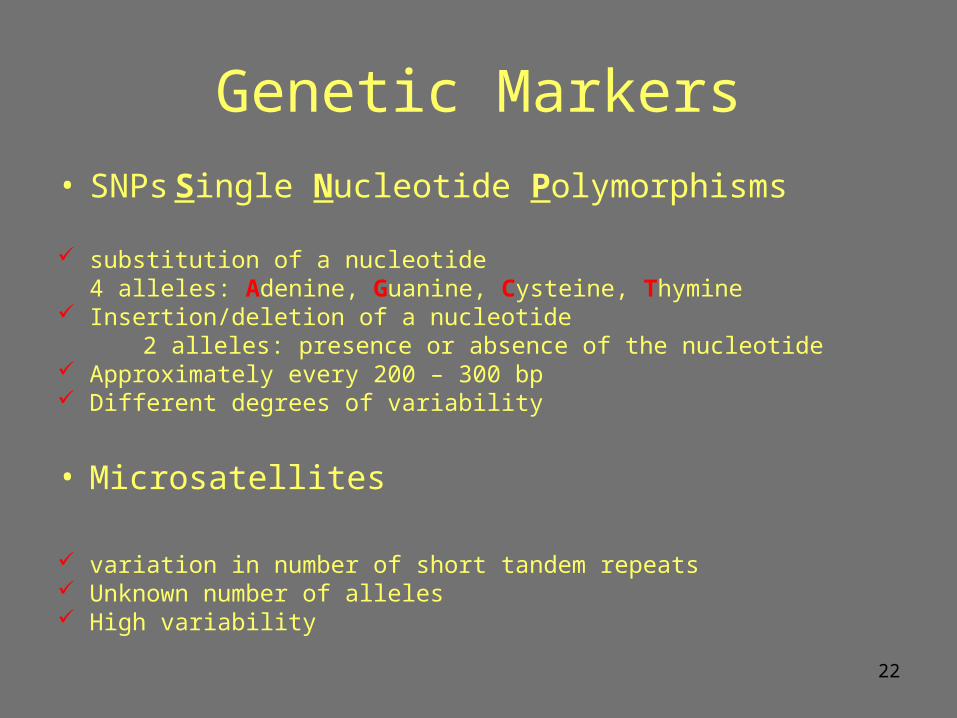
Genetic Markers
• SNPsSingle Nucleotide Polymorphisms
substitution of a nucleotide4 alleles: Adenine, Guanine, Cysteine, Thymine
Insertion/deletion of a nucleotide2 alleles: presence or absence of the nucleotide
Approximately every 200 – 300 bp Different degrees of variability
• Microsatellites
variation in number of short tandem repeats Unknown number of alleles High variability

23
Choice of genetic marker (a)
Comparison of individuals of the same species but isolated requires markers with low level of variability
No microsatellitesSNPs in genes necessary for the survival
of the cell• ATPase (cellular energy)• Cyt b (cytochrome b)• Cox1 (cytochrome c oxidase subunit 1)
24
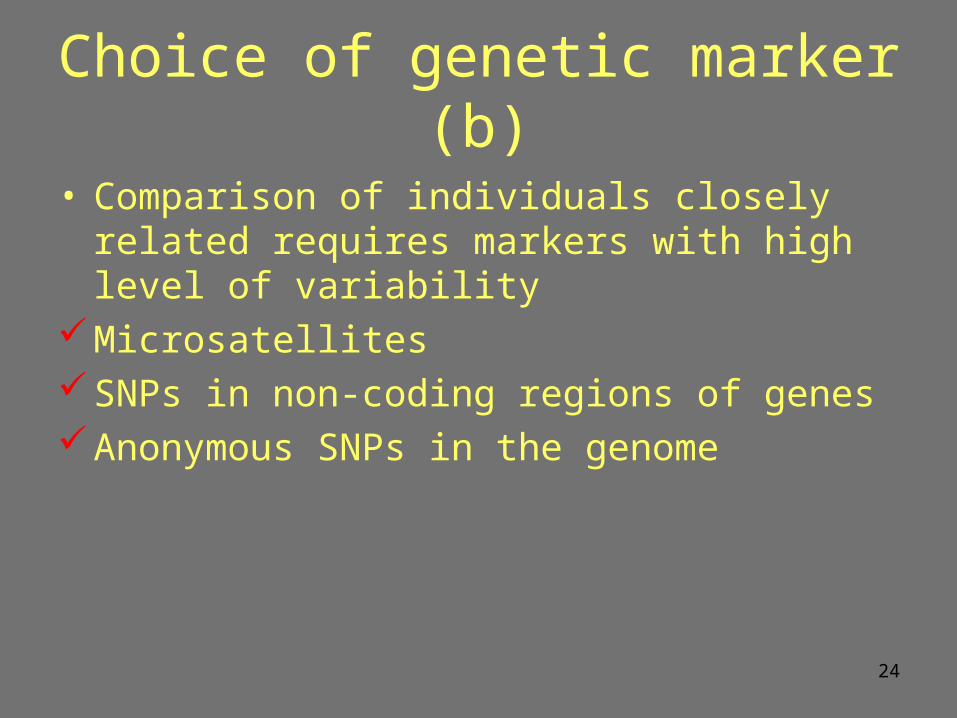
Choice of genetic marker (b)
• Comparison of individuals closely related requires markers with high level of variability
MicrosatellitesSNPs in non-coding regions of genesAnonymous SNPs in the genome
25
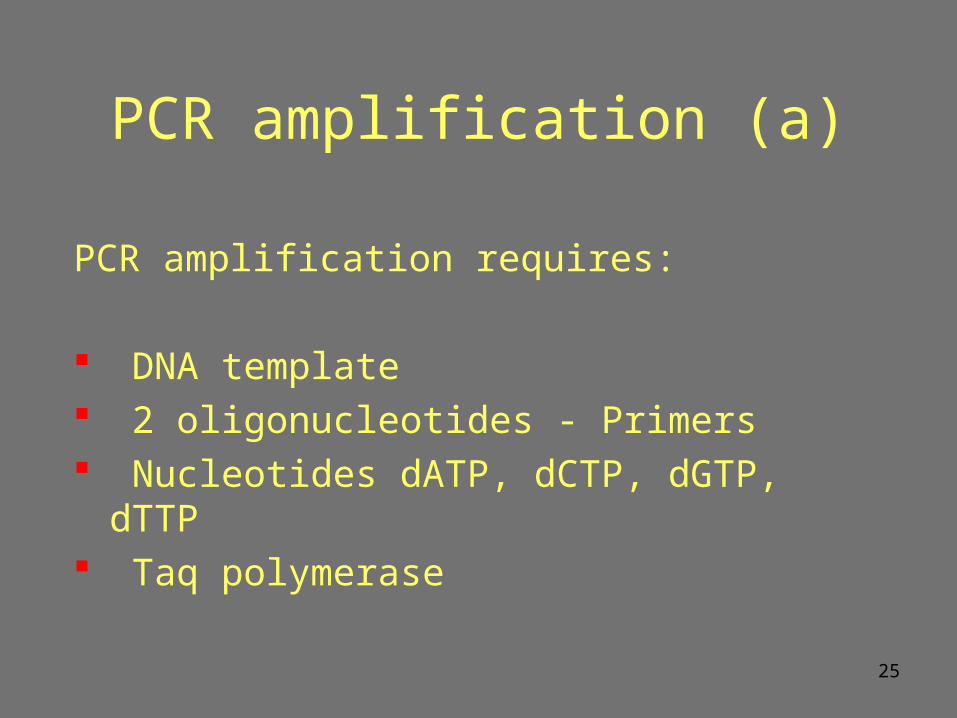
PCR amplification (a)
PCR amplification requires:
DNA template 2 oligonucleotides - Primers Nucleotides dATP, dCTP, dGTP, dTTP Taq polymerase

26
PCR reaction (b)
1. Double strand denaturation
2. Annealing of the primers
3. Elongation
5’5’
5’
3’3’
27
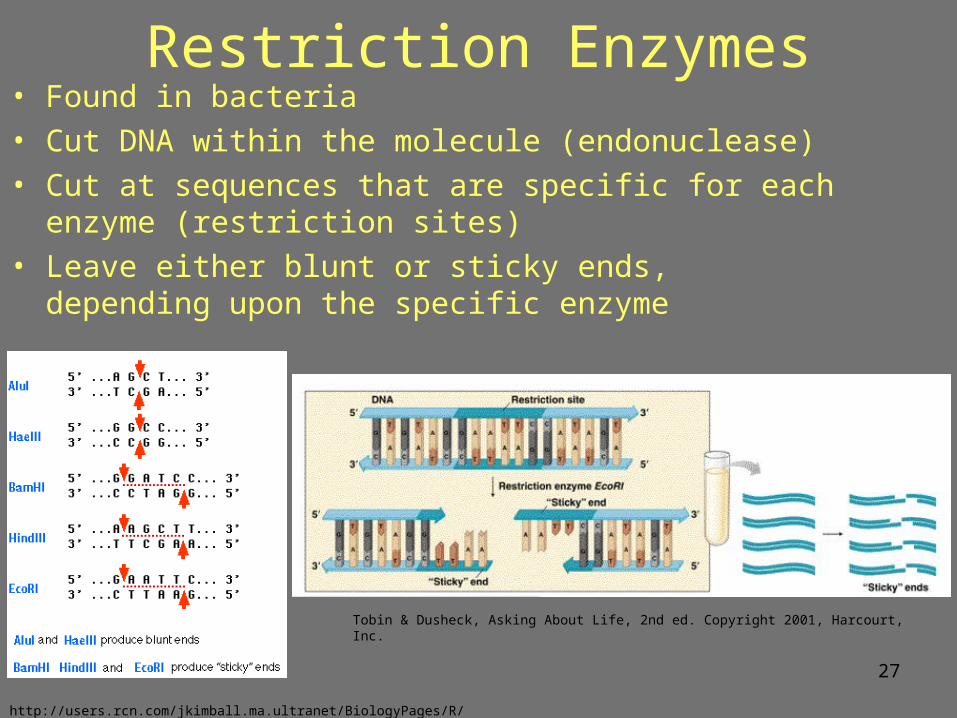
Restriction Enzymes• Found in bacteria
• Cut DNA within the molecule (endonuclease)
• Cut at sequences that are specific for each enzyme (restriction sites)
• Leave either blunt or sticky ends, depending upon the specific enzyme
http://users.rcn.com/jkimball.ma.ultranet/BiologyPages/R/RestrictionEnzymes.html
Tobin & Dusheck, Asking About Life, 2nd ed. Copyright 2001, Harcourt, Inc.
28
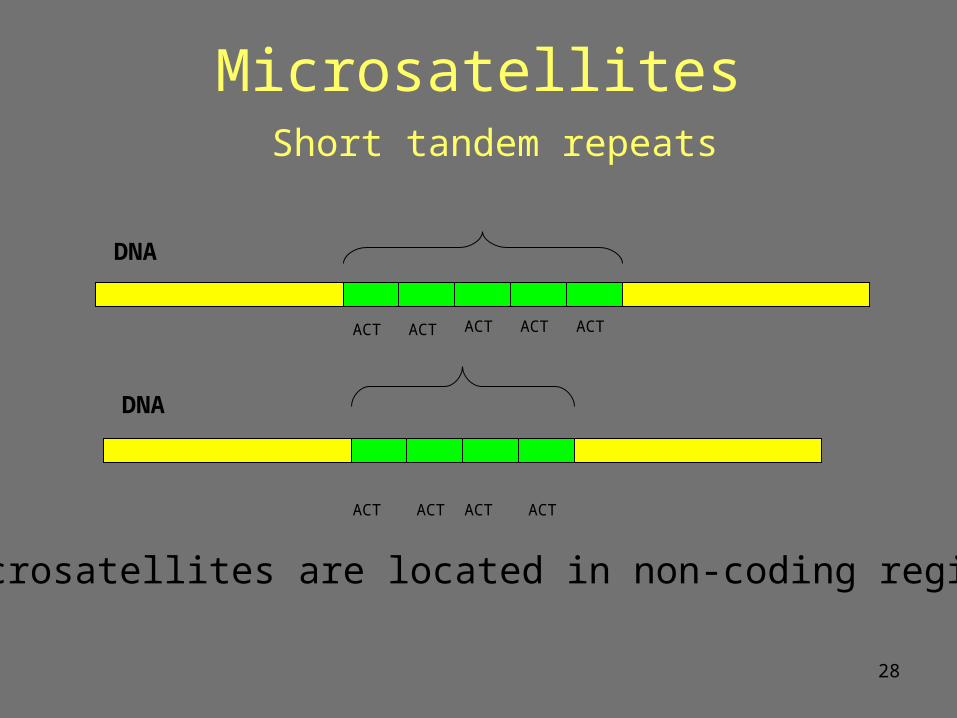
Microsatellites Short tandem repeats
ACT ACT ACTACT ACT
ACT ACT ACTACT
DNA
DNA
Microsatellites are located in non-coding regions
29
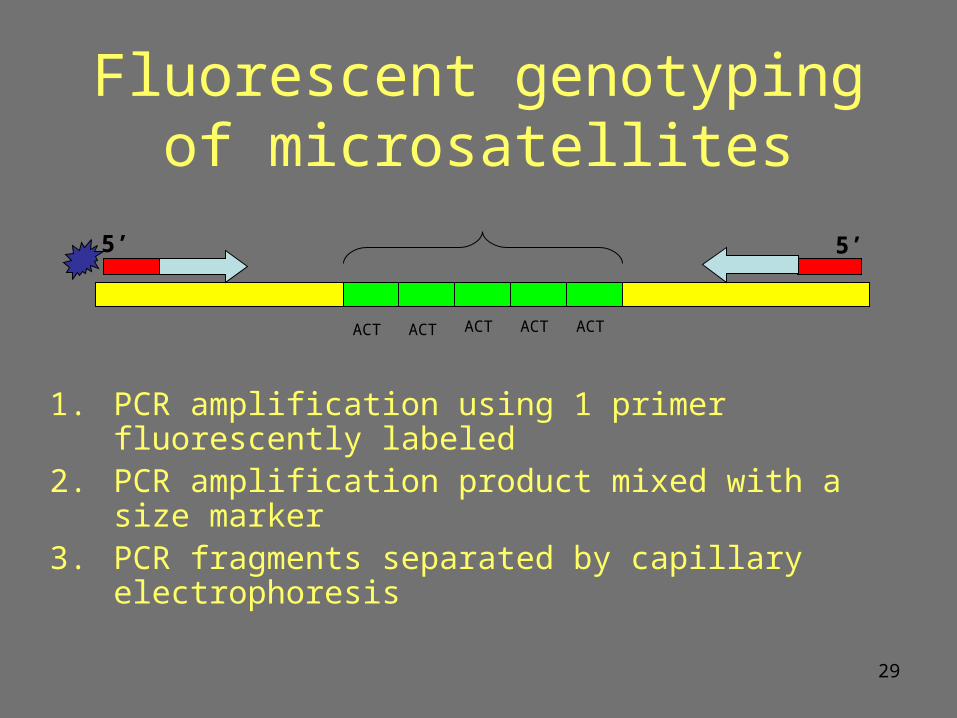
Fluorescent genotyping of microsatellites
1. PCR amplification using 1 primer fluorescently labeled2. PCR amplification product mixed with a size marker3. PCR fragments separated by capillary electrophoresis
ACT ACT ACT ACTACT
5’ 5’
30
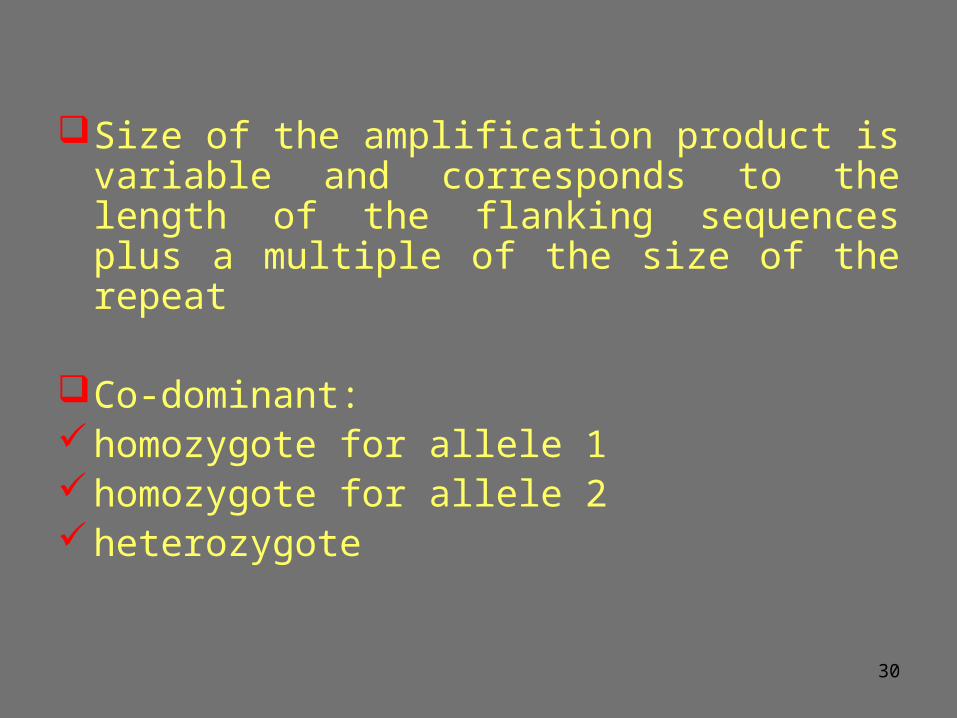
Size of the amplification product is variable and corresponds to the length of the flanking sequences plus a multiple of the size of the repeat
Co-dominant: homozygote for allele 1homozygote for allele 2 heterozygote
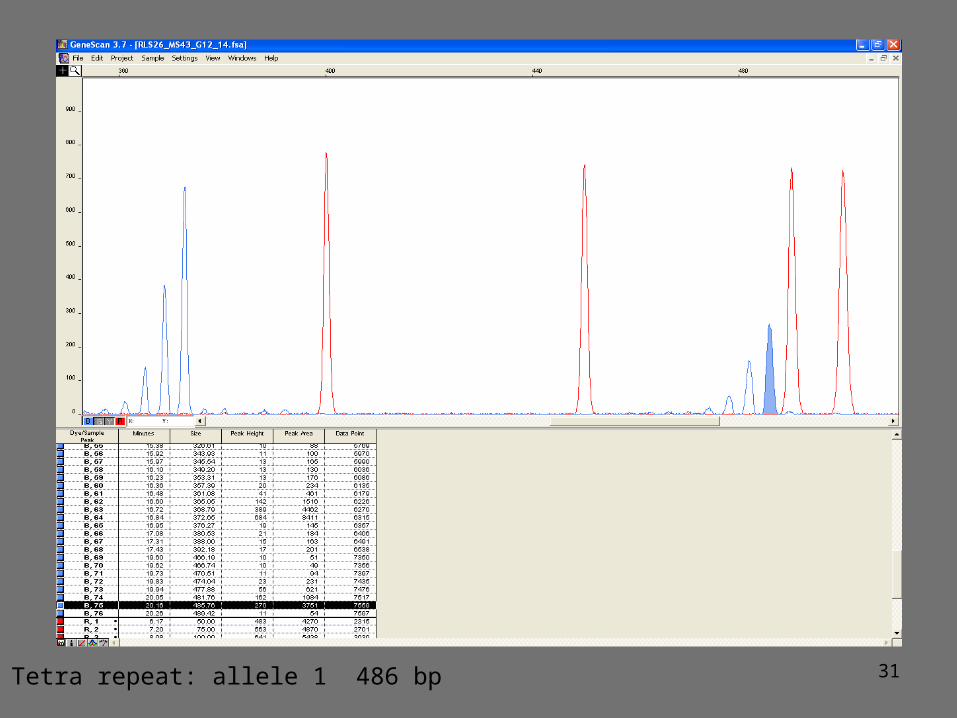
31Tetra repeat: allele 1 486 bp
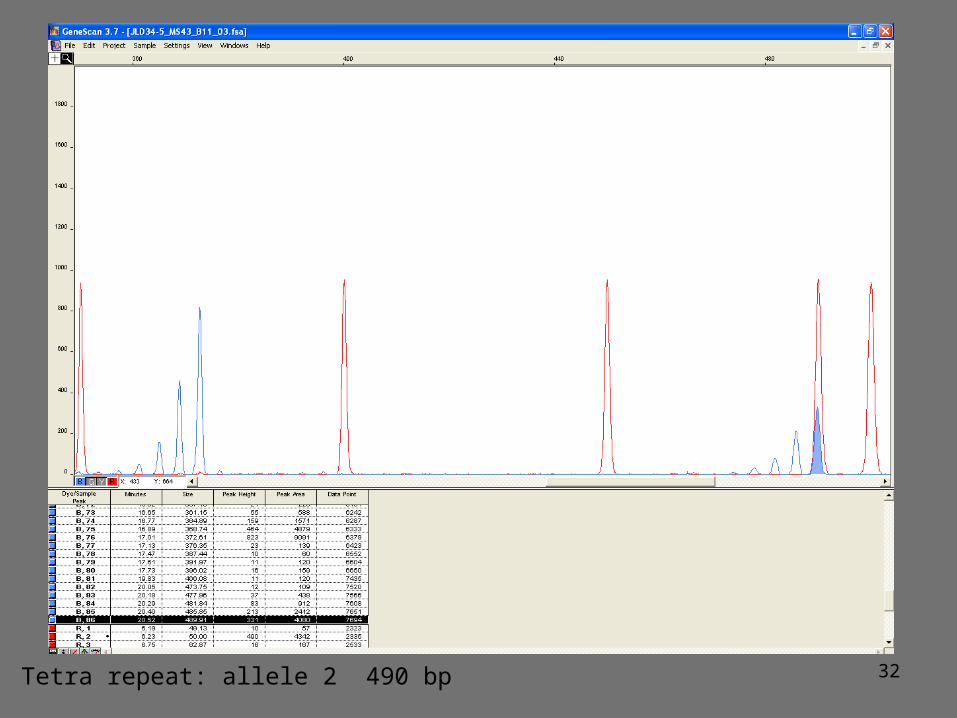
32Tetra repeat: allele 2 490 bp
33
Sequencing reaction (a)
Sequencing reaction requires:
PCR amplification product as template 1 oligonucleotide - Primer Nucleotides dATP, dCTP, dGTP, dTTP Taq polymerase Modified nucleotides ddATP, ddCTP, ddGTP, ddTTP
– ddNTPs are incorporated into the polynucleotide chain and block further elongation
– ddNTPs are fluorescently labeled, each with a different fluorocrome
34
Sequencing reaction (b)
1. Annealing
2. Elongation
3. Incorporation of ddNTP and stop of the elongation
ddATP FAM
ddCTP HEX
5’
5’
5’
5’
35

36
Alignment of the 2 sequences obtained using the Forward and the Reverse primers on the same PCR amplification product

37
Alignment of several sequences showing a T/C substitution (homozygote)
38
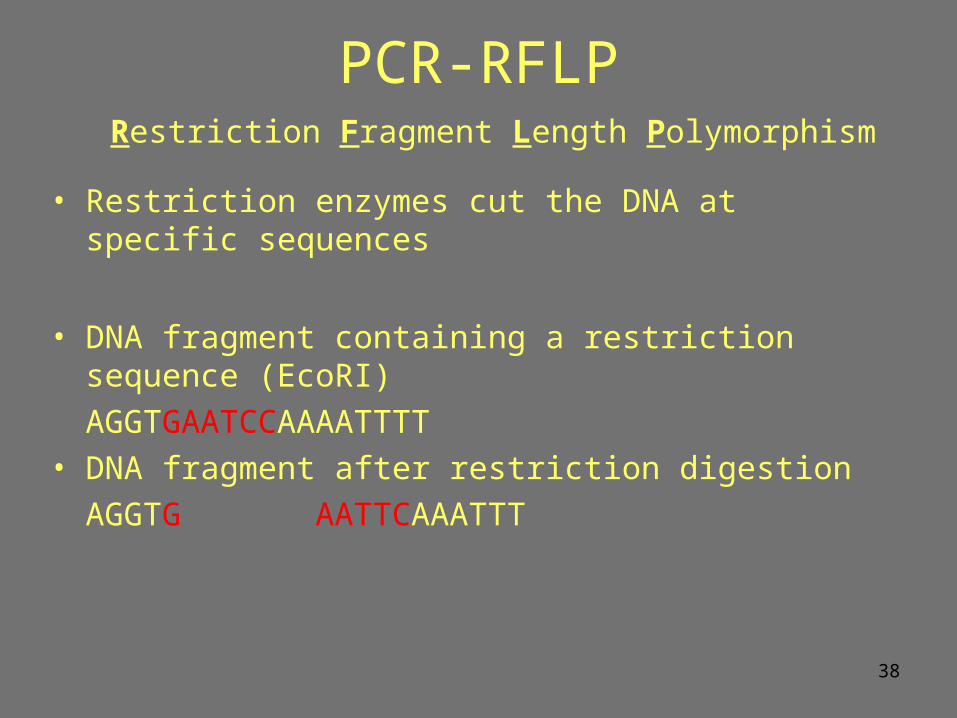
PCR-RFLP Restriction Fragment Length Polymorphism
• Restriction enzymes cut the DNA at specific sequences
• DNA fragment containing a restriction sequence (EcoRI)
AGGTGAATCCAAAATTTT • DNA fragment after restriction digestion
AGGTG AATTCAAATTT

39
Scoring PCR-RFLP
PCR amplification of the region containing the restriction sites
Electrophoresis to identify presence or absence of bands
Size marker
Sample 1 Sample 2

40
PCR-RFLPFluorescent electrophoresis
41
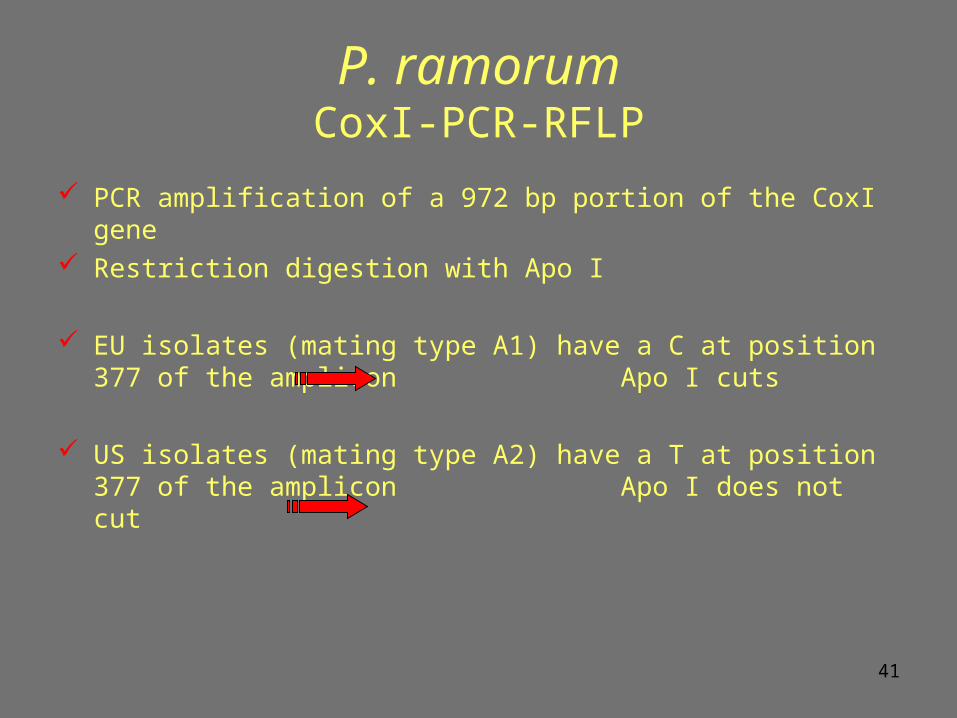
P. ramorumCoxI-PCR-RFLP
PCR amplification of a 972 bp portion of the CoxI gene Restriction digestion with Apo I
EU isolates (mating type A1) have a C at position 377 of the amplicon Apo I cuts
US isolates (mating type A2) have a T at position 377 of the amplicon Apo I does not cut
42
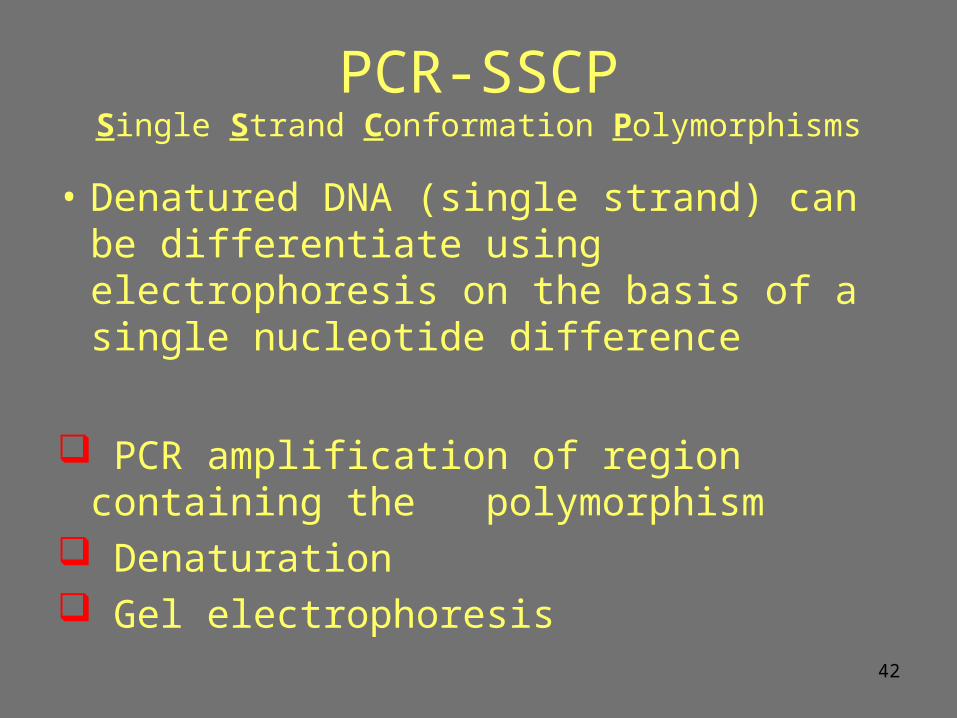
PCR-SSCPSingle Strand Conformation Polymorphisms
• Denatured DNA (single strand) can be differentiate using electrophoresis on the basis of a single nucleotide difference
PCR amplification of region containing the polymorphism
Denaturation Gel electrophoresis
43
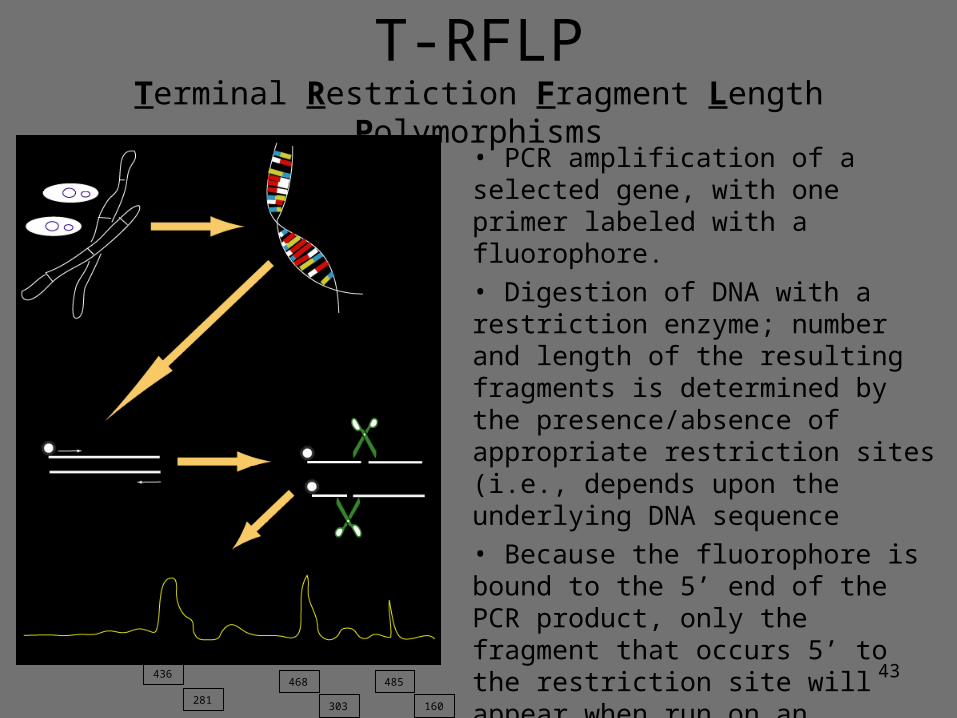
• PCR amplification of a selected gene, with one primer labeled with a fluorophore.• Digestion of DNA with a restriction enzyme; number and length of the resulting fragments is determined by the presence/absence of appropriate restriction sites (i.e., depends upon the underlying DNA sequence• Because the fluorophore is bound to the 5’ end of the PCR product, only the fragment that occurs 5’ to the restriction site will appear when run on an automated DNA sequencer • Size of the fragment may be specific to a certain genotype (though
resolution is limited!)436
281160303
468 485
T-RFLPTerminal Restriction Fragment Length Polymorphisms
44
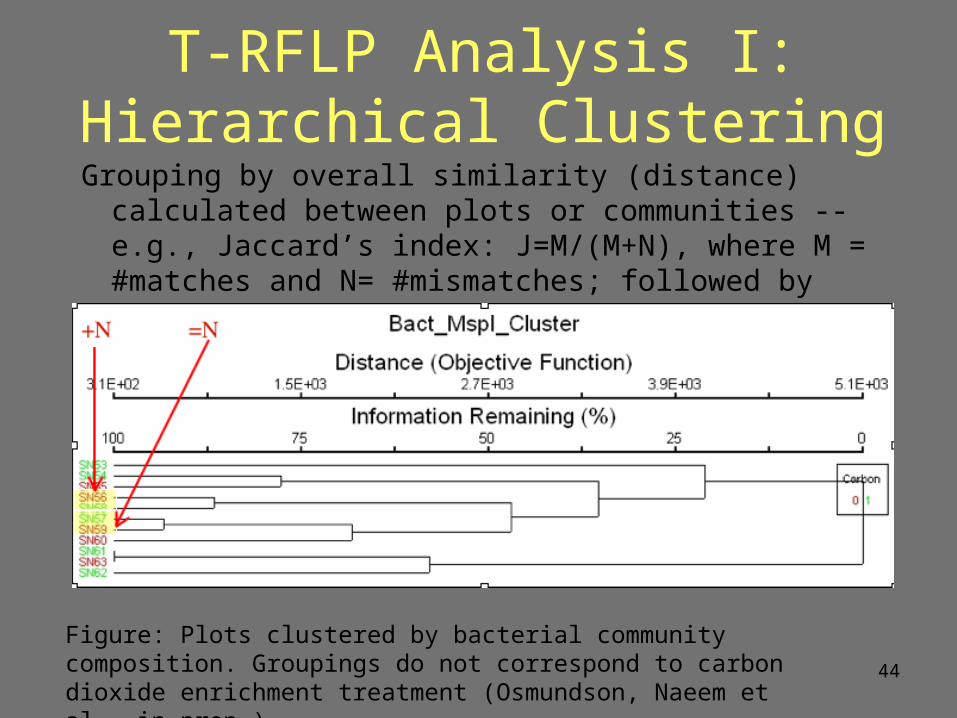
T-RFLP Analysis I:Hierarchical Clustering
Grouping by overall similarity (distance) calculated between plots or communities -- e.g., Jaccard’s index: J=M/(M+N), where M = #matches and N= #mismatches; followed by clustering (e.g., UPGMA)
Figure: Plots clustered by bacterial community composition. Groupings do not correspond to carbon dioxide enrichment treatment (Osmundson, Naeem et al., in prep.)
45
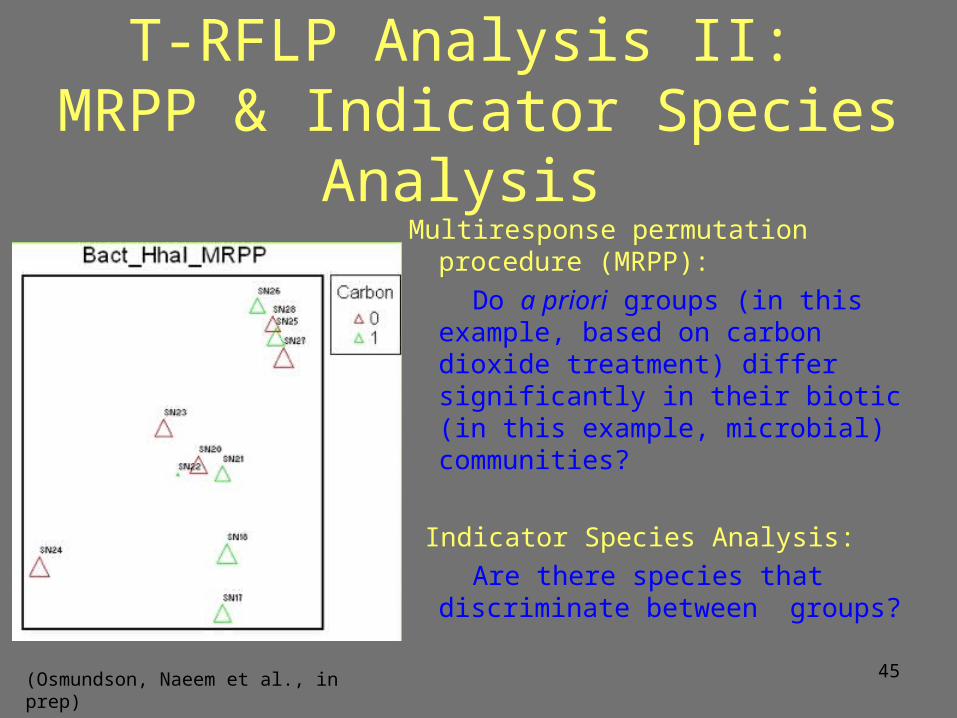
T-RFLP Analysis II: MRPP & Indicator Species
Analysis Multiresponse permutation procedure
(MRPP): Do a priori groups (in this example,
based on carbon dioxide treatment) differ significantly in their biotic (in this example, microbial) communities?
Indicator Species Analysis: Are there species that discriminate
between groups?
(Osmundson, Naeem et al., in prep)
46
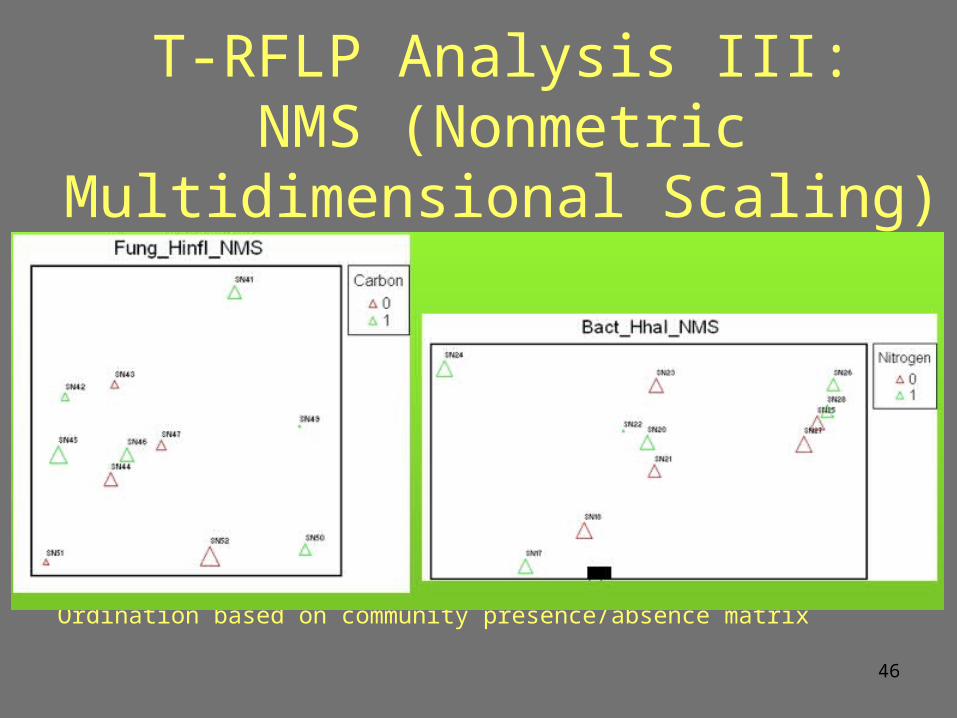
T-RFLP Analysis III:NMS (Nonmetric
Multidimensional Scaling)
Ordination based on community presence/absence matrix
47
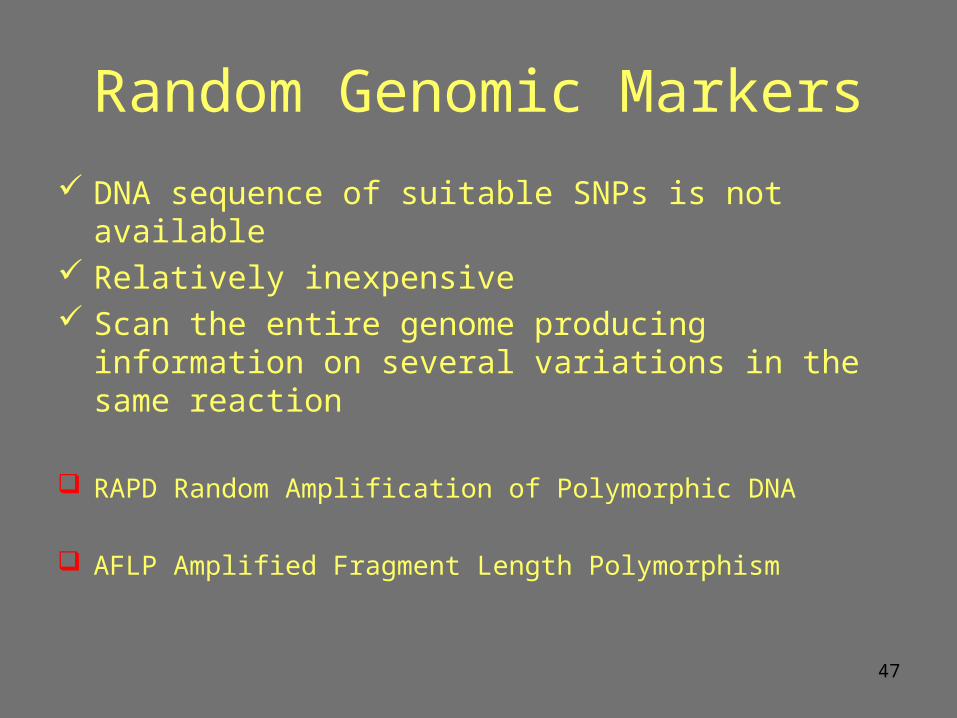
Random Genomic Markers
DNA sequence of suitable SNPs is not available Relatively inexpensive Scan the entire genome producing information on
several variations in the same reaction
RAPD Random Amplification of Polymorphic DNA
AFLP Amplified Fragment Length Polymorphism
48
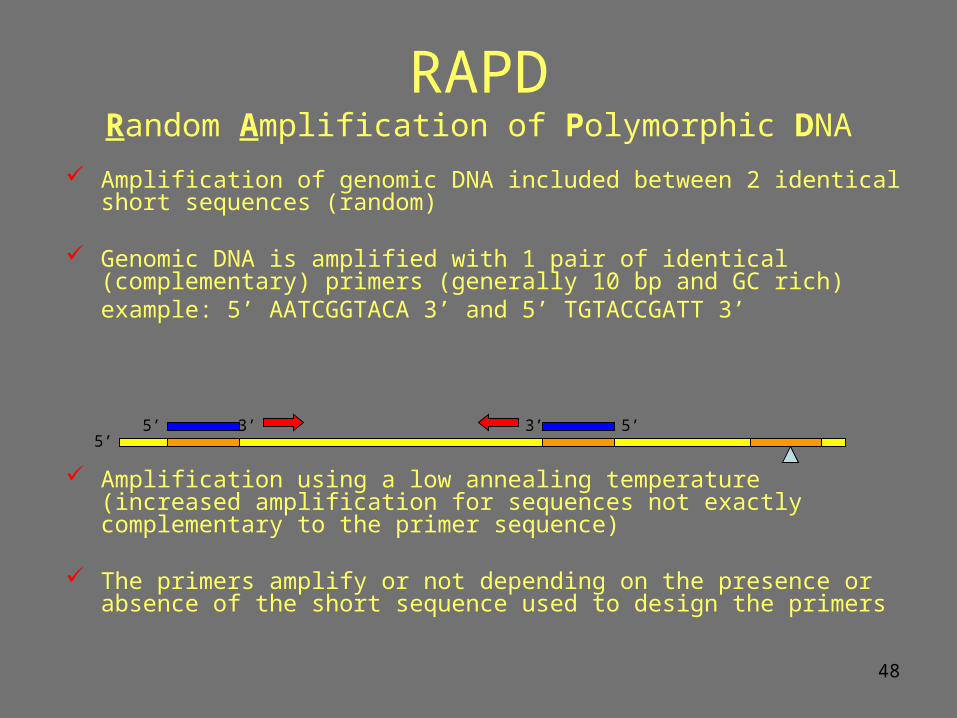
RAPDRandom Amplification of Polymorphic DNA
Amplification of genomic DNA included between 2 identical short sequences (random)
Genomic DNA is amplified with 1 pair of identical (complementary) primers (generally 10 bp and GC rich)example: 5’ AATCGGTACA 3’ and 5’ TGTACCGATT 3’
Amplification using a low annealing temperature (increased amplification for sequences not exactly complementary to the primer sequence)
The primers amplify or not depending on the presence or absence of the short sequence used to design the primers
3’3’ 5’5’5’
49
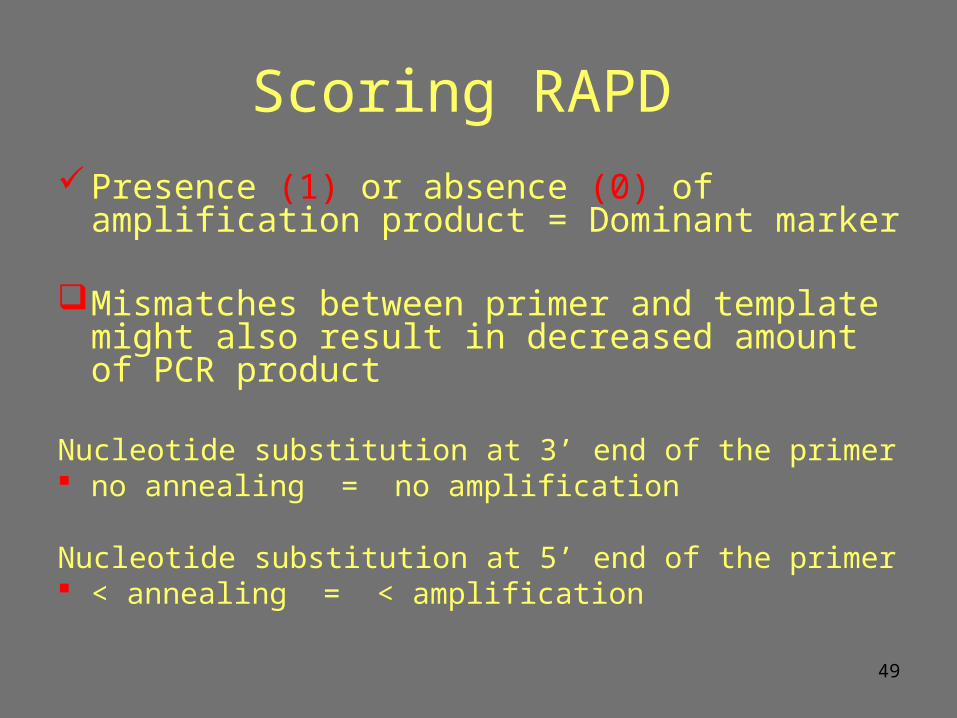
Scoring RAPD
Presence (1) or absence (0) of amplification product = Dominant marker
Mismatches between primer and template might also result in decreased amount of PCR product
Nucleotide substitution at 3’ end of the primer no annealing = no amplification
Nucleotide substitution at 5’ end of the primer < annealing = < amplification

50
AFLP Amplified Fragment Length Polymorphisms
(Vos et al., 1995)
Genomic DNA digested with 2 restriction enzymes:– EcoRI (6 bp restriction site)cuts infrequently
– MseI(4 bp restriction site)cuts frequently
GAATTCCTTAAG
TTAAAATT
51
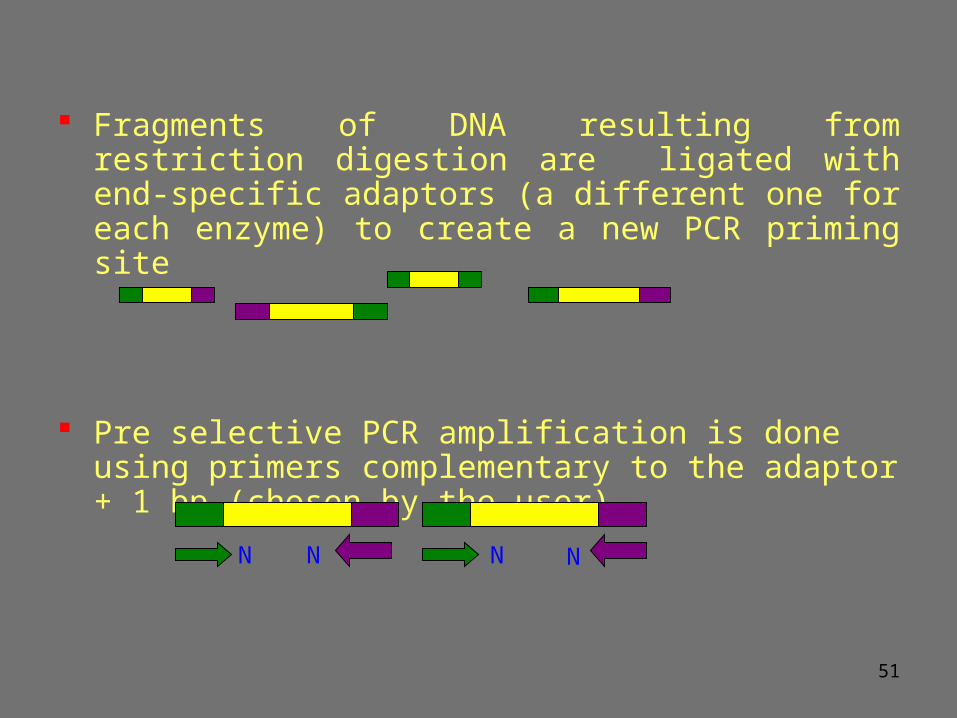
Fragments of DNA resulting from restriction digestion are ligated with end-specific adaptors (a different one for each enzyme) to create a new PCR priming site
Pre selective PCR amplification is done using primers complementary to the adaptor + 1 bp (chosen by the user)
NN N N
52
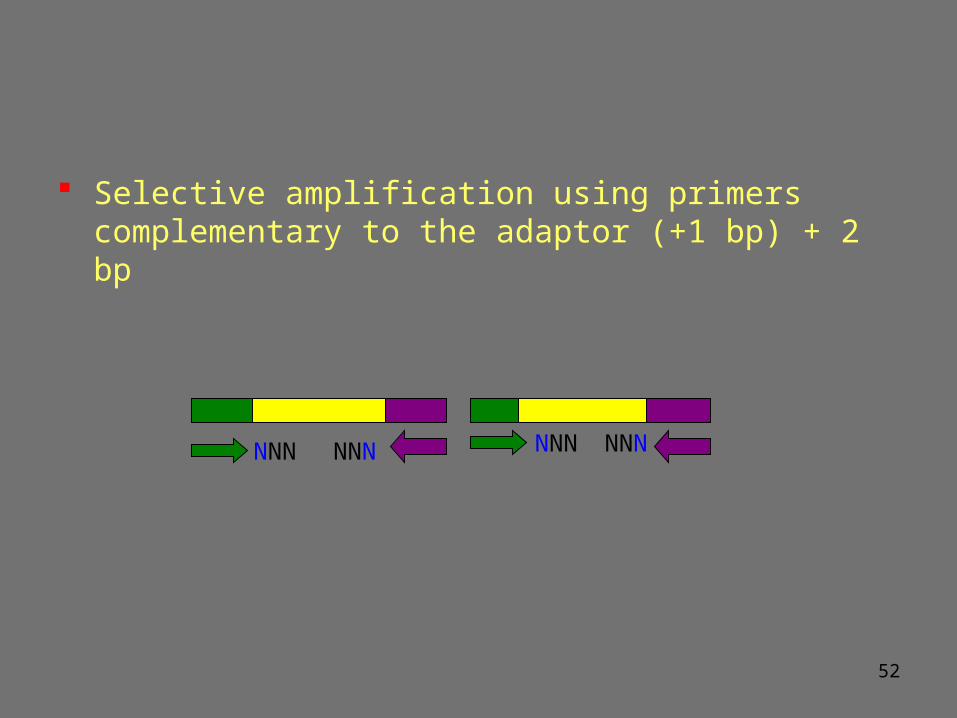
Selective amplification using primers complementary to the adaptor (+1 bp) + 2 bp
NNNNNN NNN NNN

53
AFLP genotyping
PCR amplification using primers corresponding to the new sequenceIf there are 2 new priming sites within 400 – 1600 bp there is amplification
The result is: Presence or absence of amplification1 or 0Dominant marker: does not distinguish between heterozygote and homozygote
Due mostly to SNPs but also to deletions/insertions

54
AFLP OVERVIEW(VOS ET AL., 1995)
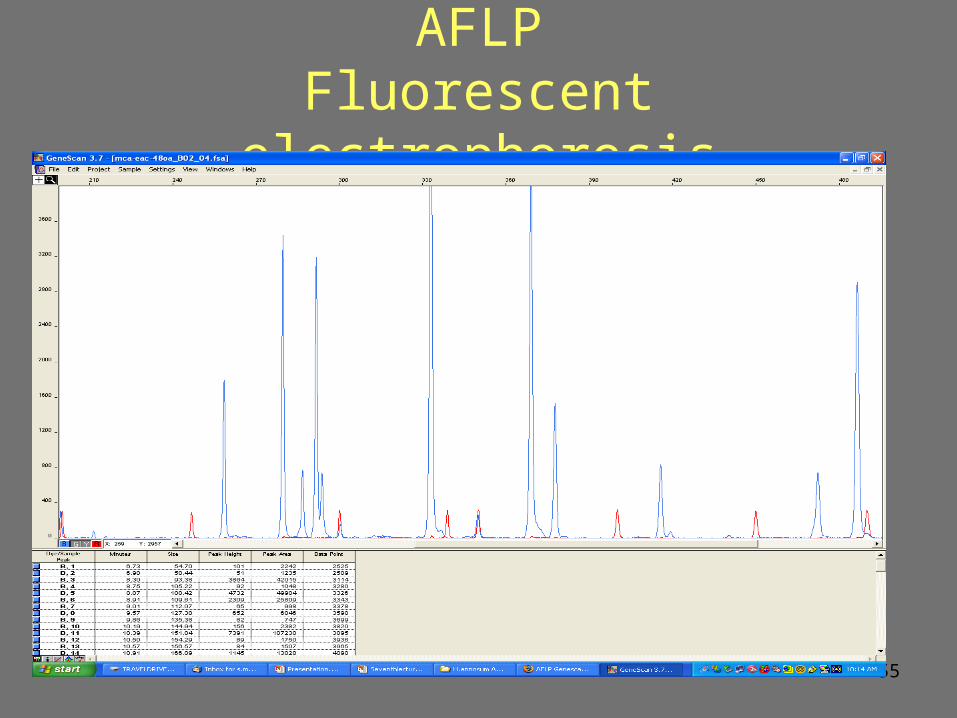
55
AFLPFluorescent electrophoresis