using educational outcomes to inform curriculum planning aims: to give an overview on the workings...
TRANSCRIPT
Using Educational Outcomes to inform Curriculum Planning
Aims:•To give an overview on the workings of Educational Outcomes•To demonstrate how Educational Outcomes can be used to improve performance•To demonstrate how Educational Outcomes can be used to seek out and share good practice between schools
Why use Educational Outcomes? • Gives an overview of outcomes from your
school over the last four years• Ability to compare schools against similar
schools (using KS2 APS)• To seek out good practice form other
schools• Interactive• Informative• Most Importantly – It is easy to use!
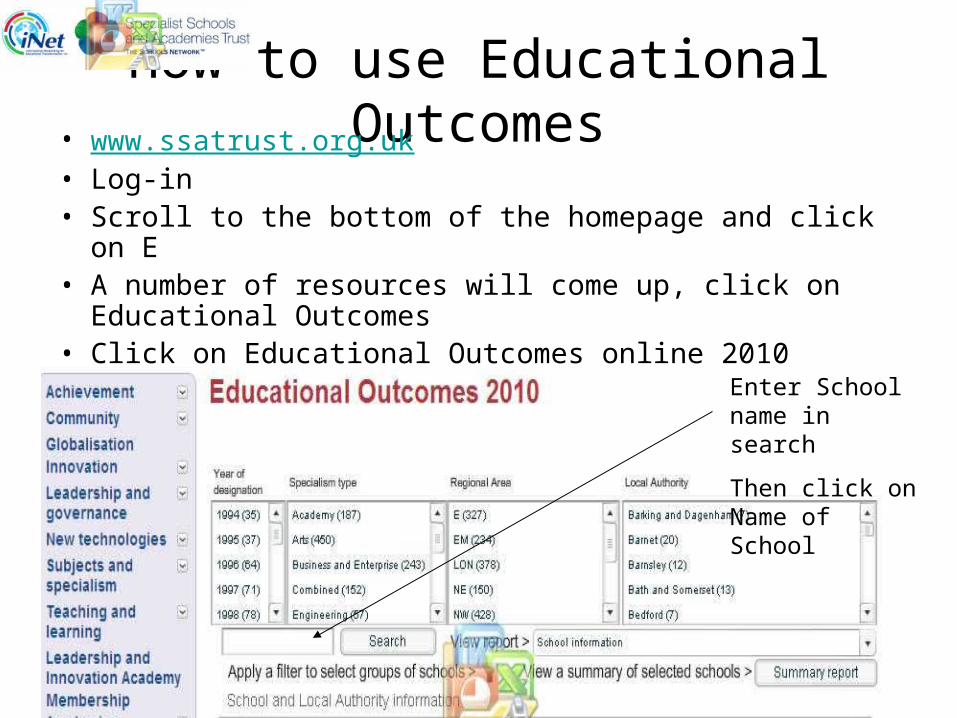
How to use Educational Outcomes• www.ssatrust.org.uk• Log-in• Scroll to the bottom of the homepage and click on E• A number of resources will come up, click on Educational
Outcomes• Click on Educational Outcomes online 2010
Enter School name in search
Then click on Name of School
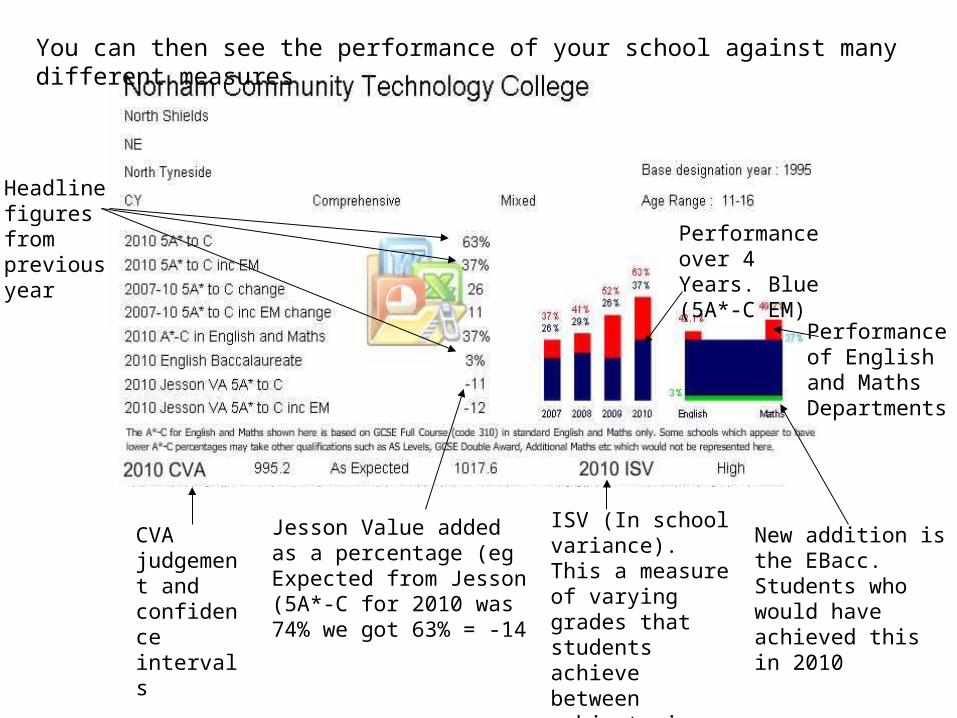
You can then see the performance of your school against many different measures
Headline figures from previous year
Performance over 4 Years. Blue (5A*-C EM)
ISV (In school variance). This a measure of varying grades that students achieve between subjects in a specific school.
CVA judgement and confidence intervals
Performance of English and Maths Departments
New addition is the EBacc. Students who would have achieved this in 2010
Jesson Value added as a percentage (eg Expected from Jesson (5A*-C for 2010 was 74% we got 63% = -14
Why is this a useful tool to use in school?• Clear graphics that indicate performance over
the four years against both 5A*-C measures• All headline figures given in one snapshot• Inform discussions about ISV, which
departments need to improve / which are out performing others
• Inform discussions about “matching students” in Maths and English – looking at profiles of like students in the new cohort
• Inform discussions about “matching students” with MFL and Humanities
Comparing against other schools
• This can be done against:– Schools Nationally– Geographical Area (probably most useful)– Local Authority (probably already have
contact with schools in own authority)– Specialism– Year of Designation (when the school became
a specialist school)
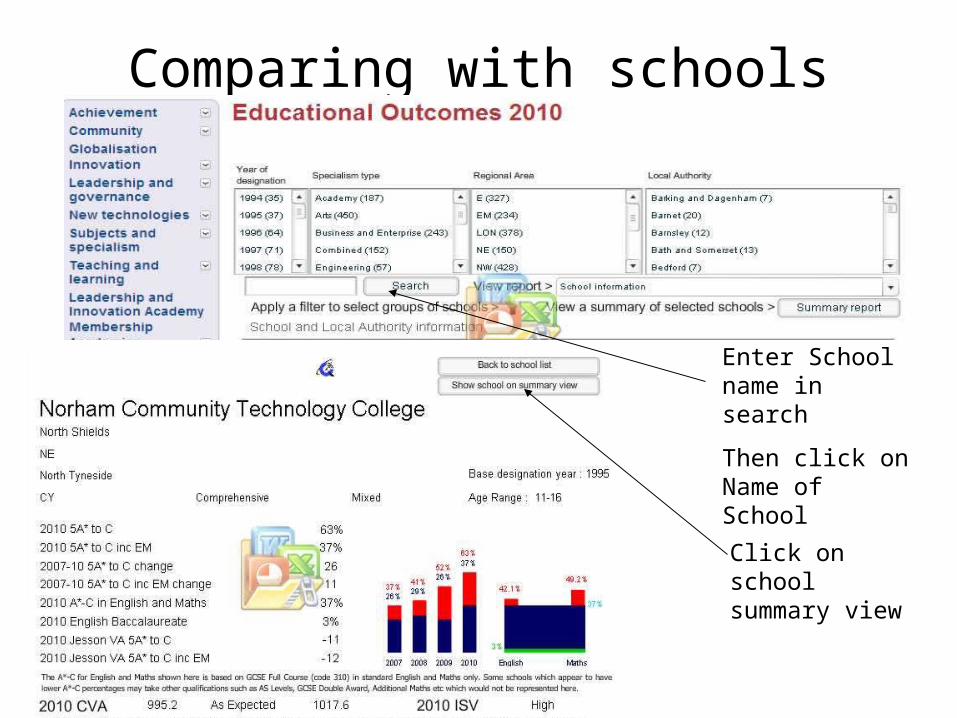
Comparing with schools
Enter School name in search
Then click on Name of School
Click on school summary view
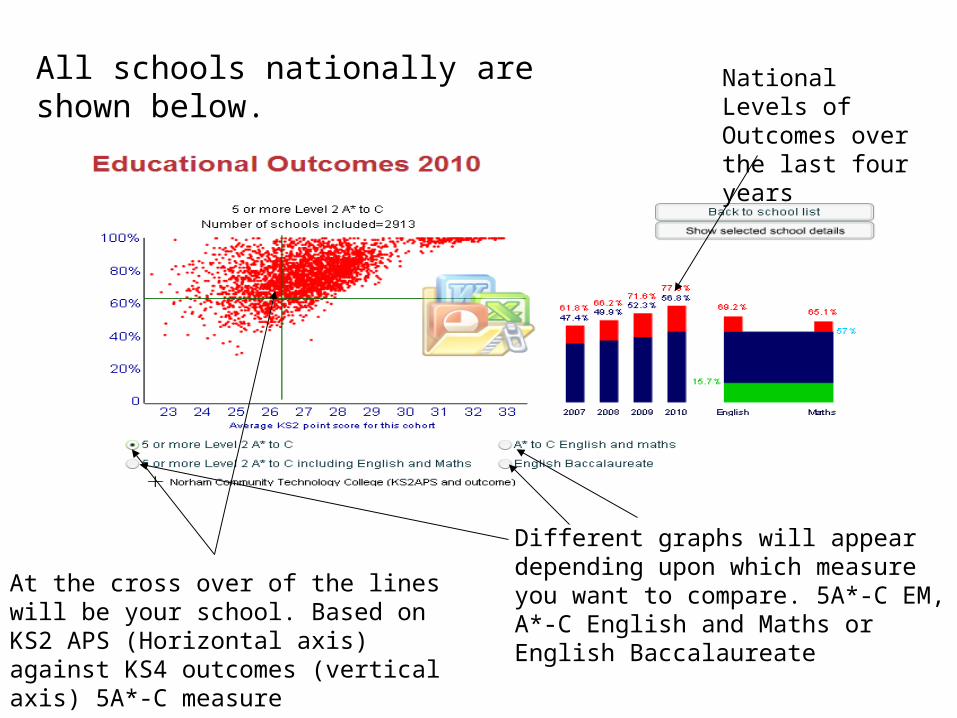
All schools nationally are shown below. National Levels of Outcomes over the last four years
At the cross over of the lines will be your school. Based on KS2 APS (Horizontal axis) against KS4 outcomes (vertical axis) 5A*-C measure
Different graphs will appear depending upon which measure you want to compare. 5A*-C EM, A*-C English and Maths or English Baccalaureate
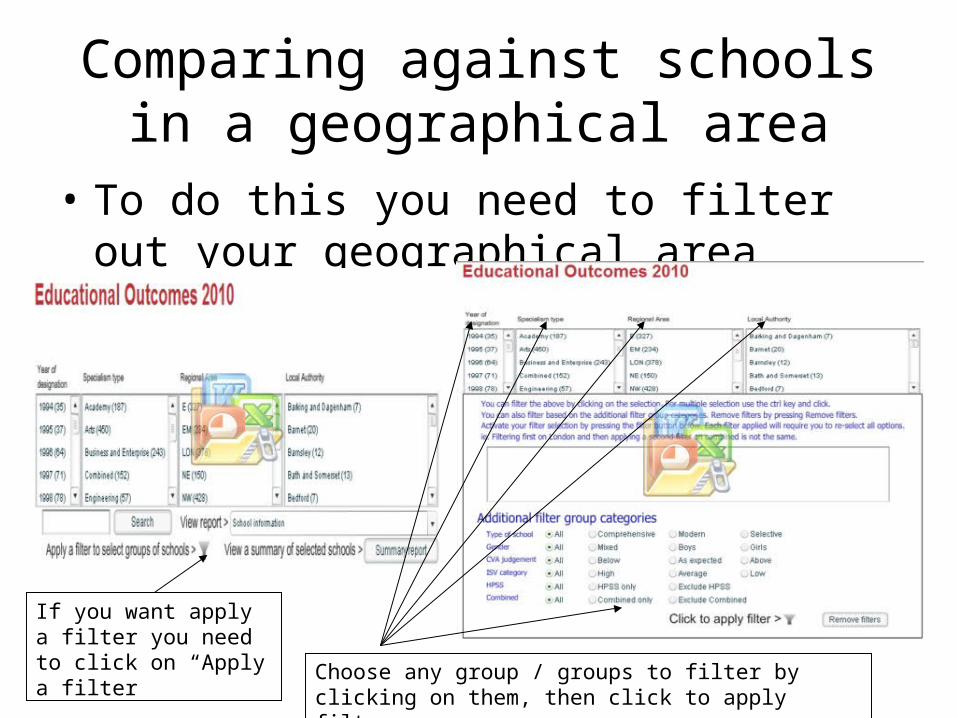
Comparing against schools in a geographical area
• To do this you need to filter out your geographical area
If you want apply a filter you need to click on “Apply a filter Choose any group / groups to filter by clicking on them,
then click to apply filter
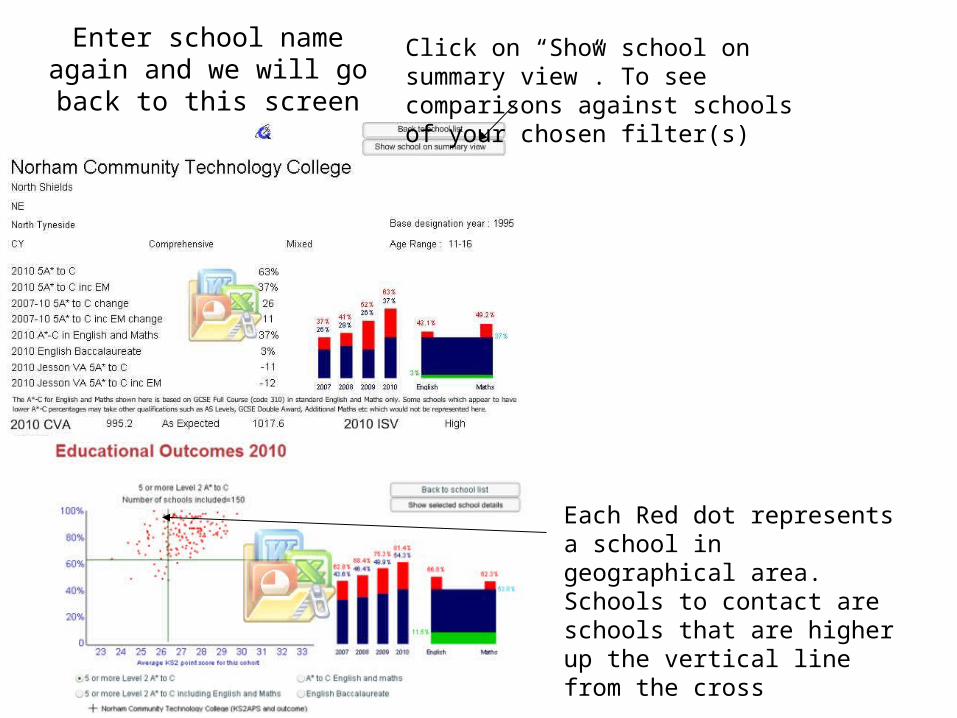
Enter school name again and we will go back to this
screen
Click on “Show school on summary view”. To see comparisons against schools of your chosen filter(s)
Each Red dot represents a school in geographical area. Schools to contact are schools that are higher up the vertical line from the cross
The graph changes against each measure
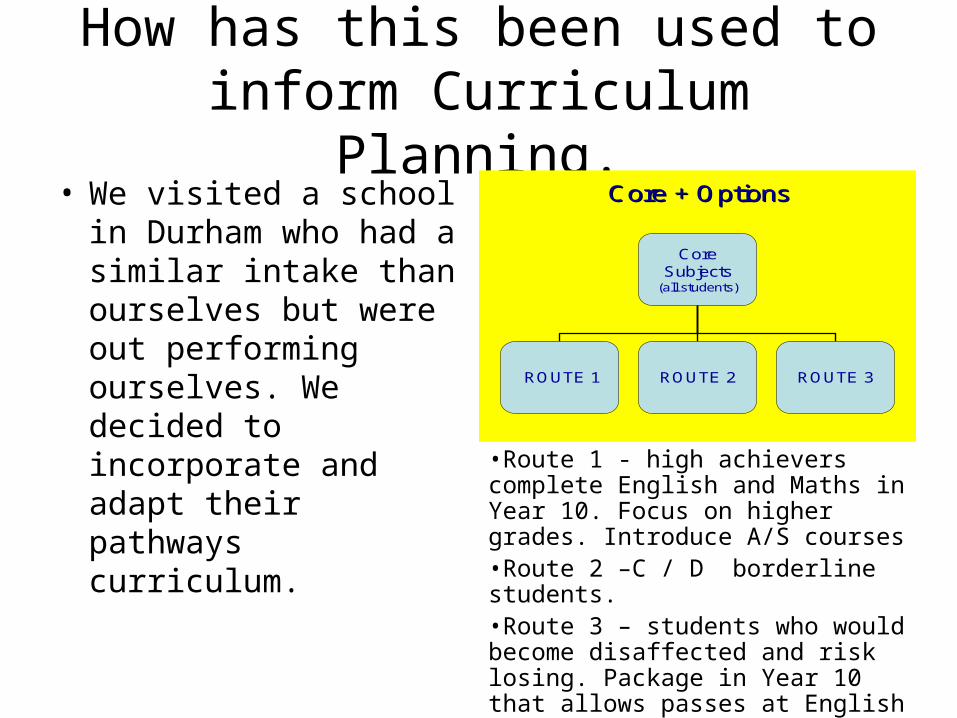
How has this been used to inform Curriculum Planning.
• We visited a school in Durham who had a similar intake than ourselves but were out performing ourselves. We decided to incorporate and adapt their pathways curriculum.
Core + OptionsCore + Options
Core Subjects
(all students)
ROUTE 1 ROUTE 2 ROUTE 3
•Route 1 - high achievers complete English and Maths in Year 10. Focus on higher grades. Introduce A/S courses•Route 2 –C / D borderline students.•Route 3 – students who would become disaffected and risk losing. Package in Year 10 that allows passes at English and Maths, as well as 2 days work placement
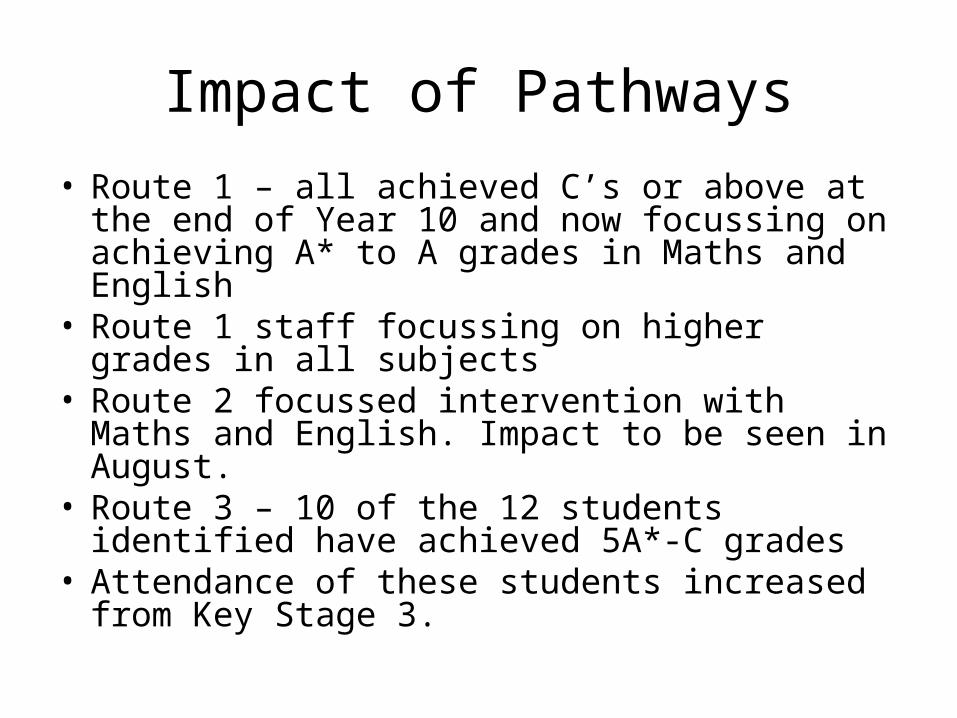
Impact of Pathways
• Route 1 – all achieved C’s or above at the end of Year 10 and now focussing on achieving A* to A grades in Maths and English
• Route 1 staff focussing on higher grades in all subjects
• Route 2 focussed intervention with Maths and English. Impact to be seen in August.
• Route 3 – 10 of the 12 students identified have achieved 5A*-C grades
• Attendance of these students increased from Key Stage 3.
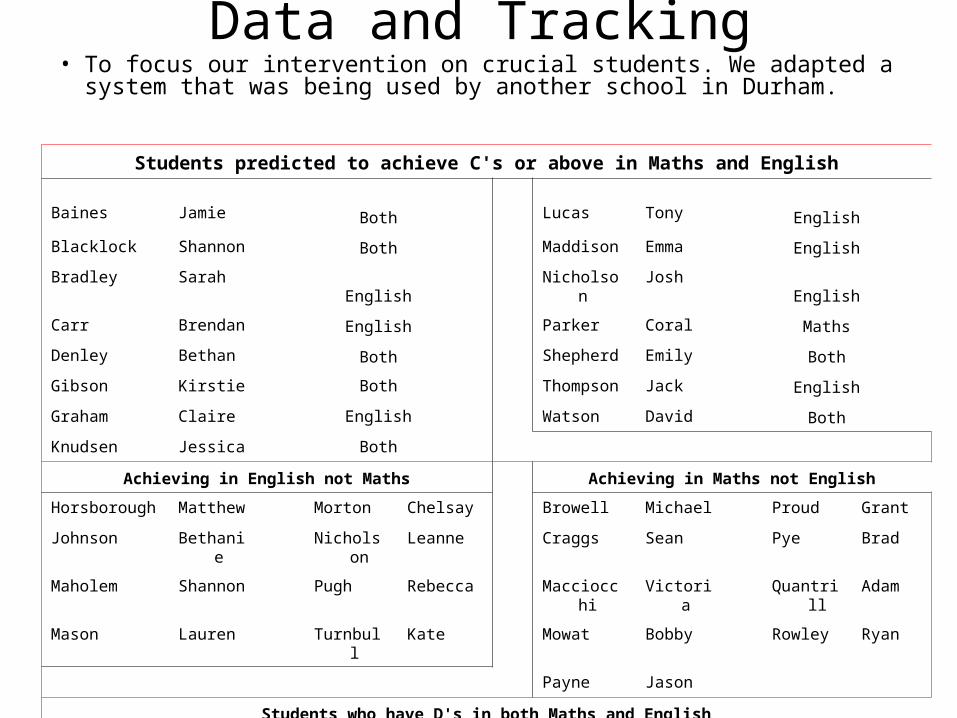
Data and Tracking
Students predicted to achieve C's or above in Maths and English
Baines Jamie Both Lucas Tony English
Blacklock Shannon Both Maddison Emma English
Bradley Sarah English Nicholson Josh English
Carr Brendan English Parker Coral Maths
Denley Bethan Both Shepherd Emily Both
Gibson Kirstie Both Thompson Jack English
Graham Claire English Watson David Both
Knudsen Jessica Both
Achieving in English not Maths Achieving in Maths not English
Horsborough Matthew Morton Chelsay Browell Michael Proud Grant
Johnson Bethanie Nicholson Leanne Craggs Sean Pye Brad
Maholem Shannon Pugh Rebecca Macciocchi Victoria Quantrill Adam
Mason Lauren Turnbull Kate Mowat Bobby Rowley Ryan
Payne Jason
Students who have D's in both Maths and English
Cherry Toni Duck Lauren Lowther Megan Whittle Jordan
Coltherd Kyle Gibbs Ross Watson Jaimee Willcocks Jack
• To focus our intervention on crucial students. We adapted a system that was being used by another school in Durham.
Impact of Data and Tracking
• Staff are fully aware of the crucial students to reach our EM
• All of the key students have SLT mentor
• Targeted intervention to meet the skills deficits of individual students
• Hope to see the benefits in the summer.
Subject Specific - Mathematics
• Maths department was not performing as highly as it should have in connection with predictions and estimates.
• Using Educational Outcomes a school in Sunderland was identified that performed highly with a similar intake
• Visits and discussions took place between the two departments
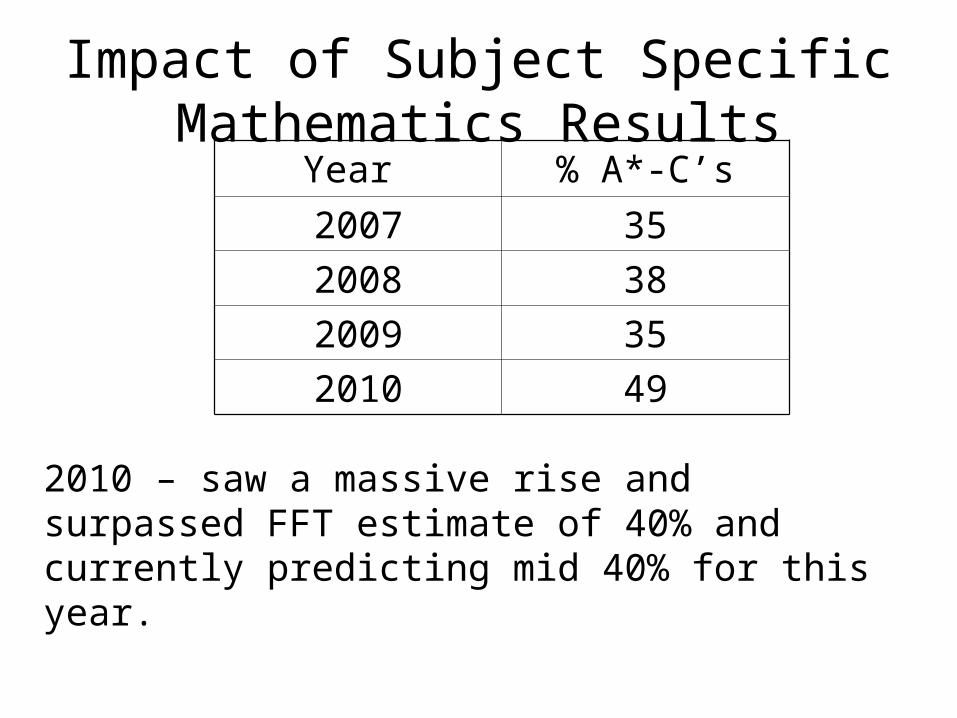
Impact of Subject SpecificMathematics Results
Year % A*-C’s
2007 35
2008 38
2009 35
2010 49
2010 – saw a massive rise and surpassed FFT estimate of 40% and currently predicting mid 40% for this year.