using fem in prediction of chip shape and cutting …advancesmst.prz.edu.pl/pdfy/02roud.pdf ·...
TRANSCRIPT
ADVANCES IN MANUFACTURING SCIENCE AND TECHNOLOGY Vol. 35, No. 3, 2011
Address: P. ROUD, M.Sc. Eng., J. SKLENIČKA, M.Sc. Eng., Department of Machining Technology, University of West Bohemia, Univerzitní 8, 306 14 Pilsen, e-mail: [email protected], e-mail: [email protected], P. KOŽMÍN, M.Sc. Eng., HOFMEISTER s.r.o., Mezi Ploty 12, 326 00, Pilsen, [email protected]
USING FEM IN PREDICTION OF CHIP SHAPE AND CUTTING FORCE WHEN DRILLING MATERIALS
WITH DIFFICULT MACHINABILITY
P. Roud, J. Sklenička, P. Kožmín
S u m m a r y
This paper is focused on using finite element method (FEM) in process of cutting tool design. In this paper the FEM is employed on solid twist drill design. Especially on selection of a point angle. Therefore two models of solid twist drill with different point angles were created using CAD software CATIA V5. These models were analyzed using commercially available FEM code AdvantEdge FEM. The main observed parameters were a chip shape and a magnitude of cutting forces. In order to evaluate a performance of real solid twist drill prototype experimental measurement has been conducted. The chips produced by real twist drill prototype were collected and cutting forces were measured by 4-component piezoelectric dynamometer KISTLER type 9272. These data were compared with results from numerical analysis in order to evaluate the accuracy of numerical analysis.
Keywords: FEM, twist drill
Zastosowanie metody FEM w modelowaniu kształtu wióra oraz siły skrawania w procesie wiercenia materiałów trudno skrawalnych
S t r e s z c z e n i e
W artykule przedstawiono wyniki modelowania numerycznego procesu projektowania narzędzi skrawających z zastosowaniem metody elementów skończonych FEM. Stosowano metodę obliczeń FEM w projektowaniu wiertła krętego. Wykonano obliczenia dla określonych wartości kąta wierzchołkowego. Wyznaczono do obliczeń dwa modele wiertła krętego o róŜnych wartościach kąta wierzchołkowego, uŜywając oprogramowania CAD CATIA V5. Przeprowadzono analizę modeli, przy zastosowaniu kodu FEM AdvantEgde. Głównymi parametrami procesu skrawania był kształt wióra oraz wartości siły skrawania. Przeprowadzono próbę wiercenia, ustalono wydajności wiertła w procesie skrawania. Dokonano oceny wiórów oraz przeprowadzono pomiar wartości siły skrawania z uŜyciem dynamometru piezoelektrycznego KISTLER 9272. Wyniki badań doświadczalnych były podstawą oceny jakości opracowanego modelu stosowanego w pozostałych obliczeniach.
Słowa kluczowe: FEM, wiertło kręte

20 P. Roud, J. Sklenička, P. Kožmín
1. Introduction
The technological and economical pressure in production engineering requires an optimization of existing processes [1]. In order to satisfy this requirement on development level it is necessary to obtain information about product performance before it’s produced. For this purpose the finite element method (FEM) can be used. This method has been successively used in automotive, aerospace and power industry, where the many types of analysis are required. Mainly structural analysis, thermo analysis, CFD analysis or more complex types of analysis like thermo-mechanical analysis.
The cutting process involves large strains, large strain rates and high temperature gradients between a cutting tool face and its free surface. Therefore the analysis of cutting processes is one of the most difficult from numerical point of view. The FEM was firstly used on cutting process analysis using custom FEM code for the 2D simulation. Lately the commercial FEM codes focused on machining application were used. The advantages of these types of software among custom FEM codes are that the user’s intervention is considerably lower and therefore it is possible to obtain results faster, which is important reason for cutting tool companies. The source [2] a [3] used Deform 2D for analysis of orthogonal cutting. The main analyzed parameters were chip formation, temperature field distribution and wear of cutting tool. However the source [2] reported difference between predicted and real value of wear. This was caused by inaccurate values of parameters used in the wear model. This implies to another important requirement for practical application of cutting tool analysis – the knowledge of correct values of parameters used in numerical models to satisfy the credibility of results obtained from simulation. It must be noted that due to the nature of cutting process it is necessary to use advanced material testing methods, which is very time and thus financial consuming. This is another advantage of commercial FEM codes focused on machining used nowdays. They commonly have implemented databases which describes the behavior of machined material under cutting conditions.
Today’s cutting tools have complex geometries and therefore it is necessary to use 3D simulation to provide proper analysis of cutting tool. The source [4-7] used commercial FEM code AdvantEdge FEM for numerical analysis of drilling titanium alloy Ti6Al4V with solid carbide twist drill. The predicted values of thrust force were different in 10-25% with comparison to experimental measured data especially at higher cutting speeds.
The same FEM code will be used in this study, which is focused on analysis of solid twist drill for drilling into AISI D3 tool steel, used for dies and molds. The structure of this paper is as follows. In the second section the brief description of solid twist drill is presented. In order to select appropriate point angle of solid twist drill, two models have been created using CAD software
Using FEM in prediction of chip shape ... 21
CATIA V5. In this section the model preparation for the purpose of analysis is also presented with boundary conditions description. The third section presents the results obtained from analysis. The main observed parameters were chip formation, cutting forces – torque Tc and thrust force FT. The fourth section presents the comparison between results from analysis and experimentally measured data. The result discussion is proposed also in this section. The conclusion of the paper are presented in the last section.
2. Description of solid twist drill geometry and boundary conditions of numerical analysis
2.1. Geometry of the twist drill
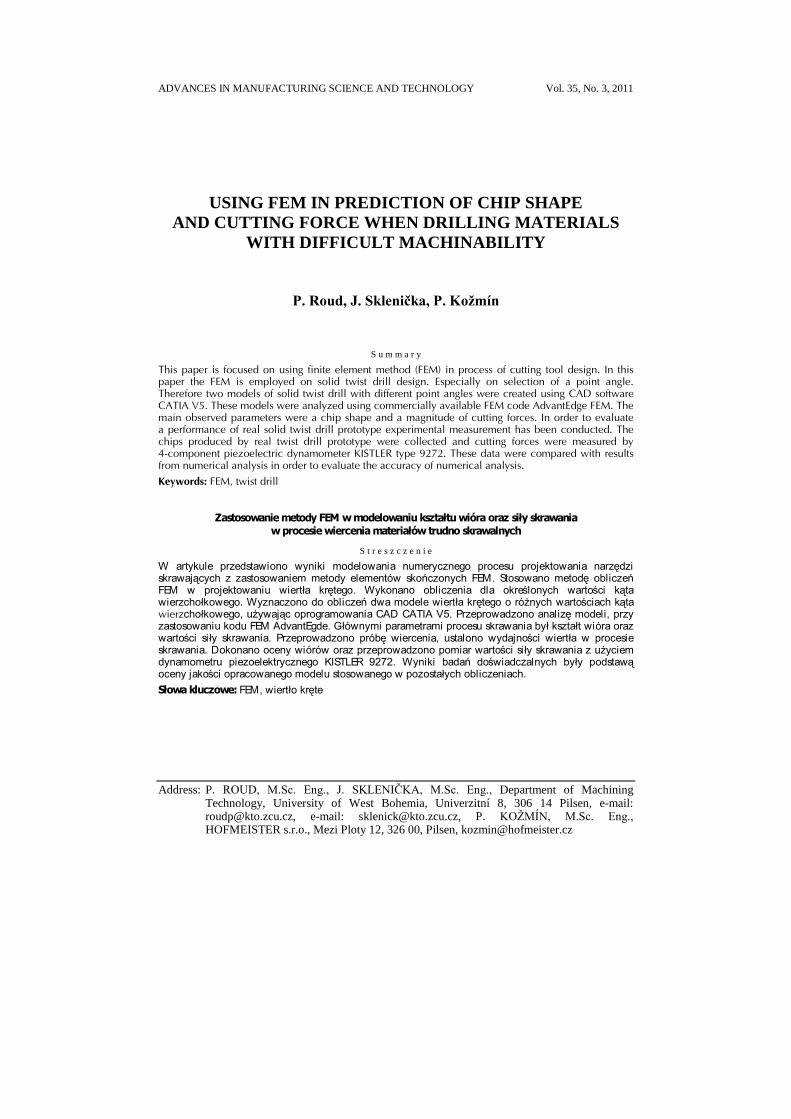
The twist drill geometry is presented in the Fig. 1. The authors are not allowed to present the exact values of all parameters of twist drill geometry, because of manufacturer of twist drill prototype. Therefore only the intervals of most geometrical parameters will be presented. The twist drill has a standard single point tip. The chisel edge is thinned on <0,5-1mm> in order to decrease the rubbing action of drill due to very low cutting speed and highly negative rake angle in this area. The drill is designed for operating at dry cutting conditions. This type of cutting condition is favorable because of lower costs of the process. The nature of drill’s flute secures chip removing from the hole, which is essential in drilling mainly due to resulting constant cutting forces during the process, which helps to overcome premature drill wear or decreasing the hole accuracy. It must be noted that this property goes in conjunction with appropriate chip formation. The helix angle of the flute ranges from <5-15°>. For better support when the tool moves within the hole it has six facets. The diameter of the twist drill is 12 mm.
Fig. 1. Model of solid twist drill

22 P. Roud, J. Sklenička, P. Kožmín
In order to select appropriate twist drill geometry, two types of models have been created using CAD software CATIA V5. These models have same helix angle but differs in point angle. The parameters of both models are presented in Table 1.
Table 1. Geometrical parameters of analyzed models
Parameters Geometry A Geometry B
Helix angle, deg Same Same Point angle, deg 130 140
2.2. CAD model preparation
In order to decrease the computational resources required for numerical analysis, the entire model of the twist drill was cleaned up from unnecessary features. In other words the length of the twist drill was decreased from 100 mm to 10 mm. The computational model of the twist drill is shown in Fig. 2. In order to satisfy maximum correlation between results from analysis and experiments the custom model of the workpiece was created also. It was cylinder with diameter of 20 mm to suppress the edge effect. The thickness of remained material under the tip was 3 mm to achieve appropriate stiffness. The bottom of predrilled hole consists of two opposite helical surfaces. This shape of bottom was created using advanced modeling techniques. This set up was imported in to AdvantEdge FEM v 5.4 environment for further analysis.
Fig. 2. Computational model of the twist drill and the workpiece
2.3. Set up of boundary condition
In the AdvantEdge FEM v 5.4 environment were set up the boundary conditions for the analysis. The boundary conditions are summarized in Table 2.
Twist drill
Workpiece
Bottom of pre-drilled hole
φ 20 3

Using FEM in prediction of chip shape ... 23
It must be noted that mesh settings were redefined only for the workpiece, other parameters remained unchanged.
Table 2. Boundary conditions for analysis
Workpiece material AISI D3 (53HRC) Twist drill material Sintered carbide
Cutting speed vc, m/min 25 Feed, mm/rev 0.08
Cutting environment Dry
3. Results from numerical analysis
3.1. Chip shape comparison
In the Fig. 3 and 4 the temperature field distribution of both chips produced by geometry A, geometry B respectively are shown. The temperature over the chips varies from 300 to 500°C and is the same for both geometries. This is with agreement with the theory and can be explained by the same value of helix angle of both geometries, because the helix angle determines the face angle of drill.
Fig. 3. Chip produced by geometry A

24 P. Roud, J. Sklenička, P. Kožmín
Fig. 4 Chip produced by geometry B
Fig. 5. Influence of temperature on hardness of workpiece material with respect to different tempering temperatures
However what is more surprising is that the difference of 10° in point angle between geometry A and B did not change the shape of produced chip significantly. The explanation of this observation can be found in mechanical properties of workpiece material. In the Fig. 5 is shown the graph, where the influence of temperature on hardness of workpiece material for different tempering temperatures is shown. From the graph it is obvious that until 500°C the hardness of material decreases continuously. In the same manner the strength of material will decreased also. In other words the mechanical properties of material doesn’t change significantly. If we take into account the temperatures in chip from Fig. 3 and 4 respectively we can make a conclusion that AISI D3 tool steel is less sensitive for appropriate point angle selection. Or in other words, the difference of 10° in point angle did not change the chip shape significantly due to the mechanical properties of machined material.
Using FEM in prediction of chip shape ... 25
3.2. Cutting forces comparison
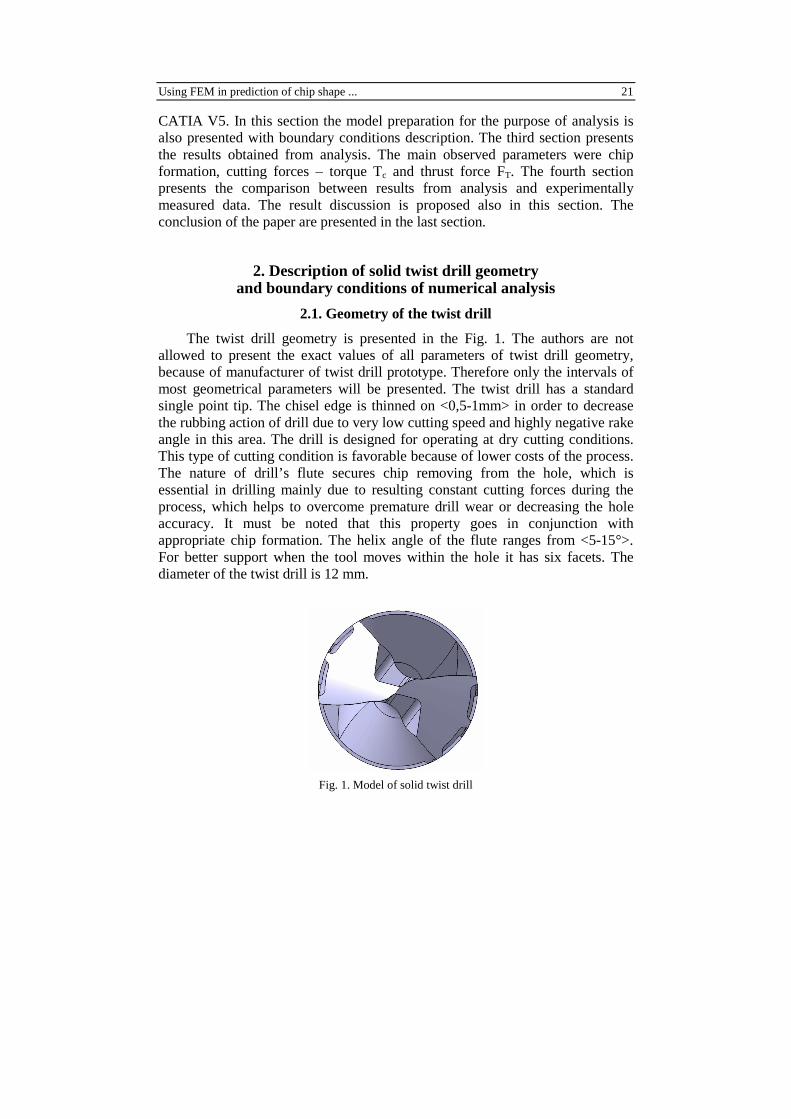
In the Fig. 6 the comparison of thrust force between geometry A and geometry B is provided. It is obvious that both geometries generated the same magnitude of thrust force. This is also surprising if we take into account that difference in point angle between geometry A and geometry B is 10°. This can be explained by the same helix angle and it leads to conclusion that in this type of workpiece material the helix angle has influence on magnitude of thrust force while the difference of 10° in point angle has no significant influence on the magnitude of thrust force.
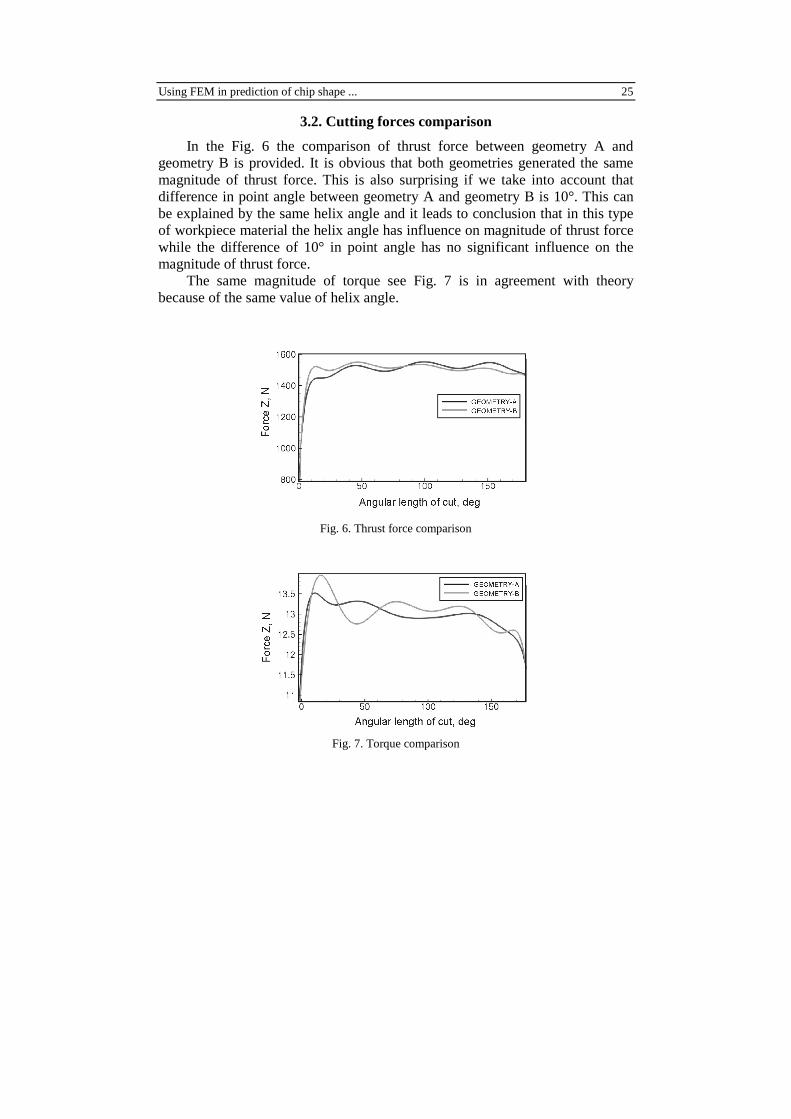
The same magnitude of torque see Fig. 7 is in agreement with theory because of the same value of helix angle.
Fig. 6. Thrust force comparison
Fig. 7. Torque comparison

26 P. Roud, J. Sklenička, P. Kožmín
The same magnitudes of thrust force and torque provide also support to the results obtained by analysis of chip shape and temperature field distribution presented in section 3.1.
Based upon results from numerical analysis the geometry B was selected because of better loading of solid carbide. This type of geometry has been manufactured in the company HOFMEISTER s.r.o.
4. Comparison between results from numerical analysis and experimental measured data
4.1. Test method
In order to evaluate the accuracy of predicted parameters described in previous section the experimental measurement were conducted. The test were carried out on vertical milling center MCV 750 A with continuous variation of spindle speed. The workpiece material was cylinder with diameter of 20 mm and length of 36 mm. The shape of produced chip was compared by visual observation while the torque and thrust force were measured using 4 component dynamometer KISTLER type 9272. The data were post processed using LabView 8.1 and Matlab software. The twist drill were clamped in hydroplastic tool holder Güehring. The cutting conditions were the same as in numerical analysis.
4.2. Chip shape comparison
In the Fig. 8 and 9 respectively the comparison between predicted and real chip shape is provided. It is obvious that both chips are almost identical. The difference was found in curls on outer part of chip produced by real prototype. However from the cutting tool design point of view can be this inaccuracy overlooked, because more important is segmented shape of chip. This can lead to conclusion that AdvantEdge FEM software can be used for the prediction of chip formation.

Using FEM in prediction of chip shape ... 27
Fig. 8. Chip shape predicted by numerical analysis
Fig. 9. Chip shape produced by real prototype
4.3. Cutting force comparison
In the Fig. 10 and 11 the comparison between predicted magnitudes of both thrust force and torque are presented. The predicted value of thrust force was FT-PRED = 1600 N, while the measured one was about FT-MEAS = 2600 N.

28 P. Roud, J. Sklenička, P. Kožmín
Fig. 10. Thrust force comparison
Fig. 11. Torque comparison
This is means the software underestimates the value of predicted thrust force and the difference is almost 40%. When we compared the values of torque we figured out that the software overestimates the value of torque. The predicted value was TC-PRED = 14 Nm and the measured one was TC-MEAS = 11 Nm which is the difference of 22%.
The reason in difference of errors between thrust force and torque can be explained by two factors. The first factor is difference in hardness between workpiece material in numerical simulation (53 HRC) and real workpiece material (56±2 HRC) caused by the nature of heat treatment process.
Therefore the real workpiece material exhibits higher resistance against drill engagement, which tends the thrust force to increase. The second factor is different temperatures in primary cutting zone and tertiary cutting zone see Fig. 12.

Using FEM in prediction of chip shape ... 29
Fig. 12. Temperature field distribution in cutting zones
In primary cutting zone, where is the tangential component of cutting force which generates the torque are generally higher temperatures than in tertiary cutting zone. Due to higher temperatures, the material of the workpiece tends to softening more rapidly. As a consequence the difference in hardness between real workpiece and the one in numerical analysis can be reduced.
5. Conclusion
This paper presents the using of FEM element method in design of solid twist drill geometry. In order to select appropriate twist drill geometry the two models of solid twist drill were created. These models were different in point angle while the helix angle was the same. For the analysis of twist drill geometry the commercially available FEM code AdvantEdge FEM was used. Based upon results from analysis the geometry with larger point angle was manufactured and experimentally tested in order to evaluate the accuracy of numerical analysis. The main observed parameters were chip shape and cutting forces. The main conclusion of this paper can be summarized as follows:
• The difference in point angle of 10° does not influence the chip shape and magnitude of cutting forces when drilling AISI D3 tool steel.
• The AdvantEdge FEM software can be used for chip shape prediction because the differences between real and predicted chip are insignificant.
• The difference between magnitudes of predicted thrust force and experimentally measured one was 40% and the software underestimates the magnitude of predicted thrust forces.
• The difference between magnitudes of predicted torque and experimentally measured one was 22% and the software overestimates the magnitude of predicted thrust forces.
• The difference in errors of predicted values can be explained by the higher temperature in primary cutting zone which reduces the difference in hardness between real workpiece and the one used in numerical analysis.

30 P. Roud, J. Sklenička, P. Kožmín
This report is based upon results of development project MPO FI-IM4/226 supported by the Ministry of Industry and Trade of the Czech Republic.
References
[1] F. KLOCKE, T. BECK, S. HOPPE, T. KRIEG, N. MÜLLER, T. NOTHE, H.W. RAEH, K. SWEENY: Examples of FEM in manufacturing technology. Journal of Materials Processing Technology, 120(2002), 450-457.
[2] E. CERRETI, M. FALLBÖHMER, W.T. WU, T. ALTAN: Application of 2D FEM in orthogonal metal cutting. Journal of Materials Processing Technology, 59(1996), 169-180.
[3] Z. LIANGCHI: On the separation criteria in simulation of orthogonal metal cutting using finite element method. Journal of Materials Processing Technology, 89-90(1999), 273-278.
[4] A. SHIH, R. LI: Finite element modeling of high throughput drilling of Ti6Al4V. Transaction of NAMRI/SME, 35(2007), 73-80.
[5] J. KIM, V.M. MARINOV, D. KIM: Built -up edge analysis of orthogonal cutting by visco-plastic finite element method. Journal of Materials Processing Technology, 71(1997), 367-372.
[6] T.D. MARUSICH, S. USUI, J. MA, D.A. STEPHENSON: Finite element modeling of drilling procesess with solid and indexable tooling in metal and stack-ups, www.thirdwavesys.com.
[7] A. SHIH, R. LI: Finite element modeling of 3D turning of titanium. Inter. Journal of Advanced Manufacturing Technology, 29(2006), 253-261.
Received in February 2011