using field campaigns results to reduce uncertainties in inventories wenche aas, knut breivik and...
TRANSCRIPT

Using field campaigns results to reduce uncertainties in inventories
Wenche Aas, Knut Breivik and Karl Espen Yttri
And material from:Eiko Nemitz (CEH, UK)Svetlana Tsyro and David Simpson (EMEP MSC-W)

Use ambient air measurements to improve emission inventories ?
• Carbonaceous mattero Very uncertain emissions from wood combustion and
biomass burningo Regular EC/OC measurements don’t distinguish between
natural / anthropogenic and primary /secondary
• Heavymetalso Emissions too low to give model results comparable to
measurementsCase study (to be discussed by MSC-E)
• POPso Measurements not always available in time and space to
directly assess present emissions. I.e. on historical emissions and sea /water exchange (diffusion processes)
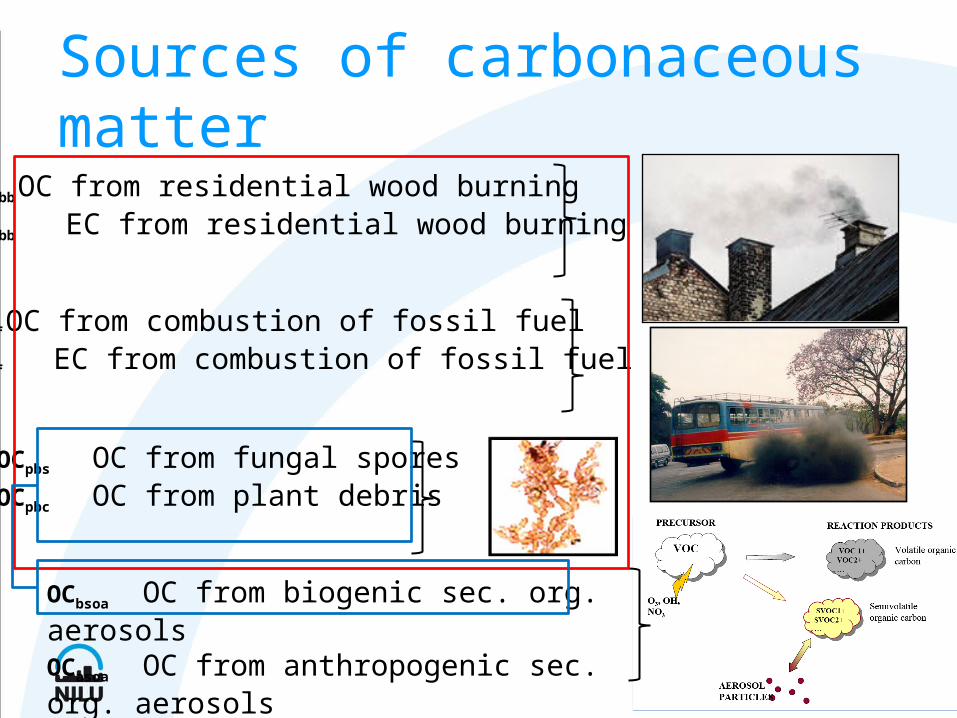
OCbsoa OC from biogenic sec. org. aerosolsOCasoa OC from anthropogenic sec. org. aerosols
OCbb OC from residential wood burningECbb EC from residential wood burning
OCff OC from combustion of fossil fuelECff EC from combustion of fossil fuel
OCpbs OC from fungal sporesOCpbc OC from plant debris
Sources of carbonaceous matter

9 participating sites, situated in C, E, S, NW Europe.
EMEP intensives 2008/2009 Carbonaceous matter
•14C–analysis delayed, ready in a month or so
• EC/OC and levoglucosan analysis are ready
• To be published in ACP Special issue in a few months
Site
Thermal-optical analysis
Levoglucosan analysis
14C-analysis
S. 08 F. 09 S. 08 F. 09 S. 08 F. 09 Birkenes (NO) X X X X X Ispra (IT) X X X X X Kocetice (CZ) X X X X X X K-puszta (HU) X X X X Lille Valby (DK) X X X X X X Melpitz (DE) X X X X X X Montelibretti (IT) X X X X Mace Head (IE) X X X X X Payerne (CH) X X X X X X
•17 Sep – 16 Oct 2008• 25 Feb – 26 Mar 2009

Results OCp and Levoglucosan
•OCp = particulate OC. Front – backup filter, conservative OC estimate
•OC wood from levoglucosan analysis
•increasing concentrations along a Southern and Eastern transect.

4 sites in Northern Europe subject to extended sampling and chemical analysis the summer 2009 (SONORA project)
EMEP Intensives – cont.
Analyis of following tracers:•Levoglucosan: wood burning•Sugars/ sugar alcohol: fungal spores (PBAP)•Cellulose: Plant debris (PBAP)•14C analysis: modern and fossil carbon
+•Pinic acid: Biogenic VOC•Organosulphates/nitrates: Biogenic VOC(these are not used quantitatively but foridentification of sources
Results to be presented in ACP special issue in a few months

SORGA- Measurements sites
Oslo (Urban background) Hurdal (Rural Background)
Oslo
Hurdal
Measurement campaignsSummer period: 19 June - 5 July 2006Winter period: 1 - 8 Mars 2007

Results from SORGA project (2006 and2007) Source apportionment of TCp in PM10 in Hurdal (NO)
TCp = 2.9 ± 1.2 µg C m-3 Natural: 72% Anthropogenic: 28%
TCp = 1.2 ± 0.5 µg C m-3
summer
Natural: 8% Anthropogenic: 92%
winter

Improvements in modelling of SOA• VBS (volatility basis set) approach used for the first time
Ref:David Simpson, MSC-W
Improved modeling may give better emissioninventories

From EC/OC campaign 2002-2003
From S. Tsyro, Dublin TFMM/TFEIP 2007
In winter, indication of overestimation of wood burning in N. Europe and underestimation in C/S Europe

Uncertainties in OC measurements: Estimates of the positive artefact of OC in PM10 and PM2.5/PM1 -June 2006 (OBQ approach)
0
10
20
30
40
50
60
70
NO56 IT01 NO01
Po
siti
ve a
rtef
act
OC
p/O
C (
%)
PM10
PM2.5 or PM1
Difficult to use OC data without assessing the artefacts (i.e OC vs OC particulate)

65
60
55
50
45
40
35
3020100-10
May 2008 Sep/Oct 2008 Feb/Mar 2009
High resolution measurements from EUCAARI (EU FP 7 project)
•Hourly data using AMS instrument
•Part of EMEP intensive 2008/2009
From E. Nemitz, Paris, TFMM, 2009

40
20
0
21/09/2008 26/09/2008 01/10/2008 06/10/2008 11/10/2008 16/10/2008
20
0
4020
0
6420
40
20
0
Aer
osol
Con
cent
ratio
n [
g m
-3]
10
5
0
40
20
0
10
5
0
5
0
10
5
0
Vavihill (Sweden)
Bush (Scotland)
Harwell (England)
Hyytiala (Finland)
Puijo (Finland)
Melpitz (Germany)
Mace Head (Ireland)
K-Puszta (Hungary)
Puy de Dome (France)
Payerne (Switzerland)
Org
SO42-
NH4+
NO3-
Cl-
Concentrations Sep/Oct 2008
From E. Nemitz, Paris, TFMM, 2009

Identification of Organic Aerosol Classes by Positive Matrix Factorisation (PMF)
0.20
0.15
0.10
0.05
0.00
Nitr
ate
Equ
ival
ent M
ass
Con
cent
ratio
n (µ
g m
-3)
140120100806040
12
10
8
6
4
2
0Ma
ss C
on
cen
tra
tion
(µ
g m
-3)
09/06/2003 11/06/2003 13/06/2003 15/06/2003 17/06/2003 19/06/2003
Total Organics HOA OOA I OOA II
10
8
6
4
2
0
16012080400m/z
16
12
8
4
0% o
f Tot
al S
igna
l
40
30
20
10
0
Diesel aerosol
Remote oxidised aerosol
B. SOA from -humulene
10
8
6
4
2
0
16012080400m/z
16
12
8
4
0% o
f Tot
al S
igna
l
12
10
8
6
4
2
0
Hydrocarbon-like organic aerosol: HOA
Highly oxidised aerosol: OOA I
Less oxidised organic aerosol: OOA IIA.
From E. Nemitz, Paris, TFMM, 2009

POP measurements to use for emission inventories• Difficult to use measurement data alone to
assess quality of emission• Limited number of measurements, both spatially
and temporally• Large uncertainty in the measurements• Difficult to seperate primary from secondary
emissions
Necessary to use a model/measurement combination

EMEP POP passive campaign (2006)
S7PCBs (pg/m3) S3HCHs (pg/m3)
S4DDTs(pg/m3)
S4chlordanes (pg/m3)
S8PAHs (ng/m3)
HCB (pg/m3)
Figure 3c) Figure 3d)
Figure 3e) Figure 3f)
Figure 3a) Figure 3b)
Ref: Halse AK, Schlabach M, Eckhardt S, Sweetman A, Jones KC, Breivik K. (2010). Spatial variability of POPs at European background
air monitoring sites. In prep. for ACP EMEP Special issue:

Comparability between passive and high volume measurements
a)
0
10
20
30
40
50
60
Košetice (CZ)
Råø (S) Birkenes (N)
Aspvreten (S)
Stòrhöfdi (IS)
Pallas (SF) Spitsbergen (N)
pg/m
3
-HCH
PAS
AAS
b)
c) d)
e)
0
20
40
60
80
100
120
Košetice (CZ) Birkenes (N) Stòrhöfdi (IS) Spitsbergen (N)
pg/m
3
HCB
PAS
Hivol
f)
1
10
100
Košetice (CZ)
Råø (S) Birkenes (N)
Aspvreten (S)
Stòrhöfdi (IS)
Pallas (SF) Spitsbergen (N)
pg/m
3
g-HCH
PAS
AAS
05
1015202530354045
Košetice (CZ) (n=7)
Råø (S) (n=7)
Birkenes (N) (n=7)
Aspvreten (S) n(=7)
Stòrhöfdi (IS) (n=7)
Pallas (SF) (n=6)
Spitsbergen (N) (n=3)
pg/m
3
SnPCBsPAS
AAS
1
10
100
1000
Košetice (CZ) (n=3)
Råø (S) (n=3) Aspvreten (S) (n=1)
pg/m
3
SnDDTs
PAS
AAS
Bias depends on :• Component (particulate or gaseous)• Site (meteorological difference) • Laboratory performance (NILU (campaign) vs national
Ref: Halse AK, Schlabach M, Eckhardt S, Sweetman A, Jones KC, Breivik K. (2010). Spatial variability of POPs at European background
air monitoring sites. In prep. for ACP EMEP Special issue:

Predicted (Flexpart model)versus observed (PAS) air concentrations for PCB-28
Birkenes
0
2
4
6
8
10
12
14
16
0 2 4 6 8 10 12 14 16
Mod
el
Measured (PAS)
Košetice
Longobucco
Spitsbergen
Borovye
Els TormsViznar
Birkenes
Figure 4
Measured (PAS)
Mod
el
Systematic bias may indicate that emission data are too high for PCB-28
Ref: Halse AK, Schlabach M, Eckhardt S, Sweetman A, Jones KC, Breivik K. (2010). Spatial variability of POPs at European background
air monitoring sites. In prep. for ACP EMEP Special issue:

The power of high resolution data to assess emission sources
Ref: Eckhardt et al. (2007)PCB peaks in the Arctic, Atmos. Chem. Phys., 7, 4527-4536.
PCB episodes at Zeppelin Svalbard:Agricultural waste burning in Eastern Europe in spring 2006 Forest fire in North America in July 2004Used for calculating emission factors for the most important PCB congeners

EMEP (intensive) data can be used for identification and quantification of sources, to some extent
A necessity and much more powerful if model and measurements are used in combination to evaluate emission estimates
The combined effort of 14C, TOA, and organic tracer analysis is a powerful tool to explore various sources of carbonaceous matter
Uncertainty in measurements methods etc may hamper the comparability of results
o Need for reference methods and/or centralized laboratories for advanced measurements
Summary