using health it to improve outcomes in vulnerable · pdf filea national web conference on...
TRANSCRIPT

A National Web Conference on Using Health IT to Improve Outcomes in Vulnerable and
Disadvantaged Populations
June 3, 2013 1:30pm – 3:00pm ET

Moderator and Presenters Disclosures
Moderator: Angela Nunley, M.S.Ed.
Agency for Healthcare Research and Quality
Presenters: Margaret Handley, Ph.D., M.P.H. Melissa Stockwell, M.D., M.P.H.
James Rimmer, Ph.D., M.S.
There are no financial, personal, or professional conflicts of interest to disclose for the speakers or myself.

Health IT-Enabled Telephone Counseling for Diabetes Self-Management Support
in Diverse Populations
Margaret Handley, Ph.D., M.P.H. University of California San Francisco
Center for Vulnerable Populations

Objectives
▪ Characterize the importance of health literacy as well as recent trends related to digital divide and their implications for health IT.
▪ Present diabetes self-management health IT intervention and its real-world implementation in diverse safety net setting(s).

Limited Health Literacy (LHL)
▪ Health literacy: ability to read, comprehend, and act on written and numerical information received in health care settings
▪ Impact of limited health literacy on health outcomes: – Poorer knowledge of chronic conditions – Worse self-care – Higher utilization of services – Worse health outcomes
▪ Poor glycemic control
Schillinger, 2002; Scott, 2002; Williams, 1998; Baker, 2003; IOM, 2004

LHL Associated with Poor Communication with Clinicians
Schillinger PEC, 2004

What is a Digital Divide?
The digital divide refers to differences across demographic groups in access to and use of information technology, particularly computers and the Internet.

What type of digital divide do we have?
http://pewinternet.org/Reports/2012/Digital-differences.asp

Recent Shifts
▪ 2011 Population Survey—Pew Internet Project Internet broadband use in low-income and immigrant populations is up since 2008. – Differences (US born and non-US born region)
▪ Safety Net Study (San Francisco, n=408) Majority of primary care patients currently use email, text messaging, and Internet—71% want to use these tools for communication with their providers; many don’t have access.
Schickedanz et al., 2013. Pew Internet and American Life Project. www.ppic.org Closing the Digital Divide: Latinos and Technology Adoption.

Cell Phone Increases Among Latinos
Latinos and cell phones – Similar to blacks
and whites for smartphone ownership
– Latino Internet users more likely than white internet users to say they go online using a mobile device—76% versus 60%

Telephones and Self-Management Support
▪ Self-management support improves behaviors, satisfaction, and outcomes
▪ Desired by patients with LHL and limited English proficiency*
▪ Automated telephone self-management support (ATSM)
– 97% of adults in CA have phone – Relatively inexpensive and efficient – Control jargon, volume, pace, and language – Effective in diverse, low-income patients
*Sarkar, 2008

ATSM and Improving Diabetes Efforts Across Language and Literacy
▪ Developed with users ▪ Preferred language ▪ Weekly surveillance ▪ Touch-tone response ▪ Tailored education
▪ Language-concordant care managers respond to out-of-range triggers
▪ Notify clinics

Intervention: ATSM + Health Coach
▪ 27-39 weeks of ATSM calls ▪ Health coach or nurse for follow-up calls
– Tailored training and scripts

Health IT Can Promote Patient-Centered Diabetes Care (IDEALL)
▪ Randomized trial: ATSM, group visits, and usual care
▪ 339 patients with poorly controlled DM – 43% Spanish- and 11% Cantonese-speaking
▪ 94% completed ≥1 call 84% ≥1 action plan
▪ High PCP satisfaction – Perceived activated patients and higher quality
of care – Overcoming barriers to LEP and medication
management Schillinger, 2009

IDEALL Implementation Process
1. Identify priority population/condition and objectives 2. Harness registry and network to identify population 3. Develop queries to solicit questions and concerns 4. Write and revise health education (cooperative process) 5. Pilot questions and health education responses with patients 6. Translate and adapt toward cultural appropriateness 7. Record and code 8. Design callback algorithm (scenarios) and trigger reports 9. Beta-test 10. Train clinical staff 11. Launch

Qualitative Themes Awareness “ I became more aware of what I put in my system and that I need to do something greater than what I’ve been doing to lose more weight… (ATSM narratives) talked about a woman who lost weight… I liked that… I could walk in those shoes.”
Self-efficacy “I had already made a moral promise that this week I would give 100%, that I would exercise and get sweaty, and I did it.”
Empowerment “It elevated my self-esteem so that I could ‘get fired up’ and really respond because it was up to me to gain control of my diabetes. In other words, one needs to do their part.”
Kim, 2009

IDEALL Program Outcomes
▪ + Interpersonal communication with providers ▪ + Self-management behaviors (diet, exercise) ▪ + Functional status, fewer days confined to bed ▪ Primary care physicians very favorably disposed ▪ Participation rates were high across all levels and
preferentially attracted Spanish-language speakers, uninsured, and Medicaid recipients
▪ Higher engagement among those with limited English proficiency and limited health literacy
Schillinger, 2009; Handley, 2008; Sarkar, 2008

SMART Steps: Partnering to Put Research Into Practice
▪ San Francisco Health Plan (SFHP): nonprofit government-sponsored Medicaid managed-care plan – Linguistically diverse vulnerable population – SFHP recruitment for members from four clinics – SFHP implementation but electronic exchange
with UCSF and clinic-based medical records – Evaluation by UCSF

Implementation of a Quasi-Experimental Study Design
▪ SFHP did not want control group; staggering better for staffing ▪ Wait list with 6-month crossover; recruiting in waves ▪ Real-world implementation: data integration, in-house coaches
Handley, 2011; Ratanawongsa et al., 2012

Participants With 6-Month Follow-up (n=249)
Characteristic Intervention (n=125) Wait-List (n=124) Age in years, mean (SD) 56.6 (7.9) 54.9 (8.6) Women 77% 72% Latino Black / African-American Asian / Pacific Islander White / Caucasian
26% 6%
60% 6%
20% 10% 62%
7% Born Outside the U.S. 86% 85% Cantonese-speaking Spanish-speaking
54% 20%
55% 19%
8th grade education or less 39% 47% Limited health literacy 47% 40% Income ≤ $20,000 / Yr 61% 60% Hgb A1c >8.0% 30% 24%


Change in Quality of Life at 6 Months
Adjusted* Difference
(95% CI)
Standardized Effect Size* p-value
Physical Component SF-12
2.0 (0.1,3.9) 0.25 0.04
Mental Component SF-12
1.3 (-1.0,3.6) 0.14 0.26
*Controlling for baseline value; effects greater for Spanish speakers
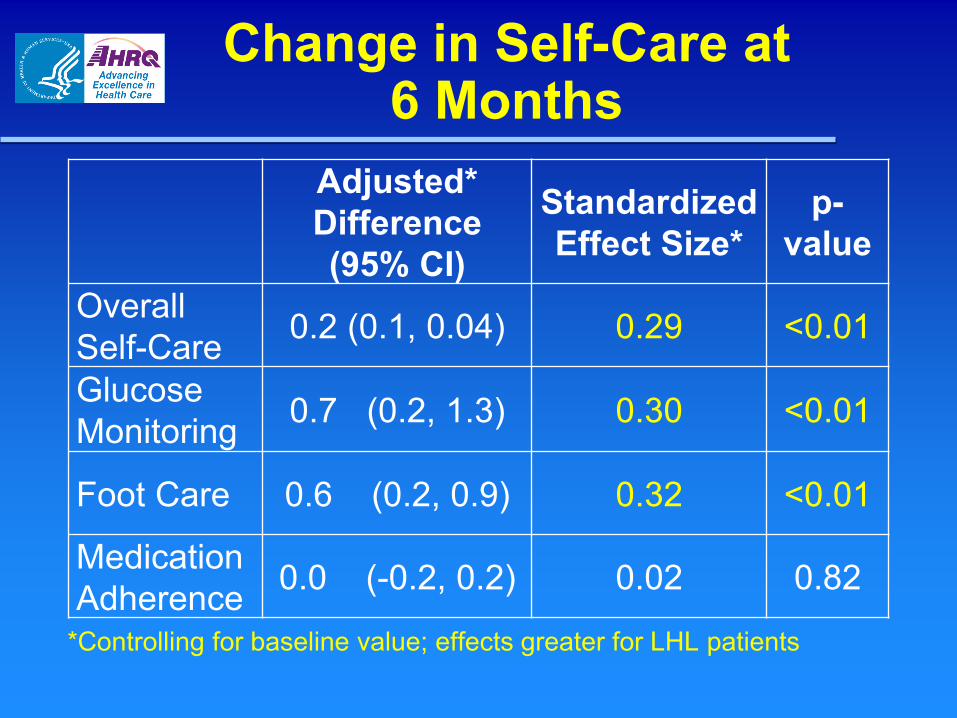
Change in Self-Care at 6 Months
Adjusted* Difference (95% CI)
Standardized Effect Size*
p-value
Overall Self-Care 0.2 (0.1, 0.04) 0.29 <0.01
Glucose Monitoring 0.7 (0.2, 1.3) 0.30 <0.01
Foot Care 0.6 (0.2, 0.9) 0.32 <0.01
Medication Adherence 0.0 (-0.2, 0.2) 0.02 0.82
*Controlling for baseline value; effects greater for LHL patients

Implementation/Fidelity Outcomes
▪ Health system integration fidelity was high for electronic exchanges, identification of eligible patients, reporting on call-level responses
▪ Coaching callbacks generally delivered per protocol (based on check-off reports) with some variation by topic of ATSM/medication triggers, and by language
Handley et al., (in preparation)

Successful Implementation Strategies
▪ Partnering with LHL / LEP patients: – Bicultural and bilingual content – Unmet need for language-concordant support
▪ Practice-based research: – Innovate and create from within – Invest in the safety net providers – Partnership with Medicaid managed care plan – Population-based implementation – Long-term relationships

New Directions
▪ Scope: develop new content for health promotion across health conditions, postpartum women with past gestational diabetes—prevention
▪ Platform: mHealth beyond telephone outreach ▪ Linkages to patient-centered medical home,
community programs such as WIC ▪ Reach and sustainability:
– Within our health system – Medicaid and other insurers

Acknowledgements Co-Investigators: Dean Schillinger, Neda Ratanawongsa, Judy Quan, Urmimala Sarkar, Diana Martinez, Catalina Soria, Naomi Stotland, Beth Harleman UCSF-SFGH UCSF Center for Vulnerable Populations San Francisco Health Plan UCSF Telemedicine Group California Diabetes Program, Sonoma County Health Departments, SF DPH, SF and Sonoma County WIC Funding Agencies: AHRQ R18HS017261 and 1R03HS020684-01. McKessan Foundation, UCSF RAP Program-Mt. Zion Women’s Health, Diabetes Family Fund, National Institute on Minority Health and Health Disparities P60MD006902, NIDDK –CTDR- P30 DK092924


Creating Tailored, Influenza Vaccination Alerts in the Electronic Health Record for
a Low-Income, Pediatric Population
Melissa S. Stockwell, M.D., M.P.H. Columbia University Medical Center
New York-Presbyterian Hospital
Influenza Vaccination
▪ Universally recommended: children and adults ≥ 6 months old
▪ Young children have higher infection rates, morbidity
▪ Recommendation begin vaccination when vaccine is available and continue through early spring

Influenza Vaccination
▪ Low vaccination coverage nationally – 51.5% of 6-month to 17-year-olds – 33.7% (13 to 17 years); 74.6% (6 to 24
months)
▪ Missed opportunities for vaccination – In recent study of children who needed two
doses in a given season, 36.3% had at least one missed opportunity for second dose.
(Hofstetter et al., Prev Med 2013)

Influenza Vaccination
▪ Electronic health record (EHR) use common – 2012 National Ambulatory Medical Care
Survey: 72% office-based doctors have adopted an EHR
▪ Vaccine alerts in EHR promising results for influenza vaccination esp. in low-income, urban clinics – Need to be part of workflow
(Fiks et al., Pediatrics 2009)

Influenza Vaccination
▪ Goal: Create a pediatric influenza vaccination alert in the EHR based on provider and parent preferences

Setting
▪ Academic medical center in underserved community – Primarily Latino, Medicaid/SCHIP
▪ Hospital and network of affiliated pediatric ambulatory clinics (n=4)

Setting
▪ Hospital immunization registry synchronizes data with New York Citywide Immunization Registry (CIR) – Vaccination data are available for our
patients for vaccines administered anywhere in NYC reported to CIR

Focus Groups: Providers
▪ Four focus groups with providers (n=21); five individual interviews
▪ Several barriers to influenza vaccine delivery: – Remembering to vaccinate during sick visits – Need to review multiple sources of
immunization information – Time shortages – Inadequate staffing
(Birmingham et al., Prev Med 2011)

Focus Groups: Providers
Desired alert characteristics 1. Alerting providers early in the visit 2. Accurately determining patients'
vaccination status: merging multiple sources of immunization information
3. Facilitating vaccine ordering 4. Generating appropriate documentation
in the EHR when vaccines were refused or not given for other reason

Focus Groups: Providers
Potential concerns 1. Reliability and accuracy of alert
– Want to see immunization dates
2. Workflow interruptions 3. Forced actions

Focus Groups: Parents
21 parents: Interested in 1. Their child’s risk for influenza 2. Side effects and safety of the vaccine 3. Effectiveness of the vaccine 4. Timing of vaccine
▪ Developed talking points used in alert

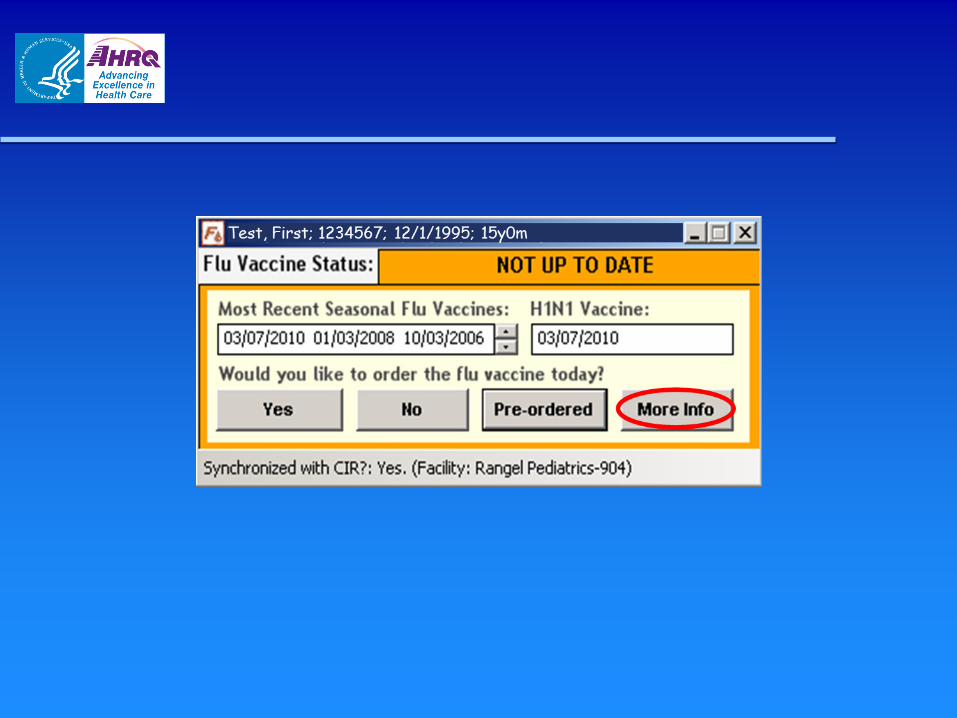
Alert Development
▪ Designed reminder within Eclipsys SCM Ambulatory application
▪ Fires with note opening – No forced action

Alert Development
▪ Retrieves immunization information, via a Web service, from hospital immunization registry – Synchronized with the New York City’s
Department of Health CIR
▪ Graphical user interface (GUI) designed, evaluated and revised to reflect feedback from our provider’s supervisory panel – Beta testers

Alert Development
GUI ▪ Alerts provider to patient’s influenza
immunization status (using up-to-date rules)
▪ Providers can order influenza vaccine ▪ Documents why a vaccine was not given ▪ Allows access to important clinical
information, e.g., allergies and immunization history

Alert Development
▪ End-to-end data transfer mechanism between alert and Eclipsys SCM Ambulatory application via Eclipsys’ medical logic modules (MLM) – Allows users to pass information back to
Eclipsys and paste into the provider’s s note


Training
▪ Created training tools – User manual – PowerPoint – Quick reference guide
▪ On-site training

Lessons Learned
▪ Involve users early – Although no forced action: providers did
act
▪ Make alert smart and tailored ▪ Don’t interfere with workflow
– Important for us not to delay note opening
▪ Open to changes – Green alert now disappears

Acknowledgements ▪ AHRQ: R18 HS018158 ▪ FluAlert study team
– Marina Catalozzi, Stewin Camargo, Sally E Findley, Rita Kukafka, Sekhar Ramakrishnan, Stephen Holleran, David K Vawdrey, Eileen Birmingham, Ken Kitayama, Lauren Sonnabend
▪ NewYork Presbyterian Hospital EzVac Immunization Information System
▪ New York Presbyterian Hospital Ambulatory Care Network


Usability of a Personal Health Record for Monitoring the Health of Adults
with Intellectual Disability James H. Rimmer, Ph.D.
Lakeshore Foundation Endowed Chair in Health Promotion and Rehabilitation Sciences University of Alabama at Birmingham
Kelly Hsieh, Ph.D., and Ben Gerber, M.D. University of Illinois at Chicago

Funding Source
Agency for Healthcare Research & Quality (AHRQ #R21-HS18766).

Background
▪ People with intellectual disabilities (ID) experience poorer health and have less access to health care than the general population.
▪ Transferring medical information of adults with ID from one provider to another often results in missing or inaccurate information, creating problems in maintaining current and accurate medical information.
▪ People with ID often have poor health behavior habits.
Freedman & Chassler, 2004; Krahn & Drum, 2006; Lennox et al., 2004; Ouellette et al., 2004; Mitchell, 1999; Kerr et al., 2003

Background
▪ In the United States there is a significantly higher risk of poorly managed health care.
▪ Currently, there is no health IT system that addresses the unique health care needs of the ID population.
▪ There is a growing need to identify effective strategies for tracking and monitoring the health of adults with ID.
Krahn & Drum, 2006; Ouellette-Kuntz, 2005; U.S. Dept. of Health and Human Services, 2007; Rimmer et al., 2004

Percent of Participants with Chronic Health Conditions (N=938)

Prevalence of Top Five Chronic Health Conditions
Among Adults with ID (N=938)

Research Questions
1. What is the user experience of a personal health record for adults with ID?
2. How much perceived control did the caregiver have over the health data of the adult with ID?
3. What are the barriers in using a personal health record for adults with ID?
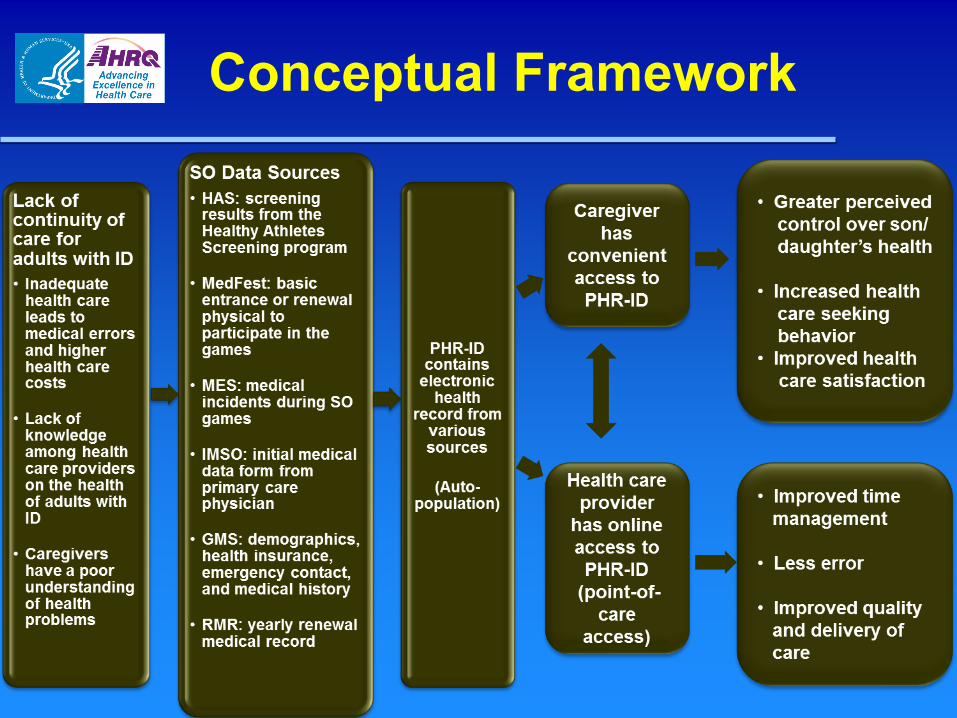
Conceptual Framework

Participants
▪ Inclusion criteria – Adult child with ID from18 to 40 years old – Home Internet service – Family member could read and speak
English (self-report) ▪ The research team and Special Olympics
(SO) staff recruited caregivers who had an adult son/daughter participating in the national, state, or local SO games in 2010.

Flowchart of Study Participants

Personal Health Record (PHR-ID)
▪ Designed by HEALTH One Global (UK) ▪ Autopopulated with personal health information from
several data sources ▪ For this study, we focused on training caregivers to:
– Navigate various sections of health data (e.g., medical history, Special Olympics health screening results)
– Input their adult child’s dietary intake, physical activity, body hygiene
– Foster Special Olympics sport participation – Access PHR-ID via USB card. Caregivers could log in to a
secure Web site to view their adult child’s health information, and they were also provided with a special USB card required for PHR-ID access.

Personal Health Record (PHR-ID)
▪ After logging in to the PHR-ID, caregivers could view the following items: – Adult child’s health status, which included the
Special Olympics physical exam – General notes and examinations related to the
observations made by the adult child’s doctor, dentist, nurse, or the caregivers’ own observations
– Healthy Athletes screenings results (e.g., vision, hearing, oral care, and fitness)
– Healthy Athletes News – Sports and health promotion

USB Card and Personal Health Record Page

Design
▪ 12-week intervention to examine caregiver usability of the Web-based PHR-ID
▪ Following the intervention, participants completed online surveys on – Usability (including barriers to use) and – Perceived control over health information
▪ Semi-structured telephone interview conducted at the end of the intervention with a subset of caregivers (n=14)

Procedures ▪ Participants received a user guide prior to the intervention with
instructions on how to access and use the PHR-ID. – Evaluation: Participants reported that the Guide was useful (92.3%),
easy to understand (88.5%), and answered all of their questions related to using the PHD-ID (91.7%)
▪ Participants were asked to view the PHR-ID at least monthly over the course of 12 weeks.
▪ Research staff person was available via a toll-free phone number or email for technical assistance.
▪ Electronic reports were provided by Health One Global indicating which participants logged in to view their child’s PHR-ID.
▪ At the end of the intervention, – Participants were asked to complete an online usability survey – Caregivers were also invited to participate in a post-intervention
process evaluation conducted by telephone

Quantitative Measures Barriers to using PHR-ID ▪ Four (4) positive items (participants’ comments)
– I am very comfortable using the PHR-ID. – Most of the time, I found it easy to get to all sections of the PHR-ID. – This record could be used by the person I am caring for with minimal assistance
from me. – I feel comfortable approaching my doctor about using the PHR-ID.
▪ Six (6) negative items (participants’ comments) – I do not have the time to use the PHR-ID. – I could have used more technical support to help me use the PHR-ID. – My computer is not handling the PHR-ID well while I am using it. – The person I am providing care for is not involved when I view the PHR-ID. – Entering information into the PHR-ID takes too long. – The language in the PHR-ID is too difficult to understand.
▪ Ratings were based on a 5-point Likert scale from “1” strongly disagree to “5” strongly agree.
▪ An open-ended question on what they liked and disliked about the PHR-ID was included at the end of the survey.

Quantitative Measures Usability ▪ Usability was assessed with a modification of items from the System
Usability Scale (Brook, 1996). ▪ Four (4) positive items (participants’ comments)
– I would like to use the PHR-ID. – The PHR-ID is easy to use. – The various features in the PHR-ID work well together. – Most people will learn to use the PHR-ID very quickly.
▪ Four (4) negative items (participants’ comments) – The PHR-ID is unnecessarily complex. – I will need the support of a technical person to be able to use the PHR-ID. – The information found in the PHR-ID was not consistent throughout the
record. – The PHR-ID is very awkward to use.
▪ Ratings were based on a 5-point Likert scale from “1” strongly disagree to “5” strongly agree.

Quantitative Measures Perceived control
▪ Perceived control was assessed using a modification of items from the perceived control scale (Menon, 2002).
▪ Eight (8) positive items (participants’ comments) – I like having access to the health record of the person I am caring for. – I can get the support I need to help the person I am caring for with their health. – I think the doctor or other health care provider of the person I am caring for will find
the PHR-ID useful. – I can influence the physician or other health service provider to use the PHR-ID. – I can help make decisions concerning the health of the person I am caring for. – I feel very confident using the PHR-ID. – I intend to use the PHR-ID to manage the health of the person I am caring for. – I want to continue using the PHR-ID rather than stop using it.
▪ One (1) negative item (participants’ comments) – I need to learn a lot of things before I can use the PHR-ID.
▪ Ratings were based on a 5-point Likert scale from “1” strongly disagree to “5” strongly agree.

Quantitative Measures
▪ Technical assistance – Data were recorded regarding participant
requests for assistance by frequency and solutions to resolving problems.

Data Analysis ▪ Quantitative
– Outcomes: user experience and usability – Descriptive statistics: means, medians,
standard deviations, ranges, and proportions ▪ Qualitative
– Semi-structured interviews over the telephone – Interviews were transcribed and analyzed by
coding responses to each question – Frequencies and percentages – Content analysis

Results
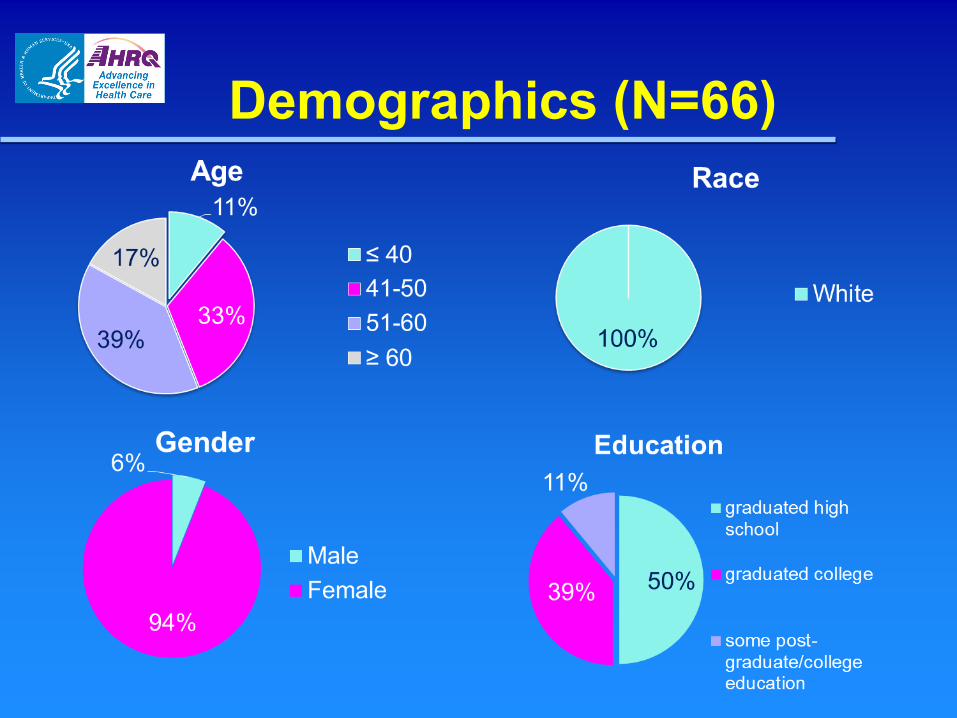
Demographics (N=66)

PHR-ID Usage (N=66)
▪ 27 (41%) participants viewed the PHR-ID ▪ 18 participants completed the online
usability surveys ▪ 24 participants completed the barriers
survey ▪ 14 participants participated in the
interviews by phone – 11 participants used PHR-ID – 3 participants did not use PHR-ID

Barriers to Use of PHR-ID (N=24)
Barriers to use of PHR-ID N Strongly disagree/ Disagree
n (%)
Neither n (%)
Agree/ Strongly
agree n (%)
Mean (SD)
I am very comfortable using the PHR-ID. 24 3 (12.5) 5 (20.8) 16 (66.6) 3.75 (.94)
Most of the time, I found it easy to get to all sections of the PHR-ID. 24 3 (12.5) 3 (12.5) 18 (75.0) 3.71 (.96)
This record could be used by the person I am caring for with minimal assistance from me. 24 10 (41.7) 5(20.8) 9 (37.5) 3.00 (1.10)
I feel comfortable approaching my doctor about using the PHR-ID. 24 4 (16.7) 10 (41.7) 10 (41.7) 3.33 (1.01)
I do not have time to use the PHR-ID. 24 10 (41.7) 8 (33.3) 6 (25.0) 2.71 (1.00)
I could have used more technical support along the way to help me use the PHR-ID. 24 12 (50.0) 8 (33.3) 4 (16.7) 2.58 ( .88)
My computer is not handling the PHR-ID well while I am using it. 24 16 (66.7) 4 (16.7) 4 (16.7) 2.50 (1.18)
The person I am providing care for is not involved when I view the PHR-ID. 24 12 (50.0) 3 (12.5) 9 (37.5) 2.83 (1.24)
Entering information into the PHR-ID takes too long. 23 14 (60.8) 8 (34.8) 1 (4.3) 2.30 (.77) The language in the PHR-ID is too difficult to understand. 24 16 (66.7) 7 (29.2) 1 ( 4.2) 2.25 (.74)
Note. 1 = Strongly disagree, 2 = Disagree, 3= Neither agree or disagree, 4 = Agree, 5 = Strongly agree. Negative statements in blue shading.

Usability Statements Post-Intervention (N=18)
Usability statement N
Strongly disagree/ Disagree
n (%)
Neither n (%)
Agree/ Strongly
agree n (%)
Mean (SD)
I would like to use the PHR. 18 -- 3 (16.7) 15 (83.4) 4.00 (.59)
The PHR is unnecessarily complex. 18 13 (72.3) 2 (11.1) 3 (16.7) 2.39 (.85)
The PHR is easy to use. 18 3 (16.7) 2 (11.1) 13 (72.3) 3.61 (1.04)
I will need the support of a technical person to be able to use the PHR.
18 12 (66.7) 2 (11.1) 4 (22.2) 2.56 (1.04)
The various features in the PHR work well together.
18 -- 3 (16.7) 15 (83.4) 4.00 (.59)
The information found in the PHR was not consistent throughout the record.
17 13 (76.4) 2 (11.8) 2 (11.8) 2.18 (.88)
Most people will learn to use the PHR very quickly.
18 1 (5.6) 3 (16.7) 14 (77.8) 3.94 (.80)
The PHR is very awkward to use. 18 12 (66.7) 4 (22.2) 2 (11.2) 2.33 (1.03)
Note. 1 = Strongly disagree, 2 = Disagree, 3= Neither agree or disagree, 4 = Agree, 5 = Strongly agree. Negative statements in blue shading.

Percentage of Perceived Control Statements After Intervention (N=17)
Perceived control statement N
Strongly disagree/ Disagree
n (%)
Neither n (%)
Strongly agree/Agree
n (%) Mean (SD)
I like having access to the health record of the person I am caring for.
17 0 2 (11.8) 15 (88.2) 4.24 (.66)
I can get the support I need to help the person I am caring for with their health.
17 1 (5.9) 2 (11.8) 14 (82.3) 4.00 (.79)
I think the doctor or other health care provider of the person I am caring for will find the PHR useful.
17 0 7 (38.9) 10 (58.8) 3.76 (.75)
I can influence the physician or other health service provider to use the PHR.
17 1 (5.9) 7 (41.2) 9 (53.0) 3.53 (.94)
I am able to help make decisions concerning the health of the person I am caring for.
17 0 3 (17.6) 14 (82.3) 4.06 (.66)
I feel very confident using the PHR. 17 5 (29.4) 2 (11.8) 10 (58.8) 3.29 (1.11)
I need to learn a lot of things before I can use the PHR.
16 6 (37.5) 3 (18.8) 7 (43.8) 3.00 (1.21)
I intend to use the PHR to manage the health of the person I am caring for.
17 2 (11.8) 5 (29.4) 10 (58.9) 3.53 (1.01)
I want to continue using the PHR rather than stop using it.
17 2 (11.8) 5 (29.4) 10 (58.9) 3.53 (1.01)
Note. 1 = Strongly disagree, 2 = Disagree, 3= Neither agree or disagree, 4 = Agree, 5 = Strongly agree. Negative statement in blue shading.

Technical Assistance Requested (N=17)
Technical Assistance N
USB drives became corrupted when inserted into the participant’s computer.
7
Different operating systems and computer types required the PHR-ID to be adapted.
6
Participants could not access the login screen. 3
USB extension cable was needed to plug the USB into the back recess panel of the participant’s computer.
1
Computer repeatedly shut down when the USB drive was inserted.
1
Six technical assistance requests were able to be resolved, and three participants either withdrew from the study or were unable to be reached after making a technical assistance request.

Qualitative Analyses (N=14)
▪ A total of 14 participants participated in interviews by phone – Eleven participants used the PHR-ID. – Three participants did not use PHR-ID.
▪ Of the 11 participants who used PHR-ID: – Seven felt they needed additional training in using the USB port. – Eight felt the instructions were not detailed enough.
▪ Experiences entering data into PHR-ID: – Six caregivers entered health information regarding their adult child. – Five caregivers entered health data. – One caregiver attempted to enter the health data but had difficulty. – One caregiver was hesitant to enter the data because she was unfamiliar
with some terminology. – Half the participants had difficulty navigating the system. – Two adults with ID entered the data on their own. – Six caregivers reported that their children watched as information was
entered. – One caregiver attempted to share the process with the child .

Qualitative Analyses (N=14)
▪ Sharing PHR-ID with provider – Two members who completed the study shared the PHR-ID with
their adult child’s physician or dentist. – Both members experienced less-than-receptive physicians.
▪ Additional comments regarding PHR-ID: – Two participants preferred to use Apple computers that were not
compatible with the PHR-ID. – Four participants mentioned that they would have preferred a
Web-based portal for keeping the PHR. – Six did not like the USB. – One felt that access would be limited without Web access
because she relied heavily upon smartphones. – One caregiver expressed concern about backing up the
information on the USB. – Another caregiver who was very concerned about her child’s
weight gain found the diet information to be too general.
Discussion and Conclusion
▪ There was low usage and interest in accessing the current structure of the PHR-ID among family members who had an adult with ID.
▪ Time and effort to access the record, solve technical problems, and explore the records’ features were limited.
▪ Out of 66 family members who originally agreed to participate in the study, only 27 (41%) opened the PHR-ID one or more times, and 59% never opened the record.
▪ There was minimal incentive or need to access the PHR-ID as the adult with ID did not have any significant health issues.
▪ Despite technical challenges, potential advantages identified were: – Increasing the involvement of a person with ID in his/her own health care – Coordinating health information among various providers – Developing a structured and permanent record of health information – Having the ability to track health behaviors
Recommendations ▪ With more training on the use of the system, health care
locus of control can be shifted to family members and people with ID.
▪ PHRs may be more effective when shared with providers. ▪ PHR-ID offers greater potential if it can directly involve
persons with ID. ▪ Visual information (pictures, video, and other media) will
help young adults with ID interact with personal health information and potentially offer an educational venue.
▪ Mobile technologies would further advance the capabilities of the PHR, particularly with respect to health screenings such as immunizations and follow-up provider visits.
▪ Patient portals that connect health consumers with their providers’ electronic medical records may serve as an alternative.

Tailored Lifestyle Weight Management Program for Adults with ID: Personal Health
Promotion Record (PHPR-ID)

POWERS
Personalized Online Weight and Exercise Response System (POWERS)

POWERS
POWERS

Tailored Dietary Recommendations

Nearby Subway Locations


Q & A
Please submit your questions by using the Q&A box to the right of the screen.

CME/CNE Credits
To obtain CME or CNE credits:
Participants will earn 1.5 contact credit hours for their participation if they attended the entire Web conference.
Participants must complete an online evaluation in order to obtain a CE certificate.
A link to the online evaluation system will be sent to participants who attend the Web Conference within 48 hours after the event.