using heri data to answer questions about your school tools and techniques
TRANSCRIPT

Using HERI Data to Using HERI Data to Answer Questions about Answer Questions about
Your SchoolYour School
Toolsand
Techniques

HERI Surveys are theMATERIALS
&
STATISTICS are theTOOLS

MaterialsMaterials
CSS 2000 Data File fromCSS 2000 Data File from
WhatsaMatta University
Frostbite Falls, MN
• 7,356 Entering Freshmen took the CIRP in Fall 1996.• Every one of them took the CSS in Spring 2000.• File contains 531 variables from both surveys.
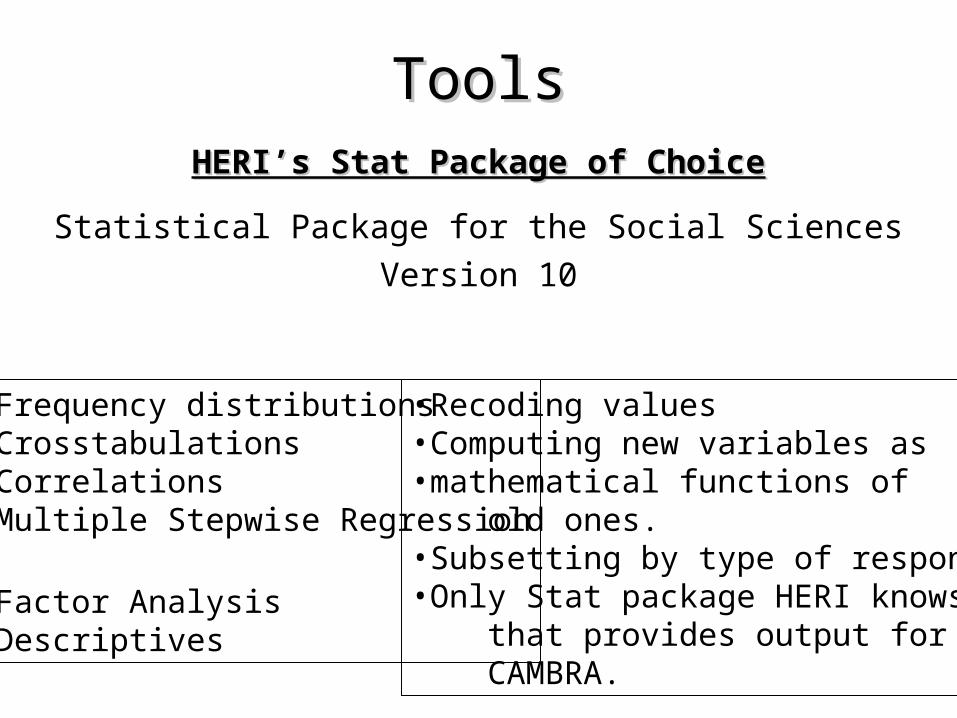
ToolsToolsHERI’s Stat Package of ChoiceHERI’s Stat Package of Choice
Statistical Package for the Social Sciences
Version 10
•Frequency distributions•Crosstabulations •Correlations•Multiple Stepwise Regression
•Factor Analysis•Descriptives
•Recoding values•Computing new variables as •mathematical functions of old ones.•Subsetting by type of respondent•Only Stat package HERI knows that provides output for CAMBRA.

CONTROVERSY AT W.M.U.CONTROVERSY AT W.M.U.
Coach Bobby DayCoach Bobby Day Dean Primand ProperDean Primand Proper

Does Participation in Intercollegiate Athletics Promote
Leadership Ability??

Creating The Environmental VariableCreating The Environmental Variable
COMPUTE intsport=1.
IF (colact14=2 OR colact15=2) intsport=2.
VARIABLE LABELS intsport ‘ Participated in Intercollegiate Sport?’.
VALUE LABELS intsport 1 ‘No’ 2 ‘Yes’.
EXECUTE.

FIRST TRYFIRST TRY INTSPORT v. CSSRAT08

WHAT ABOUT THE PRETESTWHAT ABOUT THE PRETEST?INTSPORT v. SIFRAT08
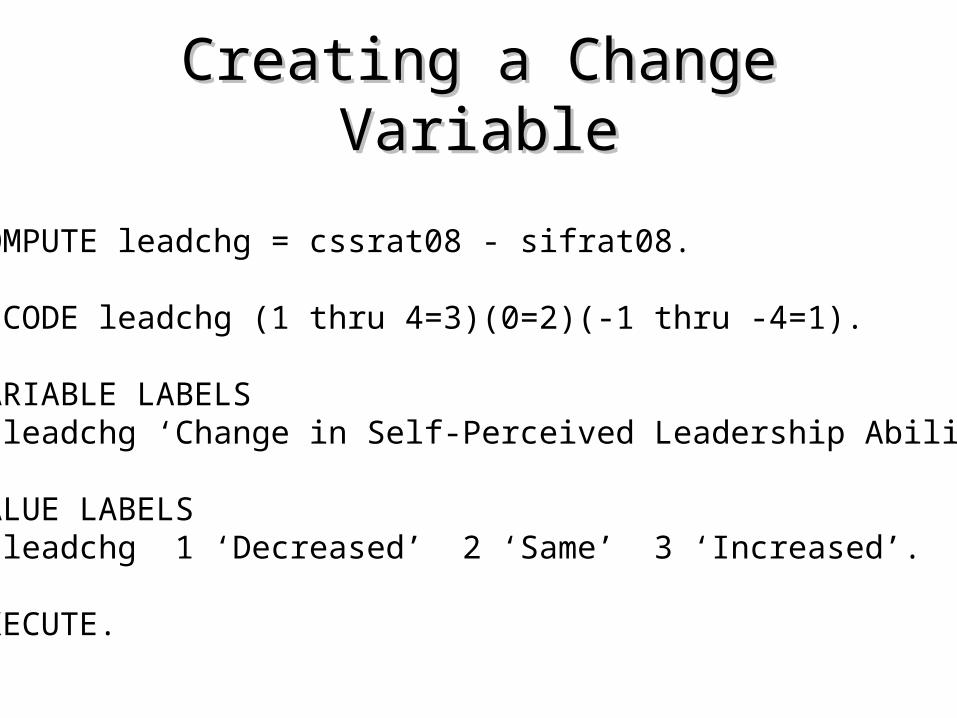
Creating a Change VariableCreating a Change Variable
COMPUTE leadchg = cssrat08 - sifrat08.
RECODE leadchg (1 thru 4=3)(0=2)(-1 thru -4=1).
VARIABLE LABELS leadchg ‘Change in Self-Perceived Leadership Ability’.
VALUE LABELS leadchg 1 ‘Decreased’ 2 ‘Same’ 3 ‘Increased’.
EXECUTE.

AN I.E.O. TABLEAN I.E.O. TABLEINTSPORT v. LEADCHG

A “POORMAN’S” I.E.O. TABLEA “POORMAN’S” I.E.O. TABLEINTSPORT v. SLFCHG08

SO WHAT’S THE ANSWER??SO WHAT’S THE ANSWER??
Sorry, Coach Day.Primand Proper was right this time.
Our investigation of the available data suggests that although students who participated in intercollegiate athletes are more likely to have a
higher self-perception of leadership ability than non-athletes, this tendency is accounted for largely by the fact that athletes already had a
higher tendency when they entered college. An examination of changes in self-perceived leadership ability since college entry suggests that the
difference between athletes and non-athletes is at best very small.

……But Wait a Minute…But Wait a Minute…

KORN’S CHEESECAKE THEORY

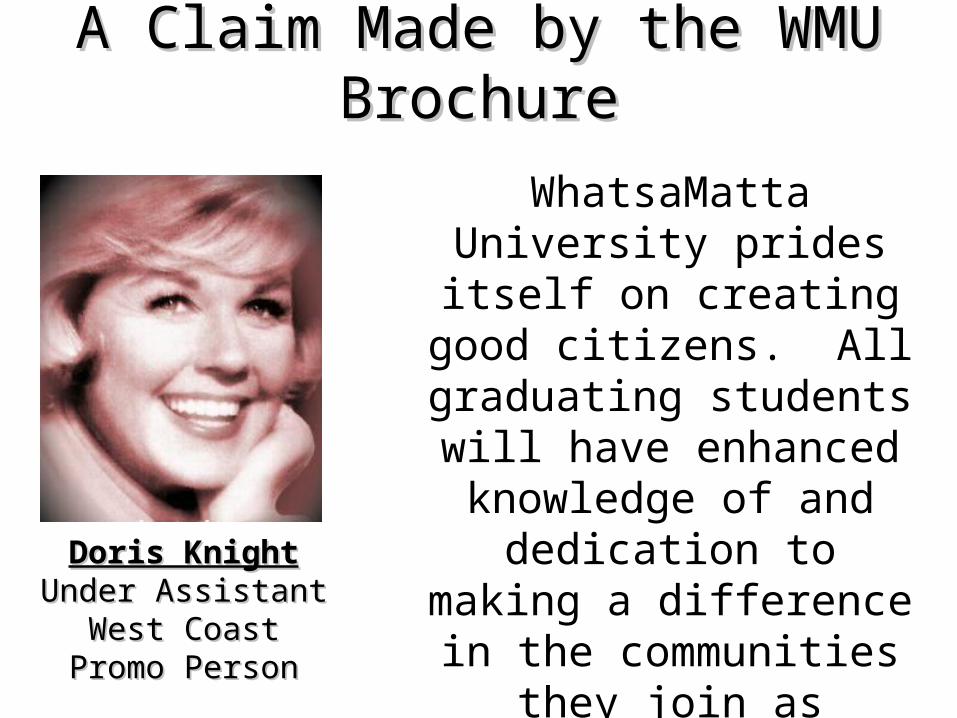
A Claim Made by the WMU BrochureA Claim Made by the WMU Brochure
WhatsaMatta University prides itself on creating good
citizens. All graduating students will have enhanced knowledge of and dedication to making a difference in the
communities they join as workers, neighbors &
parents.
Doris KnightDoris KnightUnder AssistantUnder Assistant
West CoastWest CoastPromo PersonPromo Person

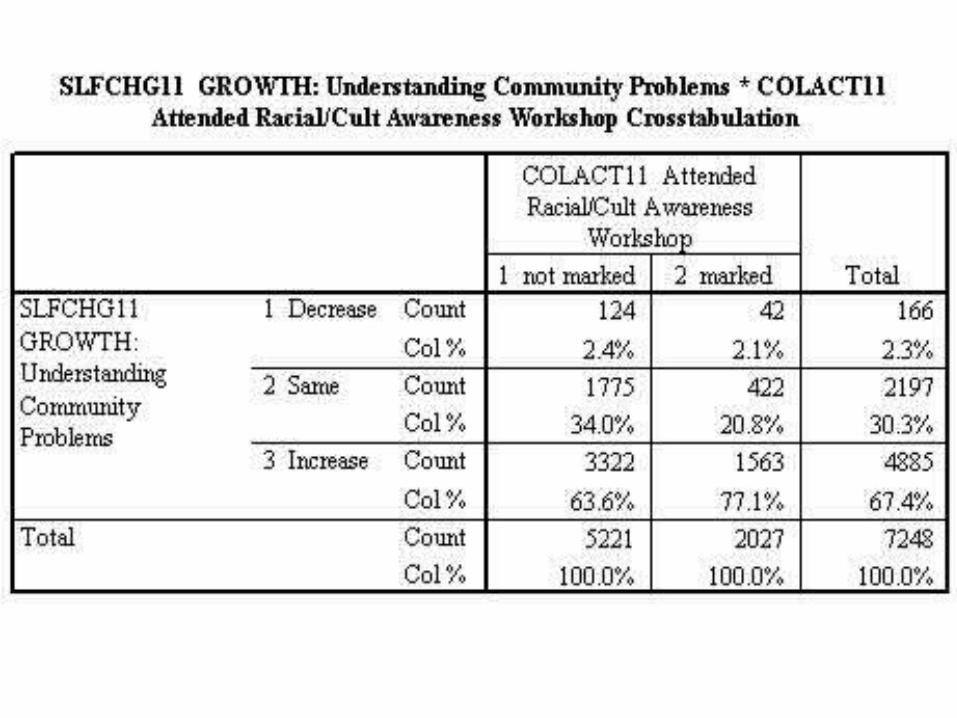
Answering the Easy Question
Not too shabby WMU, but…
What about the other 32.6%?

Gone Fishin’

A Fast Way to Find RelationshipsMultiple Stepwise Regression
REGRESSION
/DESCRIPTIVES mean stddev corr sig n
/MISSING listwise
/STATISTICS coeff outs r anova change zpp
/CRITERIA=PIN(.05) POUT(.10)
/NOORIGIN
/DEPENDENT slfchg11
/METHOD=FORWARD csssex income hsgpa sifobj10 cssrace1 to cssrace7
sifact10 sifact16 sifact19 sifobj02 sifobj11 sifobj12
/METHOD=FORWARD colact01 TO colact23 genact09.

Strongest Predictors of SLFCHG11
Variable Description B Beta SIG
CSSRACE1 White -.102 -.050 .002
CSSRACE4 Asian -.104 -.036 .013
GENACT09 Volunteer Work .144 .124 .000
COLACT11 Race/Cult Wkshp .117 .070 .000
COLACT09 Eth Stud Class .102 .067 .000
COLACT13 In Race/Eth Org .107 .051 .000
COLACT10 Women Stud Class .063 .033 .010
COLACT08 Took Remed Class .103 .027 .029
COLACT23 Took Ldr Training .058 .022 .009


Creating a ScaleCOMPUTE awareact = colact09 + colact10 + colact11 + colac23 + genact09.VARIABLE LABELS awareact ‘Awareness Enhancing Activities?’.FREQUENCIES VARIABLES=awareact..
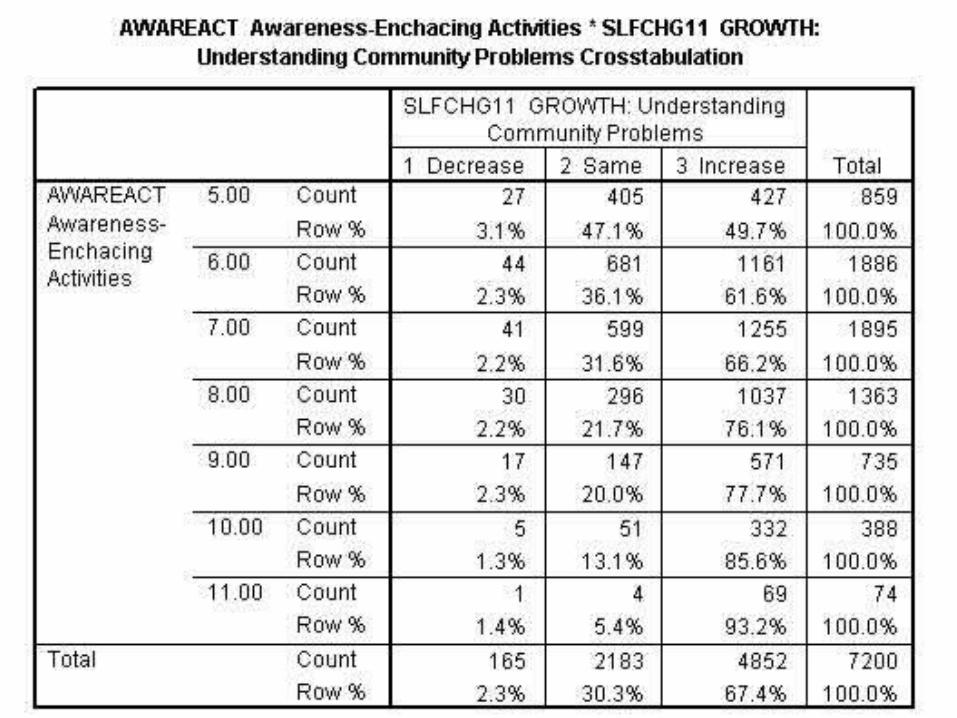
SO WHAT’S THE ANSWER??SO WHAT’S THE ANSWER??
Students that avail themselves of the courses and programs designed in part to increase community awareness definitiely show substantial increases in that awareness. Moreover, the
increase is additive, in that participation in more of these courses and programs is connected with a larger increase in
community awareness.
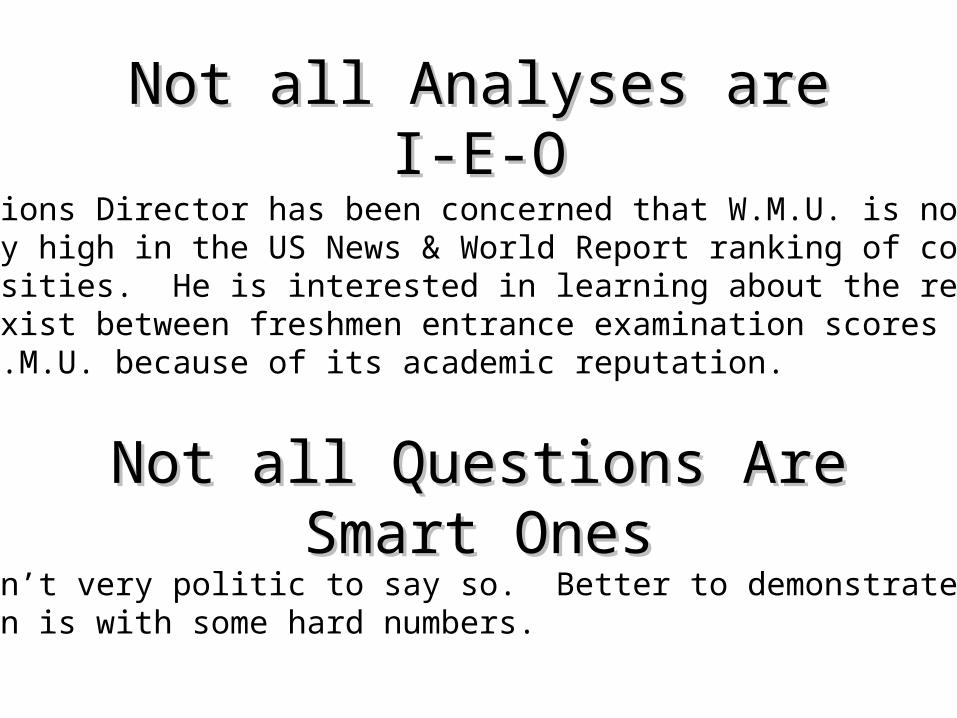
Not all Analyses are I-E-ONot all Analyses are I-E-O
The Admissions Director has been concerned that W.M.U. is notlisted very high in the US News & World Report ranking of collegesand universities. He is interested in learning about the relationshipthat may exist between freshmen entrance examination scores andchoosing W.M.U. because of its academic reputation.
Not all Questions Are Smart OnesNot all Questions Are Smart OnesBut it isn’t very politic to say so. Better to demonstrate how dumba question is with some hard numbers.
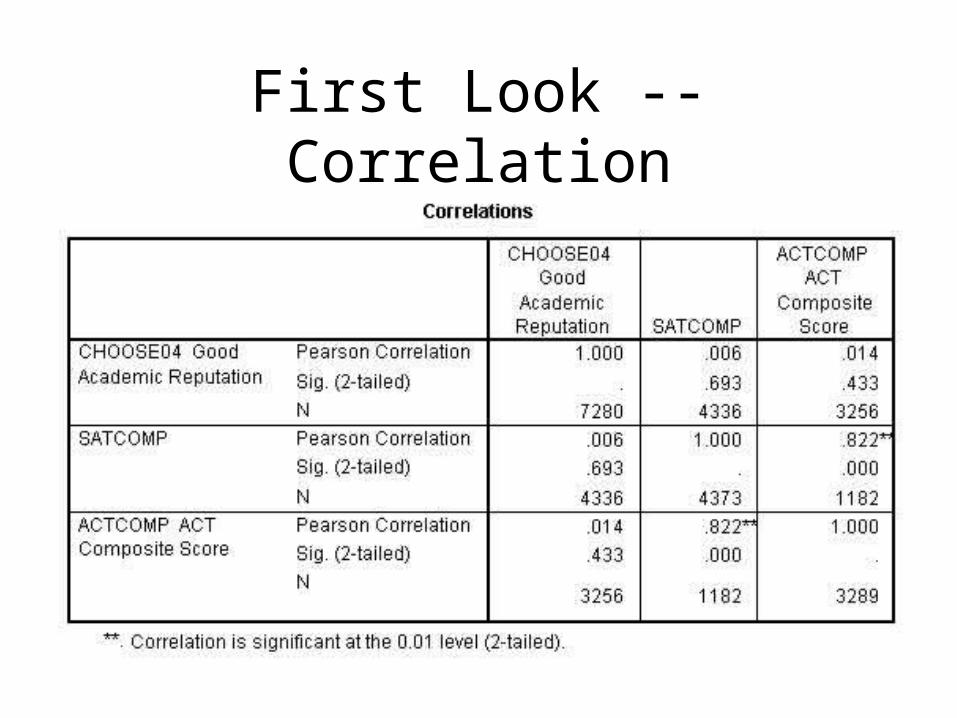
First Look -- Correlation
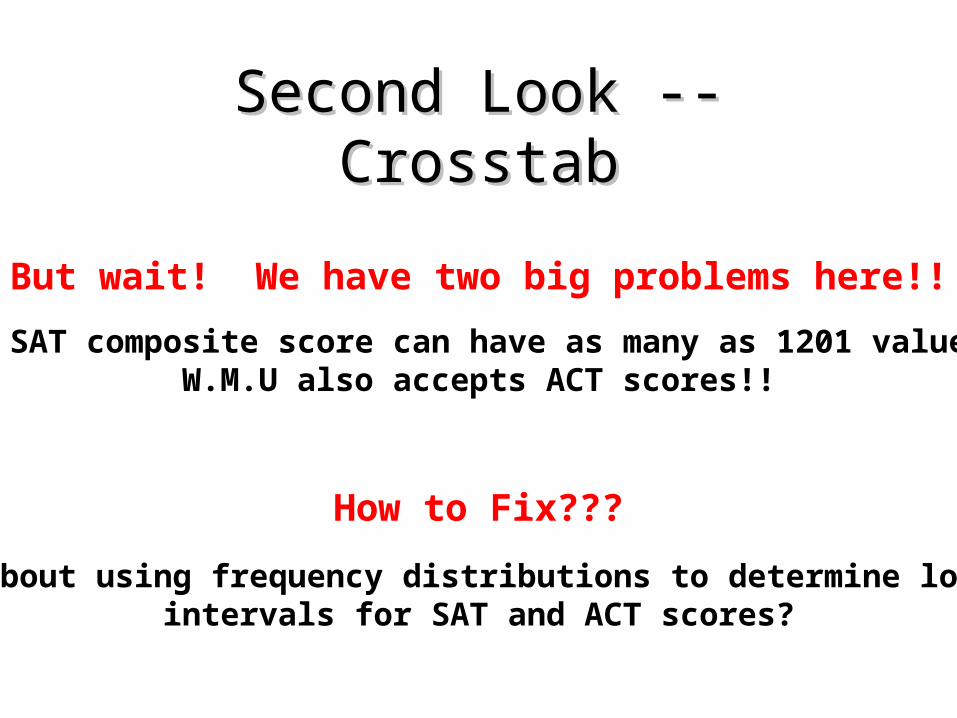
Second Look -- CrosstabSecond Look -- Crosstab
The SAT composite score can have as many as 1201 values!!W.M.U also accepts ACT scores!!
But wait! We have two big problems here!!
How to Fix???
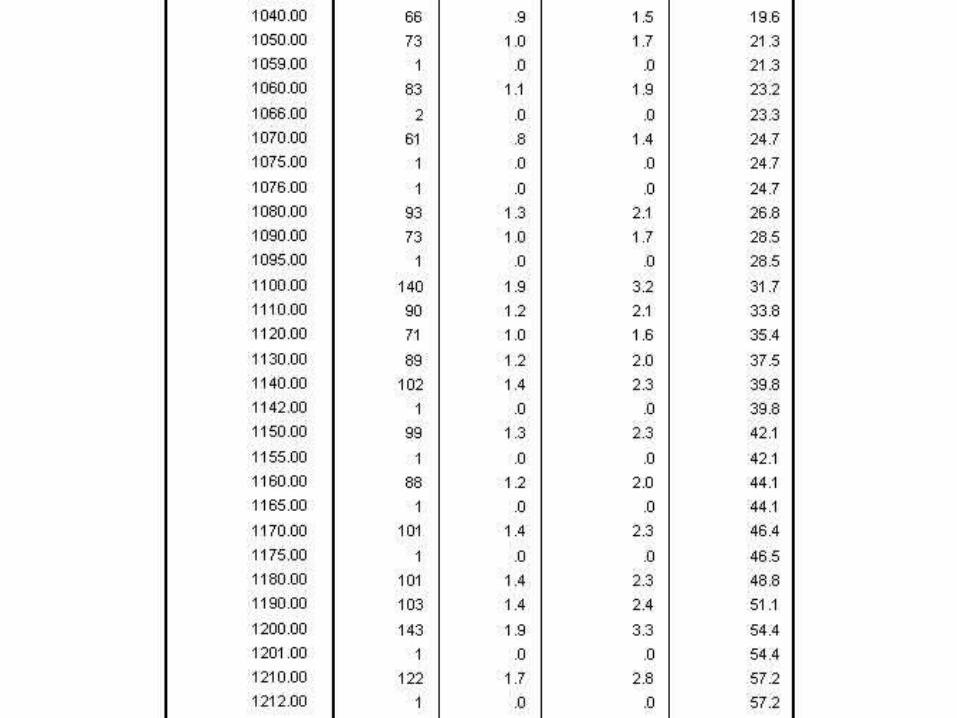
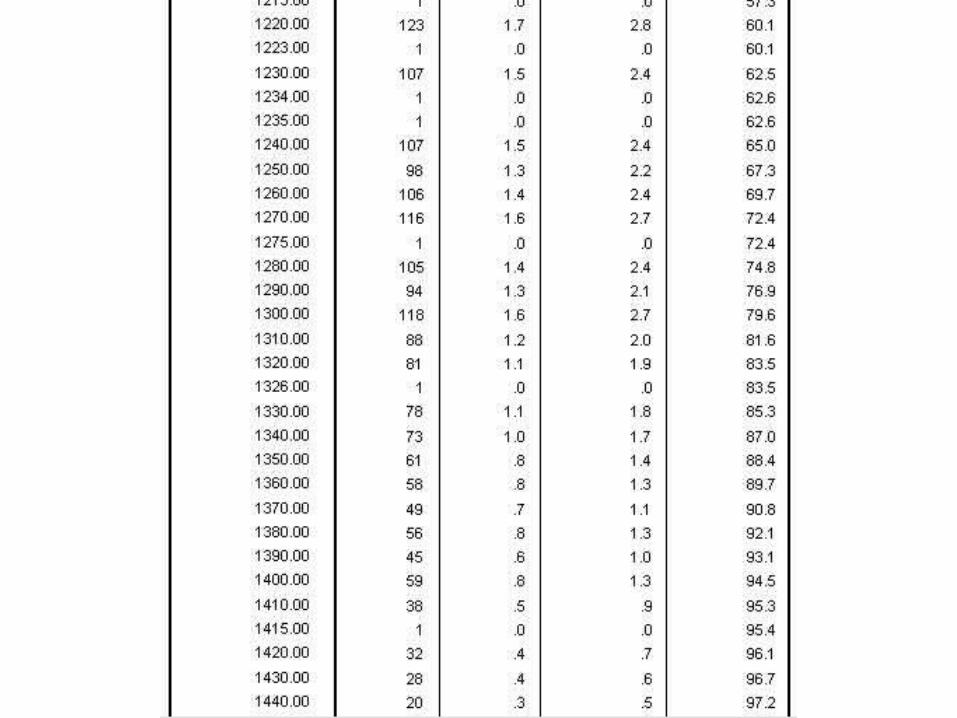
How about using frequency distributions to determine logicalintervals for SAT and ACT scores?


ACTCOMP
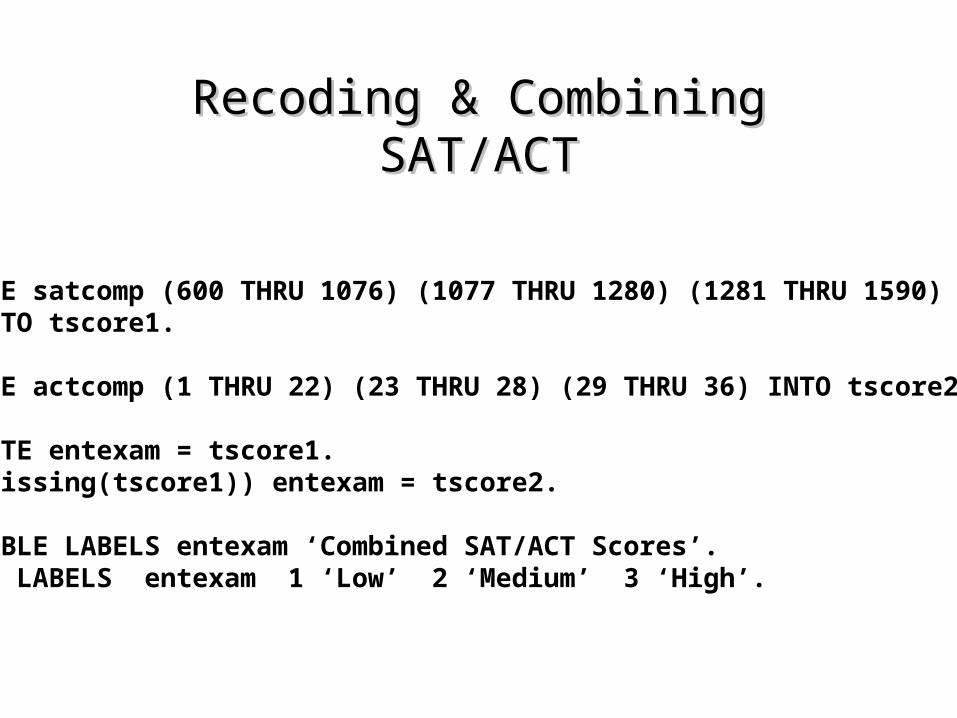
Recoding & Combining SAT/ACTRecoding & Combining SAT/ACT
RECODE satcomp (600 THRU 1076) (1077 THRU 1280) (1281 THRU 1590) INTO tscore1.
RECODE actcomp (1 THRU 22) (23 THRU 28) (29 THRU 36) INTO tscore2.
COMPUTE entexam = tscore1.IF (Missing(tscore1)) entexam = tscore2.
VARIABLE LABELS entexam ‘Combined SAT/ACT Scores’.VALUE LABELS entexam 1 ‘Low’ 2 ‘Medium’ 3 ‘High’.

And Finally, the CrosstabAnd Finally, the Crosstab

If at first you don’t succeed…If at first you don’t succeed…

……try, try againtry, try againAnswering a Question You Weren’t Asked

SO WHAT’S THE ANSWER??SO WHAT’S THE ANSWER??We regret that we were unable to find any relationship between
students choosing to attend WhatsaMatta University because of its academic reputation and their College Entrance Exam scores.
We did find a relationship between the major students intend to enter and W.M.U.’s perceived academic reputation. It would appear that
students are more concerned about the academic reputation of individual departments within W.M.U than the university as a whole.
BUTBUT