using honeynets and the diamond model for ics …...defending industrial control systems (ics) is...
TRANSCRIPT
Using Honeynets and the Diamond Model for ICS Threat Analysis
John Kotheimer Kyle O’Meara Deana Shick
May 2016
TECHNICAL NOTE CMU/SEI-2016-TR-006
CERT Division
Distribution Statement A: Approved for Public Release; Distribution is Unlimited
http://www.sei.cmu.edu

CMU/SEI-2016-TR-006 | SOFTWARE ENGINEERING INSTITUTE | CARNEGIE MELLON UNIVERSITY
Distribution Statement A: Approved for Public Release; Distribution is Unlimited
Copyright 2016 Carnegie Mellon University
This material is based upon work funded and supported by Department of Homeland Security under
Contract No. FA8721-05-C-0003 with Carnegie Mellon University for the operation of the Software
Engineering Institute, a federally funded research and development center sponsored by the United
States Department of Defense.
Any opinions, findings and conclusions or recommendations expressed in this material are those of the
author(s) and do not necessarily reflect the views of Department of Homeland Security or the United
States Department of Defense.
References herein to any specific commercial product, process, or service by trade name, trade mark,
manufacturer, or otherwise, does not necessarily constitute or imply its endorsement, recommendation,
or favoring by Carnegie Mellon University or its Software Engineering Institute.
This report was prepared for the
SEI Administrative Agent
AFLCMC/PZM
20 Schilling Circle, Bldg 1305, 3rd floor
Hanscom AFB, MA 01731-2125
NO WARRANTY. THIS CARNEGIE MELLON UNIVERSITY AND SOFTWARE ENGINEERING
INSTITUTE MATERIAL IS FURNISHED ON AN “AS-IS” BASIS. CARNEGIE MELLON
UNIVERSITY MAKES NO WARRANTIES OF ANY KIND, EITHER EXPRESSED OR IMPLIED,
AS TO ANY MATTER INCLUDING, BUT NOT LIMITED TO, WARRANTY OF FITNESS FOR
PURPOSE OR MERCHANTABILITY, EXCLUSIVITY, OR RESULTS OBTAINED FROM USE
OF THE MATERIAL. CARNEGIE MELLON UNIVERSITY DOES NOT MAKE ANY
WARRANTY OF ANY KIND WITH RESPECT TO FREEDOM FROM PATENT, TRADEMARK,
OR COPYRIGHT INFRINGEMENT.
[Distribution Statement A] This material has been approved for public release and unlimited distribu-
tion. Please see Copyright notice for non-US Government use and distribution.
Internal use:* Permission to reproduce this material and to prepare derivative works from this material
for internal use is granted, provided the copyright and “No Warranty” statements are included with all
reproductions and derivative works.
External use:* This material may be reproduced in its entirety, without modification, and freely distrib-
uted in written or electronic form without requesting formal permission. Permission is required for any
other external and/or commercial use. Requests for permission should be directed to the Software En-
gineering Institute at [email protected].
* These restrictions do not apply to U.S. government entities.
Carnegie Mellon®, CERT® and CERT Coordination Center® are registered marks of Carnegie Mellon
University.
DM-0003602

CMU/SEI-2016-TR-006 | SOFTWARE ENGINEERING INSTITUTE | CARNEGIE MELLON UNIVERSITY i
Distribution Statement A: Approved for Public Release; Distribution is Unlimited
Table of Contents
Acknowledgments v
Abstract vi
Introduction 1
1 Data Sources 2 1.1 ICS Honeynet Packet Capture Data 2 1.2 Data Issues 2
1.2.1 Incomplete Record of Activity 2 1.2.2 Lack of Honeynet Configuration Data 2 1.2.3 Need for Manual Analysis of Certain Data 3
1.3 WHOIS and DNS Data 3 1.4 VirusTotal 3 1.5 Palo Alto Networks’ Threat Intelligence Reports 3 1.6 Additional Open Source Information 4
2 Tools 5 2.1 GNU Core Utilities 5 2.2 SiLK and super_mediator 5 2.3 Shell Scripts 5
3 Diamond Model of Intrusion Analysis 6 3.1 Core Concepts 6 3.2 Analytic Pivoting 7 3.3 Activity Group Creation 7
4 Methodology 8 4.1 Variables Used 8 4.2 Partitioning and Identification of ICS Honeynet Data 8
4.2.1 Characterizing Network Traffic Using SiLK 8 4.2.2 Examination of HTTP POST Data 9 4.2.3 Examination of Traffic on Common ICS Ports 9 4.2.4 Diamond Model Event Definition 9
4.3 Analytic Pivoting 10 4.3.1 Host-Centered Approach 10 4.3.2 Port-Centered Approach 11
4.4 Grouping Potential Threat Actors 11 4.4.1 Defining the Activity Group Creation Function 11
5 Results 13 5.1 Honeynet Configuration 13 5.2 Characterization of Threat Actors Through Analytic Pivoting 14
5.2.1 Host-Centered Approach 14 5.2.2 Port-Centered Approach 15
5.3 Using Honeynet Data to Group Actors 18 5.3.1 Active Threat Actors 18 5.3.2 High-Risk Actors 18 5.3.3 Moderate-Risk Actors 19 5.3.4 Unknown-Risk Actors / Outliers 21

CMU/SEI-2016-TR-006 | SOFTWARE ENGINEERING INSTITUTE | CARNEGIE MELLON UNIVERSITY ii
Distribution Statement A: Approved for Public Release; Distribution is Unlimited
6 Discussion 22 6.1 Specific Threats to ICS 22 6.2 Challenges in Configuring an ICS Honeynet 22 6.3 Implications for the Defense of ICS Networks 23
7 Future Work 24
8 Conclusion 25
Appendix Example SiLK Queries 26
References 29

CMU/SEI-2016-TR-006 | SOFTWARE ENGINEERING INSTITUTE | CARNEGIE MELLON UNIVERSITY iii
Distribution Statement A: Approved for Public Release; Distribution is Unlimited
List of Figures
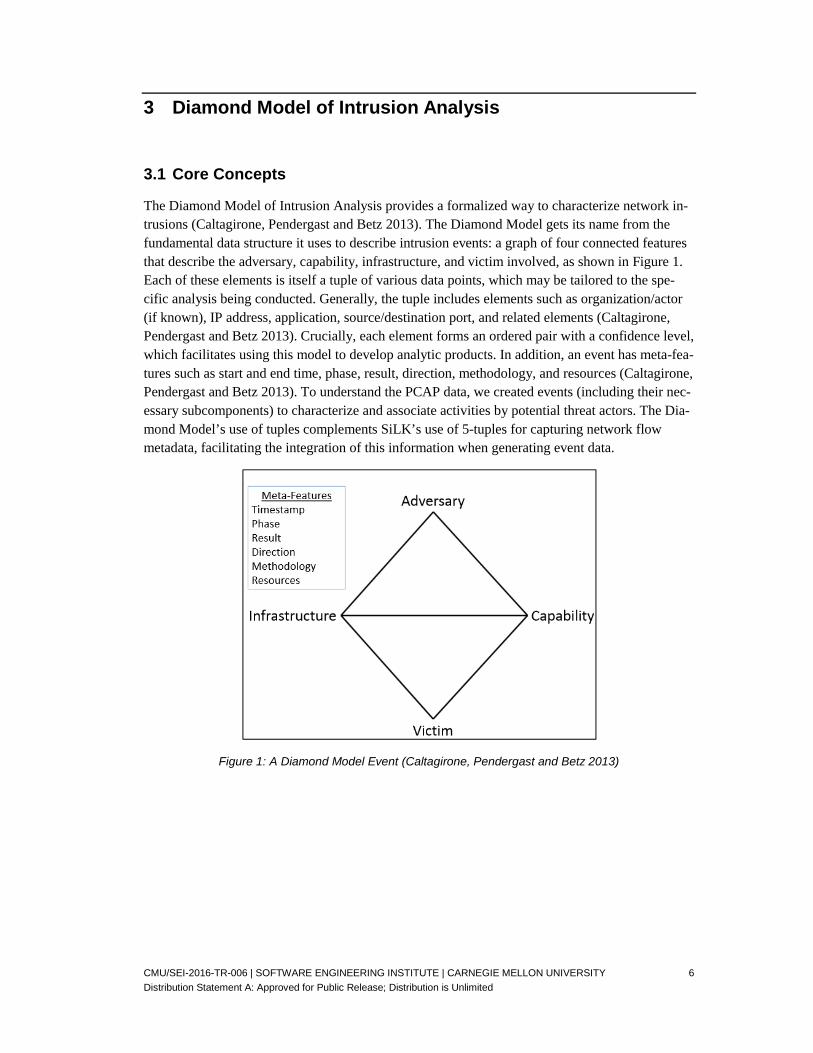
Figure 1: A Diamond Model Event (Caltagirone, Pendergast and Betz 2013) 6

CMU/SEI-2016-TR-006 | SOFTWARE ENGINEERING INSTITUTE | CARNEGIE MELLON UNIVERSITY iv
Distribution Statement A: Approved for Public Release; Distribution is Unlimited
List of Tables
Table 1: Diamond Model Variables 8
Table 2: Honeynet Host Configuration 14
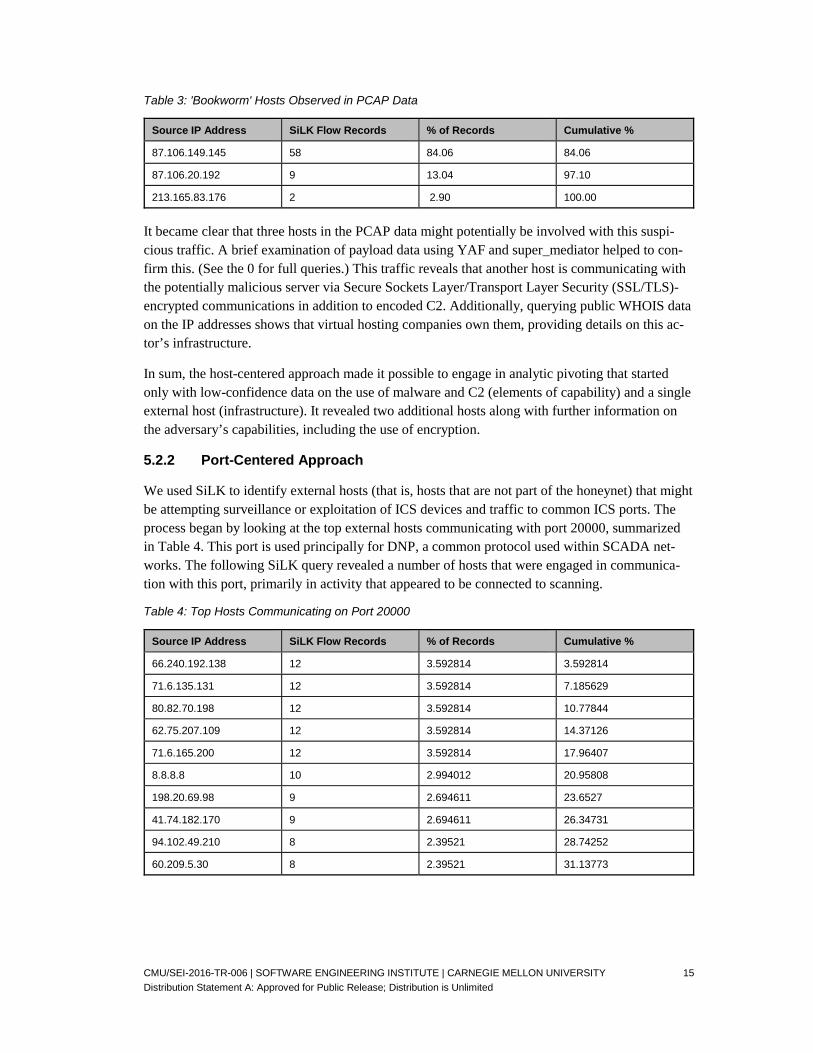
Table 3: 'Bookworm' Hosts Observed in PCAP Data 15
Table 4: Top Hosts Communicating on Port 20000 15
Table 5: Top Hosts Communicating on Port 102 16
Table 6: Common ICS-Related Ports Observed in Data Set 17
Table 7: Selected Active Threat Actors 18
Table 8: Selected High-Risk Actors 19
Table 9: MT2 Exploit Attempts Observed 20
Table 10: Selected Moderate-Risk Actors 21

CMU/SEI-2016-TR-006 | SOFTWARE ENGINEERING INSTITUTE | CARNEGIE MELLON UNIVERSITY v
Distribution Statement A: Approved for Public Release; Distribution is Unlimited
Acknowledgments
We would like to thank Leigh Metcalf for assistance with gathering data from internal databases that we used in our analysis.

CMU/SEI-2016-TR-006 | SOFTWARE ENGINEERING INSTITUTE | CARNEGIE MELLON UNIVERSITY vi
Distribution Statement A: Approved for Public Release; Distribution is Unlimited
Abstract
The use of a honeynet—a network of seemingly vulnerable machines designed to lure attackers—is an established technique for collecting threat intelligence across various network environments. As a result, organizations have begun to use this approach to protect networked industrial control systems (ICS). Organizations hope to observe attempts to compromise their systems in an isolated environment, enabling them to deploy mitigations and harden their networks against emerging threats.
This report presents an approach to analyzing approximately 16 gigabytes of full packet capture data collected from an ICS honeynet. The data is analyzed in the context of other open source in-formation about known threats to ICS to understand how adversaries interacted with the network and the types of attacks they attempted. To provide a more rigorous approach to characterizing these threat actors, the study employed the well-known Diamond Model of Intrusion Analysis. It applied this model to define and categorize several groups of potential threat actors observed within the data. The study also evaluated the effectiveness of honeynets as a tool for ICS threat intelligence. This report includes several recommendations for their deployment and emphasizes active interaction with external hosts to generate higher quality data.

CMU/SEI-2016-TR-006 | SOFTWARE ENGINEERING INSTITUTE | CARNEGIE MELLON UNIVERSITY 1
Distribution Statement A: Approved for Public Release; Distribution is Unlimited
Introduction
Defending industrial control systems (ICS) is critical to securing critical infrastructure. Given the high probability of a physical impact in the event of a cybersecurity breach, defenders of ICS net-works must understand their adversaries and the capabilities of these actors. Moreover, due to the scale of many organizations employing these systems, prioritizing threats is a major concern when deploying effective threat intelligence and monitoring. A valuable tool for supporting this mission is the honeynet, a sandboxed network of seemingly vulnerable honeypot hosts that mimic produc-tion machines on an organization’s network. A properly configured honeynet can observe threats that may be highly specific to a particular environment, generating valuable data that can inform network defenders. Nevertheless, the volume of data that these systems offer can be daunting and makes generating actionable intelligence difficult.
This study analyzes a collection of unclassified data from an ICS honeynet in an effort to generate useful threat intelligence and prioritization from the data. We applied the Diamond Model of In-trusion Analysis first described by Caltagirone, Pendergast, and Betz (Caltagirone, Pendergast and Betz 2013). This model allows us to characterize events in terms of multiple dimensions, each with underlying data points. In doing so, it is possible to uncover relationships between seemingly unconnected data elements to obtain a better understanding of an organization’s threat profile and provide intelligence-driven defenses.

CMU/SEI-2016-TR-006 | SOFTWARE ENGINEERING INSTITUTE | CARNEGIE MELLON UNIVERSITY 2
Distribution Statement A: Approved for Public Release; Distribution is Unlimited
1 Data Sources
1.1 ICS Honeynet Packet Capture Data
The main data set for this study is a collection of full network packet capture (PCAP) data ob-tained from an undisclosed organization (Undisclosed 2016). The honeynet emulated an ICS net-work at a U.S.-based company in the energy sector. To the extent that could be determined, we observed that hosts on the honeynet included Windows and Windows Server machines. It was not possible to determine the configuration of all devices on the local network, nor was this infor-mation provided with the PCAP data.
Sensors within this network environment captured all incoming and outgoing traffic in the stand-ard libpcap format used by applications like tcpdump and Wireshark. This anonymized data showed the 10 honeypot hosts represented by addresses in the fictitious 0.0.0.0/24 subnet. All In-ternet Protocol (IP) addresses external to the network remained as captured by the network sensor. The PCAP data is available for the date range beginning June 23, 2015, through February 29, 2016. The packet capture ran nearly continuously throughout this time, delivered as individual files for each day. In total, the files contain approximately 16 GB of data. The data set contains traffic from at least 66,936 unique hosts communicating via Transmission Control Protocol (TCP), User Datagram Protocol (UDP), and Internet Control Message Protocol (ICMP), which collectively account for over 99.999% of packets captured.
1.2 Data Issues
1.2.1 Incomplete Record of Activity
While very useful as a source of network interactions between the honeynet and external hosts, the PCAP data used for this analysis occasionally lacks context that would aid a more thorough understanding of certain activity observed within the traffic. For instance, when observing sus-pected malware command-and-control (C2) traffic, it was not possible to observe the initial vector of compromise. It is possible that this traffic was observable at a time prior to that of the first PCAP received, or that the initial compromise occurred over an encrypted connection. Analysis of host-based artifacts could potentially explain this, but this is beyond the scope of this report. The data set is reasonably rich and provides sufficient traffic for analysis. As a selection of data from a larger ongoing project, it will lack context from outside the time frame under analysis.
1.2.2 Lack of Honeynet Configuration Data
Although some basic details on the honeynet have been provided and others can be inferred from data appearing in packet payloads originating form honeypot machines (see Section 5.1), this study treats the honeynet itself as a black box. The configuration of the hosts was not apparent. It also was not possible to reliably determine how they listened for and/or responded to network traffic. This in turn complicates the understanding of adversary attack chains, as the honeynet might not be replying to adversary probes in a way that will prompt further network reconnais-sance or surveillance. This is a common difficulty in honeynet operation and is not specific to this particular example, although the effects are highly visible in this data set.

CMU/SEI-2016-TR-006 | SOFTWARE ENGINEERING INSTITUTE | CARNEGIE MELLON UNIVERSITY 3
Distribution Statement A: Approved for Public Release; Distribution is Unlimited
A related ICS-specific issue is that it is difficult to determine which devices the network is at-tempting to emulate (if any). While this PCAP data originates from an explicitly ICS-based hon-eynet, no other specific configuration details are available. This presents a challenge in using the Diamond Model to analyze intrusion events, as this framework uses data about the victim as an integral part of analysis. However, information derived from the PCAP data allows us to make certain assumptions about the victim, albeit with a lower level of confidence.
1.2.3 Need for Manual Analysis of Certain Data
Because this study seeks emerging threats to ICS, it is difficult to automate many of the steps in data analysis. Caltagirone and colleagues remark that this can be a limitation of the Diamond Model, as there may not be an existing method of automating analysis with the model for every case (Caltagirone, Pendergast and Betz 2013). ICS defense is an emerging field that requires the analysis of many proprietary or specialized protocols; few automated tools satisfy the objectives of this study. As a result, the study included manual data analysis, particularly when examining packet payloads. Although it is possible to engage in automated payload analysis after developing signatures for traffic of interest, it is generally not an option until such traffic has been deter-mined. Even with this possibility, automated analysis was of limited value due to the considerable variety in payloads, traffic types, and hosts from which the data originated. While we may cer-tainly draw useful conclusions from manual analysis, incorporating more automation might help us to discover isolated data or subtle patterns that could be valuable to the study.
1.3 WHOIS and DNS Data
In identifying the hosts present in the honeynet data, we queried various WHOIS and DNS data-bases. These publicly available collections of information associate hostnames with IP addresses and identify the organizations responsible for address spaces and domain names. Many of the or-ganizations that ultimately maintain this information are regional Internet registries such as ARIN and RIPE; we employed online tools that aggregate information from the various open databases, including services such as RobTex and DomainTools. These services also provide cross refer-ences among various DNS databases, autonomous system numbers (ASN), and blacklist infor-mation for many hosts.
1.4 VirusTotal
VirusTotal is an open source database of file analyses incorporating the detection engines of nu-merous commercial anti-malware solutions. In addition to filename analysis, VirusTotal scans and records information on various domains and hosts to track any malware that might have origi-nated from them. This information helped us to determine whether a host that appeared in the honeynet data had a relation to malware distribution or C2. The VirusTotal database also incorpo-rates references to related files and hosts, plus community-submitted information and reports that can provide additional information (VirusTotal 2016).
1.5 Palo Alto Networks’ Threat Intelligence Reports
In late 2015, Palo Alto Networks’ Unit 42 group published two short reports describing a threat actor codenamed “Bookworm.” According to the reports, this actor used malware that primarily

CMU/SEI-2016-TR-006 | SOFTWARE ENGINEERING INSTITUTE | CARNEGIE MELLON UNIVERSITY 4
Distribution Statement A: Approved for Public Release; Distribution is Unlimited
targeted government organizations within the nation of Thailand. Bookworm’s malware and infra-structure featured a high degree of modularity and technical sophistication. The reports, entitled “Bookworm Trojan: A Model of Modular Architecture” and “Attack Campaign on the Govern-ment of Thailand Delivers Bookworm Trojan,” provide an in-depth analysis of the group’s tactics, techniques, and procedures. Additionally, they include indicators of compromise such as hash val-ues and domain names (Scott, Falcone and Cortes 2015).
1.6 Additional Open Source Information
Various publicly available documents provided context and analysis for the PCAP data. These documents included reports by security vendors and researchers, which contained information on malware families, threat actors, and alleged C2 domains that facilitated analysis of certain net-work traffic. Vendor documentation and other publicly available data obtained through Internet research supplied basic facts about the default configurations of applications and devices (such as the default ports used by ICS devices).

CMU/SEI-2016-TR-006 | SOFTWARE ENGINEERING INSTITUTE | CARNEGIE MELLON UNIVERSITY 5
Distribution Statement A: Approved for Public Release; Distribution is Unlimited
2 Tools
A number of tools aided in rapidly analyzing and characterizing members of this large data set. Analysis primarily took place within a Linux environment, supported by a large number of open source tools for network traffic analysis. Research conducted using open source databases com-plemented the artifacts generated by these tools. This analysis and research provided the infor-mation necessary to create the data tuples necessary for analysis with the Diamond Model.
2.1 GNU Core Utilities
The various GNU core utilities, such as grep, cut, and cat, were useful in manipulating large amounts of network traffic data. Since the PCAP data was distributed as separate files, using these tools was especially helpful to analyze many or all of these files collectively.
2.2 SiLK and super_mediator
SiLK, or System for Internet-Level Knowledge, is a suite of tools for analyzing network traffic that was developed by the CERT Division of the Carnegie Mellon Software Engineering Institute (Software Engineering Institute 2016). We used the various SiLK tools considerably throughout the study. SiLK made it possible to query large amounts of network traffic data and understand the overall picture of external host interaction with the honeynet, particularly in terms of time, fre-quency, protocol, and port. In turn, this analysis aided characterization of hosts and events within the context of the Diamond Model. The SiLK tools most commonly used in this study include rwfilter, rwstats, and rwsetbuild. We employed the rwp2yaf2silk tool to generate flow records from the PCAP data.
Another tool developed by the CERT Division, super_mediator, enabled us to process payload data from the PCAP files at scale. We used super_mediator in combination with YAF to extract specific payload data by providing Berkeley packet filter (BPF) rules to the applications. This technique served as a useful alternative to a graphical protocol analyzer (such as Wireshark) for application-layer analysis of the traffic (Software Engineering Institute 2016).
2.3 Shell Scripts
We automated several portions of our analysis with shell scripts that were implemented in GNU Bash. These scripts performed tasks such as converting batches of PCAPs to flow records, ex-tracting event tuples from flow records, organizing data sets, and parsing or converting numerous items from the data set at once.
CMU/SEI-2016-TR-006 | SOFTWARE ENGINEERING INSTITUTE | CARNEGIE MELLON UNIVERSITY 6
Distribution Statement A: Approved for Public Release; Distribution is Unlimited
3 Diamond Model of Intrusion Analysis
3.1 Core Concepts
The Diamond Model of Intrusion Analysis provides a formalized way to characterize network in-trusions (Caltagirone, Pendergast and Betz 2013). The Diamond Model gets its name from the fundamental data structure it uses to describe intrusion events: a graph of four connected features that describe the adversary, capability, infrastructure, and victim involved, as shown in Figure 1. Each of these elements is itself a tuple of various data points, which may be tailored to the spe-cific analysis being conducted. Generally, the tuple includes elements such as organization/actor (if known), IP address, application, source/destination port, and related elements (Caltagirone, Pendergast and Betz 2013). Crucially, each element forms an ordered pair with a confidence level, which facilitates using this model to develop analytic products. In addition, an event has meta-fea-tures such as start and end time, phase, result, direction, methodology, and resources (Caltagirone, Pendergast and Betz 2013). To understand the PCAP data, we created events (including their nec-essary subcomponents) to characterize and associate activities by potential threat actors. The Dia-mond Model’s use of tuples complements SiLK’s use of 5-tuples for capturing network flow metadata, facilitating the integration of this information when generating event data.
Figure 1: A Diamond Model Event (Caltagirone, Pendergast and Betz 2013)

CMU/SEI-2016-TR-006 | SOFTWARE ENGINEERING INSTITUTE | CARNEGIE MELLON UNIVERSITY 7
Distribution Statement A: Approved for Public Release; Distribution is Unlimited
3.2 Analytic Pivoting
The architects of the model describe analytic pivoting as a process that allows an analyst to obtain missing information by combining data from within one of the four primary tuples with other sources of intelligence (Caltagirone, Pendergast and Betz 2013). Analytic pivoting is at the center of this study: it enabled us to assemble details of threats revealed by the honeynet into usable the-ses. In many cases, all but one of the data tuples was evident in an event. To obtain the missing information, we made inferences using data that was shared across seemingly disparate events. We used the two methods described in Section 4.3 to enumerate and connect these data.
3.3 Activity Group Creation
The Diamond Model architects describe the activity group (AG) as “a set of Diamond events and activity threads associated by similarities in their features or processes and weighted by confi-dence” (Caltagirone, Pendergast and Betz 2013). In essence, an AG is a way to relate numerous events in order to grasp the implications of apparently correlated activities and develop effective defenses driven by a complete understanding of the potential threat actor (Caltagirone, Pendergast and Betz 2013). Particularly when considering such a large data set, it is important to have a method for rapidly associating events. AGs complement analytic pivoting by using salient fea-tures to develop an overall characterization of a potential threat actor. This process also makes it possible to establish targeted, robust network defenses.
Our study does not attempt to provide threat attribution, merely the characterization of observable activities relevant to ICS network defense. Additionally, we lack corroborating sources that tie the technical indicators within the PCAP data to specific individuals or organizations. While some in-ference might be possible in the creation of AGs, the events themselves are wholly lacking in ad-versary data. Caltagirone and colleagues observe that this lack of data is a likely situation for most Diamond Model analyses (Caltagirone, Pendergast and Betz 2013).

CMU/SEI-2016-TR-006 | SOFTWARE ENGINEERING INSTITUTE | CARNEGIE MELLON UNIVERSITY 8
Distribution Statement A: Approved for Public Release; Distribution is Unlimited
4 Methodology
4.1 Variables Used
Table 1 contains a list of variables used in this study and their descriptions.
Table 1: Diamond Model Variables
Variable Description
Adv Adversary: the suspected threat actor involved in an Event
AGC Activity Group Creation function
AGS Set of all activity groups in the event space
Cx Confidence level for feature x, used as a weighting factor
Cap Capability: the tools, techniques, and procedures used by the Adversary
E An Event: a vector defined by Adversary, Capability, Infrastructure, and Victim
ET Set of all events and event threads in the data
FVPR Feature vector that satisfies the analytic problem (PR)
Inf Infrastructure: the virtual and physical resources used to support the Adversary
PR Analytic problem
Vic Victim: the organization or individual targeted by an Adversary during an Event
4.2 Partitioning and Identification of ICS Honeynet Data
4.2.1 Characterizing Network Traffic Using SiLK
Due to the large number of unique external hosts identified in the data set (nearly 67,000), it was essential to partition the data set in a way that prioritized the data most likely to yield useful events. Initially, the most straightforward way to accomplish this was to eliminate hosts that did not exchange significant traffic with the honeynet. Note that this did not entirely exclude these hosts from the data set. Initial exclusion of external hosts that generated 10 or fewer flow records reduced the set under consideration by over 90%.
To further reduce the data set, we examined the most frequently contacted hosts. We used WHOIS data to identify the top 10 external hosts that contacted the honeynet, including the Google Public Domain Name System (DNS) service and various Microsoft update servers. While source IP addresses can be spoofed, a cursory examination of payload data showed that the traffic from these hosts appears to be legitimate.

CMU/SEI-2016-TR-006 | SOFTWARE ENGINEERING INSTITUTE | CARNEGIE MELLON UNIVERSITY 9
Distribution Statement A: Approved for Public Release; Distribution is Unlimited
4.2.2 Examination of HTTP POST Data
In addition to conducting high-level characterization of network traffic using SiLK, we inspected the payload data of traffic that we believed would be likely to yield useful information. One such category was Hypertext Transfer Protocol (HTTP) POST requests originating from the honeypot machines. We focused our analysis on these requests because they are frequently used in malware C2 traffic. Pinpointing such traffic in a normal PCAP would be difficult because malicious POST requests would be interspersed with legitimate POST requests. Due to the nature of this honeynet, however, considerably fewer POST requests were observed. Thus, we could inspect the payloads of these requests as generated by YAF and super_mediator to determine whether they contained evidence of C2 traffic or other malicious activity on the network.
4.2.3 Examination of Traffic on Common ICS Ports
Common ICS ports used by major vendors were also important locations for examining traffic. After conducting open source research to generate a list of common ICS ports, we used SiLK to rapidly discover which of these ports were frequently contacted by external hosts. We then used super_mediator to obtain payload data (where relevant) and inspect this data for signs of mali-cious activity.
4.2.4 Diamond Model Event Definition
To use the Diamond Model correctly, it is necessary to define the specific features that character-ize the four components of an event. As described above, an event comprises four elements—ad-versary, capability, infrastructure, and victim—each paired with a corresponding confidence level. = ⟨⟨ , ⟩, ⟨ , ⟩, ⟨ , ⟩, ⟨ , ⟩⟩ Beyond the fundamental definition of an event provided by Caltagirone and colleagues, we are free to select the data tuples that are pertinent to our analysis. We define the event features as fol-lows. Looking first at the adversary, this feature is a null set in the context of this study. ⟨ , ⟩ = ⟨∅⟩ Our definition of capabilities provides an opportunity to define certain features that highlight the extensibility of the Diamond Model and, in turn, its usefulness as a tool for defending specialized networks. We define capability by port scanning use, exploit use, malware use, C2 use, and ICS awareness. ⟨ , ⟩= ⟨⟨ , ⟩, ⟨ , ⟩, ⟨ , ⟩, ⟨ 2, ⟩, ⟨ , ⟩⟩ The first four features of the capability tuple apply to many cyber threats, not just those targeting ICS. Capabilities used against ICS networks overlap significantly with those used against tradi-tional networks. As Assante and Lee observe, ICS attack chains tend to follow a dual-staged ap-proach, the first of which essentially mirrors an attack on a traditional corporate network (Assante and Lee 2015). For this reason, we also include an ICS feature that shows an adversary’s apparent ability to differentiate ICS networks. We can assess this ability by examining an indicator such as considerable scanning of ICS-specific ports or the use of exploits that target a control system.

CMU/SEI-2016-TR-006 | SOFTWARE ENGINEERING INSTITUTE | CARNEGIE MELLON UNIVERSITY 10
Distribution Statement A: Approved for Public Release; Distribution is Unlimited
Moving to infrastructure, we include features that account for the resources used by typical threat actors, including those with advanced capabilities. These resources include IP address, source port, operating system, domain or host name, hosting type, and proxy use. ⟨ , ⟩= ⟨⟨ , ⟩, ⟨ , ⟩, ⟨ , ⟩, ⟨ , ⟩, ⟨ , ⟩, ⟨ , ⟩⟩ These details describe the fundamental attributes of resources used by an adversary. In some anal-yses, infrastructure can also include physical assets used by the attacker. This would certainly be relevant to analysis of ICS threats. For instance, an advanced attacker who manages to infiltrate the premises of an organization could install compromised ICS hardware or software. However, this is likely not pertinent to the examination of honeynet traffic. While most of the features defin-ing Infrastructure are relatively straightforward, hosting type is worth describing further. Hosting type draws upon the observation by Caltagirone and colleagues that there are two principal types of infrastructure: Type 1 “is fully controlled or owned by the adversary” while a third party pro-vides Type 2 infrastructure (whether legitimately acquired or compromised by the adversary).
Unlike the adversary, we hold a significant amount of data on the victim. All targeted infrastruc-ture is well defined and has a single operator. A honeynet again lends itself well to analysis with the Diamond Model because it provides a set of known constants that facilitate further explora-tion. For the purposes of this analysis, we describe the victim in terms of organization, target IP address, target port, and target system. ⟨ , ⟩= ⟨⟨ , ⟩, ⟨ , ⟩, ⟨ , ⟩, ⟨ , ⟩⟩ These details are again standard descriptors of an organization targeted by threat actors. The first feature (Org) is constant because all targeted hosts appear within a honeynet operated by a single (undisclosed) organization.The other three features (Target IP, Target Port, and System) are rela-tively easy to obtain from the PCAP data.
4.3 Analytic Pivoting
After we define event tuples for our application of the Diamond Model, we then extract useful event data and attempt to find related features through analytic pivoting. The ultimate goal of the analytic pivoting is to create AGs for threat prioritization. Although an analyst is generally free to define event tuples, it can be difficult to determine which events might be associated with one an-other. To simplify these efforts, we chose two primary methods of identifying actionable event data. The host-centered approach starts with a known host (or set of hosts) believed to have a cor-relation and seeks an association in Layer 3 data such as IP address and hostname. The port-cen-tered approach centers on Layer 4 data (primarily groups of targeted TCP and UDP port numbers) to understand the goal of certain surveillance and exploitation activities. Examples of both tech-niques are provided in Section 5.2.
4.3.1 Host-Centered Approach
The host-centered approach to analytic pivoting focuses on finding relationships among external hosts by examining traffic patterns or characteristics. It potentially yields considerable data, par-ticularly in terms of capability and infrastructure. The host-centered approach generally requires

CMU/SEI-2016-TR-006 | SOFTWARE ENGINEERING INSTITUTE | CARNEGIE MELLON UNIVERSITY 11
Distribution Statement A: Approved for Public Release; Distribution is Unlimited
payload data to be effective because it relies on relationships among transmitted and received data. Despite this, it is one of the more effective approaches to analytic pivoting. It helps to cate-gorize hosts by their activities and provides higher-confidence associations between hosts than re-lating them by common infrastructure (which numerous actors, malicious and otherwise, may share). The Diamond Model allows us to use these features synergistically to uncover additional threat actors.
4.3.2 Port-Centered Approach
When we lack sufficient information to conduct host-centered analytic pivoting, we can use rela-tionships among ports as a starting point. This is particularly useful for an ICS network, which frequently contains devices that communicate on specialized ports rarely used by other services. Accordingly, the port-centered approach can help us to understand adversaries’ capabilities, par-ticularly their levels of ICS awareness.
4.4 Grouping Potential Threat Actors
The fundamental goal of our research is to define a number of AGs that reflect the particular threat that various actors in the data set could pose to the target organization. Notably, we do not define the study’s AGs in an attributive manner. In other words, a single AG might contain a number of distinct actors related by the type of threat they represent instead of their shared con-trol, infrastructure, or techniques.
4.4.1 Defining the Activity Group Creation Function
Caltagirone and colleagues define the activity group creation (AGC) function in terms of three in-dependent variables: an analytic problem, a feature vector that aligns with the analytic problem under consideration, and the set of events that constitute the various AGs. This combination yields a set of all AGs. In notation, the Diamond Model defines this set as follows (Caltagirone, Pendergast and Betz 2013). , , → = , , … ,
As discussed previously, this study seeks to solve the analytic problem of grouping actors based on their potential to have an adverse impact on the ICS network. One of the most important fea-tures in this context is ICS awareness. An actor whose actions demonstrate a focus on ICS gives it an elevated threat potential relative to one engaged in similar activities with no apparent interest in these systems. Beyond this, another feature in the Capability vector that helps to determine AGs is the presence of one or more of C2, malware, exploit attempts, or port scanning. This group of features helps to sort the events by severity because they correspond, in descending order, to steps in a network attack chain. This means that an actor with established C2 inherently represents a higher threat than one merely engaged in port scanning.
While these two clusters of features from the Capability attribute provide a clear description of threat potential, we can further clarify the potential threat through certain Infrastructure character-istics. IP address and domain are particularly relevant here because they correspond to infrastruc-ture used by known (or suspected) threat actors. This information is helpful in characterizing ac-tors within this data set.

CMU/SEI-2016-TR-006 | SOFTWARE ENGINEERING INSTITUTE | CARNEGIE MELLON UNIVERSITY 12
Distribution Statement A: Approved for Public Release; Distribution is Unlimited
Using notation again, we define the feature vector for this analytic problem as follows. = ⟨ , 2 ∨ ∨ ∨ , , ⟩ We define the final component of the function, ET, as the entire set of honeynet data under con-sideration. Note that the AGC function is not required to place every event into an AG. These un-grouped events are considered to be outliers. Most of the events in this data set fall within this cat-egory, as the vast majority of external hosts send just a few packets to the honeynet machines with no apparent relation to other actors. This lack of data makes it difficult to categorize these hosts in any meaningful way.

CMU/SEI-2016-TR-006 | SOFTWARE ENGINEERING INSTITUTE | CARNEGIE MELLON UNIVERSITY 13
Distribution Statement A: Approved for Public Release; Distribution is Unlimited
5 Results
5.1 Honeynet Configuration
We did not possess configuration details for the honeynet. Instead, we inferred its configuration from the PCAP data. There are 10 observable hosts within the honeynet. Each has an anonymized IP address within the 0.0.0.0/24 range. It is not clear in all instances which operating system each honeypot machine is running. To investigate this further, we inspected traffic originating from the honeypot hosts for banners and other artifacts that could offer a perspective on these details. Ulti-mately, it constitutes an integral part of our understanding of the victim in the context of the Dia-mond Model.
Additionally, it is worth noting the apparent behavior of these hosts with respect to network inter-actions. While it is unclear from the data how the hosts on the honeynet communicated with the wider Internet, it appears that most packets received went unanswered. For instance, most SYN packets observed in the apparent port scanning activities received neither an acknowledge (ACK) packet nor a reset (RST) in response, as might ordinarily be expected. We collected comparatively richer data from UDP traffic, as the connectionless nature of this protocol meant that a successful handshake was not required to see the majority of traffic exchanged. The honeynet generally did not respond to any datagrams it received, potentially precluding further data transfer.
It is clear from inspecting the traffic that a number of honeynet hosts are running Microsoft Win-dows. The various external hosts with which they communicate corroborate this assumption. This includes known Windows update servers as well as the Teredo service (which is usually enabled by default in Windows Vista and newer, but is less common on other operating systems). Several hosts generate traffic of this type, asserting with high confidence that they are running a similar version of Windows. One host additionally appears to be acting as a server, as it sends HTTP Sta-tus Code 200 OK responses to some external hosts reaching it on port 80. This machine’s network traffic header shows that it is running Microsoft Internet Information Services (IIS) Version 7.5. The version of Microsoft IIS aligns with either Windows Server 2008 R2 or a Windows 7 host acting as a server. Both Microsoft operating system versions support this version of IIS by default.
Host 0.0.0.20 was the only other server that generated sufficient traffic to infer its configuration and did not appear to be Windows-based. This host made requests to servers that provide signa-ture data for the Bro network security monitoring system, which is available only on Unix-like operating systems. Other traffic generated by this host, such as Online Certificate Status Protocol (OCSP) and Network Time Protocol (NTP), differed from requests made by the Windows hosts. These protocols are implemented on a number of different platforms, however, making the mere presence of this traffic inconclusive as evidence of the host’s configuration.
The five remaining hosts did not generate sufficient traffic to determine their configuration from a PCAP file. While a few of these hosts do respond to traffic received from the external network, the traffic observed consists primarily of ICMP echo responses. ICMP echo responses reveal little about a given host’s underlying operating system or software.
A summary of hosts and their relevant configuration details is shown in Table 2.

CMU/SEI-2016-TR-006 | SOFTWARE ENGINEERING INSTITUTE | CARNEGIE MELLON UNIVERSITY 14
Distribution Statement A: Approved for Public Release; Distribution is Unlimited
Table 2: Honeynet Host Configuration
Host Suspected OS / Configuration
0.0.0.2 Microsoft Windows Server 2008 R2 / Windows 7 (Microsoft IIS 7.5)
0.0.0.3 Unknown
0.0.0.4 Unknown
0.0.0.5 Microsoft Windows (Vista or later)
0.0.0.6 Unknown
0.0.0.7 Unknown
0.0.0.8 Unknown
0.0.0.9 Microsoft Windows (Vista or later)
0.0.0.20 Linux
0.0.0.21 Microsoft Windows (Vista or later)
5.2 Characterization of Threat Actors Through Analytic Pivoting
As discussed earlier, we incorporated analytic pivoting in our analysis as a way to correlate vari-ous items of event data that might not appear related upon initial examination. This facilitated the creation of AGs by providing higher quality data used in determining feature vectors.
5.2.1 Host-Centered Approach
An example of the host-centered approach to analytic pivoting used in this study was in the char-acterization of traffic believed to be associated with malware C2. This was initially discovered in an examination of all HTTP POST requests captured. We isolated this data using a shell script that automatically extracted 100 bytes of application-layer data from all POST requests on ports 80 and 8080 with YAF and super_mediator. (See the 0 for full queries.)
A POST request with a long, encoded URI and an unfamiliar hostname in the HTTP Host header suggested that this might be malicious traffic worth investigating. Searching the domain on Vi-rusTotal revealed its possible connection to the infrastructure of an intrusion campaign reported by Palo Alto Networks under the codename “Bookworm” (Scott, Falcone and Cortes 2015). It is unclear whether this traffic corresponds to the same actor, as groups tend to abandon infrastruc-ture upon publication of their activities. Nevertheless, it provides a starting point for the host-cen-tered approach to analytic pivoting.
Based on this information, we constructed further queries to investigate the activity present in the PCAP and discover more about the potential adversary. Using the list of IP addresses that Palo Alto Networks provided in their reports, we prepared a set file for use with SiLK’s rwfilter tool (Scott, Falcone and Cortes 2015). We then conducted a search of this set for additional suspi-cious hosts, which are listed in Table 3.
CMU/SEI-2016-TR-006 | SOFTWARE ENGINEERING INSTITUTE | CARNEGIE MELLON UNIVERSITY 15
Distribution Statement A: Approved for Public Release; Distribution is Unlimited
Table 3: 'Bookworm' Hosts Observed in PCAP Data
Source IP Address SiLK Flow Records % of Records Cumulative %
87.106.149.145 58 84.06 84.06
87.106.20.192 9 13.04 97.10
213.165.83.176 2 2.90 100.00
It became clear that three hosts in the PCAP data might potentially be involved with this suspi-cious traffic. A brief examination of payload data using YAF and super_mediator helped to con-firm this. (See the 0 for full queries.) This traffic reveals that another host is communicating with the potentially malicious server via Secure Sockets Layer/Transport Layer Security (SSL/TLS)-encrypted communications in addition to encoded C2. Additionally, querying public WHOIS data on the IP addresses shows that virtual hosting companies own them, providing details on this ac-tor’s infrastructure.
In sum, the host-centered approach made it possible to engage in analytic pivoting that started only with low-confidence data on the use of malware and C2 (elements of capability) and a single external host (infrastructure). It revealed two additional hosts along with further information on the adversary’s capabilities, including the use of encryption.
5.2.2 Port-Centered Approach
We used SiLK to identify external hosts (that is, hosts that are not part of the honeynet) that might be attempting surveillance or exploitation of ICS devices and traffic to common ICS ports. The process began by looking at the top external hosts communicating with port 20000, summarized in Table 4. This port is used principally for DNP, a common protocol used within SCADA net-works. The following SiLK query revealed a number of hosts that were engaged in communica-tion with this port, primarily in activity that appeared to be connected to scanning.
Table 4: Top Hosts Communicating on Port 20000
Source IP Address SiLK Flow Records % of Records Cumulative %
66.240.192.138 12 3.592814 3.592814
71.6.135.131 12 3.592814 7.185629
80.82.70.198 12 3.592814 10.77844
62.75.207.109 12 3.592814 14.37126
71.6.165.200 12 3.592814 17.96407
8.8.8.8 10 2.994012 20.95808
198.20.69.98 9 2.694611 23.6527
41.74.182.170 9 2.694611 26.34731
94.102.49.210 8 2.39521 28.74252
60.209.5.30 8 2.39521 31.13773

CMU/SEI-2016-TR-006 | SOFTWARE ENGINEERING INSTITUTE | CARNEGIE MELLON UNIVERSITY 16
Distribution Statement A: Approved for Public Release; Distribution is Unlimited
PCAP data from the hosts in Table 4 may not be particularly useful on its own, as it does not in-clude payload data or even information on TCP flags. By using the port-centered approach, we may query other common ICS ports to begin building a more complete picture of reconnaissance activity taking place against the honeynet. The second SiLK query examined traffic on port 102. A major brand of programmable logic controllers (PLC) commonly uses this port for control com-munications. We cross-referenced this output with the hosts communicating with port 20000. Hosts that were present in Table 4 appear with an asterisk next to their IP address in Table 5.
Table 5: Top Hosts Communicating on Port 102
Source IP Address SiLK Flow Records % of Records Cumulative %
188.138.1.218 32 6.299213 6.299213
80.82.70.198* 30 5.905512 12.20472
125.97.246.5 27 5.314961 17.51969
52.88.94.127 19 3.740157 21.25984
198.20.69.98* 16 3.149606 24.40945
94.102.49.210* 14 2.755906 27.16535
120.119.31.1 14 2.755906 29.92126
71.6.135.131* 13 2.559055 32.48032
131.107.13.100 13 2.559055 35.03937
66.240.192.138* 13 2.559055 37.59843
Again, this analysis approach helps us to prioritize hosts that might have a high ICS awareness—and accordingly, a higher potential threat level. The top ports contacted by the first denoted host, 80.82.70.198, were enumerated in SiLK. (See the 0 for full details.) A number of these ports had ICS functions, including nearly all of the ports listed in Table 6, which describes the known ICS-related ports contacted by external hosts.

CMU/SEI-2016-TR-006 | SOFTWARE ENGINEERING INSTITUTE | CARNEGIE MELLON UNIVERSITY 17
Distribution Statement A: Approved for Public Release; Distribution is Unlimited
Table 6: Common ICS-Related Ports Observed in Data Set
TCP Port Device or Protocol
102 Siemens PLC
502 Modbus protocol
1962 Phoenix Contact ILC PLC/ProConOS
2404 IEC 60870-5-104
2455 Wago I/O System
4592 Advantech/Broadwin
4840 Certec Atvise SCADA
9600 Omron PLC
10001 RS-485 to Ethernet
18245 GE PLC
20000 DNP (SCADA/ICS common protocol)
20547 ProConOS/MultiProg PLC
44818 Rockwell Automation Ethernet/IP
49320 Kepware KEPServerEX
The host 80.82.70.198 contacted just 19 ports, far fewer than would be targeted by a generic Net-work Mapper (Nmap) tool scan, which typically scans up to 1,000 ports. Examining the traffic payload with YAF and super_mediator also showed that these were merely TCP Synchronize (SYN) packets with no further traffic, a technique frequently associated with port scanning activ-ity. Over 70% of the ports scanned have a known association with ICS, and the others may relate to less well-known or documented ICS protocols.
External host 80.82.70.198 exclusively focused on these ports, revealing a high degree of ICS awareness that helps to characterize the actor’s capability. However, this particular host does not appear to be malicious. It is part of a China-based project, “ICS/SCADA/PLC Protocol Global Census,” that is conducting scans on common ICS ports (Unknown 2016). The project has pro-duced research on ICS devices, including some of those associated with ports listed in Table 6. It allows organizations to opt out of scanning by emailing the research team.
This case study shows the benefits of the port-centered approach. By using known associations among ports, analytic pivoting revealed a potential emerging threat to the ICS network. An ana-lyst could extend and automate this technique to simplify gathering intelligence about ICS threats.

CMU/SEI-2016-TR-006 | SOFTWARE ENGINEERING INSTITUTE | CARNEGIE MELLON UNIVERSITY 18
Distribution Statement A: Approved for Public Release; Distribution is Unlimited
5.3 Using Honeynet Data to Group Actors
Now that we have enumerated the overall feature space and the feature vector used in our AGC, we can provide relevant groupings of threat actors. This provides the rapid, actionable characteri-zation of actors in the PCAP data in a manner that satisfies the analytic problem. The overall pro-cess aligns with the goal of this study in developing a sound methodology for categorizing threats to an ICS network based on the Diamond Model.
5.3.1 Active Threat Actors
We define active threat actors as entities whose actions provide a high-confidence indication that they are actively in the process of attacking the network. This is unrelated to a focus on ICS, though an active, ICS-focused attack represents the most serious type of event within this AG. To fall within this category, an adversary must have demonstrated the delivery of malware or the es-tablishment of C2 communications.
One example of an active threat actor identified in the data is the adversary shown in Table 7 (which was discussed previously). It is suspected of having established C2 with two hosts on the honeynet (20% of all hosts). It is unclear which objectives are held by this actor: some of this C2 traffic is encrypted and no host-based artifacts are available. Nevertheless, the presence of this traffic indicates with high confidence a compromise of the network.
While this is the most useful group for generating actionable threat data, it is paradoxically the AG for which we have the fewest events. One possible explanation is a general lack of interaction from the honeypot machines. As mentioned in Section 5.1, the honeynet did not exhibit a great deal of interaction with external hosts. It also did not accept TCP incoming connection requests on any port. Given this situation, if it appeared to an attacker that few or no ports were listening for connections, it would logically follow that few exploit attempts ensued. It would appear to the attacker that no service is listening for connections on this port or that a firewall is in place.
Table 7: Selected Active Threat Actors
Actor ID Attributes Reason for grouping Event Timeline
AT1
IP {87.106.149.145, 87.106.20.192, 213.165.83.176}; Port {80, 443}; Domain {bkmail[.]blogdns[.]org} Malware; C2; Proxy; Type 2 Infrastructure
High confidence indication of malware C2 traffic
12/16/2015 19:41 -12/16/2015 20:08
5.3.2 High-Risk Actors
We may consider high-risk actors in the context of their demonstrated or suspected capability to have an adverse impact on an ICS network. This could be due to active but unsuccessful attempts at exploitation that demonstrate either an interest in ICS or some familiarity with the victim’s net-work. An actor that appears to be sending traffic associated with common exploits en masse is not necessarily a high-risk actor. Numerous botnets and other malicious hosts engage in constant at-tempts to compromise unpatched hosts. This should not represent a high level of risk for an organ-ization with appropriate baseline security measures in place.
Reconnaissance can also represent a high level of risk. The activities of the host in Table 8 would place it within the high-risk category. This host (80.82.70.198) was identified as collecting data

CMU/SEI-2016-TR-006 | SOFTWARE ENGINEERING INSTITUTE | CARNEGIE MELLON UNIVERSITY 19
Distribution Statement A: Approved for Public Release; Distribution is Unlimited
for the “ICS Census” noted in Section 5.2.2. While this particular host appears to be connected with research activities, incident responders should prioritize hosts such as this for further review and triage. This type of network activity could represent an early stage of an actual attack. If such targeted port scanning is indeed malicious, it provides incident responders with valuable intelli-gence on the adversary’s capabilities and interests.
Table 8: Selected High-Risk Actors
Actor ID Attributes Reason for grouping Event Timeline
HT1 IP {80.82.70.198}; Port {[19 common ICS ports]}; Domain {icsresearch[.]plcscan[.]org}; ICS; Port scan
Focused scanning of known ICS ports without clear mali-cious objective
7/8/2015 05:19 - 2/17/2016 16:49
5.3.3 Moderate-Risk Actors
Moderate-risk actors constitute the AG with the lowest level of risk that retains the potential to have an impact on the network. These actors have not actively attempted to exploit hosts on the network, but instead are engaged in reconnaissance activity. Due to the proliferation of scanning activity undertaken by many parties for many purposes, a number of hosts and other groups fall within the moderate risk category.
A group of moderate-risk actors is a large section of the hosts that appear to be heavily engaged in port scanning activity. As they all tend to originate scanning activity from port 6000, we can link them through the port-centered approach. Subnet and ASN also link these actors on a host-cen-tered basis. All of the hosts in these groups originate within address space associated with China. This does not attribute those hosts as being Chinese in origin, as their immediate origins could easily be proxies or virtual hosts. This association shows that a considerable amount of traffic shares a common affiliation in terms of infrastructure and capabilities.
The remaining high-risk actors are engaged in automated attempts to exploit well-known vulnera-bilities. We assigned only a moderate level of risk to these actors because we believe they do not represent a significant threat to the vast majority of enterprises. Patches are widely available to remediate all of these vulnerabilities, and most security solutions can detect and block these at-tempts at the network perimeter. It is still worth considering these three actors (MT2, MT3, and MT4 in Table 10) briefly to understand the characteristics of their activities.
MT2 is perhaps the most interesting of the three AGs in this set that make exploit attempts. The hosts in this group generate two distinct types of traffic. The first is the apparent exploitation payload, an HTTP GET request (see Table 9 for full request). Open source research has not indicated the nature of this traffic. Some security blogs and forums have speculated that it is an attempt to scan or attack Apache servers, although it is unclear whether it is an effective exploit. We observed the host 185.130.5.224 transmitting these packets. This activity did not appear to have an impact on the server, possibly because it was running Microsoft IIS rather than Apache.
Another category of traffic generated by this host (and others associated through host-centered analytic pivoting) initially resembled an attempt at exploiting the “Shellshock” vulnerability (CVE-2014-6271, etc.). However, it appears that this exploit string (see Table 9) might actually indicate an attempt by malware to compromise the device. Variations on the following string, which appeared to be a Linux command, appeared several times in the PCAP. While a packet

CMU/SEI-2016-TR-006 | SOFTWARE ENGINEERING INSTITUTE | CARNEGIE MELLON UNIVERSITY 20
Distribution Statement A: Approved for Public Release; Distribution is Unlimited
payload such as this one resembles a Shellshock exploitation string, it was distinct because it targeted UDP port 53413 rather than TCP ports 80 or 8080 (the ports most commonly targeted by Web-based Shellshock attacks). UDP 53413 is not associated with any established service. However, it was tied to a vulnerability in Netcore/Netis brand routers disclosed in 2014 that can allow remote shell access to the device through this port (Yeh 2014).
Table 9: MT2 Exploit Attempts Observed
Description Exploit String
Unknown exploit string possibly targeting Apache servers
GET /server-status?HTTP_POST=%”%6346#%#/ˠ%”#423|;&HTTP_CGI_GET=GRESYYK”K&J#L523D2G23H23 HTTP/1.1
Likely Netis/Netcore exploit string found in Gafgyt/Bashlite malware (other variations observed)
busybox tftp –g –r m.sh 185.130.5.201|| tftp –g –r m.sh 185.130.5.201; busybox chmod +x m.sh
With this router vulnerability in mind, we discovered this string in a publicly available analysis of a malware sample affiliated with a family of malware known as “Bashlite” or “Gafgyt” (VirusTotal 2016). Researchers at Avast associated this malware with distributed denial-of-service (DDoS) attacks initiated by the Lizard Squad threat actor (Kalnai and Horejsi 2015). This research as well as analysis by security journalist Brian Krebs reveals that the group developed malware that spreads by exploiting known vulnerabilities in home routers (Krebs 2015). It creates a botnet from these devices that is then used to run an illicit online service that performs DDoS attacks for hire (Kalnai and Horejsi 2015). Based on an open source list of IOCs for this malware family (Malwr Posts 2015), we searched the CERT/Coordination Center (CERT/CC) Artifact Catalog for matching samples; nine were found. We encountered a Busybox command in eight of the samples and a nearly identical string to the one found in the PCAP in four samples, offering an increase in confidence that the traffic observed relates to Bashlite or Gafgyt.
Two other threat actors in this set are engaged in attempts to exploit known vulnerabilities in pop-ular technologies. The first actor, MT3, sends traffic characteristic of an attempt to exploit CVE-2013-5122. This is a vulnerability in the remote management interface of Linksys routers that fa-cilitated the spread of a worm known as “TheMoon.” Identifying this traffic as an attempt to ex-ploit the Linksys vulnerability was a straightforward process. The traffic payload contains HTTP POST requests for the page tmUnblock.cgi, which is closely correlated with this exploit. Fi-nally, AG MT4 contained hosts attempting to exploit several related vulnerabilities in older ver-sions of PHP that allow for arbitrary code execution. Again, the exploit strings contained HTTP POST requests that were characteristic of attempts to exploit the vulnerability.
In the context of honeynet operation, it may be advisable to identify hosts such as these for further investigation. If they are deemed merely to be part of routine scanning of the network that is un-likely to pose a further threat, implementing firewall rules that block these hosts would improve the signal-to-noise ratio within the data set. However, this should take place only if the analyst un-derstands how removing these hosts from consideration affects the data set.

CMU/SEI-2016-TR-006 | SOFTWARE ENGINEERING INSTITUTE | CARNEGIE MELLON UNIVERSITY 21
Distribution Statement A: Approved for Public Release; Distribution is Unlimited
Table 10: Selected Moderate-Risk Actors
Actor ID Attributes Reason for grouping Event Timeline
MT1
IP {[Numerous China-based IP ad-dresses]}; Port {TCP 6000 (source), [Nu-merous common destination ports]}; Port scan
Extensive scanning of com-mon TCP ports
7/8/2015 05:19 – 2/17/2016 16:49
MT2
IP {185.130.5.224, 185.130.5.201, 46.28.207.30}; Port {TCP 80, UDP 53413}; Exploit; Malware
Automated scanning / ex-ploitation attempt targeting Apache Web servers; possi-ble attempted exploitation of ‘Shellshock’ vulnerability (CVE-2014-6271 etc.)
12/23/2015 23:07 – 2/22/2016 05:34
MT3
IP {69.164.231.228, 77.70.58.205}; Port {80}; Port scan; Exploit
Automated attempts to ex-ploit TheMoon vulnerability (CVE-2013-5122) in Linksys devices
11/22/2015 17:13 – 12/18/2015 19:07
MT4
IP {117.21.226.160, 119.235.66.243}; Port {TCP 23, 80, 8081}; Port scan; Exploit
Automated attempts to ex-ploit CVE-2012-1823/CVE-2012-2311/CVE-2012-2336 in PHP
7/9/2015 03:01 – 10/3/2015 12:28
5.3.4 Unknown-Risk Actors / Outliers
The final group of events under consideration does not directly constitute an AG. Instead, it com-prises the set of data that falls outside all other groups: outliers. We need to understand how to in-terpret the set of outliers for threat potential. Many of the events in the set of outliers are likely to be non-malicious. A considerable amount of traffic observed in the PCAP data was connected to known servers used for software updates, standard DNS queries, and WHOIS lookups. This traf-fic might correspond to malicious activities and, accordingly, we should not discard it on this ba-sis alone. However, a review of this traffic strongly suggests that it does not represent a threat.
Another large set of events formally grouped with the set of outliers is better termed “unknown risk” traffic. This data primarily falls within this category due to a lack of event data for a given host, port, or application, or because it is not possible to link a specific event reliably to others within the data set. It would be unwise to treat this data as useless or classify it as certainly non-malicious. It is important to revisit the data set in its entirety as more information becomes availa-ble. A material change in traffic observed can strongly affect the assumptions underpinning the AGC function. Caltagirone and colleagues recommend the periodic review of data and updating of the function in an effort to keep the information current and actionable (Caltagirone, Pendergast and Betz 2013). This would certainly be a prudent recommendation for honeynet data.

CMU/SEI-2016-TR-006 | SOFTWARE ENGINEERING INSTITUTE | CARNEGIE MELLON UNIVERSITY 22
Distribution Statement A: Approved for Public Release; Distribution is Unlimited
6 Discussion
6.1 Specific Threats to ICS
The honeynet afforded us a rich data set for consideration. The data offered an opportunity to ob-serve a variety of different activities with over 16 GB of traffic exchanged with tens of thousands of external hosts. As the focus of this effort was the enumeration and characterization of threats to ICS, it is worth discussing how these threats manifested within the data considered. Notably, while the data showed a variety of malicious traffic, few ICS-specific threats were observed. The vast majority of traffic was generic scanning of some of the most commonly used ports across in-dustries, such as Telnet, Secure Shell (SSH), Virtual Network Computing (VNC), Server Message Block (SMB), and other protocols. While this is relevant to ICS network defense, it does not nec-essarily reveal ICS-specific threats.
Analytic pivoting and AG creation unmasked potential threats to ICS. It was helpful to examine traffic exchanged on common ICS ports as well as by hosts involved in ICS-focused scanning ac-tivities. While scanning activity can indicate threat potential, it ultimately reveals the adversary’s capabilities to a limited extent. The PCAPs contained very little data on specific attempts to inter-act with ICS devices, exploit vulnerabilities, or install malware. One possible explanation is that an adversary would not be likely to compromise an ICS device directly from the Internet. Most ICS attack campaigns follow the two-phased approach (Assante and Lee 2015). This leads to a second possibility: the honeynet did not attract attacks on ICS due to its configuration.
6.2 Challenges in Configuring an ICS Honeynet
Given the lack of ICS-focused surveillance—and especially attacks—observed in the PCAP data, it seems plausible that the honeynet was not optimized for collecting this type of data. As men-tioned above, analyzing the traffic revealed several important details, primarily that a number of the hosts appeared to be standard Windows or Linux machines without an obvious ICS purpose. It is possible that some of the hosts with unknown configuration details were emulating ICS devices. However, there was insufficient evidence in the data set to support this view. Based on the config-uration and behavior of the hosts observed in the data set, it appears that this honeynet was a “low-interaction” honeynet. That is, the honeypot machines provide little to no response to re-quests made by external hosts, and as a result, an adversary is usually unable to compromise the hosts. Provos and Holz observe that such a configuration is advantageous for its low resource de-mand as well as the decreased risk inherent in denying attackers an opportunity to compromise even this isolated network. However, the tradeoff made for these benefits is that low-interaction honeynets generally provide sparser attack data. They are unlikely to capture evidence of zero-day exploits or other high-value information (Provos and Holz 2008).
Although the evidence supports the view that this is a low-interaction honeynet, it does not intrin-sically follow that it yields no actionable information about attacks on ICS. We highlighted evi-dence of ICS-focused network scanning and apparent malware C2, showing that a variety of use-ful threat data was present within the PCAP files. Nevertheless, it seems that relatively little new information on ICS defense was obtainable from the honeynet. It is possible that the low-interac-tion nature of the system caused scanning and enumeration tools to report that this was not an ICS

CMU/SEI-2016-TR-006 | SOFTWARE ENGINEERING INSTITUTE | CARNEGIE MELLON UNIVERSITY 23
Distribution Statement A: Approved for Public Release; Distribution is Unlimited
network. Additionally, a cursory examination of the source code of open source ICS scanning tools suggests that these tools expect very specific responses from a host to confirm that it is in-deed the device in question. This likely inhibited further action by external actors who might oth-erwise attempt to compromise ICS devices.
6.3 Implications for the Defense of ICS Networks
The configuration of this honeynet yielded a relatively small amount of useful intelligence on ICS threats. An effective ICS honeynet should employ techniques to convince potential adversaries that it truly hosts ICS devices. This will likely require a higher level of interaction with external hosts than we observed in the PCAP data. It is also likely that to be effective, an ICS honeynet must faithfully emulate actual ICS devices and protocols. A passive host may collect information on scanning and automated exploit attempts, but this does not afford a wealth of ICS-specific threat intelligence. Another option is to place actual ICS devices within the honeynet, which have arguably the greatest probability of collecting realistic attack data. Either option may yield useful information. Emulation considerably increases the complexity in configuring and maintaining the honeynet, while the use of real ICS devices would likely incur substantially higher costs than ei-ther a passive or an emulated setup. However, this may reflect the difficulties inherent in using a honeynet, a proven technique for determining network threats. Given this constraint, defenders may wish to weigh the value of the data obtained against the cost and complexity of maintaining an effective ICS honeynet.
CMU/SEI-2016-TR-006 | SOFTWARE ENGINEERING INSTITUTE | CARNEGIE MELLON UNIVERSITY 24
Distribution Statement A: Approved for Public Release; Distribution is Unlimited
7 Future Work
Considering the use of honeynets in the defense of ICS and the applicability of the Diamond Model in generating threat intelligence from this data gives us a number of interesting directions for future study. A natural question that follows this study would be whether our model can be ap-plied to data generated from a high-interaction honeynet composed of real or emulated ICS de-vices. If this yielded additional information on attack patterns, exploitation techniques, and mal-ware, we could populate the data tuples in our model with more information and higher levels of confidence. This in turn could be used to create AGs that are linked by specific attack techniques, shared infrastructure, and other features. Another possibility for further investigation would be au-tomating the generation of ICS threat indicators from PCAP data. This would require a larger amount of information on tactics, techniques, and procedures used by adversaries attempting to attack ICS networks. It might be possible to obtain this data from the aforementioned high-inter-action honeynet. Such a project would be valuable for the considerable threat intelligence it might generate.

CMU/SEI-2016-TR-006 | SOFTWARE ENGINEERING INSTITUTE | CARNEGIE MELLON UNIVERSITY 25
Distribution Statement A: Approved for Public Release; Distribution is Unlimited
8 Conclusion
This study investigated the ways in which a honeynet can generate threat intelligence for the de-fense of ICS networks. Using the 16 GB of PCAP data provided along with various open source data, we applied the Diamond Model of Intrusion Analysis in an effort to understand and priori-tize threats to a hypothetical ICS network. Sources such as WHOIS databases, VirusTotal, and re-ports from security vendors helped us to establish a context for understanding the significance of observed traffic. With this information, we derived data tuples that adequately characterized an event observed in the data and placed it within an AG that properly represents its threat.
While we developed an approach that leverages the Diamond Model to perform threat analysis for an ICS honeynet, we discovered that the specialized nature of this area presents particular de-mands for successful data collection. Primarily, the lack of interaction with external hosts ap-peared to limit the potential usefulness of collected data, particularly with respect to exploitation and malware delivery. In future honeynet deployments, we believe it would be useful to incorpo-rate higher levels of interaction with external hosts and high-fidelity emulation of ICS devices (if not the outright placement of actual control systems on a quarantined network).
It is our hope that this study has offered both a useful approach to the analysis of data collected from an ICS honeynet as well as insights on how this data may be gathered in a way that makes it most useful as a source of threat intelligence. While the difficulties inherent in proper deployment may reduce the value proposition of an ICS honeynet in certain instances, organizations with a high demand for information on ICS threats may well find our techniques useful.

CMU/SEI-2016-TR-006 | SOFTWARE ENGINEERING INSTITUTE | CARNEGIE MELLON UNIVERSITY 26
Distribution Statement A: Approved for Public Release; Distribution is Unlimited
Appendix Example SiLK Queries
Investigation of “Bookworm” Traffic
2015-12-16 19:42:11.461|2015-12-16 19:42:20.682| 9.221| 0.000| 6| 0.0.0.5|59927| 12| 1402|01|00:00:00:00:00:00| 213.165.83.176| 21| 4| 184|00|00:00:00:00:00:00| S| APF| AS| ARS| f5cf8802|6849361c| 0| 0|000| 0| 00| |C1
-> 0000: 50 4f 53 54 20 2f 63 34 34 64 39 33 63 34 62 63 POST /c44d93c4bc
-> 0010: 38 30 31 66 61 32 64 63 63 64 30 37 36 31 39 64 801fa2dccd07619d
-> 0020: 61 33 33 66 38 39 61 35 31 65 39 36 65 63 32 35 a33f89a51e96ec25
-> 0030: 20 48 54 54 50 2f 31 2e 31 0d 0a 48 6f 73 74 3a HTTP/1.1..Host:
-> 0040: 20 62 6b 6d 61 69 6c 2e 62 6c 6f 67 64 6e 73 2e bkmail.blogdns.
-> 0050: 63 6f 6d 0d 0a 43 6f 6e 6e 65 63 74 69 6f 6e 3a com..Connection:
-> 0060: 20 4b 65 65
rwfilter *.rw --dipset=setfiles/honeynet.set --sipset=setfiles/bookworm_susp.set --proto=0- --pass=stdout | rwstats --fields=sip --count=10
INPUT: 69 Records for 3 Bins and 69 Total Records
OUTPUT: Top 10 Bins by Records
sIP| Records| %Records| cumul_%|
87.106.149.145| 58| 84.057971| 84.057971|
87.106.20.192| 9| 13.043478| 97.101449|
213.165.83.176| 2| 2.898551|100.000000|

CMU/SEI-2016-TR-006 | SOFTWARE ENGINEERING INSTITUTE | CARNEGIE MELLON UNIVERSITY 27
Distribution Statement A: Approved for Public Release; Distribution is Unlimited
Investigation of ICS-Scanning Hosts
rwfilter *.rw --dipset=honeynet.set --proto=0,2- --dport=20000 --pass=stdout | rwstats
--fields=sip --count=20
INPUT: 334 Records for 102 Bins and 334 Total Records
OUTPUT: Top 20 Bins by Records
sIP| Records| %Records| cumul_%|
66.240.192.138| 12| 3.592814| 3.592814|
71.6.135.131| 12| 3.592814| 7.185629|
80.82.70.198| 12| 3.592814| 10.778443|
62.75.207.109| 12| 3.592814| 14.371257|
71.6.165.200| 12| 3.592814| 17.964072|
8.8.8.8| 10| 2.994012| 20.958084|
198.20.69.98| 9| 2.694611| 23.652695|
41.74.182.170| 9| 2.694611| 26.347305|
94.102.49.210| 8| 2.395210| 28.742515|
60.209.5.30| 8| 2.395210| 31.137725|
[Trimmed]

CMU/SEI-2016-TR-006 | SOFTWARE ENGINEERING INSTITUTE | CARNEGIE MELLON UNIVERSITY 28
Distribution Statement A: Approved for Public Release; Distribution is Unlimited
rwfilter *.rw --dipset=honeynet.set --proto=0,2- --dport=102 --pass=stdout |
rwstats --fields=sip --count=20
INPUT: 508 Records for 117 Bins and 508 Total Records
OUTPUT: Top 20 Bins by Records
sIP| Records| %Records| cumul_%|
188.138.1.218| 32| 6.299213| 6.299213|
80.82.70.198| 30| 5.905512| 12.204724| *
125.97.246.5| 27| 5.314961| 17.519685|
52.88.94.127| 19| 3.740157| 21.259843|
198.20.69.98| 16| 3.149606| 24.409449| *
94.102.49.210| 14| 2.755906| 27.165354| *
120.119.31.1| 14| 2.755906| 29.921260|
71.6.135.131| 13| 2.559055| 32.480315| *
131.107.13.100| 13| 2.559055| 35.039370|
66.240.192.138| 13| 2.559055| 37.598425| *
[Trimmed]

CMU/SEI-2016-TR-006 | SOFTWARE ENGINEERING INSTITUTE | CARNEGIE MELLON UNIVERSITY 29
Distribution Statement A: Approved for Public Release; Distribution is Unlimited
References
URLs are valid as of the publication date of this document.
Assante, Michael, and Robert Lee. 2015. The Industrial Control System Cyber Kill Chain. Washington, DC: SANS Institute.
Caltagirone, Sergio, Andrew Pendergast, and Christopher Betz. 2013. "The Diamond Model of Intrusion Analysis." Center for Cyber Threat Intelligence and Threat Research, Hanover, MD.
Kalnai, Peter, and Jaromir Horejsi. 2015. DDoS Trojan: A Malicious Concept that Conquered the ELF Format. Prague, Czech Republic: VirusBullitin.
Krebs, Brian. 2015. "Lizard Stresser Runs on Hacked Home Routers." Krebs on Security. January 09. Accessed April 11, 2016. http://krebsonsecurity.com/2015/01/lizard-stresser-runs-on-hacked-home-routers/.
Malwr Posts. 2015. IOC for GafGyt Malware with MD5 Hashes. November 18. Accessed April 13, 2015. https://malwrpost.wordpress.com/2015/11/18/ioc-for-gafgyt-malware-with-md5-samples/.
Provos, Niels, and Thorsten Holz. 2008. Virtual Honeypots: From Botnet Tracking to Intrusion Detection. Upper Saddle River, NJ: Addison-Wesley.
Scott, Mike, Robert Falcone, and Juan Cortes. 2015. "Attack Campaign on the Government of Thailand Delivers Bookworm Trojan." Palo Alto Networks. November 24. Accessed February 26, 2016. http://researchcenter.paloaltonetworks.com/2015/11/attack-campaign-on-the-government-of-thailand-delivers-bookworm-trojan/.
—. 2015. "Attack Campaign on the Government of Thailand Delivers Bookworm Trojan." November 24. Accessed February 26, 2016. http://researchcenter.paloaltonetworks.com/2015/11/attack-campaign-on-the-government-of-thailand-delivers-bookworm-trojan/.
—. 2015. "Bookworm Trojan: A Model of Modular Architecture." Palo Alto Networks. November 10. Accessed March 1, 2016. http://researchcenter.paloaltonetworks.com/2015/11/bookworm-trojan-a-model-of-modular-architecture/.
Software Engineering Institute. 2016. SiLK. Pittsburgh, PA.
Software Engineering Institute. 2016. super_mediator. Pittsburgh, PA.
Undisclosed. 2016. ICS Honeynet Packet Capture Data.
Unknown. 2016. ICS/SCADA/PLC protocol global census scanning. PLCscan. Accessed March 07, 2016. http://icsresearch2.plcscan.org.

CMU/SEI-2016-TR-006 | SOFTWARE ENGINEERING INSTITUTE | CARNEGIE MELLON UNIVERSITY 30
Distribution Statement A: Approved for Public Release; Distribution is Unlimited
VirusTotal. 2016. VirusTotal. Google. Accessed February 24, 2016. http://virustotal.com.
Yeh, Tim. 2014. "Netis Routers Leave Wide Open Backdoor." Trend Micro TrendLabs. August 25. Accessed April 11, 2016. http://blog.trendmicro.com/trendlabs-security-intelligence/netis-routers-leave-wide-open-backdoor/.

CMU/SEI-2016-TR-006 | SOFTWARE ENGINEERING INSTITUTE | CARNEGIE MELLON UNIVERSITY
Distribution Statement A: Approved for Public Release; Distribution is Unlimited
REPORT DOCUMENTATION PAGE Form Approved OMB No. 0704-0188
Public reporting burden for this collection of information is estimated to average 1 hour per response, including the time for reviewing instructions, search-ing existing data sources, gathering and maintaining the data needed, and completing and reviewing the collection of information. Send comments regard-ing this burden estimate or any other aspect of this collection of information, including suggestions for reducing this burden, to Washington Headquarters Services, Directorate for information Operations and Reports, 1215 Jefferson Davis Highway, Suite 1204, Arlington, VA 22202-4302, and to the Office of Management and Budget, Paperwork Reduction Project (0704-0188), Washington, DC 20503.
1. AGENCY USE ONLY
(Leave Blank)
2. REPORT DATE
May 2016
3. REPORT TYPE AND DATES COVERED
Final
4. TITLE AND SUBTITLE
Using Honeynets and the Diamond Model for ICS Threat Analysis
5. FUNDING NUMBERS
FA8721-05-C-0003
6. AUTHOR(S)
John Kotheimer, Kyle O’Meara, Deana Shick
7. PERFORMING ORGANIZATION NAME(S) AND ADDRESS(ES)
Software Engineering Institute Carnegie Mellon University Pittsburgh, PA 15213
8. PERFORMING ORGANIZATION REPORT NUMBER
CMU/SEI-2016-TR-006
9. SPONSORING/MONITORING AGENCY NAME(S) AND ADDRESS(ES)
AFLCMC/PZE/Hanscom Enterprise Acquisition Division 20 Schilling Circle Building 1305 Hanscom AFB, MA 01731-2116
10. SPONSORING/MONITORING AGENCY REPORT NUMBER
n/a
11. SUPPLEMENTARY NOTES
12A DISTRIBUTION/AVAILABILITY STATEMENT
Unclassified/Unlimited, DTIC, NTIS
12B DISTRIBUTION CODE
13. ABSTRACT (MAXIMUM 200 WORDS)
The use of a honeynet—a network of seemingly vulnerable machines designed to lure attackers—is an established technique for collect-ing threat intelligence across various network environments. As a result, organizations have begun to use this approach to protect net-worked industrial control systems (ICS). Organizations hope to observe attempts to compromise their systems in an isolat-ed environ-ment, enabling them to deploy mitigations and harden their networks against emerging threats.
This report presents an approach to analyzing approximately 16 gigabytes of full packet capture data collected from an ICS honeynet. The data is analyzed in the context of other open source information about known threats to ICS to understand how adversaries inter-acted with the net-work and the types of attacks they attempted. To provide a more rigorous approach to characterizing these threat actors, the study employed the well-known Diamond Model of Intrusion Analysis. It applied this model to define and categorize several groups of potential threat actors observed within the data. The study also evaluated the effectiveness of honeynets as a tool for ICS threat intelligence. This report includes several recommendations for their deployment and emphasizes active interaction with external hosts to generate higher quality data.
14. SUBJECT TERMS
Honeynet, industrial control systems, ICS, Diamond Model
15. NUMBER OF PAGES
39
16. PRICE CODE
17. SECURITY CLASSIFICATION OF REPORT
Unclassified
18. SECURITY CLASSIFICATION OF THIS PAGE
Unclassified
19. SECURITY CLASSIFICATION OF ABSTRACT
Unclassified
20. LIMITATION OF ABSTRACT
UL NSN 7540-01-280-5500 Standard Form 298 (Rev. 2-89) Prescribed by ANSI Std. Z39-18
298-102