using hp arcsight api for data visualization · runs on windows, linux and mac os x. gephi is...
TRANSCRIPT

© Copyright 2014 Hewlett-Packard Development Company, L.P. The information contained herein is subject to change without notice.
Using HP ArcSight API for data visualization Eugene Afonin, Senior Sales Engineer #HPProtect

© Copyright 2014 Hewlett-Packard Development Company, L.P. The information contained herein is subject to change without notice.
Some SIEMs have Google maps integrations – could we do better?
Plugging in open source tools for analytics
Do you have an app for that? Visualize data on your portal

© Copyright 2014 Hewlett-Packard Development Company, L.P. The information contained herein is subject to change without notice.
Some SIEMs have Google maps integrations – could we do better?
Plugging in open source tools for analytics
Do you have an app for that? Visualize data on your portal

© Copyright 2014 Hewlett-Packard Development Company, L.P. The information contained herein is subject to change without notice. 5
Features - layout Google Map
Events radar
Events details

© Copyright 2014 Hewlett-Packard Development Company, L.P. The information contained herein is subject to change without notice. 6
Features - Google map
Populated by events details from the clicked marker
Tooltip tells exact numbers
Shows events distribution by
priority on marker click

© Copyright 2014 Hewlett-Packard Development Company, L.P. The information contained herein is subject to change without notice. 7
Features - radar
Red – high priority events, yellow –
medium and blue are low
Hover mouse to show tooltip
Each bar represent one minute in the
event flow
Click here to populate table with
corresponding events

© Copyright 2014 Hewlett-Packard Development Company, L.P. The information contained herein is subject to change without notice. 8
Features - table
Events count is calculated
automatically for each group level
Multiple grouping is supported
To group events just drag here any
column header

© Copyright 2014 Hewlett-Packard Development Company, L.P. The information contained herein is subject to change without notice. 9
Features - table (cont.)
Type here or click any cell to filter on
cells values
Click to open/close search filter
Click any column header to sort
(asc/desc)
Type here or click any cell to filter on
value

© Copyright 2014 Hewlett-Packard Development Company, L.P. The information contained herein is subject to change without notice. 10
Features - clusters
Zoom level 2
Markers combine or split up according to the map zoom level
Zoom level 4

© Copyright 2014 Hewlett-Packard Development Company, L.P. The information contained herein is subject to change without notice. 11
How it works
* * *
* Logger
ArcSight ESM / Express
Incoming events
Logger search API call
Search result in JSON
Jscript code, Jscript & chart libraries
Visualization web app
Google API, Geo images
1
2
3
4
High priority events
5

© Copyright 2014 Hewlett-Packard Development Company, L.P. The information contained herein is subject to change without notice. 12
APIs used
HP ArcSight

© Copyright 2014 Hewlett-Packard Development Company, L.P. The information contained herein is subject to change without notice. 13
Could be enhanced • Add filter input field – so the Logger search
query could be customized, not hardcoded • Add status window – show applied filter, app
events etc. • Allow user to set data refresh interval • Make regular background JSON calls to silently
upload data from logger – no need to page reload, hide search time lag from user
• Access rights
• Draw markers according to network model and show regional team details (email, phone, shift timetable etc.)
• Ability to cluster events by customized map regions • Calculate statistics by region • Show different regions on different map zoom levels according to BUs or SOC team
structure

© Copyright 2014 Hewlett-Packard Development Company, L.P. The information contained herein is subject to change without notice.
Some SIEMs have Google maps integrations – could we do better?
Plugging in open source tools for analytics
Do you have an app for that? Visualize data on your portal

© Copyright 2014 Hewlett-Packard Development Company, L.P. The information contained herein is subject to change without notice. 15

© Copyright 2014 Hewlett-Packard Development Company, L.P. The information contained herein is subject to change without notice. 16

© Copyright 2014 Hewlett-Packard Development Company, L.P. The information contained herein is subject to change without notice. 17

© Copyright 2014 Hewlett-Packard Development Company, L.P. The information contained herein is subject to change without notice. 18

© Copyright 2014 Hewlett-Packard Development Company, L.P. The information contained herein is subject to change without notice.
Some SIEMs have Google maps integrations – could we do better?
Plugging in open source tools for analytics
Do you have an app for that? Visualize data on your portal

© Copyright 2014 Hewlett-Packard Development Company, L.P. The information contained herein is subject to change without notice. 20
Gephi – open graph viz platform
Interactive visualization and exploration platform for all kinds of networks and complex systems, dynamic and hierarchical graphs. Runs on Windows, Linux and Mac OS X. Gephi is open-source and free.
© Copyright 2014 Hewlett-Packard Development Company, L.P. The information contained herein is subject to change without notice. 21
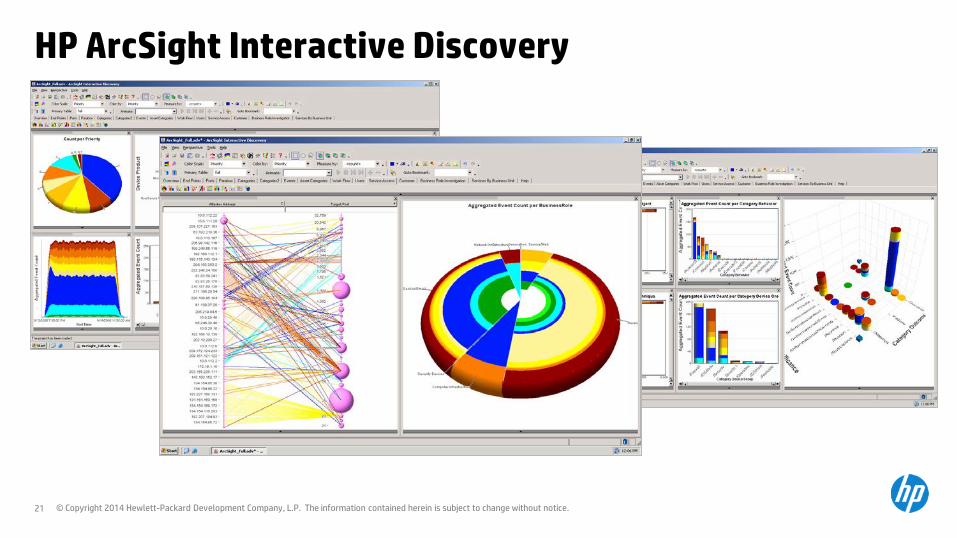
HP ArcSight Interactive Discovery
© Copyright 2014 Hewlett-Packard Development Company, L.P. The information contained herein is subject to change without notice. 22
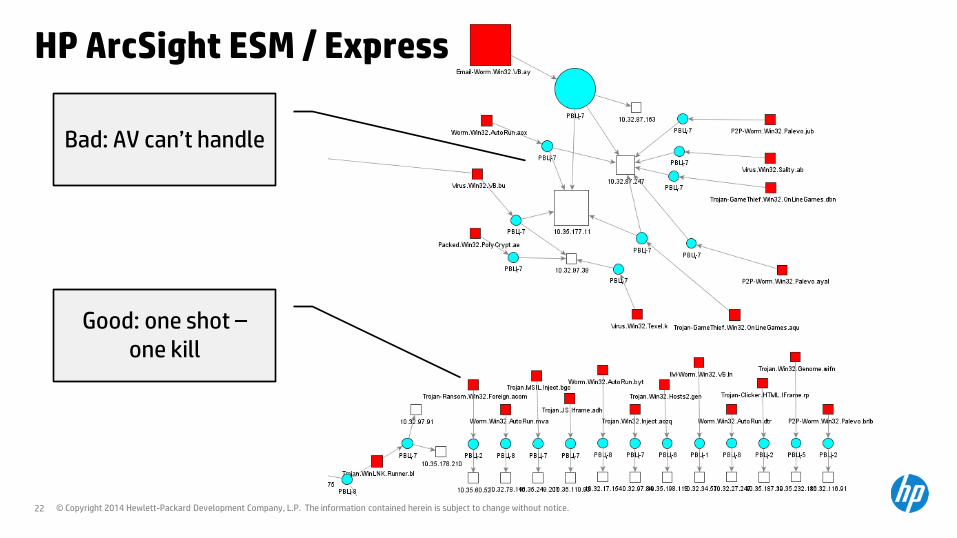
HP ArcSight ESM / Express
Good: one shot – one kill
Bad: AV can’t handle

© Copyright 2014 Hewlett-Packard Development Company, L.P. The information contained herein is subject to change without notice. 23
Gephi – virus outbreak
Good: one shot – one kill
Bad: AV can’t handle
Bad: Region creep

© Copyright 2014 Hewlett-Packard Development Company, L.P. The information contained herein is subject to change without notice. 24
VIDEO STUB
© Copyright 2014 Hewlett-Packard Development Company, L.P. The information contained herein is subject to change without notice. 25
For more information
Attend these sessions
• TB3273, Practical Examples of Big Data, Security Analytics and Visualization
• TT3139, An introduction to HP ArcSight ESM web services APIs • PN3578, Security analytics panel: Hunting bad guys
After the event
• Download sources at: https://protect724.hp.com/docs/DOC-11406
Your feedback is important to us. Please take a few minutes to complete the session survey.

© Copyright 2014 Hewlett-Packard Development Company, L.P. The information contained herein is subject to change without notice. 26
Please fill out a survey. Hand it to the door monitor on your way out.
Thank you for providing your feedback, which helps us enhance content for future events.
Session TT3161 Speaker Eugene Afonin
Please give me your feedback

© Copyright 2014 Hewlett-Packard Development Company, L.P. The information contained herein is subject to change without notice.
Thank you