using macroinvertebrate community functional organization
TRANSCRIPT

Using Macroinvertebrate Community Functional Organization to Predict Prey Base and Ecosystem Attributes Favorable to Juvenile Salmonid Growth
and Survival in Freshwater Creek
Ken Cummins RCAA Contract #03-212-551-0 John Matousek Pacific Lumber Contract # M6493 April Shackelford March 21, 2005
39.6%
22.1%
All Samples and Habitats
5.3%
27.4%
5.5% Shredders
Scrapers
Filtering Collectors
Gathering Collectors
Predators
n=317
Summary of Invertebrate Functional Feeding Group Composition Freshwater Creek Basin Summer 2004
Institute for River Ecosystems Humboldt State University
1 Harpst Street, Arcata, CA 95521 (707) 825-7350 [email protected]

1
INVERTEBRATE FUNCTIONAL GROUP ANALYSIS FOR THE
FRESHWATER CREEK WATERSHED Ken Cummins John Matousek April Shackelford Institute for River Ecosystems Humboldt State University 592 14th Street, Arcata, CA 95521 (707-825-7350; [email protected]) March 21, 2005
Introduction An invertebrate assessment using functional feeding group (FFG) classification (Cummins and Klug 1979; Merritt and Cummins 1996; Appendix I) was conducted in the Freshwater Creek Basin, Humboldt County, California in August and September 2004. Working in conjunction with the Institute for River Ecosystems (IRE), and California Department of Fish and Game (DFG) Anadromous Fisheries Research and Monitoring Program (AFRAMP) juvenile salmonid survey, an invertebrate survey crew from IRE sampled stream invertebrates at locations determined by a modified Hankin and Reeves (1988) protocol for the juvenile salmonid survey. The juvenile salmonid survey crew followed a sequential protocol to monitor Freshwater Basin for juvenile salmonid species. First, habitat units were selected and flagged for later snorkel-dive, electrofishing, and invertebrate assessment surveys. With a few exceptions habitat units were classified as riffles (RI), shallow pools (SP), and deep pools (DP).. Riffles were not snorkel-surveyed but one-tenth of all flagged riffles were selected for electrofishing. One-third of all shallow pools were selected for snorkel-surveying. One-forth of the shallow pools that had been snorkel surveyed were selected for electrofishing. Thus, one-twelfth of all flagged shallow pools were selected for electrofishing. Invertebrates were sampled at every other electrofished unit. Because deep pools were snorkeled but not electrofished, no invertebrates were sampled at deep pool locations. The invertebrate survey crew worked up stream to the end of anadromy following the snorkel survey up. The electrofishing survey teams came up behind the invertebrate survey crew enumerating salmonid species. Salmonid stomach samples were taken from up to ten fish over one year old collected form those electrofishing sites where invertebrate samples were taken. This protocol allowed for a match between the juvenile salmonid stomach samples and invertebrate collections at all invertebrate sampling sites.

2
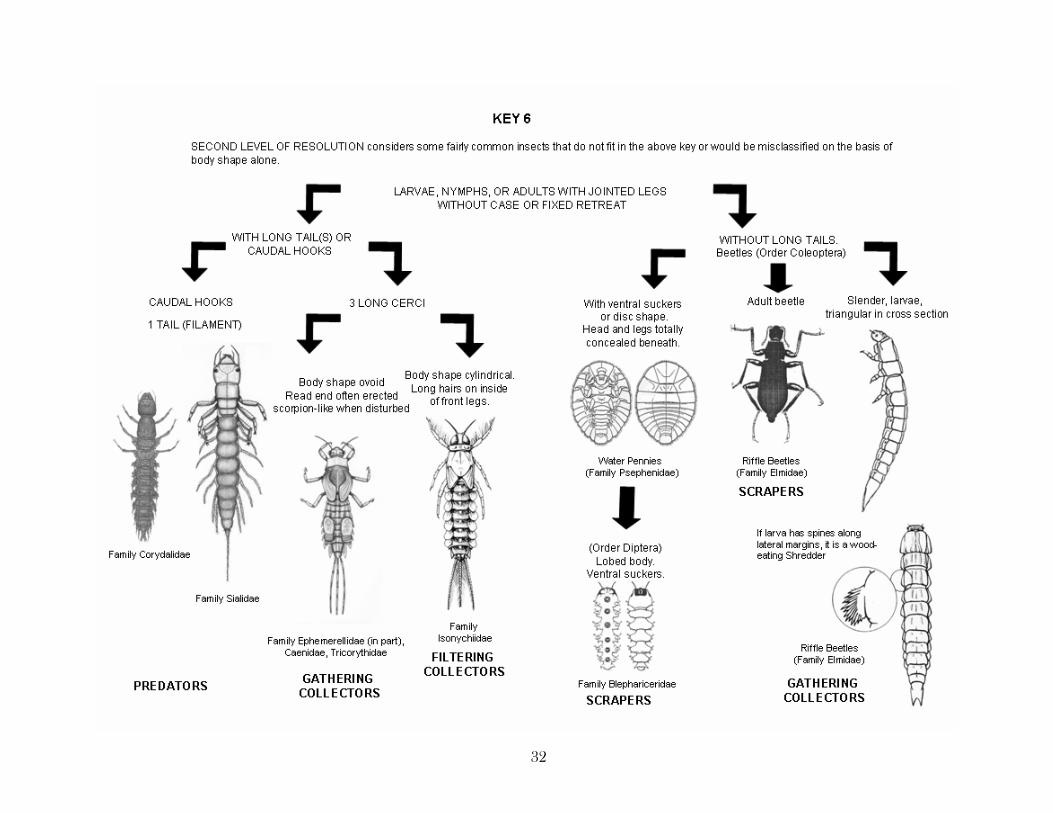
Functional Groups The separation of stream invertebrates into functional feeding groups (FFG) is based on the mechanisms by which they acquire their food. Morphological and behavioral adaptations used in acquiring the food are generally easily observed in the field using live, freshly collected specimens. An example would be the large eyes, bright color patterns, and active movement that characterize the predaceous stonefly families. This combination of characters identifies these stoneflies as predators. The morphological characters used to place stream invertebrates into FFGs are given in the Key to FFGs in Appendix I. Feeding mechanisms, dominant food resources, and particle size ranges are summarized for each FFG in Table 1.
Field Methods Header Information At each unit, the Stream Name, Reach ID, and Drainage were recorded, as well as Habitat Unit Number and Type. Date, Water Temperature, and Time were also recorded. At every Unit where invertebrate sampling took place, stomach samples were collected by the electrofishing crew. The invertebrate crew left flagging to notify the electrofishing crew of the units where invertebrate sampling took place. Invertebrate Data In general, three samples were taken at every unit. Habitat sample type consisted of four categories; Cobble, Leaf Litter, Fine Sediments, and when available, Large Wood. For each sample, after the Header data were entered on the field form, individual invertebrates were field identified, sorted into functional feeding groups (FFG) and tallied. Field invertebrate taxonomy was generally to the family or genus level for insects and to the ordinal or class level for other invertebrates. In this method, separation of the invertebrates into functional feeding group was made in the field on fresh, live specimens. The FFGs used were: Shredders, Scrapers, Filtering Collectors, Gathering Collectors, and Predators (Cummins and Klug, 1979; Merritt and Cummins, 1996). The numbers of invertebrates contained in each FFG were tallied for every sample type. After FFG enumeration, the samples were labeled with data from the header of the field data form and preserved in 70% ethyl alcohol (ETOH) for return to the laboratory for analysis. In the laboratory, the invertebrates can be identified to a finer taxonomic level and the specimens measured to permit conversion of numbers to biomass using the software INVERTCALC (Cummins, Wilzbach, and Merritt, unpublished).

3
Invertebrate Sampling Once the unit selection procedure and snorkel survey had taken place, units were sampled for invertebrates. The protocol (Figure 1) was to take one sample from each habitat type: Leaf litter, cobble, fine sediment, and wood. Availability determined whether all habitat types could be sampled at each site. If leaf litter was abundant, it would be collected first, followed by cobble, and then fine sediments and large wood. If fine sediment depositional areas or large wood were absent, two cobble samples were taken. A 250 :m mesh D-frame dip net was used to sample all four habitat types. This allowed for the separation of insects from fine sediment and particles of organic debris. All D-frame dip net collections were made for 40 seconds. Leaf Litter was collected for 40 seconds, and then the leaves were rinsed to separate insects from leaves. Water soaked logs or large woody debris were sampled for 40 seconds by rubbing the surface of the wood by hand to dislodge the invertebrates into the net. Invertebrates were removed by hand scrubbing the cobbles in the streambed into the net for 40 seconds. Fine sediments were sampled in pools or backwaters when they were present by skimming off the upper 1-2 cm for 40 seconds. An example field data sheet is given in Appendix II. After collection, each sample was washed into a shallow white tray for taxonomic separation, functional group assignment, and enumeration. Functional group determinations were aided by a laminated FFG field key (Appendix 1; Cummins, Wilzbach, and Merritt, unpublished). Following enumeration and data entry on to the field form, each sample was washed onto a 250 :m sieve and into a whirl-pak® scientific collecting bag, and preserved with 70% ETOH for later lab analysis. Each bag was labeled with the Header information from the corresponding field data form. Fish Stomachs At every other electro-fishing unit where the invertebrate sampling was done, the invertebrate sampling crew left a flag marker to alert the fish sampling crew that fish stomach (lavage) samples were to be taken. At each of these sites, up to ten 1+ year old juvenile salmonids were stomach-pumped. Stomachs were flushed with a syringe into a tray and the material preserved in whirl-paks® with 70% ETOH. The tip of the syringe needle was protected with fine, flexible plastic tubing to prevent damage to the fish esophagus and stomach. Each sample was labeled with information corresponding to that recorded on the invertebrate field data form header from that site. Fish stomachs collected in Cloney Gulch were analyzed in the laboratory. Invertebrates were separated into taxa and converted to biomass using INVERTCALC, a software program that converts lengths of individuals into taxa-specific biomass estimates (Cummins and Wilzbach, unpublished).

4
Results Invertebrates were collected, using methods described previously, from each stream in conjunction with the (AFRAMP) juvenile salmonid survey. In this manner samples were collected from ratio- generated locations (units) on the Mainstem. Using the same ratios and sampling protocol, the six tributary streams were sampled upstream until the end of anadromy (i.e. until no more juvenile coho were encountered).
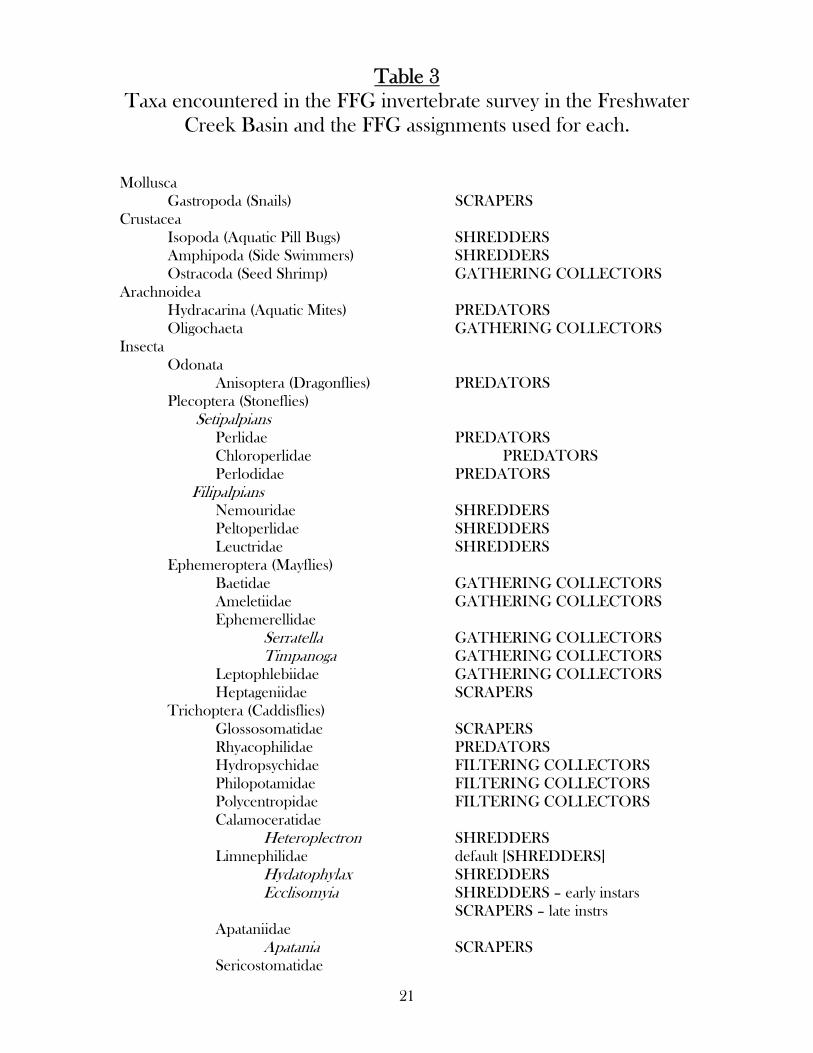
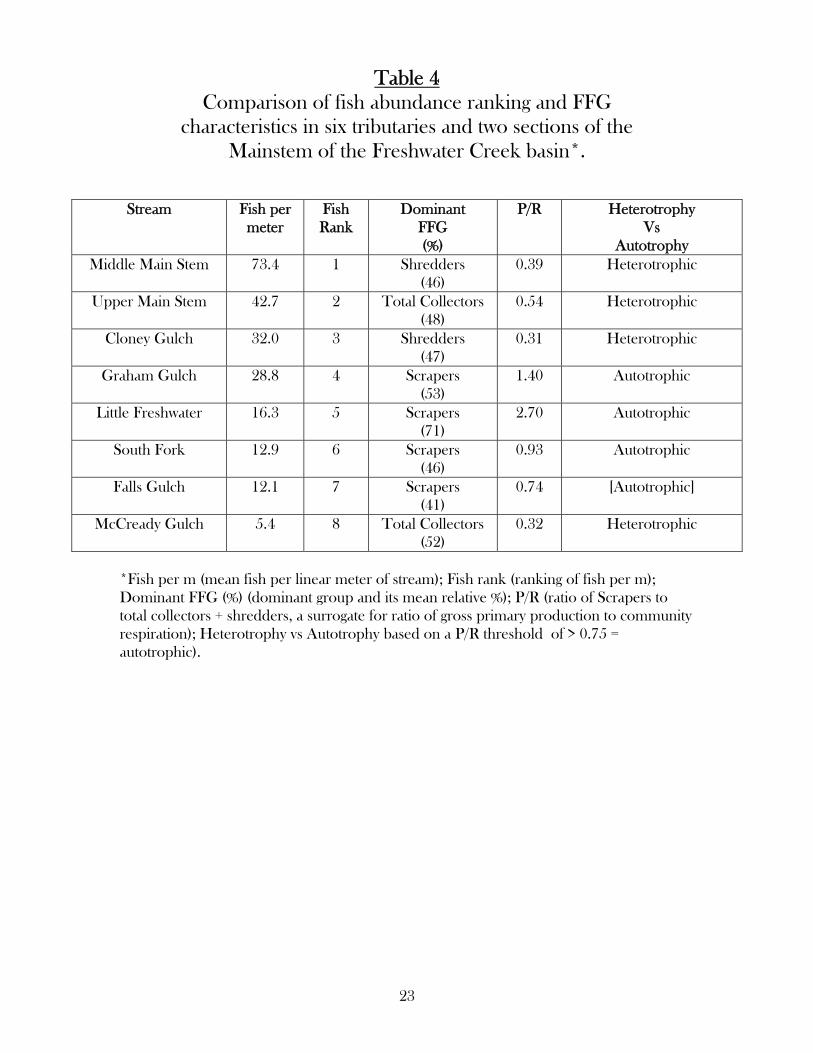
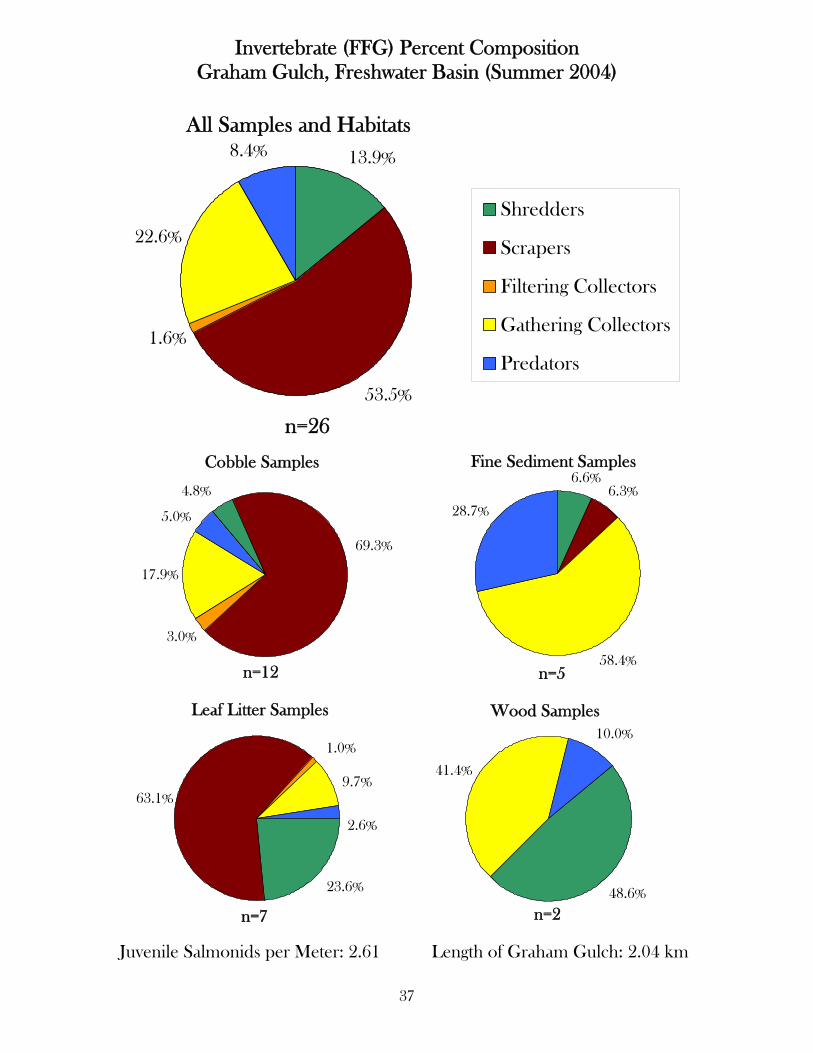
A total of 317 samples was taken from six tributary streams and the two sections of the Mainstem in the Freshwater Creek Basin. Upper and Middle Mainstem were delineated as above and below the confluence with the South Fork of Freshwater Creek. The number of invertebrate sample locations for each stream and Upper and Middle Mainstem are summarized, along with the total number of samples taken in each habitat at each location, in Table 2. The taxa encountered during the survey (including all 317 samples) are summarized in Table 3. Stoneflies (Plecoptera), mayflies (Ephemeroptera) and caddisflies (Trichoptera) were well represented in all tributary streams and in both sections of the mainstem. The number of Ephemeroptera, Plecoptera, and Trichoptera relative to the total number of invertebrates present in a sample (EPT index) has been used to indicate stream health (e.g. Karr and Chu 1999). Based on this criterion alone, all six tributaries and the two sections of the mainstem that were surveyed for invertebrates were in acceptable condition. However, as indicated above (e.g. Table 3), these broad ordinal level taxonomic categories obscure within taxa functional relationships. For example, there are scrapers and gathering collectors in the order Ephemeroptera (Table 3) and these two groupings of mayflies have very different nutritional requirements (Table 1). Scrapers depend upon attached, non-filamentous algae as a food resource (autotrophic food chain) and the gathering collectors depend upon fine particulate organic matter (FPOM) (heterotrophically based food web). A general overview of the invertebrate and juvenile salmonid surveys in the Freshwater Creek Basin is shown in Figure 2. The actual sampling locations for the invertebrate FFG data are depicted in Figure 3. From this figure it is clear that the basin coverage was quite broad and complete. The pie charts summarize relative percents of the functional groups averaged over all samples from each tributary and the mainstem sections. The estimated mean number of juvenile salmonids per running meter of stream length are also given for the study tributaries and mainstem reaches in Figure 2 and arranged by rank in Table 4. Using the autotrophy/heterotrophy index, or P/R ratio (Table 5), the tributaries and two mainstem reaches were classified as autotrophic or heterotrophic. As shown in Table 5, an FFG ratio is used as a surrogate for P/R with a threshold value of >0.75 indicating an autotrophic system with foodwebs based on in-stream algal primary production. Scrapers were the dominant FFG in four of the tributaries (Graham Gulch, Little Freshwater Creek, South Fork Freshwater Creek, and Falls Gulch). These four tributaries ranked 4th through 6th in terms of juvenile salmonid abundance. Heterotrophic based FFGs, shredders or collectors, were dominant in four tributaries and mainstem reaches (Middle and Upper Mainstem, Cloney Gulch, and McCready Gulch, Table 4). Shredders were dominant in Middle Mainstem and Cloney Gulch which were ranked 1st and 3rd in juvenile salmonid abundance (Table 4). Upper Mainstem, ranked 2nd for fish abundance, and McCready Gulch, ranked last for fish abundance, were both dominated by collectors (Table 4). Thus,

5
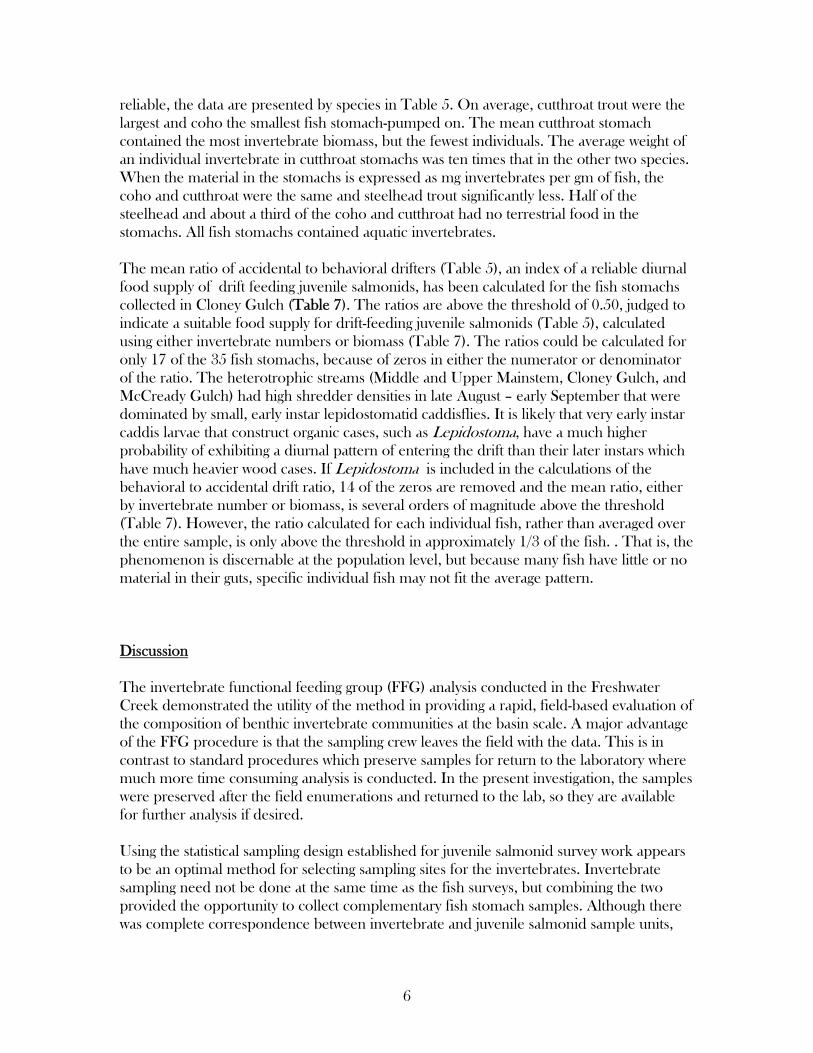
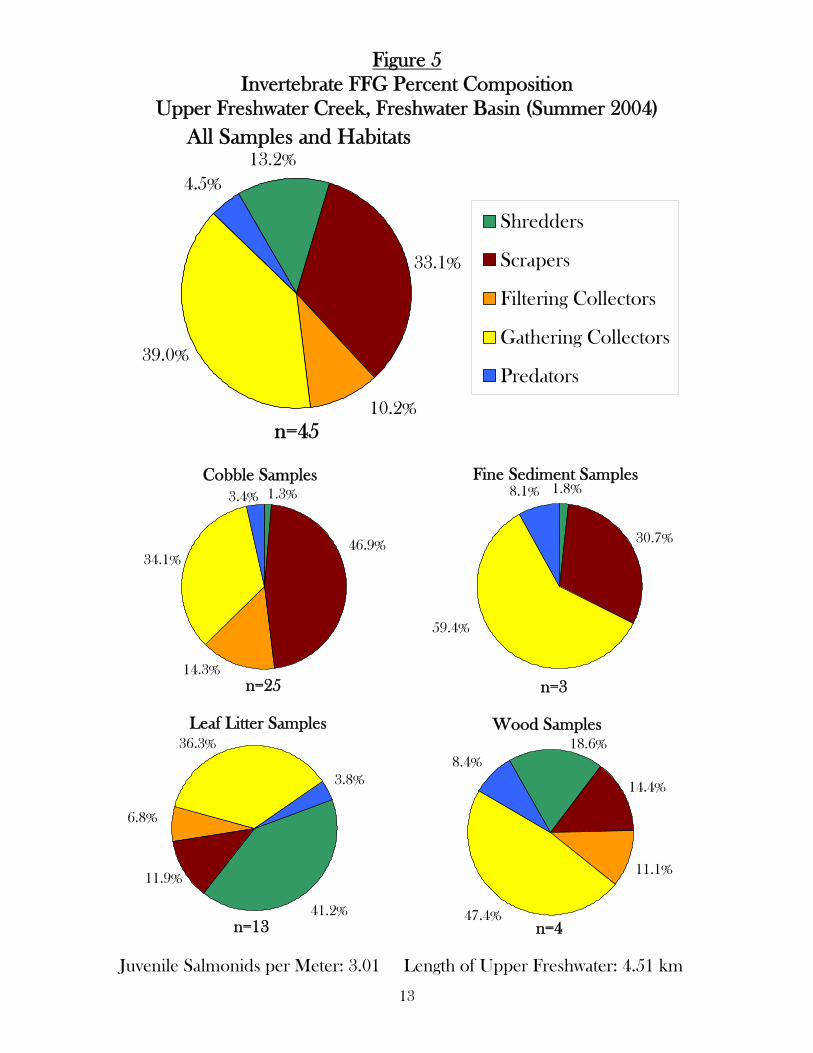
the general pattern was for heterotrophic tributaries and Mainstem reaches to support the highest juvenile salmonid densities. McCready Gulch, with its heavily silted substrates, constituted the exception (Table 4). The results are summarized for all 317 tributary and mainstem samples combined and by each of the four habitats (cobble, litter, fines, and wood) in Figure 4 (i.e. a summary of all data shown in Figure 2). The average (by numbers) over all samples showed scrapers to be the dominant group (approx. 40%), followed by total collectors (approx. 30%), and then shredders (approx. 20%). The separation by habitat makes it clear that scrapers dominated cobble (riffle) samples, shredders dominated litter samples, and collectors made up half or more of the numbers collected from fine sediment and wood samples (Figure3). Filtering collectors ranged from 0 (fine sediments) to 8% (cobbles), clearly reflecting the importance of surface attachment sites for this functional group. Gathering collectors accounted for over 60% of the invertebrates in fine sediment collections, indicting the abundance of their FPOM food resource in this habitat. Examples of single Mainstem Reach or tributary analyses of FFG community organization are shown in Figure 5 (Upper Mainstem), Figure 6 (Cloney Gulch, and Figure 7 (McCready Gulch). Data for the remaining tributaries and the Middle Mainstem are presented in Appendix III. The average FFG composition for Upper Mainstem Freshwater Creek was approximately half collectors, including 10% filtering forms, a third scrapers, and about 10% shredders. The Upper Mainstem, cobble habitats averaged approximately half collectors and half scrapers, litter approximately 40 % each collectors and shredders, and fine sediments and wood both had about 50% collectors (Figure 4). Cloney Gulch averaged half shredders and about a quarter each gathering collectors and scrapers, with filtering collectors essentially absent. Cobble habitats had 50% scrapers and approximately 20% each gathering collectors and shredders. Litter habitats had almost 90% shredders and fine sediments and wood with about half collectors (Figure 5). McCready Gulch samples averaged about 50% collectors and ,of that, about a third were filtering collectors. These were the largest filtering collector populations found anywhere in the Freshwater Creek Basin. This was reflected in the cobble samples with a third of the total being filtering collectors and about half scrapers; both these groups require the stable surfaces represented by cobble. Litter samples were about half collectors and a third shredders. Fine sediments and wood had 40 to 60% collectors. Filtering collectors were not found on fine sediments, reflecting the unstable surfaces characteristic of this habitat (Figure 6). Fish stomach samples collected in Cloney Gulch were analyzed in the laboratory to determine the FFG composition of the diet and to convert invertebrate numbers to biomass estimates and categorize the invertebrates as either behavioral or accidental drifters. Cloney Gulch samples were selected as an example to illustrate the type of information that can be obtained from such analyses. The results of the analyses of the 35 juvenile salmonids are given in Table 6. Using the genetic analyses of juvenile salmonids collected in Cloney Gulch in 2003 as an indication of the accuracy with which field crews are able to correctly separate steelhead and cutthroat trout, an error of less than 20% would be expected in the data from 2004. Field crews made no errors in identifying coho juveniles. This was based on fish > 80 mm in length, which is the lower size limit suitable for stomach pumping. Therefore, because the field identification of juveniles is quite
6
reliable, the data are presented by species in Table 5. On average, cutthroat trout were the largest and coho the smallest fish stomach-pumped on. The mean cutthroat stomach contained the most invertebrate biomass, but the fewest individuals. The average weight of an individual invertebrate in cutthroat stomachs was ten times that in the other two species. When the material in the stomachs is expressed as mg invertebrates per gm of fish, the coho and cutthroat were the same and steelhead trout significantly less. Half of the steelhead and about a third of the coho and cutthroat had no terrestrial food in the stomachs. All fish stomachs contained aquatic invertebrates. The mean ratio of accidental to behavioral drifters (Table 5), an index of a reliable diurnal food supply of drift feeding juvenile salmonids, has been calculated for the fish stomachs collected in Cloney Gulch (Table 7). The ratios are above the threshold of 0.50, judged to indicate a suitable food supply for drift-feeding juvenile salmonids (Table 5), calculated using either invertebrate numbers or biomass (Table 7). The ratios could be calculated for only 17 of the 35 fish stomachs, because of zeros in either the numerator or denominator of the ratio. The heterotrophic streams (Middle and Upper Mainstem, Cloney Gulch, and McCready Gulch) had high shredder densities in late August – early September that were dominated by small, early instar lepidostomatid caddisflies. It is likely that very early instar caddis larvae that construct organic cases, such as Lepidostoma, have a much higher probability of exhibiting a diurnal pattern of entering the drift than their later instars which have much heavier wood cases. If Lepidostoma is included in the calculations of the behavioral to accidental drift ratio, 14 of the zeros are removed and the mean ratio, either by invertebrate number or biomass, is several orders of magnitude above the threshold (Table 7). However, the ratio calculated for each individual fish, rather than averaged over the entire sample, is only above the threshold in approximately 1/3 of the fish. . That is, the phenomenon is discernable at the population level, but because many fish have little or no material in their guts, specific individual fish may not fit the average pattern. Discussion The invertebrate functional feeding group (FFG) analysis conducted in the Freshwater Creek demonstrated the utility of the method in providing a rapid, field-based evaluation of the composition of benthic invertebrate communities at the basin scale. A major advantage of the FFG procedure is that the sampling crew leaves the field with the data. This is in contrast to standard procedures which preserve samples for return to the laboratory where much more time consuming analysis is conducted. In the present investigation, the samples were preserved after the field enumerations and returned to the lab, so they are available for further analysis if desired. Using the statistical sampling design established for juvenile salmonid survey work appears to be an optimal method for selecting sampling sites for the invertebrates. Invertebrate sampling need not be done at the same time as the fish surveys, but combining the two provided the opportunity to collect complementary fish stomach samples. Although there was complete correspondence between invertebrate and juvenile salmonid sample units,

7
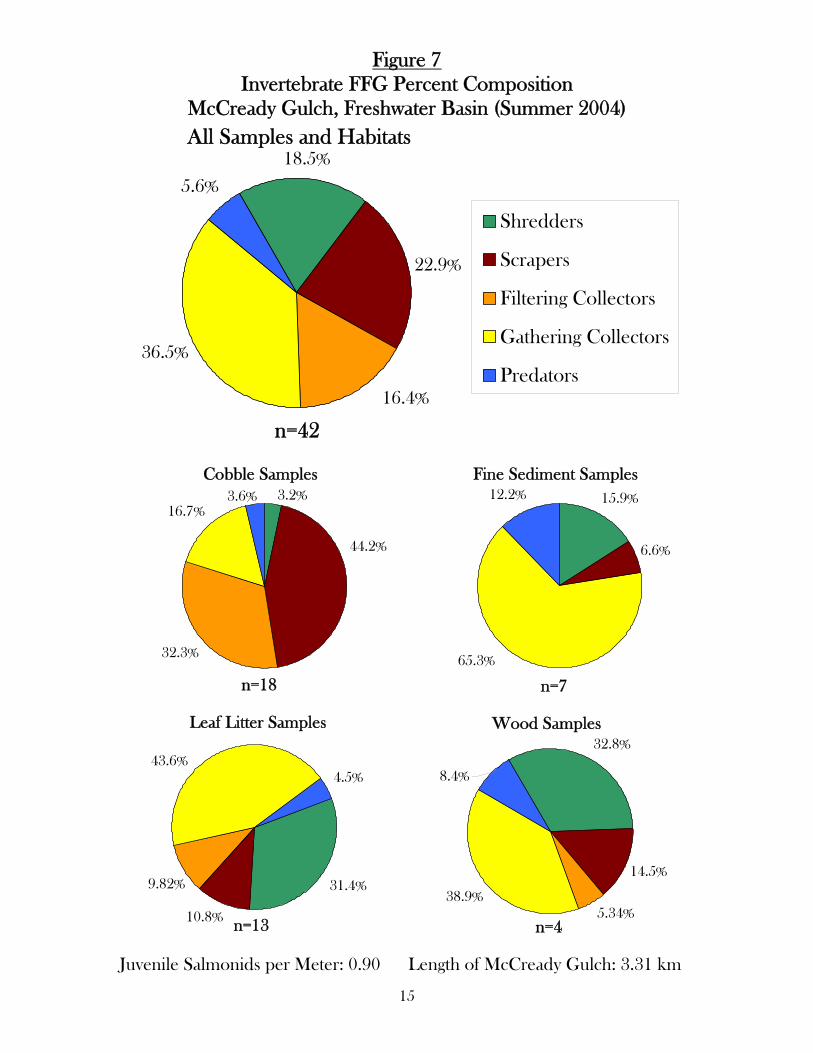
the habitat survey data collected by CDFG did not match the locations. It should be noted that this was not as originally agreed upon between all the parties involved in the project. The general picture for the Freshwater Creek Basin (all samples from all habitats from all tributaries and mainstem sections) is that at the basin is nearly in balance between heterotrophy (i. e. dependent upon riparian inputs) and autotrophy (i. e. dependent upon light-controlled in-stream primary production). Indeed, the tributaries and mainstem reaches sort out as half heterotrophic and half autotrophic (Table 4). Given that the three tributaries/mainstem reaches with the highest estimated fish densities (Upper and Middle Mainstem, and Cloney Gulch) were characterized as heterotrophic using the invertebrate surrogate P/R ratios (Table 4 and 5), protection of the riparian habitat along these channels would be recommended. The collector functional group (gathering and filtering) exhibited a rough correspondence with the density distribution of juvenile salmonids in the six tributaries and the two mainstem reaches (Figure 8). Cloney Gulch presents an interesting case, with gathering collectors most abundant above the point along the drainage where juvenile salmonid populations declined to near zero (unit 161, Figure 3). When the relative composition of FFGs are plotted for each sample unit separately for Cloney Gulch (Figure 9), a general shift from FFG composition with shredders most abundant to collectors and scrapers becoming more abundant can be seen. The most likely explanation is a change in habitat (both in-stream and riparian) near sample unit 161. Thus, it is likely that in some instances the invertebrate respond to different habitat features than do the fish. A case in point is McCready Gulch which is fine sediment enriched and had the lowest juvenile salmonid densities but the highest gathering collector percentages (Figure 8). Clearly, McCready Gulch habitat was adequate to support large collector populations, but was not suitable for juvenile salmonids. Further, McCready Gulch had significant populations of filtering collectors. At the basin scale, only McCready Gulch and the Upper Mainstem had significant populations of filtering collectors (Figure 2). These two tributary/mainstem reach systems apparently were the only ones with sufficient quantity and quality of suspended load to support notable populations of filtering collectors. This is of interest because many of the invertebrates that are behavioral drifters are filtering collectors. Recommendations The FFG assessment method applied at the basin scale is rapid, efficient, and informative and would be most valuable if it were repeated on a seasonal basis. One census period in August-September coupled with the juvenile salmonid survey and one in the spring, April-May, to correspond with the likely period of maximum growth for the juvenile salmonids are recommended. The first would adequately sample the summer generations and the second the winter generations of the macroinvertebrates. By such repeated annual sampling, trends in invertebrate communities related to land use and hydrologic year would be apparent and could be followed efficiently at the basin scale Habitat measurements should be made at the same time as the August-September fish/invertebrate survey work and match exactly the sites mapped out for the fish survey. Without this correspondence, direct interpretation of habitat effects will not be possible.

8
The field crew conducting the FFG survey should rate each unit sampled as to the % cover of each of the habitat types (Cobble/gravel riffles, depositional fine sediment/pools and backwaters, litter accumulations, and large woody debris) to allow appropriate weighting of the FFG collections. Juvenile salmonid stomach samples should be collected at all the units where invertebrate FFG samples are taken. Laboratory analysis of these fish stomach samples is necessary in order to enumerate invertebrates consumed and to calculate invertebrate biomass. Laboratory analysis of the FFG samples is advisable so that comparisons with the fish stomach data can be accomplished on a biomass basis. References Cummins, K. W. and M. J. Klug. 1979. Feeding ecology of stream invertebrates. Annual Review of Ecology and Systematics 10: 147-172. Hankin, D.G., and G.H. Reeves. 1988. Estimating total fish abundance and total habitat area in small streams based on visual estimation methods. Canadian Journal of Fisheries and Aquatic Sciences 45: 834-844. Karr, J.R., and E.W. Chu. 1999. Restoring life in running waters: Better biological monitoring. Island Press, Washington, D.C Merritt, R. W. and K. W. Cummins. 1996. An introduction to the aquatic insects of North America. Kendall/Hunt, Dubuque, IA, 862 pp.

9
FFG Methods D-Frame, 250ìm Mesh Net 30 s collection
Sample Each of 4 Habitats: Cobbles (riffle/run), Litter Accumulations, Fine
Sediments (pools, edges), Large Woody Debris
FOR EACH SAMPLE
Rinse Sample in Net in Stream
Wash Net Contents into Sorting Tray
Separate Invertebrates by Functional Feeding Group (FFG) into Compartmentalized Tray
Data Sheet: Enumerate each FFG and Record Recognizable Taxa
Label and Preserve (70% ETOH) Sample in Whirl-Pak
Calculate % FFGs & FGG Ratios for
Ecosystem Attributes
LAB
Taxonomic Identifications & Measurements
Conversion to Biomass Estimates with INVERTCALC
OFFICE
Figure 1

#
#
#
#
#
#
#
#
#
Weir
0.90Salmonids/meter:
Invertebrate Functional GroupCommunity Organization
and Salmonid Density
Freshwater Creek Basinin the
Aug - Sept, 2004during
North Coast California
FreshwaterCreek
System
Eureka
Sources: Data contact: Kenneth W. Cummins and Dana R. McCanne, Institute for River Ecosystems, Humboldt State University, Arcata, CA Projection system: UTM Zone 10N, NAD 1927 Data layers: Stream lines: 1:24k routed hydrology developed by the Calif. Dept. of Forestry and Fire Protection Invertebrate Data: Developed using event methodology on the routed hydrography Fish Data: Developed using event methodology on the routed hydrography. Electrofishing was used to acquire an estimated number of fish meter counted over several survey units on each stream. Basin: California Watersheds (CALWATER 2.2) by the CDFFP (1999) Map compiled by: Angie Brown, IRE, HSU, Arcata CA, November 2004May contain errors of omission or commission
N
EW
S
Other Layers
Freshwater Creek BasinStreamsStreams in Survey
Invertebrate Functional GroupsShreddersScrapersFilterersGatherersPredators
Upper MainstemFreshwater Creek
McCready Gulch
Little FreshwaterCreek
Graham Gulch
Falls Gulch
Cloney Gulch
South ForkFreshwater Creek
Middle MainstemFreshwater Creek
Salmonids/meter:
Salmonids/meter:
Salmonids/meter:
Salmonids/meter:
Salmonids/meter:
Salmonids/meter:2.61
2.58
3.47
3.01
1.46
1.68
1.99Salmonids/meter:
500 0 500 1000 Meters
In stit ute f or Riv er Eco sy ste msHumboldt S tat e Univ e rsi ty1 Ha rpst St reetArcat a, CA 9 55 21www .h umbo ldt.e du/~ ire
Figure 2.

11
#Y
#Y
#Y
#Y
#Y
#Y
#Y
#Y
#Y
#Y
#Y #Y
#Y#Y #Y #Y
#Y#Y #Y
#Y
#Y#Y#Y
#Y
#Y
#Y
#Y#Y#Y
#Y#Y
#Y
#Y
#Y
#Y#Y
#Y
#Y
#Y
#Y#Y
#Y#Y
#Y
#Y
#Y#Y
#Y
#Y
#Y
#Y
#Y
#Y#Y
#Y#Y
#Y
#Y#Y#Y#Y#Y#Y#Y
#Y
#Y
#Y#Y
#Y
#Y
#Y#Y#Y#Y#Y
#Y#Y#Y#Y
#Y
#Y
#Y#Y#Y
#Y #Y #Y #Y
#Y #Y#Y#Y#Y
#Y
#Y
#Y#Y
#Y
#Y
#Y
#Y#Y
#Y #Y
#Y
#Y
#Y
#Weir
41
3241
99
1339
47 7796
1531
62 95
21
52
77
2130
53 82
21
53
64 96
13
4472
99
119
138
172
190
222139 147
176
212 227 271288
336347 384
114 150
175 192
218235
261
297
335358
111117
162
168
200
255
271
310
104128
161169191200217227
241276
286 294
339381
401
125
145
179
205239
111133
168
199
219
279303
319 348370
256
North Coast California
FreshwaterCreek
System
Eureka
Freshwater Creek BasinStreamsStreams in Survey
#Y Survey Locations
N
EW
S
Sources : Data contact: Kenneth W. Cummins , Insti tute for River Ecosystems, Humboldt State University, Arcata, CA Projection system: UTM Zone 10N, NAD 1927 Data layers: Stream lines: 1:24k routed hydrology developed by the Calif. Dept. of Forestry and Fire Protection Unit Data: Developed using event methodology on the routed hydrography Basin: California Watersheds (CALWATER 2.2) by the CDFFP (1999) Map compiled by: Angie Brown, IRE, HSU, Arcata CA, Feb. 2005May contain errors of omission or commission
Invertebrate Survey Units
during
Freshwater Creek Basin
Aug ~ Sept, 2004
in the
#Y#Y #Y
#Y
#Y
#Y
#Y#Y
#Y#Y
#Y
#Y
#Y
#Y#Y
5
7
8 1427
35
4751
57
6367
78
8789
In stit ute f or Riv er Eco sy stemsHumbo ldt S tat e Univ e rsi ty1 Ha rpst St reetArcat a, CA 9 55 21www .h umbo ldt.e du/~ ire
0.7 0 0.7 1.4 Kilometers
Figure 3.

12
Figure 4 Invertebrate Functional Feeding Group (FFG)
Percent Composition, Freshwater Creek Basin (Summer 2004) All Samples and Habitats
22.1%
39.6%
5.3%
27.4%
5.5%
Shredders
Scrapers
Filtering Collectors
Gathering Collectors
Predators
n=317
Cobble Samples4.9%
60.8%
8.0%
21.7%
4.6%
n=167
Fine Sediment Samples9.9%
15.7%
0.0%
62.0%
12.4%
n=36
Leaf Litter Samples
49.6%
23.1%
3.7%
20.3%
3.4%
n=82
Wood Samples28.2%
11.7%
4.2%
45.0%
11.0%
n=32
13
Figure 5 Invertebrate FFG Percent Composition
Upper Freshwater Creek, Freshwater Basin (Summer 2004) All Samples and Habitats
13.2%
33.1%
39.0%
4.5%
10.2%
Shredders
Scrapers
Filtering Collectors
Gathering Collectors
Predators
n=45
Cobble Samples
34.1%
14.3%
3.4% 1.3%
46.9%
n=25
Fine Sediment Samples1.8%
30.7%
8.1%
59.4%
n=3
Leaf Litter Samples
11.9%
3.8%
36.3%
41.2%n=13
6.8%
Wood Samples
14.4%
47.4%
18.6%8.4%
n=4
11.1%
Juvenile Salmonids per Meter: 3.01 Length of Upper Freshwater: 4.51 km

14
Figure 6 Invertebrate FFG Percent Composition
Cloney Gulch, Freshwater Basin (Summer 2004)
All Samples and Habitats
46.5%
22.1%
0.3%
24.8%
6.4%
Shredders
Scrapers
Filtering Collectors
Gathering Collectors
Predators
n=58
Cobble Samples
20.8%
0.1%
20.2%
7.4%
51.6%
n=30
Fine Sediment Samples14.3%
19.9%
56.4%
9.4%
n=10
Leaf Litter Samples
87.8%
0.6%6.3%
1.9%
3.4%
n=9
Wood Samples
28.9%
10.4%45.9%
14.8%
n=9
Juvenile Salmonids per Meter: 2.58 Length of Cloney Gulch: 2.95 km
15
Figure 7 Invertebrate FFG Percent Composition
McCready Gulch, Freshwater Basin (Summer 2004) All Samples and Habitats
18.5%
22.9%
36.5%
5.6%
16.4%
Shredders
Scrapers
Filtering Collectors
Gathering Collectors
Predators
n=42
Cobble Samples
32.3%
16.7%3.6% 3.2%
44.2%
n=18
Fine Sediment Samples15.9%
6.6%
12.2%
65.3%
n=7
Leaf Litter Samples
31.4%
43.6%4.5%
10.8% n=13
9.82%
Wood Samples32.8%
14.5%
38.9%
8.4%
n=45.34%
Juvenile Salmonids per Meter: 0.90 Length of McCready Gulch: 3.31 km

16
Figure 8 Freshwater Creek Basin
Gathering Collector Percentages and Juvenile Salmonids per Meter
Middle Mainstem Freshwater Creek
0
10
20
30
40
50
60
70
80
4 32 41 99 119 138 172 190 222Selected Unit Numbers
Gat
heri
ng C
olle
ctor
%
0
2
4
6
8
10
12
Fish
Per
Met
er
Rank 1
Upper Mainstem Freshwater Creek
0
10
20
30
40
50
60
70
80
13 39 47 77 96 139 147 176 212 227 271 288 336 347 384Selected Unit Numbers
Gat
heri
ng C
olle
ctor
%0
2
4
6
8
10
12
Fish
Per
Met
er
Rank 2
Cloney Gulch
0
10
20
30
40
50
60
70
80
21 30 53 82 104 128 161 169 200 227 241 286 339 381 401Selected Unit Numbers
Gat
heri
ng C
olle
ctor
%
0
2
4
6
8
10
12
Fish
Per
Met
er
Rank 3
Graham Gulch
0
10
20
30
40
50
60
70
80
21 53 64 96 125 145 179 205 239Selected Unit Numbers
Gat
heri
ng C
olle
ctor
%
0
2
4
6
8
10
12
Fish
Per
Met
er
Rank 4
Fish per Meter Gathering Collector Percentages
17
Figure 8 Freshwater Creek Basin
Gathering Collector Percentages and Juvenile Salmonids per Meter
Little Freshwater Creek
0
10
20
30
40
50
60
70
80
1 21 52 77 111 117 162 168 200 255 271 310
Selected Unit Numbers
Gat
heri
ng C
olle
ctor
%
0
2
4
6
8
10
12
Fish
Per
Met
er
Rank 5
South Fork Freshwater Creek
0
10
20
30
40
50
60
70
80
13 44 72 99 111 133 168 199 219 279 303 319 348 370
Selected Unit Numbers
Gat
heri
ng C
olle
ctor
%0
2
4
6
8
10
12
Fish
Per
Met
er
Rank 6
Falls Gulch
0
10
20
30
40
50
60
70
80
5 7 8 14 27 35 47 51 57 63 67 78 87 89
Selected Unit Numbers
Gat
heri
ng C
olle
ctor
%
0
2
4
6
8
10
12
Fish
Per
Met
er
Rank 7
McCready Gulch
0
10
20
30
40
50
60
70
80
15 31 62 95 114 150 175 192 218 235 261 297 335 358
Selected Unit Numbers
Gat
heri
ng C
olle
ctor
%
0
2
4
6
8
10
12
Fish
Per
Met
er
Rank 8
Fish per Meter Gathering Collector Percentages

18
Figure 9

19
Table 1
Functional group categorization and food resources (from Merrit and Cummins 1996).
CPOM= Coarse Particulate Organic Matter; FPOM= Fine Particulate Organic Matter
Functional Particle Size Dominant Food Particle Size Groups Feeding Resources Range of Food (mm) Mechanisms Shredders Chew conditioned CPOM-decomposing > 1.0 litter or live (or living hydrophyte) vascular plant vascular plants tissue, or gouge wood Filtering Suspension feeders- FPOM-decomposing 0.01-1.0 Collectors filter particles from detrital particles; algae, the water column bacteria, and feces Gathering Deposit feeders- FPOM-decomposing 0.05-1.0 Collectors ingest sediment or detrital particles; algae, gather loose par- bacteria, and feces ticles in depositional areas Scrapers Graze rock and Periphyton-attached 0.01-1.0 wood surfaces or non-filamentous algae stems of rooted and associated detritus, aquatic plants microflora and fauna, and feces Predators Capture and Prey-living animal >0.5 engulf prey or tissue ingest body fluids

20
Table2 Summary of the number of locations and invertebrate samples taken
from the six tributaries and two Main-stem stream sections in the Freshwater Creek Basin.
Number of Samples Taken per Sample Type Stream ID
Number Steam Name Sample
Locations Samples
taken Leaf Litter Cobble
Fine Sediment Wood
198 Middle Main 9 27 9 17 0 1 199 Upper Main 14 45 13 25 3 4 201 McCready Gulch 14 42 13 18 7 4 203 Little Freshwater 12 36 10 18 3 5 204 Cloney Gulch 20 58 9 30 10 9 205 Falls Gulch 14 41 10 23 5 3 206 Graham Gulch 9 26 7 12 5 2 207 South Fork 14 42 11 24 3 4
Totals 106 317 82 167 36 32
21
Table 3 Taxa encountered in the FFG invertebrate survey in the Freshwater
Creek Basin and the FFG assignments used for each. Mollusca Gastropoda (Snails) SCRAPERS Crustacea Isopoda (Aquatic Pill Bugs) SHREDDERS
Amphipoda (Side Swimmers) SHREDDERS Ostracoda (Seed Shrimp) GATHERING COLLECTORS
Arachnoidea Hydracarina (Aquatic Mites) PREDATORS
Oligochaeta GATHERING COLLECTORS Insecta Odonata Anisoptera (Dragonflies) PREDATORS Plecoptera (Stoneflies) Setipalpians Perlidae PREDATORS Chloroperlidae PREDATORS Perlodidae PREDATORS Filipalpians Nemouridae SHREDDERS Peltoperlidae SHREDDERS Leuctridae SHREDDERS Ephemeroptera (Mayflies) Baetidae GATHERING COLLECTORS Ameletiidae GATHERING COLLECTORS Ephemerellidae Serratella GATHERING COLLECTORS Timpanoga GATHERING COLLECTORS Leptophlebiidae GATHERING COLLECTORS Heptageniidae SCRAPERS Trichoptera (Caddisflies) Glossosomatidae SCRAPERS Rhyacophilidae PREDATORS Hydropsychidae FILTERING COLLECTORS Philopotamidae FILTERING COLLECTORS Polycentropidae FILTERING COLLECTORS Calamoceratidae Heteroplectron SHREDDERS Limnephilidae default [SHREDDERS] Hydatophylax SHREDDERS Ecclisomyia SHREDDERS – early instars SCRAPERS – late instrs Apataniidae Apatania SCRAPERS Sericostomatidae

22
Gumaga SCRAPERS Uenoidae Neophylax SCRAPERS Neothremma SCRAPERS Lepidostomatidae SHREDDERS Brachycentridae Micrasema SHREDDERS Trichoptera – undetermined default [SHREDDERS] Megaloptera (Helgrammites) Sialidae (Alderflies) PREDATORS Coleoptera (Beetles) Psephenidae SCRAPERS Elmidae (Larvae) Optioservus SCRAPRERS Lara SHREDDERS Dytiscidae (Adults) PREDATORS Haliplidae (Adults) SHREDDERS Diptera (True Flies) Tipulidae PREDATORS Simuliidae (Black Flies) FILTERING COLLECTORS Dixidae (Dixid Midges) GATHERING COLLECTORS Psychodidae (Moth flies) GATHERING COLLECTORS Chironomidae (Midges) default [GATHERING COLL] Orthocaldiinae GATHERING COLLECTORS Chironominae default [GATHERING COLL] Tanytarsini GATHERING COLLECTORS Tanypodinae PREDATORS Ceratopogonidae (Biting Midges) PREDATORS Athericidae (Snipe Flies) PREDATORS
23
Table 4 Comparison of fish abundance ranking and FFG
characteristics in six tributaries and two sections of the Mainstem of the Freshwater Creek basin*.
Stream Fish per
meter Fish Rank
Dominant FFG (%)
P/R Heterotrophy Vs
Autotrophy Middle Main Stem 73.4 1 Shredders
(46) 0.39 Heterotrophic
Upper Main Stem 42.7 2 Total Collectors (48)
0.54 Heterotrophic
Cloney Gulch 32.0 3 Shredders (47)
0.31 Heterotrophic
Graham Gulch 28.8 4 Scrapers (53)
1.40 Autotrophic
Little Freshwater 16.3 5 Scrapers (71)
2.70 Autotrophic
South Fork 12.9 6 Scrapers (46)
0.93 Autotrophic
Falls Gulch 12.1 7 Scrapers (41)
0.74 [Autotrophic]
McCready Gulch 5.4 8 Total Collectors (52)
0.32 Heterotrophic
*Fish per m (mean fish per linear meter of stream); Fish rank (ranking of fish per m); Dominant FFG (%) (dominant group and its mean relative %); P/R (ratio of Scrapers to total collectors + shredders, a surrogate for ratio of gross primary production to community respiration); Heterotrophy vs Autotrophy based on a P/R threshold of > 0.75 = autotrophic).

24
Table 5 Invertebrate functional feeding group (FFG) and behavioral drift
ratios as surrogates for stream ecosystem attributes
ECOSYSTEM ATTRIBUTE DESCRIPTION FFG RATIO
P/R
Autotrophy/Heterotrophy Index Gross Primary Production Total Community Respiration
Scrapers Shredders + Total Collectors (Threshold: 0.75)
CPOM/FPOM
Shredder-Riparian Index Benthic CPOM Benthic FPOM
Shredders Total Collectors (Threshold: Fall-Winter 0.50; Spring-Summer
TFPOM/BFPOM
Suspended Load Index FPOM in Transport Benthic FPOM
Filtering Collectors Gathering Collectors (Threshold: 1.00)
STABILITY
Substrate Stability Index (Cobbles + Wood)
Scrapers + Filtering Collectors Shredders + Gathering Collectors (Threshold: 0.60)
SALMONID FOOD
Juvenile Salmonid Food Index Predictable Invertebrate Supply Unpredictable Invertebrate Supply *Approximation of Index:
Behavioral Drifters* Accidental Drifters (Threshold: 0.50) Filtering + Gathering Collectors Scrapers+Shredders+Predators (Threshold: 0.50)

25
Table 6 Juvenile salmonid gut analyses from Cloney Gulch.
SH = steelhead trout, n = 10; CT = cutthroat trout, n = 12; CO = coho salmon, n = 11
Fish Mean Fish wt (gm)
Mean No.
Inverts per
Stomach
Mean total wt Inverts
per Stomach
(mg)
Mean wt per
individual Invert (mg)
mg Inverts per gm
Fish
Mean total wt
(mg) Aquatic Inverts
per Stomach
Mean total wt (mg)
Terrestrial Inverts
per Stomach
% Fish without
Terrestrial Inverts
SH 15.7 18.7 7.7 0.4 0.49 5.1 5.3 50
CT 24.7 8.3 55.3 6.7 2.24 25.8 44.3 33
CO 6.0 20.6 14.1 0.7 2.35 10.1 5.5 36
Total 15.5 15.4 27.1 1.8 1.75 14.2 17.0 39
Table 7 Ratio of behavioral drifter to accidental drifter invertebrates in juvenile
salmonid stomach samples collected in Cloney Gulch. (Threshold for adequate food supply of behavioral drifters for drift-feeding
fish taken as > 0.50.)
Number of Fish Stomachs
Number Ratio Weight Ratio With Caddis* Number Ratio
With Caddis* Weight Ratio
17 0.73 0.52
31 2.23 3.00
% Fish Above Threshold 29 23 26 32
* Lepidostoma with organic case and < 4 mm length included as behavioral drifters

26
Appendix I Field Key used in the study of the Freshwater Creek Basin
KEY TO INVERTEBRATE
FUNCTIONAL FEEDING GROUPS
Ken Cummins, Interim Director
Institute for Forest and Watershed Management
Peggy Wilzbach, Assistant Leader California Cooperative Fishery Research Unit
Rich Merritt, Chair
Department of Entomology, Michigan State University
Ken Cummins IRE [email protected] 592 14th Street June 2003 Arcata, CA 95521

27

28

29

30

31
32

33

34
Appendix II Example Field Data Sheet

35
Appendix III FFG Percent Composition invertebrate functional feeding groups in Freshwater Creek Middle Mainstem and tributaries (Graham Gulch,
Little Freshwater, South Fork, and Falls Gulch)

36
Invertebrate (FFG) Percent Composition, Middle Freshwater Creek, Freshwater Basin (Summer 2004)
All Samples and Habitats
46.0%
26.5%
17.2%
6.1%
4.2%
Shredders
Scrapers
Filtering Collectors
Gathering Collectors
Predators
n=27
Cobble Samples
22.2%
5.4%
11.9% 5.9%
54.6%
n=17
Fine Sediment Samples
n=0
No Data Available
Leaf Litter Samples
76%
6%
3%
13%
2%
n=9
Wood Samples
15.8%
57.9%
21.1%5.3%
n=1
Juvenile Salmonids per Meter: 3.47 Length of Middle Freshwater: 3.91 km
37
Invertebrate (FFG) Percent Composition Graham Gulch, Freshwater Basin (Summer 2004)
All Samples and Habitats
13.9%
53.5%
1.6%
22.6%
8.4%
Shredders
Scrapers
Filtering Collectors
Gathering Collectors
Predators
n=26
Cobble Samples
4.8%
3.0%
17.9%
5.0%
69.3%
n=12
Fine Sediment Samples6.6%
6.3%
58.4%
28.7%
n=5
Leaf Litter Samples
23.6%
1.0%
9.7%
2.6%
63.1%
n=7
Wood Samples
48.6%
41.4%
10.0%
n=2
Juvenile Salmonids per Meter: 2.61 Length of Graham Gulch: 2.04 km

38
Invertebrate (FFG) Percent Composition Little Freshwater Creek, Freshwater Basin (Summer 2004)
All Samples and Habitats
9.3%
70.9%
0.6%
15.9%
3.4%
Shredders
Scrapers
Filtering Collectors
Gathering Collectors
Predators
n=36
Cobble Samples1.7%
0.6%
13.1%
2.4%
82.2%
n=18
Fine Sediment Samples
17.2%
0.9%
68.1%
13.8%
n=3
Leaf Litter Samples
23.4%
0.3%
12.0%
3.1%61.2%
n=10
Wood Samples
22.9%
17.7%45.8%
11.5%
n=5 2.8%
Juvenile Salmonids per Meter: 1.68 Length of Little Freshwater Creek: 3.31 km

39
Invertebrate (FFG) Percent Composition South Fork, Freshwater Basin (Summer 2004)
All Samples and Habitats
18.9%
45.6%
3.2%
26.9%
5.4%
Shredders
Scrapers
Filtering Collectors
Gathering Collectors
Predators
n=42
Cobble Samples
4.4%
3.1%
19.4%
4.1%
69.0%
n=24
Fine Sediment Samples
11.4%
7.6%
70.8%
10.3%
n=3
Leaf Litter Samples
49.7%
5.4%
26.6% 5.3%
12.9%
n=11
Wood Samples
43.2%
38.1%
10.8%
n=4
0.7%
7.2%
Juvenile Salmonids per Meter: 1.46 Length of South Fork Freshwater: 3.26 km
40
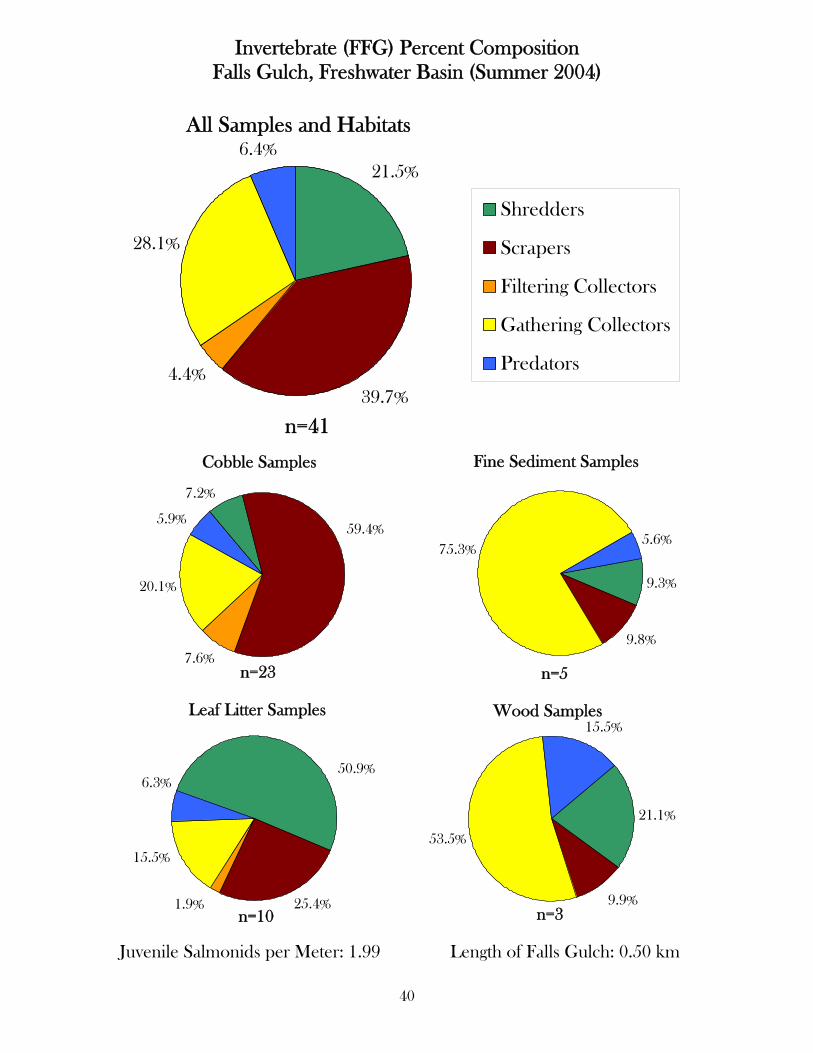
Invertebrate (FFG) Percent Composition Falls Gulch, Freshwater Basin (Summer 2004)
All Samples and Habitats
21.5%
39.7%4.4%
28.1%
6.4%
Shredders
Scrapers
Filtering Collectors
Gathering Collectors
Predators
n=41
Cobble Samples
7.2%
7.6%
20.1%
5.9%59.4%
n=23
Fine Sediment Samples
9.3%
9.8%
75.3%5.6%
n=5
Leaf Litter Samples
50.9%
1.9%
15.5%
6.3%
25.4%n=10
Wood Samples
21.1%
53.5%
15.5%
n=39.9%
Juvenile Salmonids per Meter: 1.99 Length of Falls Gulch: 0.50 km

41
$T$T$T
#
#
#
#
#
#
#
#
#
# #
#
#
#
#
#
#
#
#
#
#
#
#
$
$
$
$$
$
$
$
$
$
$
$
$
$
31
62
95 114
150
175192
218
235
261
297
335
15
358
North Coast California
FreshwaterCreek
System
Eureka
N
EW
S
Sources: Data contact: Kenneth W. Cummins and Dana R. McCan ne, Institute for River Ecosystems, Humb oldt State University, Arcata, CA Projection system: UTM Zo ne 10N, NAD 1927 Data layers: Unit, Redd an d Invertebr ate Data: Developed using event meth odolo gy on the routed hydrog raphy Stream lines: 1:24k routed hydrography developed by the Calif. Dept. of Forestry and Fire Protection Map compiled by: An gie Brown, IRE. April 2005May contain errors of omission or commission
Invertebrate Functional GroupCommunity Organization,
Survey Units, and
Observed Salmonid Reddson McCready Gulch during
Aug - Sept, 2004
$T Survey Locations (with unit number displayed)
Invertebrate Functional GroupsShreddersScrapersFilterersGatherersPredators
StreamsStreams in Survey
Number of Observed Redds 0 1 - 3 4 - 7
100 0 100 200 Meters

42
$$ $ $
$
$ $
$$ $ $
$$ $ $
#
#
#
#
#
#
#
#
#
##
# #
#
#
1339
4777
96
139
147
176
227
271288
336384
347212
North Coast California
FreshwaterC reek
System
Eureka
N
EW
S
Sources: Data contact: Kenneth W. Cummins and Dana R. M cCan ne, Ins titute for River Ecosys tems, H umbo ldt State U nivers ity, A rcata, CA P rojection sys tem: U TM Zo ne 10N , NA D 1927 Data layers : U nit, Redd an d Invertebr ate D ata: Developed using event meth odolo gy on the routed hydrog raphy S tream lines : 1:24k routed hydrography developed by the Calif. Dept. of Forestry and Fire P rotectio n M ap comp iled by: An gie Brown, IRE. April 2005May contain errors of omission or commission
Invertebrate Functional GroupCommunity O rganiza tion,
Survey Units, and
O bserved Salmonid Reddson the Upper Mainstem
of Freshwater Creek during A ug - Sept, 2004
$T Survey Locations (with unit number displayed)
Invertebrate Functional GroupsShreddersScrapersFilterersGatherersPredators
StreamsStreams in Survey
Number of Observed Redds 0 1 - 3 4 - 13
300 0 300 600 Meters