using markov chain model to evaluate medical students
TRANSCRIPT
RESEARCH ARTICLE Open Access
Using Markov chain model to evaluatemedical students’ trajectory on progresstests and predict USMLE step 1 scores---aretrospective cohort study in one medicalschoolLing Wang1* , Heather S. Laird-Fick1, Carol J. Parker2 and David Solomon1,2
Abstract
Background: Medical students must meet curricular expectations and pass national licensing examinations tobecome physicians. However, no previous studies explicitly modeled stages of medical students acquiring basicscience knowledge. In this study, we employed an innovative statistical model to characterize students’ growthusing progress testing results over time and predict licensing examination performance.
Methods: All students matriculated from 2016 to 2017 in our medical school with USMLE Step 1 test scores wereincluded in this retrospective cohort study (N = 358). Markov chain method was employed to: 1) identify latentstates of acquiring scientific knowledge based on progress tests and 2) estimate students’ transition probabilitiesbetween states. The primary outcome of this study, United States Medical Licensing Examination (USMLE) Step 1performance, were predicted based on students’ estimated probabilities in each latent state identified by Markovchain model.
Results: Four latent states were identified based on students’ progress test results: Novice, Advanced Beginner I,Advanced Beginner II and Competent States. At the end of the first year, students predicted to remain in theNovice state had lower mean Step 1 scores compared to those in the Competent state (209, SD = 14.8 versus 255,SD = 10.8 respectively) and had more first attempt failures (11.5% versus 0%). On regression analysis, it is found thatat the end of the first year, if there was 10% higher chance staying in Novice State, Step 1 scores will be predicted2.0 points lower (95% CI: 0.85–2.81 with P < .01); while 10% higher chance in Competent State, Step 1scores will bepredicted 4.3 points higher (95% CI: 2.92–5.19 with P < .01). Similar findings were also found at the end of secondyear medical school.
(Continued on next page)
© The Author(s). 2021 Open Access This article is licensed under a Creative Commons Attribution 4.0 International License,which permits use, sharing, adaptation, distribution and reproduction in any medium or format, as long as you giveappropriate credit to the original author(s) and the source, provide a link to the Creative Commons licence, and indicate ifchanges were made. The images or other third party material in this article are included in the article's Creative Commonslicence, unless indicated otherwise in a credit line to the material. If material is not included in the article's Creative Commonslicence and your intended use is not permitted by statutory regulation or exceeds the permitted use, you will need to obtainpermission directly from the copyright holder. To view a copy of this licence, visit http://creativecommons.org/licenses/by/4.0/.The Creative Commons Public Domain Dedication waiver (http://creativecommons.org/publicdomain/zero/1.0/) applies to thedata made available in this article, unless otherwise stated in a credit line to the data.
* Correspondence: [email protected] of Medicine, Michigan State University, 909 Wilson Rd, 120West Fee Hall, East Lansing, MI 48824, USAFull list of author information is available at the end of the article
Wang et al. BMC Medical Education (2021) 21:200 https://doi.org/10.1186/s12909-021-02633-8
(Continued from previous page)
Conclusions: Using the Markov chain model to analyze longitudinal progress test performance offers a flexible andeffective estimation method to identify students’ transitions across latent stages for acquiring scientific knowledge. Theresults can help identify students who are at-risk for licensing examination failure and may benefit from targetedacademic support.
Keywords: Longitudinal study, Markov chain model, Progress tests, USMLE step 1 performance
BackgroundMedical education has evolved from a focus on theprocess of education to a focus on outcomes and demon-stration of competence. This shift is, in part, founded onthe work of Stuart E. Dreyfus and Hubert L. Dreyfus. Theydeveloped a model of skill acquisition through formal in-struction and practice [1]. The Dreyfus model proposesthat a student passes through five distinct stages: novice,competence, proficiency, expertise, and mastery. Modelinggrowth as changes in developmental stages has proven tobe useful in many fields. Examples include Piaget’s stagesof cognitive development [2], Kohlberg’s stages of moraldevelopment [3], stage-sequential models for reading de-velopment [4] and paired associate learning [5]. Progresstesting assesses learner growth over time through the ad-ministration of examinations of similar content and diffi-culty across the curriculum. In 2016 our medical schooladopted an innovative use of the National Board of Med-ical Examiners (NBME) Comprehensive Basic ScienceExamination (CBSE) and Customized Assessment Services(CAS) tests for progress testing twice per semester for thefive semesters of the pre-clerkship curriculum. Minimumexpectations for examination performance are establishedfor each semester. The examinations contribute to stu-dents’ grades and inform decisions about progressionwithin the curriculum. However, methodological issuesmay limit the generalizability of progress tests to largerscale contexts, and their ability to predict future perform-ance in USMLE step examinations.Previous studies correlated scores on each iteration of a
progress test with USMLE Step1 results independently [6,7] and found that later progress tests’ scores were highlycorrelated with Step 1 performance. In these studies, thegrowth paths of performance on the progress tests wereignored. Another branch of studies modelled the growthof medical knowledge using progress tests [8], but thegrowth of medical knowledge was not used to predictUSMLE Step 1 results. Thus, it was unclear to medical ed-ucators how to best use the tests to confirm the effective-ness of the curriculum and predict student performanceon the USMLE Step 1.In this study we employed Markov chain methodology [9,
10] to evaluate medical students’ dynamic trajectories onNBME CBSE and CAS examinations given as progress teststo predict their USMLE Step 1 performance. in contrast to
traditional ANOVA models, the Markov chain model con-siders the correlation of the previous state to the next one,naturally generating each student’s growth pattern based onestimated steady-states. This is in contrast to Growth Mix-ture Modeling (GMM) [11], another approach to modelinggrowth over time, which estimates subgroup, not individual,growth patterns. These individual growth patterns, in turn,can be used to predict Step 1 performance parametrically.The Markov chain approach to assessing growth in medicalknowledge can be described as moving through several dif-ferent states of knowledge as proposed by Dreyfus model. Inthe beginning, students have limited knowledge of medicinedespite completing prerequisite science courses, and hencetheir performance is expected to be well below expectationsfor passing USLME Step 1. This can be modeled by meansof a Novice state, in which the probability of providing acorrect answer is low. At the end of a course of study, stu-dents have attained a depth of medical knowledge, and hencehaving a very high probability of passing USMLE Step 1,which is called Competent state. Depending on their learn-ing strategies, students may pass through several intermedi-ate states, dubbed Advanced Beginner states, in which theyhave a growing but incomplete medical knowledge base. Thenumber of latent states and the thresholds of each latentstate can be estimated by the Latent Markov model [12]. Wehypothesized that students with higher transition probabil-ities to the Competent state would have better performanceon USMLE Step 1, which is the primary outcome of thestudy. This study has three aims: (1) to identify the latentstages medical students go through in the first 2 years ofmedical school using progressive tests results, (2) to identifystudents’ transition probabilities among different stages, and(3) to predict USMLE Step 1 results based on their transitionprobabilities.
MethodsStudent sample and measurement instrumentsThe sample was comprised of all medical students whomatriculated to Michigan State University College ofHuman Medicine in Fall 2016 or Fall 2017 and finishedStep 1 at the end of the second year of their program(N = 358). NBME progress tests were administered twiceper semester for five semesters. Thus, up to ten NBMEtest scores per student were collected for this cohort.Most students (86.2%) completed all ten NBME tests.
Wang et al. BMC Medical Education (2021) 21:200 Page 2 of 9
Missing NBME test scores were imputed using multipleimputation method [13]. We also controlled for stu-dents’ Medical College Admissions Test (MCAT) scoresin the analysis, as prior studies have shown an associ-ation between MCAT and Step 1 scores [14, 15]. Linked,deidentified data were obtained using our college’s hon-est broker (https://omerad.msu.edu/research/honest-broker-for-educational-scholarship), a methodology pre-viously determined to be exempt by the Michigan StateUniversity Human Subjects Review Program.
NBME progress tests and USMLE step 1 resultsThe CBSE is a 200-item multiple-choice question (MCQ)exam made available by the NBME as a representative testblueprinted against the Step 1 content outline. Studentsreceive scaled scores for the total test. Because there are alimited number of forms of the CBSE available at anygiven time, we also utilized the NBME’s Customized As-sessment Services (CAS) to create examinations. These
examinations were blueprinted to provide subscores forcategories corresponding to disciplines integrated withinour curriculum. NBME generated both total test percentcorrect scores and locally scaled scores for the total testand individual content areas we defined during the testconstruction phase. Percent correct scores from CAS testswere used for our analysis. Among the ten NBME tests,there were six CAS and four CBSE tests for the 2016 co-hort and five CAS and five CBSE test for the 2017 cohort.The USMLE Step 1 is a large multiple choice question
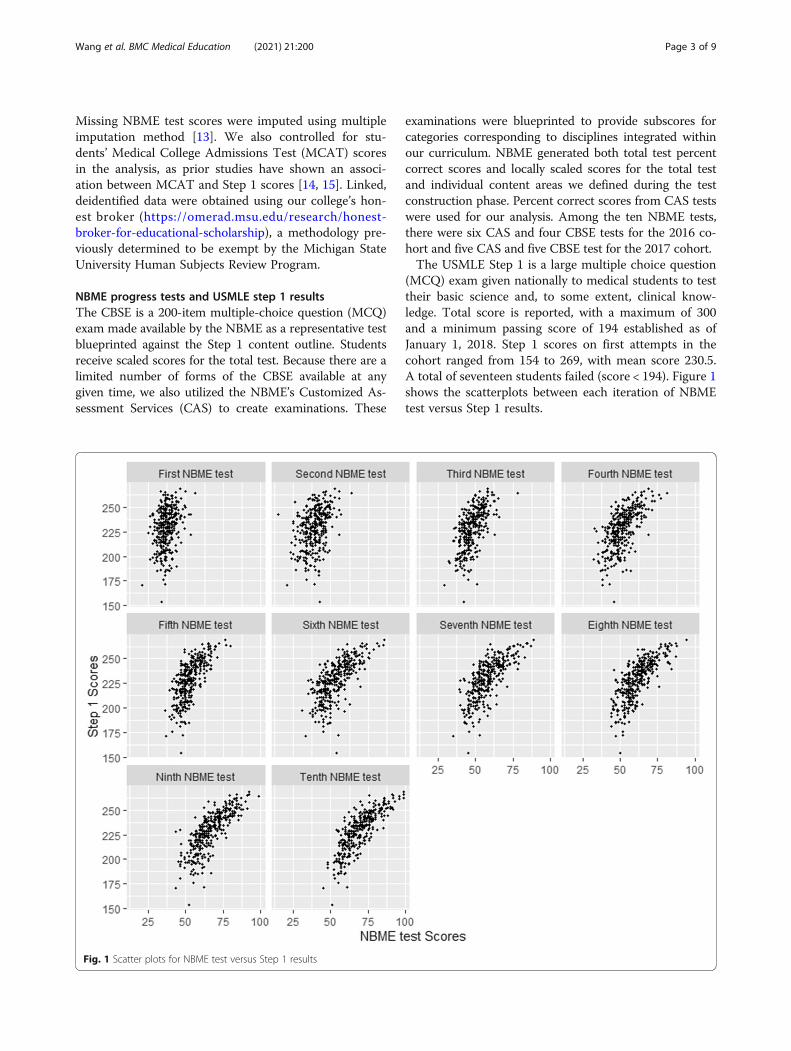
(MCQ) exam given nationally to medical students to testtheir basic science and, to some extent, clinical know-ledge. Total score is reported, with a maximum of 300and a minimum passing score of 194 established as ofJanuary 1, 2018. Step 1 scores on first attempts in thecohort ranged from 154 to 269, with mean score 230.5.A total of seventeen students failed (score < 194). Figure 1shows the scatterplots between each iteration of NBMEtest versus Step 1 results.
Fig. 1 Scatter plots for NBME test versus Step 1 results
Wang et al. BMC Medical Education (2021) 21:200 Page 3 of 9

Statistical AnalysisMarkov chain is a stochastic model describing a se-quence of possible events in which the probability ofeach event depends on the state attained in the previ-ous event. To describe a Markov chain, we first de-fine a set of states, S = {s1,s2,..., sr} where r indicatesthe number states at one time point. The processstarts with one of the states and moves successivelyto the same state or another one at the next timepoint. The probabilities of moving from state si to sjare called transition probabilities.We first identified the number of latent states and
the thresholds for each state using the Latent MarkovModel [2]. Grid search method was employed to findthe best model fit using three to six latent states. Themodel likelihood for each latent state was obtainedbased on maximum likelihood estimators. The twomost commonly used criteria [Akaike information cri-terion (AIC) and Bayesian information criterion(BIC)] [16] were used to find the optimal number oflatent states. The cutoffs of NBME test scores in eachlatent state were obtained based on estimated meanand standard deviation of scores in each state. A de-tailed setup and estimation algorithm of this LatentMarkov Model is shown in the Appendix.Once the number of latent states and score ranges
for each latent stage were identified, the transitionprobabilities to each state were calculated for eachstudent. Students’ steady-states were estimated basedon their transition probabilities. The steady state ofthe Markov chain is the probability distribution ofeach of the equilibrium states in the long run. Inour study, a student’s steady state is the likelihood(i.e. predicted probability) of the student attainingeach latent state in the long run. If a student has ahigh likelihood of remaining in the Novice state, thatsuggests that the student has not been able to ac-quire, consolidate or apply knowledge, presumablybecause of inadequate learning strategies. Lastly stu-dents’ probability distributions in steady-states wereregressed against their Step 1 results to see if per-formance on progress tests predicted Step 1 scores.Two scenarios were considered in this study: 1)
steady-states obtained from the first six NBME tests
were examined to determine whether it is possible toidentify academically at-risk students at the end ofthe first year, and 2) steady-states obtained from allten NBME tests were examined to determine if it ispossible to identify students at risk of not passingStep 1. All statistical analyses were performed using Rversion 3.5.3.11 [17].
ResultsLatent statesTable 1 shows the results of the model fit using differentnumbers of latent states. Based on the BIC criterion,four latent states gave the lowest BIC values and pro-vided the optimal model fit: s1: Novice state; s2: Ad-vanced Beginner I state, s3: Advanced Beginner II state,and s4: Competent state. The range of NBME test scoresin each state were s1: [0, 44], s2: (44, 56], s3: (56, 69] ands4: (69, 100].
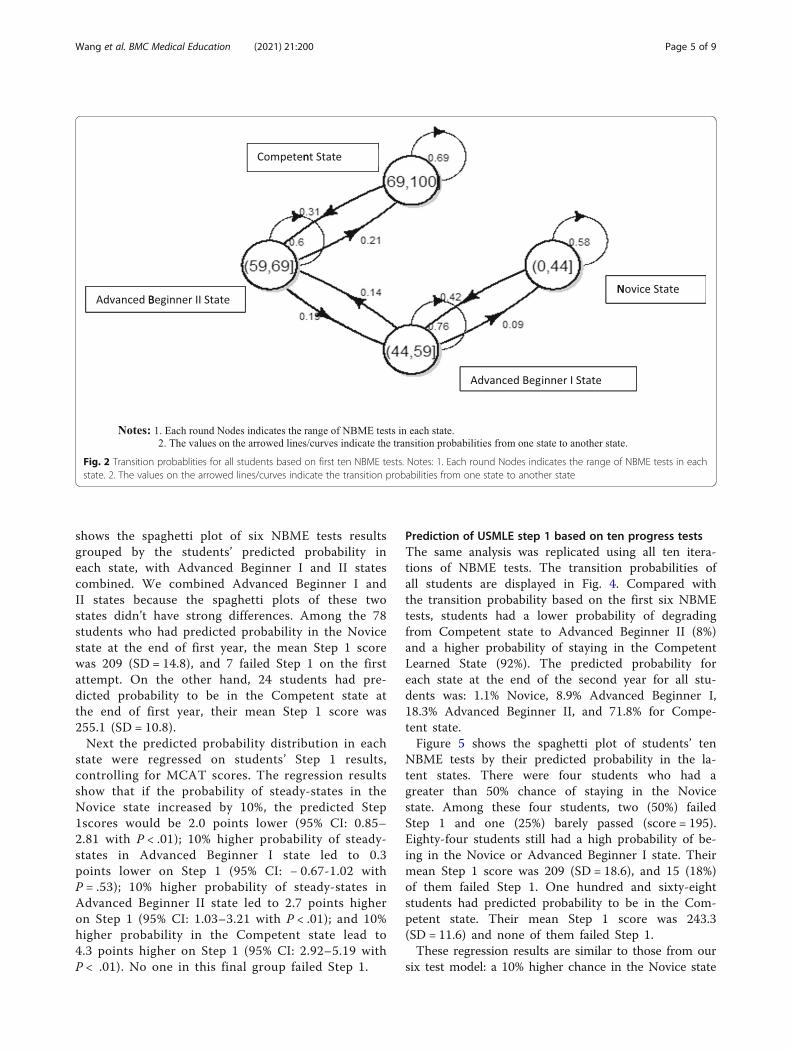
Prediction of USMLE step 1 based on first six progresstestsStudents’ transition probability based on the firstsix NBME tests are displayed in Fig. 2. Studentswith NBME scores in the category of Novice state(s1) have a 58% of chance staying in the same stateand 42% of chance improving to Advanced BeginnerI state. Students in Advanced Beginner I state havea 76% chance staying in the same state, 14% chanceimproving to Advanced Beginner II state, and 9%chance of degrading to the Novice state. Studentsin Advanced Beginner II State have a 60% chancestaying in the same category, 21% chance of im-proving, and 19% chance of degrading. The studentsin the Competent state have a 69% chance of stay-ing in the same category and 31% chance of de-grading at the end of the first year of medicalschool.Based on the transition probabilities, the predicted
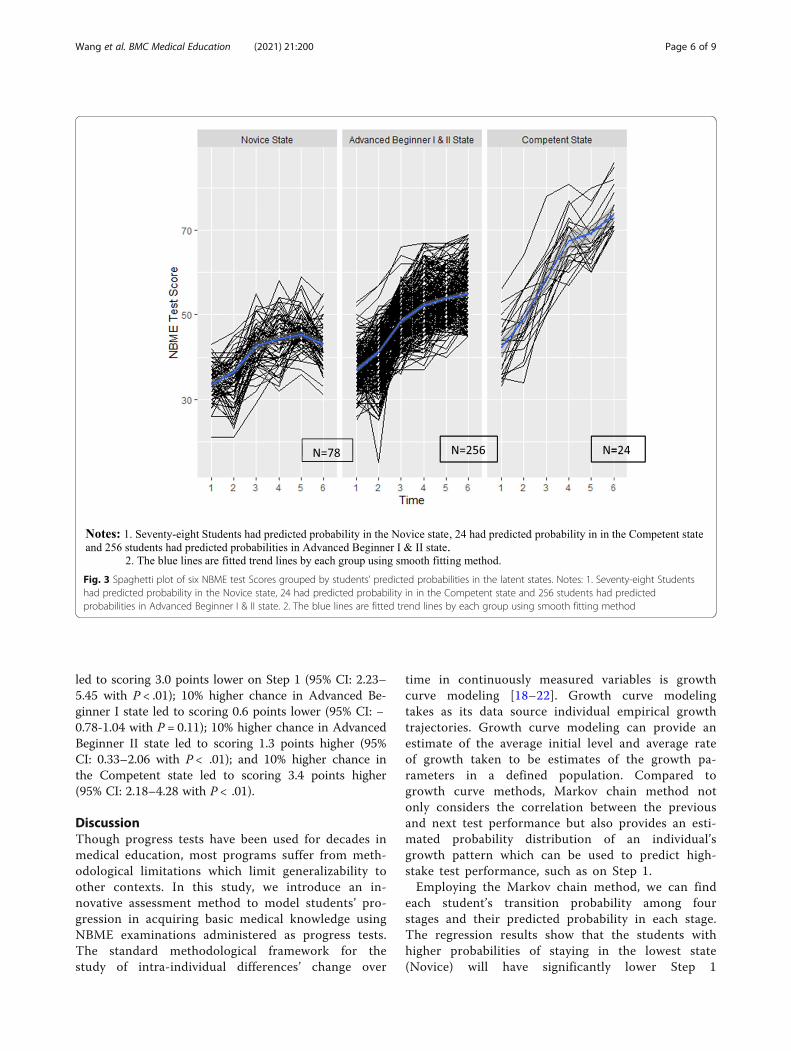
probability in each state at the end of first year inmedical school for all 358 students were: 8.5% Nov-ice, 39.9% Advanced Beginner I, 30.4% Advanced Be-ginner II, and 21.2% Competent state. Each student’spredicted probability in each state was estimatedbased on their own transition probability. Figure 3
Table 1 Selection of number of latent states using Latent Markov Model
Number of Latent States Test score ranges in each latent state AICa BICb
3 [0,45], (45,59), (59,100] 25,851.63 26,014.38
4 [0, 44], (44, 56], (56, 69], (69, 100] 25,875.68 25,991.92
5 [0, 44], (44, 55], (56, 62], (62, 71], (71, 100] 26,197.04 26,243.54
6 [0, 43], (43, 50], (50, 56], (56, 64], (64, 72], (72,100] 25,928.72 26,006.22aAIC equals − 2* loglikehood + 2* number of parametersbBIC equals − 2* loglikehood + log (number of observations)* number of parameters
Wang et al. BMC Medical Education (2021) 21:200 Page 4 of 9
shows the spaghetti plot of six NBME tests resultsgrouped by the students’ predicted probability ineach state, with Advanced Beginner I and II statescombined. We combined Advanced Beginner I andII states because the spaghetti plots of these twostates didn’t have strong differences. Among the 78students who had predicted probability in the Novicestate at the end of first year, the mean Step 1 scorewas 209 (SD = 14.8), and 7 failed Step 1 on the firstattempt. On the other hand, 24 students had pre-dicted probability to be in the Competent state atthe end of first year, their mean Step 1 score was255.1 (SD = 10.8).Next the predicted probability distribution in each
state were regressed on students’ Step 1 results,controlling for MCAT scores. The regression resultsshow that if the probability of steady-states in theNovice state increased by 10%, the predicted Step1scores would be 2.0 points lower (95% CI: 0.85–2.81 with P < .01); 10% higher probability of steady-states in Advanced Beginner I state led to 0.3points lower on Step 1 (95% CI: − 0.67-1.02 withP = .53); 10% higher probability of steady-states inAdvanced Beginner II state led to 2.7 points higheron Step 1 (95% CI: 1.03–3.21 with P < .01); and 10%higher probability in the Competent state lead to4.3 points higher on Step 1 (95% CI: 2.92–5.19 withP < .01). No one in this final group failed Step 1.
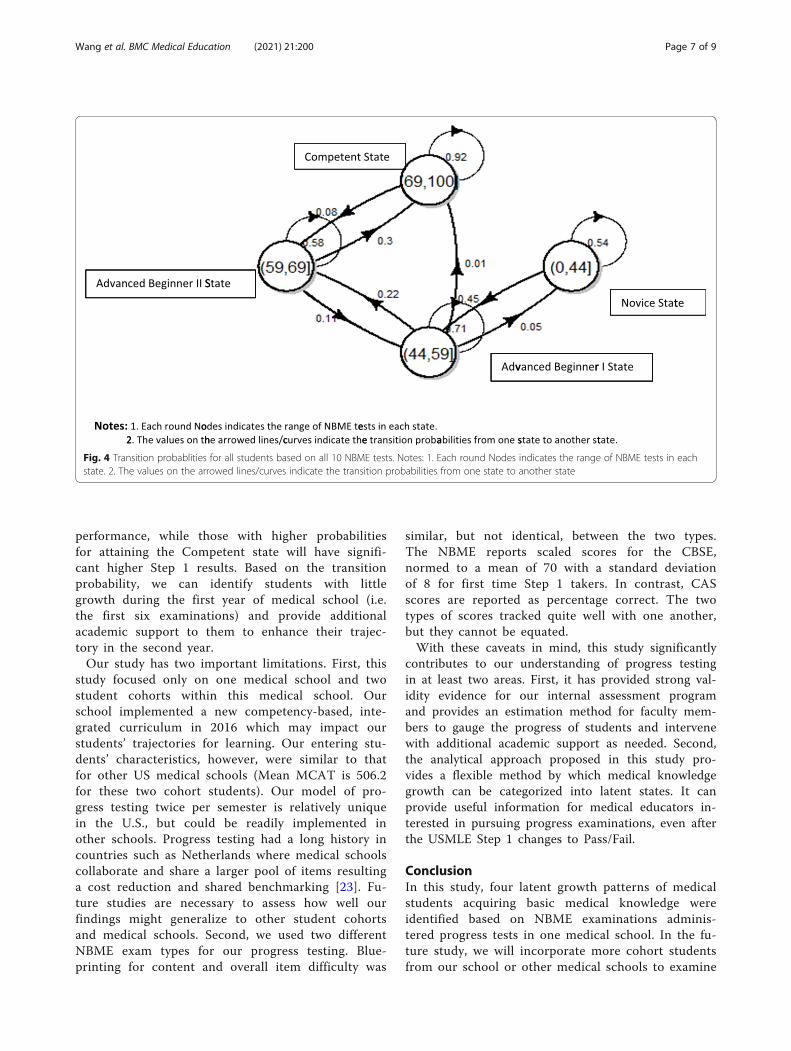
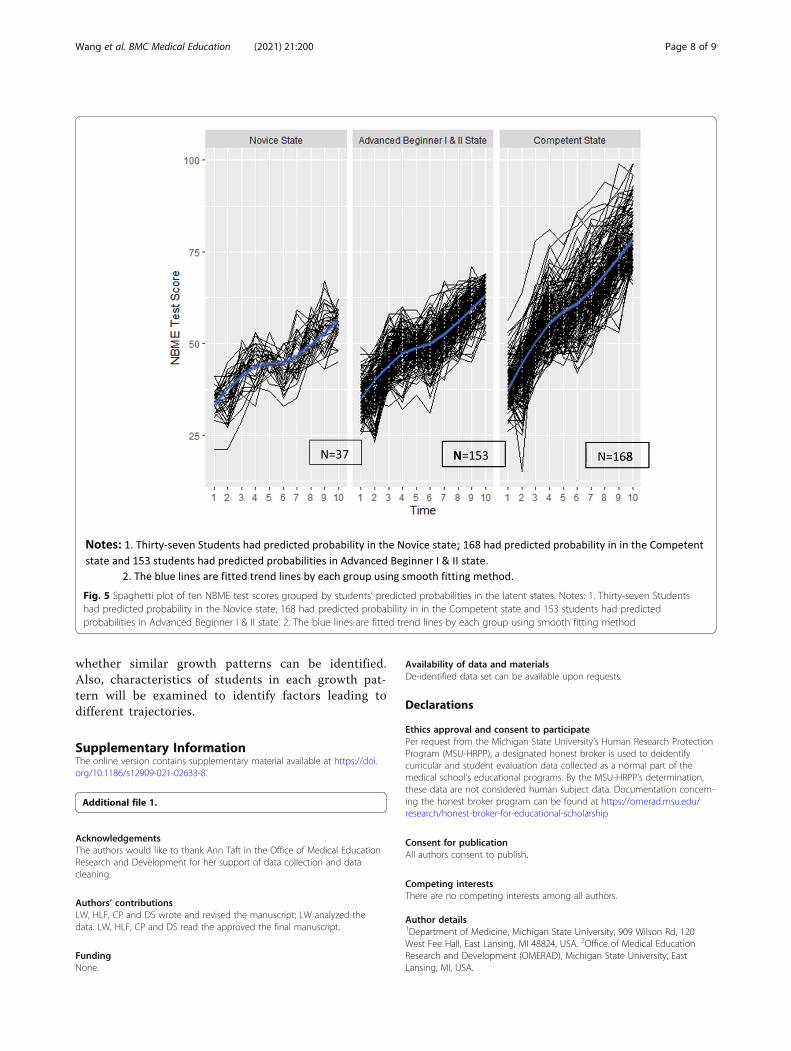
Prediction of USMLE step 1 based on ten progress testsThe same analysis was replicated using all ten itera-tions of NBME tests. The transition probabilities ofall students are displayed in Fig. 4. Compared withthe transition probability based on the first six NBMEtests, students had a lower probability of degradingfrom Competent state to Advanced Beginner II (8%)and a higher probability of staying in the CompetentLearned State (92%). The predicted probability foreach state at the end of the second year for all stu-dents was: 1.1% Novice, 8.9% Advanced Beginner I,18.3% Advanced Beginner II, and 71.8% for Compe-tent state.Figure 5 shows the spaghetti plot of students’ ten
NBME tests by their predicted probability in the la-tent states. There were four students who had agreater than 50% chance of staying in the Novicestate. Among these four students, two (50%) failedStep 1 and one (25%) barely passed (score = 195).Eighty-four students still had a high probability of be-ing in the Novice or Advanced Beginner I state. Theirmean Step 1 score was 209 (SD = 18.6), and 15 (18%)of them failed Step 1. One hundred and sixty-eightstudents had predicted probability to be in the Com-petent state. Their mean Step 1 score was 243.3(SD = 11.6) and none of them failed Step 1.These regression results are similar to those from our
six test model: a 10% higher chance in the Novice state
Fig. 2 Transition probablities for all students based on first ten NBME tests. Notes: 1. Each round Nodes indicates the range of NBME tests in eachstate. 2. The values on the arrowed lines/curves indicate the transition probabilities from one state to another state
Wang et al. BMC Medical Education (2021) 21:200 Page 5 of 9
led to scoring 3.0 points lower on Step 1 (95% CI: 2.23–5.45 with P < .01); 10% higher chance in Advanced Be-ginner I state led to scoring 0.6 points lower (95% CI: −0.78-1.04 with P = 0.11); 10% higher chance in AdvancedBeginner II state led to scoring 1.3 points higher (95%CI: 0.33–2.06 with P < .01); and 10% higher chance inthe Competent state led to scoring 3.4 points higher(95% CI: 2.18–4.28 with P < .01).
DiscussionThough progress tests have been used for decades inmedical education, most programs suffer from meth-odological limitations which limit generalizability toother contexts. In this study, we introduce an in-novative assessment method to model students’ pro-gression in acquiring basic medical knowledge usingNBME examinations administered as progress tests.The standard methodological framework for thestudy of intra-individual differences’ change over
time in continuously measured variables is growthcurve modeling [18–22]. Growth curve modelingtakes as its data source individual empirical growthtrajectories. Growth curve modeling can provide anestimate of the average initial level and average rateof growth taken to be estimates of the growth pa-rameters in a defined population. Compared togrowth curve methods, Markov chain method notonly considers the correlation between the previousand next test performance but also provides an esti-mated probability distribution of an individual’sgrowth pattern which can be used to predict high-stake test performance, such as on Step 1.Employing the Markov chain method, we can find
each student’s transition probability among fourstages and their predicted probability in each stage.The regression results show that the students withhigher probabilities of staying in the lowest state(Novice) will have significantly lower Step 1
Fig. 3 Spaghetti plot of six NBME test Scores grouped by students’ predicted probabilities in the latent states. Notes: 1. Seventy-eight Studentshad predicted probability in the Novice state, 24 had predicted probability in in the Competent state and 256 students had predictedprobabilities in Advanced Beginner I & II state. 2. The blue lines are fitted trend lines by each group using smooth fitting method
Wang et al. BMC Medical Education (2021) 21:200 Page 6 of 9
performance, while those with higher probabilitiesfor attaining the Competent state will have signifi-cant higher Step 1 results. Based on the transitionprobability, we can identify students with littlegrowth during the first year of medical school (i.e.the first six examinations) and provide additionalacademic support to them to enhance their trajec-tory in the second year.Our study has two important limitations. First, this
study focused only on one medical school and twostudent cohorts within this medical school. Ourschool implemented a new competency-based, inte-grated curriculum in 2016 which may impact ourstudents’ trajectories for learning. Our entering stu-dents’ characteristics, however, were similar to thatfor other US medical schools (Mean MCAT is 506.2for these two cohort students). Our model of pro-gress testing twice per semester is relatively uniquein the U.S., but could be readily implemented inother schools. Progress testing had a long history incountries such as Netherlands where medical schoolscollaborate and share a larger pool of items resultinga cost reduction and shared benchmarking [23]. Fu-ture studies are necessary to assess how well ourfindings might generalize to other student cohortsand medical schools. Second, we used two differentNBME exam types for our progress testing. Blue-printing for content and overall item difficulty was
similar, but not identical, between the two types.The NBME reports scaled scores for the CBSE,normed to a mean of 70 with a standard deviationof 8 for first time Step 1 takers. In contrast, CASscores are reported as percentage correct. The twotypes of scores tracked quite well with one another,but they cannot be equated.With these caveats in mind, this study significantly
contributes to our understanding of progress testingin at least two areas. First, it has provided strong val-idity evidence for our internal assessment programand provides an estimation method for faculty mem-bers to gauge the progress of students and intervenewith additional academic support as needed. Second,the analytical approach proposed in this study pro-vides a flexible method by which medical knowledgegrowth can be categorized into latent states. It canprovide useful information for medical educators in-terested in pursuing progress examinations, even afterthe USMLE Step 1 changes to Pass/Fail.
ConclusionIn this study, four latent growth patterns of medicalstudents acquiring basic medical knowledge wereidentified based on NBME examinations adminis-tered progress tests in one medical school. In the fu-ture study, we will incorporate more cohort studentsfrom our school or other medical schools to examine
Fig. 4 Transition probablities for all students based on all 10 NBME tests. Notes: 1. Each round Nodes indicates the range of NBME tests in eachstate. 2. The values on the arrowed lines/curves indicate the transition probabilities from one state to another state
Wang et al. BMC Medical Education (2021) 21:200 Page 7 of 9
whether similar growth patterns can be identified.Also, characteristics of students in each growth pat-tern will be examined to identify factors leading todifferent trajectories.
Supplementary InformationThe online version contains supplementary material available at https://doi.org/10.1186/s12909-021-02633-8.
Additional file 1.
AcknowledgementsThe authors would like to thank Ann Taft in the Office of Medical EducationResearch and Development for her support of data collection and datacleaning.
Authors’ contributionsLW, HLF, CP and DS wrote and revised the manuscript; LW analyzed thedata. LW, HLF, CP and DS read the approved the final manuscript.
FundingNone.
Availability of data and materialsDe-identified data set can be available upon requests.
Declarations
Ethics approval and consent to participatePer request from the Michigan State University’s Human Research ProtectionProgram (MSU-HRPP), a designated honest broker is used to deidentifycurricular and student evaluation data collected as a normal part of themedical school’s educational programs. By the MSU-HRPP’s determination,these data are not considered human subject data. Documentation concern-ing the honest broker program can be found at https://omerad.msu.edu/research/honest-broker-for-educational-scholarship
Consent for publicationAll authors consent to publish.
Competing interestsThere are no competing interests among all authors.
Author details1Department of Medicine, Michigan State University, 909 Wilson Rd, 120West Fee Hall, East Lansing, MI 48824, USA. 2Office of Medical EducationResearch and Development (OMERAD), Michigan State University, EastLansing, MI, USA.
Fig. 5 Spaghetti plot of ten NBME test scores grouped by students’ predicted probabilities in the latent states. Notes: 1. Thirty-seven Studentshad predicted probability in the Novice state; 168 had predicted probability in in the Competent state and 153 students had predictedprobabilities in Advanced Beginner I & II state. 2. The blue lines are fitted trend lines by each group using smooth fitting method
Wang et al. BMC Medical Education (2021) 21:200 Page 8 of 9

Received: 15 December 2020 Accepted: 25 March 2021
References1. Dreyfuss SE, Dreyfus HL. A five-stage model of the mental activities involved
in directed skill acquisition. Oper Res Cent. 1980; doi: ADA084551.2. Lefa B. The Piaget theory of cognitive development: an educational
implications. Educ Psychol. 2014;1(9):1–8.3. Kohlberg L. Stages of moral development. Moral Educ. 1971. https://doi.
org/10.3138/9781442656758-004.4. Kaplan D, Walpole S. A stage-sequential model of reading transitions:
evidence from the early childhood longitudinal study. J Educ Psychol. 2005;97(4):551–63. https://doi.org/10.1037/0022-0663.97.4.551.
5. Townsend, J. T., & Ashby, F. G. (1983). Stochastic modeling of elementarypsychological processes. CUP Archive.
6. Johnson TR, Khalil MK, Peppler RD, Davey DD, Kibble JD. Use of the NBMEcomprehensive basic science examination as a progress test in thepreclerkship curriculum of a new medical school. Adv Physiol Educ. 2014;38(4):315–20. https://doi.org/10.1152/advan.00047.2014.
7. Morrison CA, Ross LP, Fogle T, Butler A, Miller J, Dillon GF. Relationshipbetween performance on the NBME comprehensive basic sciences self-assessment and USMLE step 1 for U.S. and Canadian medical schoolstudents. Acad Med. 2010;85(10):S98–S101. https://doi.org/10.1097/ACM.0b013e3181ed3f5c.
8. De Champlain AF, Cuddy MM, Scoles PV, et al. Progress testing in clinicalscience education : results of a pilot project between the National Board ofmedical examiners and a US medical Progress testing in clinical scienceeducation : results of a pilot project between the National Board of medical.Med Teach. 2010;32(6):503–8. https://doi.org/10.3109/01421590903514655.
9. Gagniuc PA. Markov Chains: From Theory to Implementation andExperimentation: John Wiley & Sons; 2017. https://doi.org/10.1002/9781119387596.
10. Serfozo R. Basics of applied stochastic processes. Springer Sci Bus Media.2009. https://doi.org/10.1007/978-3-540-89332-5.
11. Jung T, Wickrama KAS. An introduction to Latent class growth Analysis andgrowth mixture modeling. Soc Personal Psychol Compass. 2008;2(1):302–17.https://doi.org/10.1111/j.1751-9004.2007.00054.x.
12. Bartolucci F, Farcomeni A, Pennoni F. Latent Markov models for longitudinaldata. CRC Press. 2012. https://doi.org/10.1201/b13246.
13. Allison PD. Multiple imputation for missing data: A cautionary tale. SociolMethods Res. 2000;28(3):301–9. https://doi.org/10.1177/0049124100028003003.
14. Basco WT, Way DP, Gilbert GE, Hudson A. (2002). Undergraduateinstitutional MCAT scores as predictors of USMLE step 1 performance. AcadMed. 2002;77(10):S13–6. https://doi.org/10.1097/00001888-200210001-00005.
15. Zhao X, Oppler S, Dunleavy D, Kroopnick M. Validity of four approaches ofusing repeaters’ MCAT scores in medical school admissions to predictUSMLE step 1 total scores. Acad Med. 2010;85(10):S64–7. https://doi.org/10.1097/ACM.0b013e3181ed38fc.
16. Kuha J. AIC and BIC: comparisons of assumptions and performance. SociolMethods Res. 2004;33(2):188–229. https://doi.org/10.1177/0049124103262065.
17. Team RC. R: a language and environment for statistical computing. R FoundStat Comput. 2016.
18. Meredith W, Tisak J. Latent curve analysis. Psychometrika. 1990;55(1):107–22.https://doi.org/10.1007/BF02294746.
19. Muthén B. Latent Variable Analysis. (2004). In: Handbook of QuantitativeMethodology for Social Sciences 345(368), 106–109.
20. Rogosa D, Brandt D, Zimowski M. A growth curve approach to themeasurement of change. Psychol Bull. 1982;92(3):726–48. https://doi.org/10.1037/0033-2909.92.3.726.
21. Singer JD, Willett JB. Applied longitudinal data Analysis: Modeling Changeand Event Occurrence: Oxford university press; 2009. https://doi.org/10.1093/acprof:oso/9780195152968.001.0001.
22. Willett JB, Sayer AG. Using covariance structure analysis to detect correlatesand predictors of individual change over time. Psychol Bull. 1994;116(2):363–81. https://doi.org/10.1037/0033-2909.116.2.363.
23. Tio RA, Schutte B, Meiboom AA, Greidanus J, Dubois EA, Bremers AJ. Theprogress test of medicine: the Dutch experience. Perspect Med Edcu. 2016;5(1):51–5. https://doi.org/10.1007/s40037-015-0237-1.
Publisher’s NoteSpringer Nature remains neutral with regard to jurisdictional claims inpublished maps and institutional affiliations.
Wang et al. BMC Medical Education (2021) 21:200 Page 9 of 9