using mental maps to study neighborhood movement in the inner-city: formal vs. informal definitions...
TRANSCRIPT
Using Mental Maps to study Neighborhood Movement in the Inner-
City: Formal vs. Informal Definitions
Ned EnglishPresented at Association of American Geographers Annual
Meeting

2
Introduction
• Making Connections longitudinal, in-person study Targets ten specific Inner City Neighborhoods Questions concerning neighborhood life
Programs to improve neighborhood life for children Two waves thus far (2002-’04; 2005-’07)
• Found considerable movement between waves ~ 50% households left wave 1 housing unit What are implications for survey, programs?
3
Introduction contd.
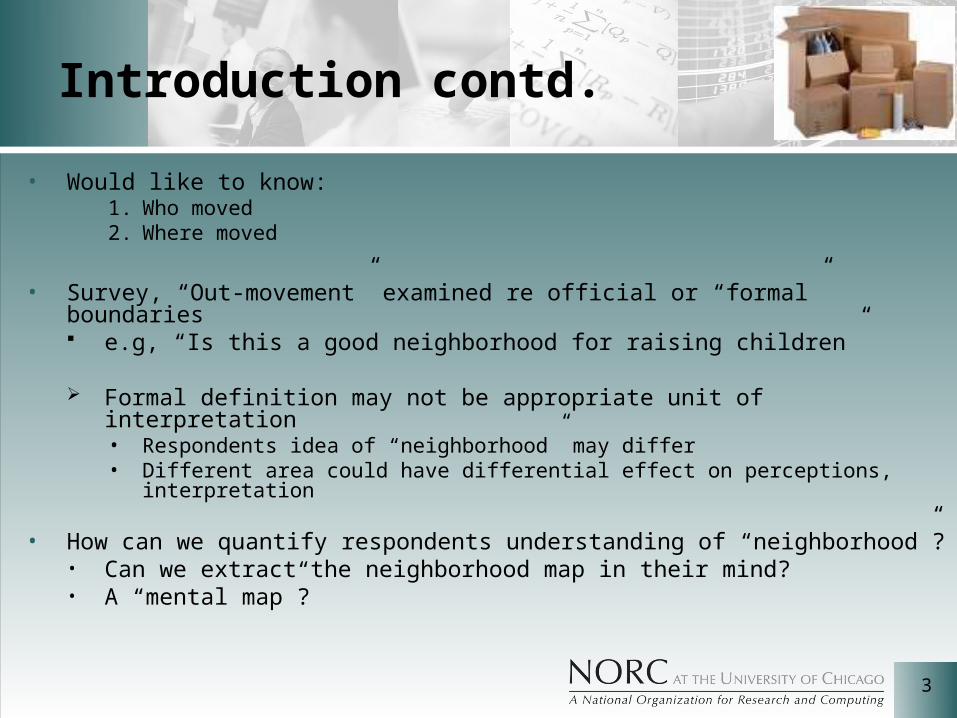
• Would like to know:1. Who moved2. Where moved
• Survey, “Out-movement” examined re official or “formal” boundaries e.g, “Is this a good neighborhood for raising children”
Formal definition may not be appropriate unit of interpretation• Respondents idea of “neighborhood” may differ• Different area could have differential effect on perceptions,
interpretation
• How can we quantify respondents understanding of “neighborhood”? • Can we extract the neighborhood map in their mind? • A “mental map”?

4
Summary
1. What are “mental maps”; how can capture in survey context?
2. How can mental maps inform study of neighborhood movement? How does movement re mental map relate to formal neighborhood? Who moves within mental map? Who leaves? What if interpreted mental map as neighborhood instead of formal
neighborhood?
Argue shouldn’t assume common understanding of “neighborhood” definition in urban survey research Could have unpredictable effects on data interpretation
Integrate survey methods, GIS, urban research

5
Methodology• Making Connections targeted 700 - 800 in-person completed interviews at
wave 1 Wave 1 location recorded and geocoded Respondents given basic paper map template
Asked to sketch “neighborhood” boundary
• Paper maps digitized for all respondents (6226 maps) We define “mental map” as digitized version of sketched neighborhood
• In wave 2, study followed movers with children (approx 25% of wave 1) Wave 2 location recorded and geocoded
• Processed wave 2 location re: Wave 1 location Formal neighborhood boundaries Mental map e.g., “informal” neighborhood boundaries

6
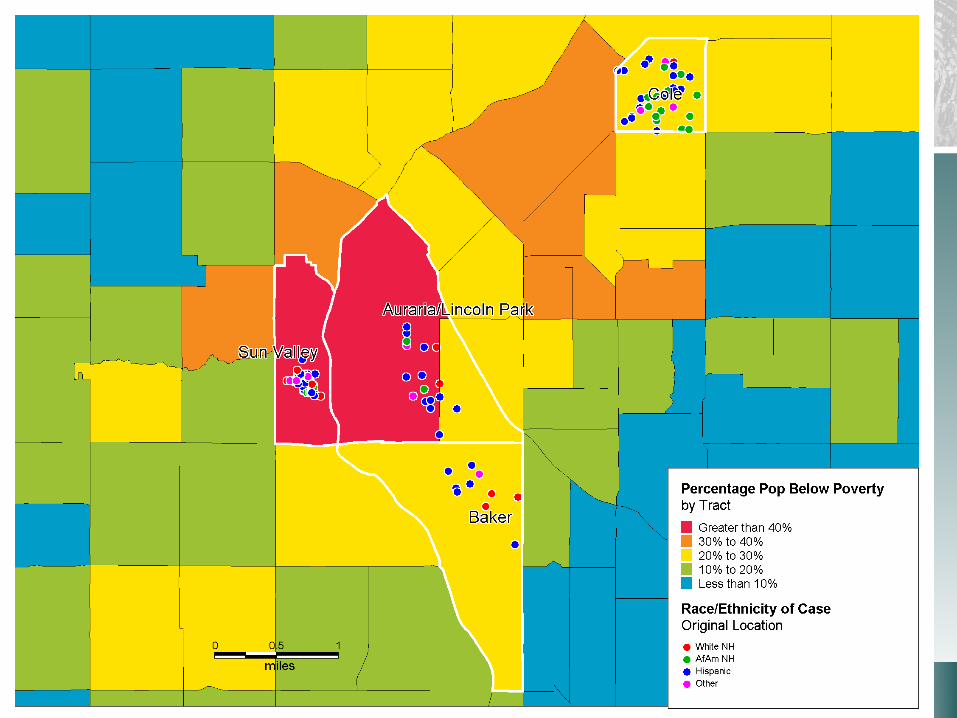
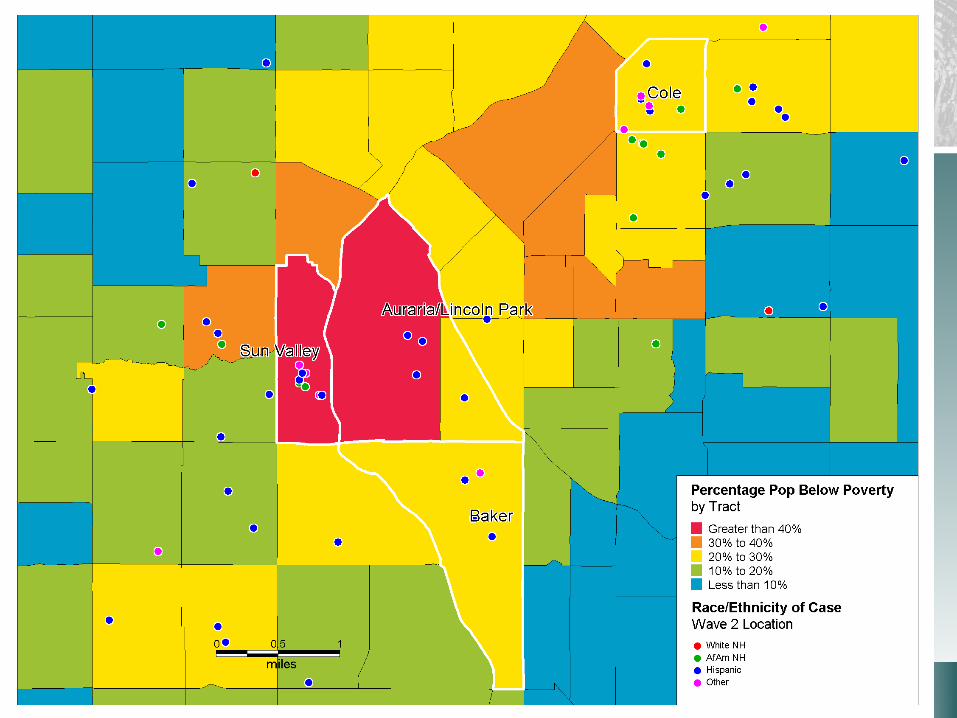
Denver, CO example

7
Example Mental Maps

8
Example Mental Maps contd.

9
Exceptions

10
Coincident Mental Maps

11
Example of Mental Map Integration
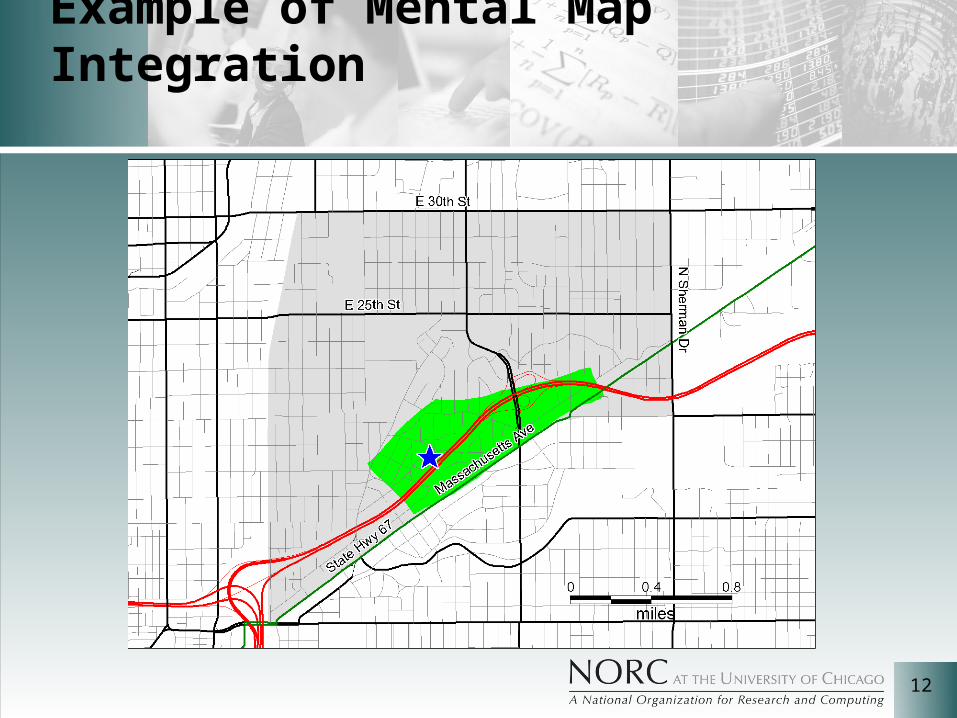
12
Example of Mental Map Integration

13
Example of Mental Map Integration

14
Background: Destinations
Site % Neigh % City % County
% Beyond
Denver 18% 42% na 40%
Indianapolis 25% 58% 4% 14%
Des Moines 30% 47% 6% 18%
San Antonio
48% 37% 4 % 12%
30% 46% 3% 21%
15
16

17
Neighborhood Movement: Formal vs. Informal
Category Formal Neighborhood
Informal “Mental Map”
Movers 517 424
Wave 1 in Neighborhood
100% (517) 78% (338)
Wave 2 in Neighborhood
30% (156) 13% (56) •Potential discrepancy between respondent’s understanding of leaving and researcher

18
Neighborhood Definition and Movement Agreement
“Neighborhood” Left Share Potential Issue
Mental Map and Formal Neighborhood
67% (286)
None
Formal Neighborhood only
.5% (2) “Extra” Movers
Mental Map only 19% (82) “Undetected” Movers
Neither 13% (54) None
424Total Left Formal 68% (288)
Total Left Mental Map 87% (368)

19
“Undetected” Movers vs. Agreed Neighborhood Stayers
Measure Undetected Movers n =
82
Agreed Stayersn = 54
% White non-Hispanic 22% 11%
% Low Income 34% 36%
% Single Parent Wave 1
33% 37%
% Less High School 43% 43%•Difference could influence survey data, interpretation

20
Movers Never in Mental Map …
Measure Never in Mental Map n
= 86
All Others n = 338
% White non-Hispanic 22 % 23%
% Site Indianapolis 34% 21%
% Low Income 37% 31%
% Less High School 44% 34%
% College Diploma 1% 8%

21
Discussion
• Mental maps permit nuanced approach to analysis of urban movers Can quantify respondent’s perception of leaving,
staying Thus not dependent solely on formal boundaries as unit “Finer grained” method of comparison
• Potentially problematic to group all movers who remained in formal neighborhood Those who left “mental map” but not formal
neighborhood differ from others “Undetected movers”
• Discrepancies will influence data collected describing “neighborhood”
“How long have you lived in the neighborhood” Neighborhood services Neighborhood improvement, decline

22
Discussion contd.
• Map understanding non-trivial issue Questionable group who were not in mental map at
wave 1 Hypothesis One: “Churners” who move annually Hypothesis Two: Did not understand map
• Low educational attainment could describe both
• Limited by cell sizes thus far: Left formal neighborhood but not mental map (2) Moved “into” mental map from outside (5)

23
Conclusions
• Demonstrated issues with assuming common understanding of “neighborhood” definition Possible to collect mental maps instead Explicitly define “custom” areas of concern for
survey questions
• Moving forward to wave 3, intend to focus on: Specific training to improve item response Consistent map design Experiment on effect of composition, scale
