using nasa using remote sensing in public health … using nasa using remote sensing in public...
TRANSCRIPT

1
Using NASA Using Remote Sensing in Public Health Applications
Sue M. Estes,Deputy Program Manager, Public Health
Applied Sciences ProgramEarth Science Division
Science Mission Directorate NASA
Huntsville, AL
https://ntrs.nasa.gov/search.jsp?R=20120016675 2018-06-27T03:26:50+00:00Z

NASA Applied Sciences Program Mission Statement
Advance the realization of societal and economic benefits from NASA Earth science by identifying societal needs, conducting applied research and development, and collaborating with application developers and users.

Focus Areas of Public Health
The Public Health application area focuses on Earth science applications to public health and safety, particularly regarding infectious disease, emergency preparedness and response, and environmental health issues. The application explores issues of toxic and pathogenic exposure, as well as natural and man-made hazards and their effects, for risk characterization/mitigation and improvements to health and safety.

4
Collaboration with the CDC and EPA to Enhance the Environmental Public Health Tracking
Network
Data from scattered EPA monitoring sites were used to make daily surfaces of particulate matter (PM) concentrations. High concentrations of PM are associated with adverse health reactions, eg. respiratory and cardiovascular problems.
NASA and the CDC are partners in linking environmental and health observations to enhance public health surveillance through the Environmental Public Health Tracking Network (EPHTN).
The integration of NASA earth science satellite observations, model predictive capabilities, and technology enhances the value of public health decision support.
NASA and CDC verified and validated that augmenting the EPA Air Quality System (AQS) observations with NASA MODIS-derived PM 2.5 observations increases the temporal and spatial resolutions of fine particulate estimates and increases the accuracy in estimating concentrations of PM 2.5. These results are being built upon in a new project.
Technical Contacts: Yang Liu ([email protected])
Dale Quattrochi ([email protected])
High : 50 g/m3
Low : 0 g/m3
EPA sites

Daily 48-hour dust forecasts now available on a website (http://nmtracking.unm.edu) linked with the NM DoH EPHT web portal. Data are then available to the national EPHTN. Experimental dust advisories are now being issued at the request of the Albuquerque Public Schools and the NM DoH.
ENPHASYS Daily Average Dust Forecast >35µg/m3, April 2009
Dust Surveillance in the Southwest USA

6
NASA MODIS data identifies the pollen producing periods of Juniper spp. through out the US southwest, Texas and Oklahoma. The Pollen transport is modeled using a REgional Atmospheric Model (PREAM). The results become a component of the New Mexico Environmental Public Health Tracking System (EPHTS) to provide early warning to pollen events which may trigger allergic and asthma respiratory events.
Integration of Airborne Dust Prediction Systems and Vegetation Phenology to Track Pollen for Asthma Alerts in Public Health Decision Support Systems
Investigators: J.Luvall, NASA
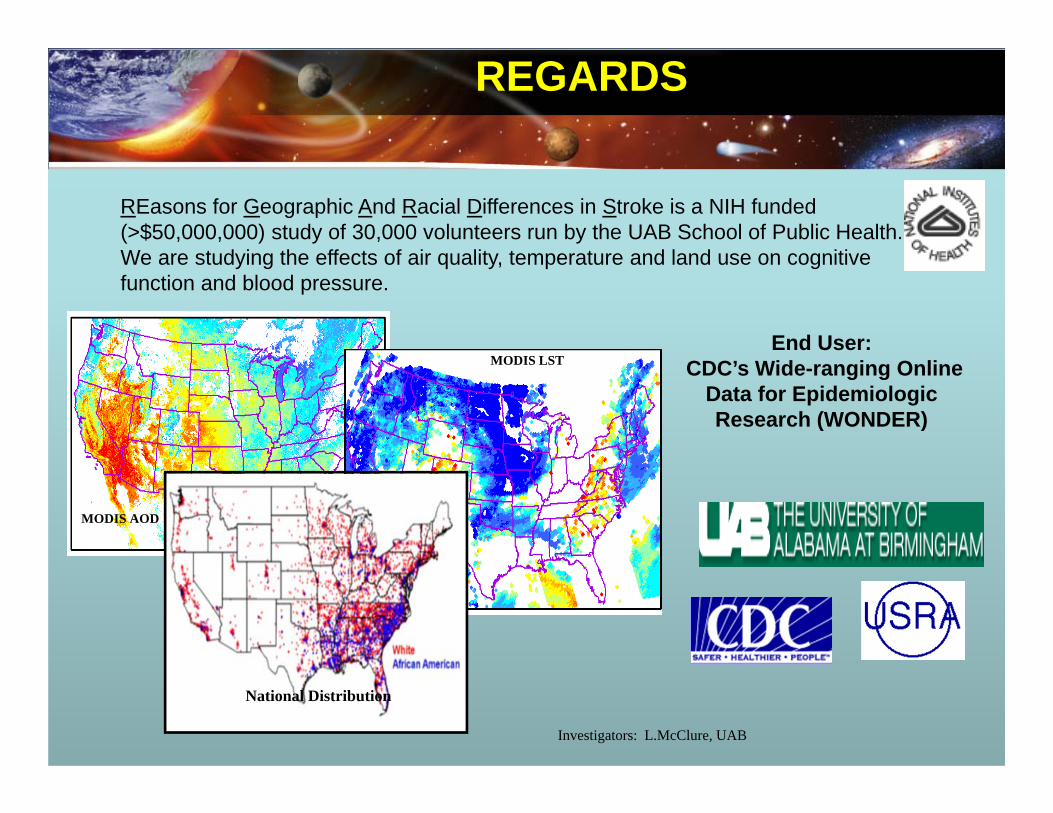
REGARDS
7
End User:CDC’s Wide-ranging Online
Data for Epidemiologic Research (WONDER)
REasons for Geographic And Racial Differences in Stroke is a NIH funded(>$50,000,000) study of 30,000 volunteers run by the UAB School of Public Health. We are studying the effects of air quality, temperature and land use on cognitive function and blood pressure.
MODIS AOD
MODIS LST
National Distribution
Investigators: L.McClure, UAB

8
Heat Vulnerability & Climate Change
We will augment the current Heat Watch/Warning System (HWWS) with NASA instruments and models in conjunction with socioeconomic and heat-related mortality data. This activity will enable the production of a more spatially specific warning for areas of risk within the cities.
End Users:Cities of Dayton, Phoenix &
Philadelphia
PI: Dan Johnson, Indiana University in Indianapolis
9
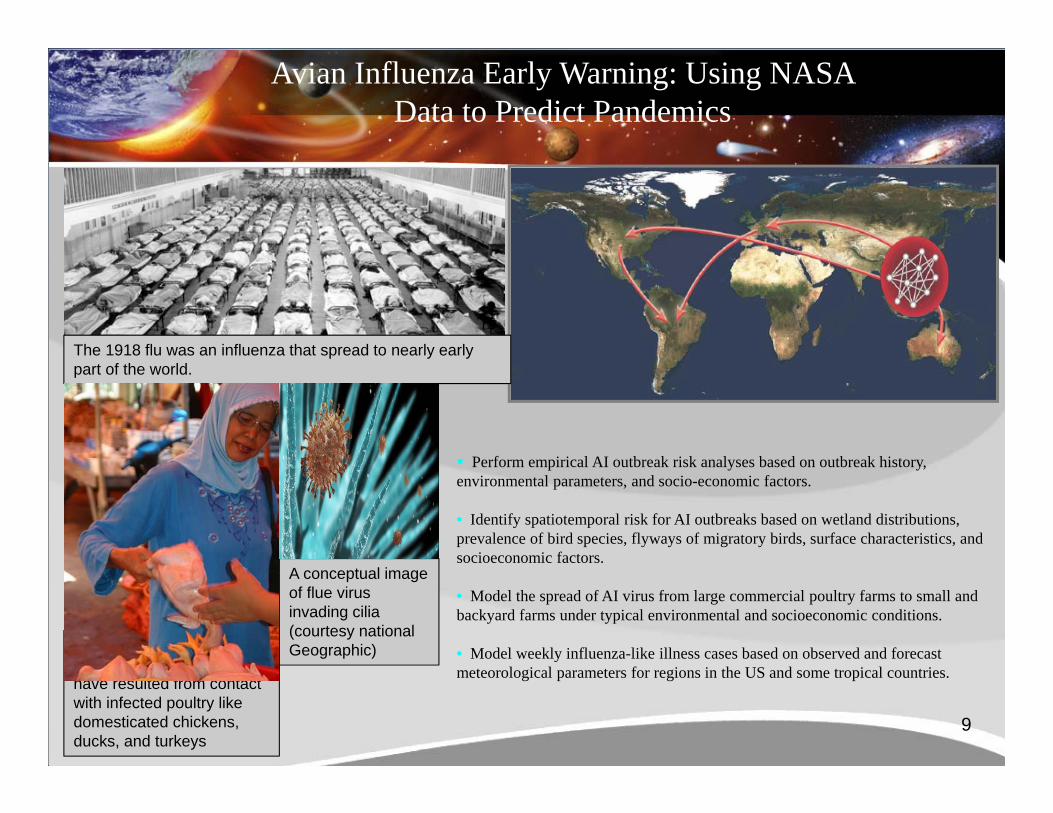
Avian Influenza Early Warning: Using NASA Data to Predict Pandemics
Perform empirical AI outbreak risk analyses based on outbreak history, environmental parameters, and socio-economic factors.
• Identify spatiotemporal risk for AI outbreaks based on wetland distributions, prevalence of bird species, flyways of migratory birds, surface characteristics, and socioeconomic factors.
• Model the spread of AI virus from large commercial poultry farms to small and backyard farms under typical environmental and socioeconomic conditions.
• Model weekly influenza-like illness cases based on observed and forecast meteorological parameters for regions in the US and some tropical countries.
The 1918 flu was an influenza that spread to nearly early part of the world.
Most cases of avian influenza infection is human have resulted from contact with infected poultry like domesticated chickens, ducks, and turkeys
A conceptual image of flue virus invading cilia(courtesy national Geographic)

Collaboration with DOD, USGS, USAID, andColumbia U. on Malaria
Problem: Malaria kills up to 3 million people yearly worldwide, many of whom are children. In addition, malaria costs African nations approximately $12 billion in economic productivity. The health and economic consequences of malaria make it a destabilizing phenomenon. Accurate characterization of malaria risk is important because of its impact on US military and humanitarian personnel and operations. Global climate change may expand malaria risk areas to new locales, particularly higher altitudes.
Solution: NASA and DOD (through GSAT) and USGS, USAID, and Columbia U. (through MEWS) are partners in utilizing environmental parameters such as precipitation, temperature, and vegetative cover to better characterize malaria transmission risks.
NASA Research Results: Model predictive capabilities and observations from NASA Earth-observing satellites such as Terra, Aqua, and TRMM.
Status: Current and future malaria risks have been forecast in a quantitative, dynamic, and accurate manner in Thailand, Afghanistan, and Indonesia. Rolling 10-day rainfall anomaly products and 8-day Vectorial Capacity products are produced for Africa and these data are disseminated on the web as both graphic and GIS products (available at the ADDS website: http://earlywarning.usgs.gov/fews/africa/index.php).
Precipitation is one of the main environmental determinants that promotes malaria transmission. The precipitation distribution in provincial resolution, based on NASA TRMM observations, is shown for the four Thailand season from 2000 to 2001.
This image shows vegetation density (NDVI) over Africa in May 2008. By closely monitoring vegetation in regions affected by increased rainfall, scientists can identify areas at increased risk for outbreaks of malaria. Investigators: R. Kiang, M. Brown, NASA Goddard

Left: NDVI anomalies for January 2010 are above normal in southern Africa. During December-February rainfall and NDVI were above normal indicating elevated risk of RVF activity for January and February.
Right: Enhanced RVF risk map incorporating livestock, human population data, SRTM digital data, and NDVI resulting in a two-level risk category at regional scale. Confirmed February 2010 RVF outbreaks in South Africa are identified by circles. The advanced awareness on the developing RVF threat gave partners such as WHO and FAO the opportunity to plan and execute disease outbreak prevention, preparedness, and “control-and-response” actions, including advising farmers to vaccinate livestock. Monthly risk maps available at: http://www.geis.fhp.osd.mil
Investigator: J. Pinzon ,SSAI
Collaboration with DOD on Rift Valley Fever inAfrica

Collaboration with DOD on Ebola and Rift Valley Fever in Africa
This endemic Ebola risk map uses information of vegetation dynamics as provided by NDVI data from MODIS and AVHRR (1981-2004). It uses a dynamic threshold that characterizes tropical moist forest from gallery tropical forest. The colored areas indicate regions at low risk (blue) and high risk (red) to Ebola activity. The high risk areas are noted to be in close proximity to bat caves, a recently identified vector of Ebola. This map is used as a baseline to derive monthly risk predictions.
This project aims to provide monthly environmental and on-demand risk maps to the DOD Global Emerging Infections Surveillance and Response System (GEIS) by integrating information from NOAA AVHRR, MODIS, AMSR-E, and TRMM, as well as simulated products from upcoming missions such as NPP and GPM. By enhancing DoD-GEIS with NASA-derived environmental risk maps, the project supports: 1) GEIS efforts toward improving surveillance systems that are crucial to preventing, detecting and containing these diseases, 2) GEIS overseas laboratories with their service to host country counterparts and the UN, to improve local epidemiological capabilities.
Investigator: J. Pinzon SSAI
http://www.geis.fhp.osd.mil

Collaboration with Columbia U. on Meningitis in the African Sahel
The project is exploring environmental and demographic risk factors as predictors for meningitis outbreaks in the African Sahel, particularly in Niger.
The approach will take advantage of different sources of environmental information: in-situ data, model outputs and satellite observations (including those from the Multi-angle Imaging Spectroradiometer and TRMM). The latter are an important contribution in areas of sparse data coverage, poor real-time reporting, and limited access to reliable environmental information – such as the Sahel.
A large plume of African dust blows out over the Atlantic Ocean. This true color image of the dust event was acquired on February 11, 2002, by MODIS. Particles contained in dust clouds are suspected to be responsible for nasal irritations facilitating meningitis transmission in Africa.
Investigator: S. Trzaska, IRI/Columbia U.

Dengue (Break Bone) viruses are carried by mosquitoes in tropical and subtropical areas, There are ~100 million infections annually. Our project will focus on Mexico and will integrate environmental observations, including weather, land use/land change, and mosquito vectors with investigations of the human dynamics of the system via household surveys and participatory epidemiology. The objective is to evaluate potential interventions such as insecticide treated curtains.
Investigators: Bill Crosson, USRA/Mary Hayden, NCAR
Investigating the Potential Range Expansion of the Vector Mosquito Aedes Aegypti in Mexico with NASA Earth Science
Remote Sensing Results

New NASA Public Health Applications Projects Awarded in January 2011
Nine new Public Health Applications projects were awarded by NASA in January 2011 representing an investment of over $1.3M over two years.• “Development of a Detection and Early Warning System for
Malaria Risk in the Amazon”; PI: Benjamin Zatichik of Johns Hopkins University
• “Improving Decision-Making Activities for Malaria and Meningitis Risk Mapping – Integration of NASA Products/Platforms (SERVIR) and UN WHO-Open Health”; PI: Pietro Ceccato of Columbia University
• “Integrating Earth Observations and Satellite Telemetry of Wild Birds for a Decision Support System of Avian Influenza”; PI: Xiangming Xiao of the University of Oklahoma
• “Modeling Global Influenza Risks Using NASA Data”; PI: Richard Kiang of NASA Goddard Space Flight Center
• “Investigating the Potential Range Expansion of the Vector Mosquito Aedes Aegypti in Mexico”; PI: Bill Crosson of USRA

New NASA Public Health Applications Projects Awarded in January 2011 (Con’t)
•“Enhanced Forecasting of Mosquito-Borne Disease Outbreaks Using AMSR-E”; PI: Michael Wimberly/South Dakota State University•“Using NASA Satellite Aerosol Optical Depth Data to Create Representative PM2.5 Fields for Use in Human Health and Epidemiology Studies in Support of State and National Environmental Public Health Tracking Programs”; PI: Amy Huff/Battelle Memorial Institute•“Internet-based Heat Evaluation and Assessment Tool (I-HEAT) Feasibility Study”; PI: Susan Maxwell/BioMedware•“Feasibility Study of Satellite-Assisted Detection and Forecasting of Oyster Norovirus Outbreak”; PI: Zhiqiang Deng/Louisiana State University
Applied Sciences Program
http://appliedsciences.nasa.gov
National Aeronautics andSpace Administration
Earth Science EnterpriseApplications Plan
April 2004

.gov/ph
.gov/rs
.org
.edu
.int
.mil
NASA’s Public Health Partners