using potential master regulator sites and paralogous expansion to
TRANSCRIPT
PROCEEDINGS Open Access
Using potential master regulator sites andparalogous expansion to construct tissue-specifictranscriptional networksMartin Haubrock, Jie Li, Edgar Wingender*
From 23rd International Conference on Genome Informatics (GIW 2012)Tainan, Taiwan. 12-14 December 2012
Abstract
Background: Transcriptional networks of higher eukaryotes are difficult to obtain. Available experimental data fromconventional approaches are sporadic, while those generated with modern high-throughput technologies arebiased. Computational predictions are generally perceived as being flooded with high rates of false positives. Newconcepts about the structure of regulatory regions and the function of master regulator sites may provide a wayout of this dilemma.
Methods: We combined promoter scanning with positional weight matrices with a 4-genome conservativityanalysis to predict high-affinity, highly conserved transcription factor (TF) binding sites and to infer TF-target generelations. They were expanded to paralogous TFs and filtered for tissue-specific expression patterns to obtain areference transcriptional network (RTN) as well as tissue-specific transcriptional networks (TTNs).
Results: When validated with experimental data sets, the predictions done showed the expected trends of truepositive and true negative predictions, resulting in satisfying sensitivity and specificity characteristics. This alsoproved that confining the network reconstruction to the 1% top-ranking TF-target predictions gives rise tonetworks with expected degree distributions. Their expansion to paralogous TFs enriches them by tissue-specificregulators, providing a reasonable basis to reconstruct tissue-specific transcriptional networks.
Conclusions: The concept of master regulator or seed sites provides a reasonable starting point to selectpredicted TF-target relations, which, together with a paralogous expansion, allow for reconstruction of tissue-specific transcriptional networks.
BackgroundRegulation of transcription is mediated through complexarrays of transcription factor binding sites (TFBSs),which constitute promoter and enhancer regions. In spiteof the advent of high-throughput approaches to identifyTFBSs in a given cellular context, the available informa-tion, most comprehensively collected in the TRANS-FAC® database [1], is still fragmented and biased withregard to the systems selected. Consequently, any tran-scriptional network reconstructed from the availableexperimental data is highly incomplete. This situation
deteriorates further when filtering such a transcriptional“reference” network for gene expression data in order togenerate tissue-specific networks. Therefore, constructingcomprehensive gene regulatory networks still depends onreliable algorithms for predicting individual TFBSs as abasis for inferring TF-target gene relations. These predic-tions, however, depend on the availability of informationabout the DNA-binding specificity of ideally all TFsencoded by a genome. Unfortunately, we are far fromthis ideal situation, so that we can do such predictionsonly for a subset of, e.g., human TFs. Although promisingmethods have been reported for inferring DNA-bindingspecificities by homology modeling [2,3], the required 3D* Correspondence: [email protected]
Department of Bioinformatics, University Medical Center Göttingen,Goldschmidtstrasse 1, D-37077 Göttingen, Germany
Haubrock et al. BMC Systems Biology 2012, 6(Suppl 2):S15http://www.biomedcentral.com/1752-0509/6/S2/S15
© 2012 Haubrock et al.; licensee BioMed Central Ltd. This is an open access article distributed under the terms of the CreativeCommons Attribution License (http://creativecommons.org/licenses/by/2.0), which permits unrestricted use, distribution, andreproduction in any medium, provided the original work is properly cited.

structures of TF-DNA complexes are known for only aminority of factors.Recent studies have applied high-throughput approaches
to map active promoters and enhancers in a particular cel-lular context by capturing epigenetic characteristics suchas specific histone methylation patterns [4]. However, itstill has to be revealed what the exact regulation of a givengene is, i.e. which functional TFBSs are there in its regula-tory regions, and which is the original signal that flags apromoter region as such. Conceivably, the recently pub-lished concepts about master transcription factors [5] orpioneer transcription factors [6] may provide a clue to thisproblem.In this study, we started from the following related
working model as hypothesis: In the genome of a givenhigher eukaryotic cell, promoter sequences have to be“flagged” in order to be recognizable by the transcrip-tion machinery. Each of these flags is realized by a high-affinity TFBS, which, due to its functional importance, isgenerally conserved among genomes that are phylogen-etically not too distant. These high-affinity and con-served sites serve as nucleation centers, or “seeds”, togovern the proper assembly of TFs at one promoter,which also involves a set of additional transcription fac-tors with binding sites of decreasing affinity and actingin a concomitantly optional manner.
MethodsTFBS predictionWe started from 35,750 RefSeq-annotated human promo-ter regions (UCSC track refGene, Apr. 14, 2010, hg19)which are linked to 21,532 unique genes. We selected the1-kb upstream regions based on the RefSeq annotation tocover the corresponding human promoter regions. Weretrieved ortholog promoter regions from mouse, dog, andcow genomes from the 46_WAY_MULTIZ_hg19 wholegenome alignments provided by UCSC for 46 vertebratesusing UCSC/Galaxy [7]. The corresponding sequencebuilds are hg19, mm9, canFan2, and bosTau4. Gaps result-ing from the multiple genome alignment were removedfrom the promoter sequences. Potential transcription fac-tor binding sites (TFBS) were then identified using allavailable vertebrate matrices (854 PWM) of the TRANS-FAC matrix library (release 2009.4) and the programMatch™ [8]. We applied all vertebrate matrices usingdefault minFN ("minimize false negatives”) thresholds inorder to retrieve almost all potential transcription factorbinding sites that have at least the quality of the usedTFBS which are given in the corresponding matrix [8].The predictions were then mapped back to the whole gen-ome alignments. We next filtered for conserved TFBSpredictions: a conserved TFBS has to start or end at anon-gap symbol in the corresponding promoter alignment.Finally we ranked all conserved TFBSs according to their
Match score and selected the top-ranking 1%, 2%, 3%, 5%,etc for evaluations. The 100% profile comprises all con-served TFBSs that were identified with minFN thresholds.For further analyses of the network characteristics, thetop-ranking 1% predicted binding sites for each matrixwere used.
From predictions to gene regulatory networkUsing the TRANSFAC library we ended up with a list ofpredicted transcription factor binding sites related to theTRANSFAC matrix identifiers. To build gene regulatorynetworks we translated these matrix identifiers, whichare linked to lists of related species-specific proteins, toofficial human gene symbols.For “paralogous expansion”, we used our new Human
Transcription Factor Classification to construct gene regu-latory networks (http://www.bioinf.med.uni-goettingen.de/projects/tfclassification/). This collection classifies humantranscription factors into families and subfamilies mainlybased on the sequence similarities of their DNA-bindingdomains (DBDs). Since at the lowest classification level,the DBDs are usually extremely similar, the DNA-bindingspecificities can be assumed to be nearly identical as well.We therefore expanded all TF-target links to all membersof the corresponding TF (sub-)family, for which no matrixis as yet available.
Evaluation of conserved binding site predictionThe verification of the predicted binding sites was doneusing experimentally identified regulatory regions fromthe Encode project [9]. ENCODE provides a regulatorysuper-track as a downloadable file. This archive is sum-marizing all transcription factor ChIPseq experimentswhich have been done within the ENCODE project basedon the human genome build 37 (hg19). Altogether wholegenome binding sites and their genomic coordinates areavailable for more than 140 different human transcriptionfactors. They were used to evaluate our TFBS and theinferred TF-target predictions by computing the TruePositive (TP), False Positive (FP), False Negative (FN), andTrue Negative (TN) rates for some human transcriptionfactors. If a predicted TFBS is found in a ChIP-seq regionas well, we count it as a TP. If a TFBS prediction is notdetected by a ChIPseq experiment this is an FP result. AnFN result is obtained when a ChIPseq region is overlap-ping with a potential promoter region (including the frag-ment of overlapping the promoter regions at least with500 nucleotides), but we don’t predict a TFBS for thissituation. A TN result is related to a situation, where weneither predicted a TFBS nor a ChIPseq region was found.Using these statistical measurements we determine thePositive Predictive Value (or precision; PPV = TP/(TP+FP)), Specificity (Spec = TN/(TN+FP)), and the True-
Haubrock et al. BMC Systems Biology 2012, 6(Suppl 2):S15http://www.biomedcentral.com/1752-0509/6/S2/S15
Page 2 of 10

Positive-Rate (TPR = TP/(TP+FN); also: sensitivity orrecall) to detect the accuracy of a ChIP-seq evaluation.
Tissue-specificity of transcription factorsBased on UniGene [10] we have downloaded the geneexpression profiles for 8 different tissues: brain, heart,kidney, liver, ovary, prostate, spleen, testis.
ResultsReconstruction of the transcriptional network throughpredicted TFBSsPrevious studies have shown that sequence conservationcan improve transcription factor binding site predictions[11,12]. Therefore, we combined standard PWM scanningwith a four species conservation filtering to identify poten-tial TFBSs and, on this basis, to infer TF-target gene rela-tions for a comprehensive reference transcriptionalnetwork (RTN). With this strategy (see Methods fordetails), we predicted 4,3*10e7 TFBS which are conservedamong these four species (hg19, mm9, canFam2, bosTau4).These predictions are linked to 16,900 unique human genesymbols. 47.3% of all human promoters (35,750 RefSeq-annotated human promoter regions) share at least oneconserved predicted binding site with the mouse, dog, andcow species. When selecting only the best 1% predictionsof each TRANSFAC matrix we found that 15,619 genes(43.7%) share a conserved, high-scoring binding site. Alto-gether, we ended up with 490,277 TFBS predictions.
Paralogous expansion of the transcription networkWe used a fundamentally revised version of an earliertranscription factor classification, based on their DNA-binding domains [13], to identify groups of TFs thatshare DNA-binding specificity to the largest extent possi-ble. They may be regarded as paralogs, resulting fromearly gene duplication events (Wingender, manuscript inpreparation). This classification scheme comprises fourabstraction levels: superclass, class, family, and (option-ally) subfamily. Whenever one member of a bottommostclade (family or subfamily) has a TRANSFAC matrixassociated, all potential binding sites and, thus, targetgenes predicted for this TF were copied to all other clademembers. This expansion of the transcriptional referencenetwork led to an increase of the TF genes from 442 to742 (by 67.9%), and increased the number of directededges in the network from 277,661 to 728,667 (by162.4%) (Additional file 1, first line of the table). Theexpansion approach was also cross-validated for thosecases where distinct (sub)family members had differentTRANSFAC matrices associated (data not shown).
Validation of the reconstructed networkFor 22 different transcription factors we investigated theperformance of our predictions for 20 different quality
levels by gradually increasing the percentile of highestscoring potential TFBSs accepted, ranking from the 1%best sites down to 100%, which are all conserved sitesthat could be predicted with the minFN threshold. For anumber of TFs, for which experimental ChIPseq datawere available at ENCODE, we determined the PositivePredicted Value (PPV), the True Positive Rate (TPR) andthe Specificity for the whole range of quality levels (fromthe 1% best predictions to 100% of all conserved TFBSs;see Methods section for details). Figure 1 is demonstrat-ing these three values for transcription factor NF-�B(NFKB; see Additional File 2 for all plots). For all 22 TFsstudied so far, we observed a very high specificity for the1% selection. For E2F1, E2F4, and E2F6, the specificitywas about 80%, whereas it was clearly above 90% for allother 19 TFs (BRCA1, CTCF, ELF1, ETS1, FOXA1,GATA1, GATA2, GATA3, HEY1, IRF1, IRF3, NANOG,NFKB, PAX5, POU5F1, RXRA, SP1, TFAP2A, YY1). Forless stringent predictions, i.e. when proceeding towardsthe 100% level, the specificity decreases continuously. Incontrast, the TPR (sensitivity) is increasing from 1% to100% selection. We observed heterogeneous profiles forthe PPV, with usually the highest value for the 1% profile(up to ~82% in the case of CTCF or ~65% for YY1). Insome cases, reducing the stringency of filtering led to adisproportionate increase of the TP and, thus, to anincrease of the PPV. This indicates that a very high num-ber of “real” sites are “suboptimal”, i.e. match with thematrix/matrices used only at relatively low scores. In therespective contexts, these sites may have evolved to exhi-bit only moderate affinity instead of strongest conceivablebinding. Some TFBS predictions show relatively lowPPVs, which may be regarded as high numbers of falsepositives. However, this perception will be challenged byfurther investigations (see next paragraph).Altogether, we decided to work furtheron with the 1%
profiles and the resulting networks.
Revisiting false positivesThe PPVs obtained (see above and Additional File 2)seem to indicate that there is still a considerable numberof FP even under the most stringent conditions (1% high-est scoring conserved TFBSs). To explore this a bitfurther, we determined again the TP, FP, TN and FNrates of our 1% top-ranked predictions for five TFs(GATA3, MYC, JUN, MAX, FOS), but using now twoindependent ENCODE ChIPseq data sets for each ofthese TFs. These ChIPseq data indicate for each of thesefactors the binding sites that are used in different celllines, representing different tissues in all these cases.Figure 2 shows for GATA-3 (see Additional file 3 for theremaining TFs), that two independent ChIP data setsyield quite different TP and FP numbers, with relativelylittle overlap: they have only 176 targets in common and
Haubrock et al. BMC Systems Biology 2012, 6(Suppl 2):S15http://www.biomedcentral.com/1752-0509/6/S2/S15
Page 3 of 10

predicted by our approach, and even the overlap betweenthe two experimental data sets comprises only a minorityof the proven sites. We obtained the same picture forfour further TFs for which we could retrieve new, inde-pendent data sets. Altogether, these results clearly showthat whatever experimental data set is used for validatingthe predictions, a considerable number of alleged “falsepositive” predictions turns into TPs when the experimental
basis broadens. In other words, determining the FP ratewith only a limited set of experimental data highly over-rates this error type.In the Venn diagram of Figure 2, the overlap between
the predictions and any experimental data set may never-theless appear small when compared with the overlapbetween the two ChIPseq data sets. It should be noticed,however, that we explicitly accepted a high number of
Figure 1 Validation of NF-�B sites. Validation of predicted NF-�B sites with ChIPseq data sets from ENCODE. Given are the positive predictivevalue (PPV = TP/(TP+FP)), the true positive rate (TPR = TP/(TP+FN)), and the specificity (SPC = TN/(TN+FP)) for all profiles ranging from the 1%top-ranking down to 100% of the predictions made (see Methods for details).
Figure 2 Different ChIPseq data sets show little overlap. Predicted high-affinity (1% top-ranking), highly conserved binding sites for GATA-3(purple circle, bottom), and GATA-3 ChIPseq fragments from SH-SY5Y cells (blue circle, top-left) or from MCF7 cells (brown circle, top-right),overlapping with 1kb upstream sequences, were checked for the respective intersections.
Haubrock et al. BMC Systems Biology 2012, 6(Suppl 2):S15http://www.biomedcentral.com/1752-0509/6/S2/S15
Page 4 of 10
False Negatives, as an unavoidable trade-off of theapproach chosen here aiming at high-affinity and highlyconserved sites only, regarded as potential master regula-tor or seed sites.
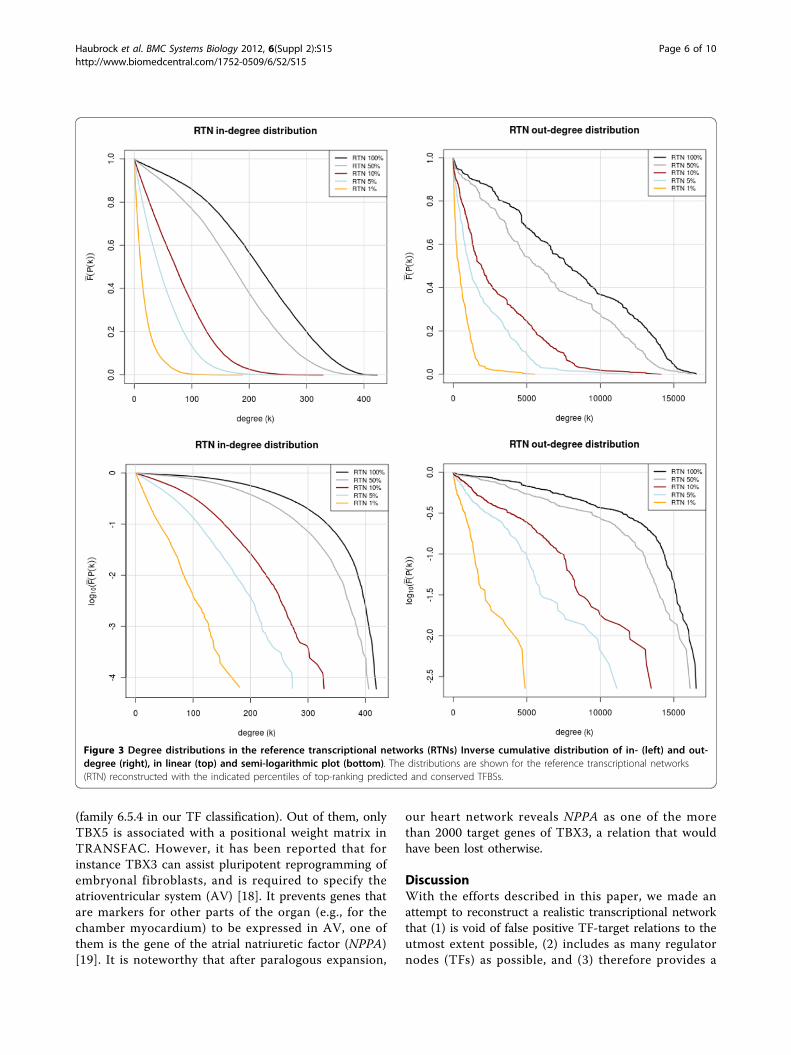
Architecture of the reconstructed networkFor an initial analysis of the reference transcriptional net-work (RTN) obtained by predicting high-affinity, highlyconserved sites and subsequent paralogous expansion, weinvestigated the distribution of in- and out-degrees. Sinceespecially the out-degrees can adopt very large values,but each degree class is extremely sparsely populated, wecomputed the inverse cumulative distribution functionfor the degree frequencies [14]. It was observed that boththe RTN as well as the eRTN (expanded reference tran-scriptional network), when confining to the 1% highestscoring TFBS, show a clear exponential degree distribu-tion. This is particularly obvious from the correspondingsemi-logarithmic plots (Figure 3), where the correlationcoefficients for a linear fitting of 1% profiles are -0.9985and -0.9982 for the in-degrees and -0.9803 and -0.9846for the out-degrees (RTN and eRTN, resp.).Relaxing the prediction constraints, i.e. proceeding from
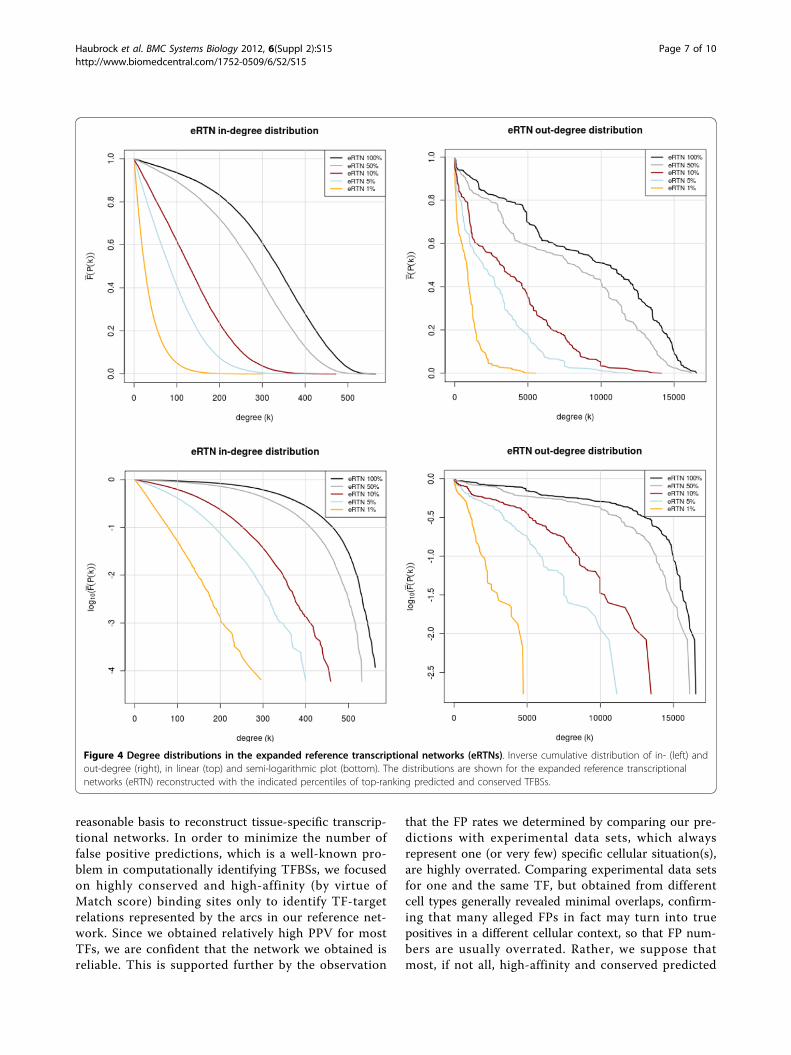
the 1% to the 100% profile, reveals the emergence of ashoulder around a degree of 100-200, possible indicating asuperposition with a peaked distribution (in-degree) orvery heterogeneous distribution until nearly the theoreticalmaximum (out-degree). This becomes even more visiblewhen relaxing the constraint of conservativity (notshown). More important is that the expanded network(eRTN) in principle shows the same degree distributions,i. e. an exponential degree distribution in the 1% network(Figure 4). In the out-degree distribution, however, a num-ber of peaks seem to be emerging in the less stringentnetworks.
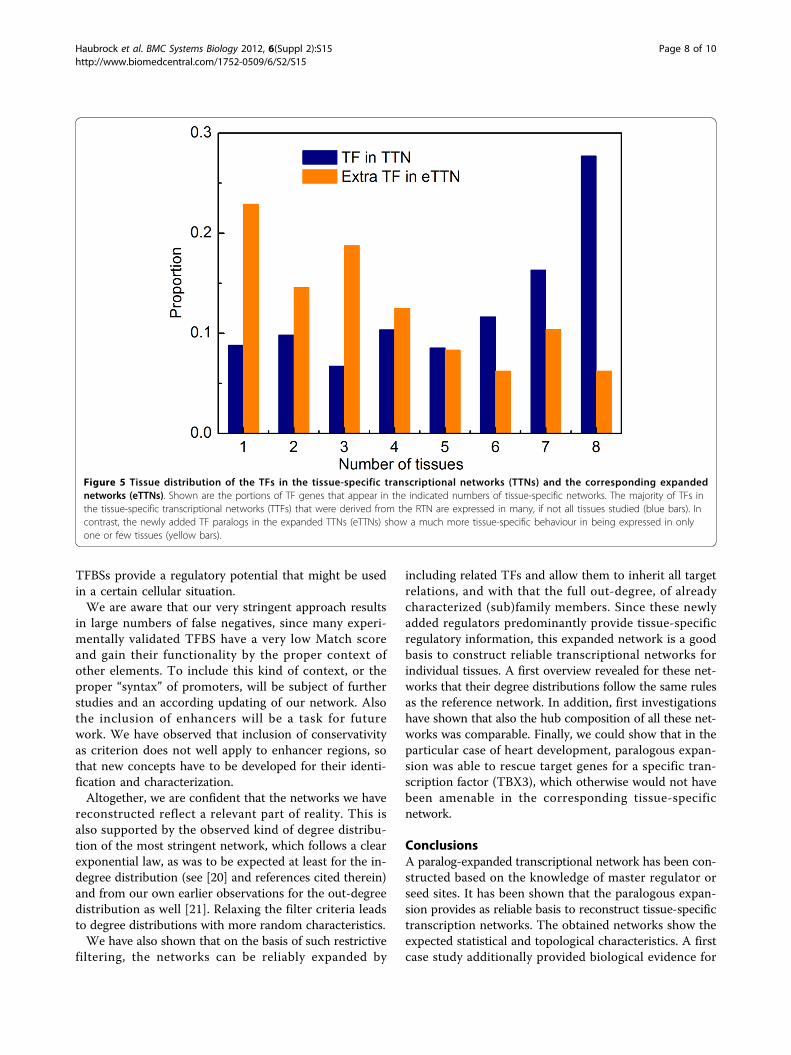
Reconstruction of tissue-specific transcription networksPreviously, we constructed eight tissue-specific transcrip-tion networks (TTNs for brain, heart, kidney, liver, ovary,prostate, spleen and testis) by reducing the RTN to thosegenes that are known to be expressed in the respectivetissue [15]. Thus, regulatory edges survive this filteringonly if both the regulator and the target gene are foundto be expressed in the respective tissue. Here, we recon-structed the transcription networks for the eight tissuesbased on eRTN where the number of “active” TFs (i.e.those which have an out-degree >0) has nearly doubled(1.7-fold), and the number of directed edges has nearlytripled (2.6-fold; see above). Compared to the TFs inRTN, which are generally of low tissue-specificity (seeMethods), the extra TFs in eRTN are mostly of high tis-sue-specificity (Figure 5). This indicates that the tissuenetworks extracted from eRTN are more comprehensive.
Analysis of tissue-specific transcription networksIn general, the number of TFs in the expanded tissue tran-scription networks (eTTN) increased on average 1.5 timescompared to those in the TTNs, whereas the number ofnonTFs is almost constant (Additional file 1). Thisincrease of TF numbers results in an even larger increasein the number of regulations (directed edges), which is onaverage 2.5 times higher than before the expansion, sug-gesting that the eTTNs are much more densely connectedthan the TTNs. It is noted that the increasing ratios ofgenes and regulations are generally consistent with thereference network and across the different tissues (Addi-tional file 1). This indicates that the extra TFs in theeRTN, which are highly tissue specific (Figure 5), are acharacteristic of all tissues studied so far.The individual eTTN differ considerably in their sizes.
By far the largest is the brain network, comprising 75% ofthe TF genes, 78% of the nonTF genes and 61% of theedges of the eRTN. At the other end of the scale, thespleen network shares with the eRTN only 31% of the TFgenes, 38% of the nonTF genes, and 11% of the edges.On average, 41% of the regulations represented in theeRTN survive the tissue-specific filtering.As to be expected, the average in-degrees of TFs and
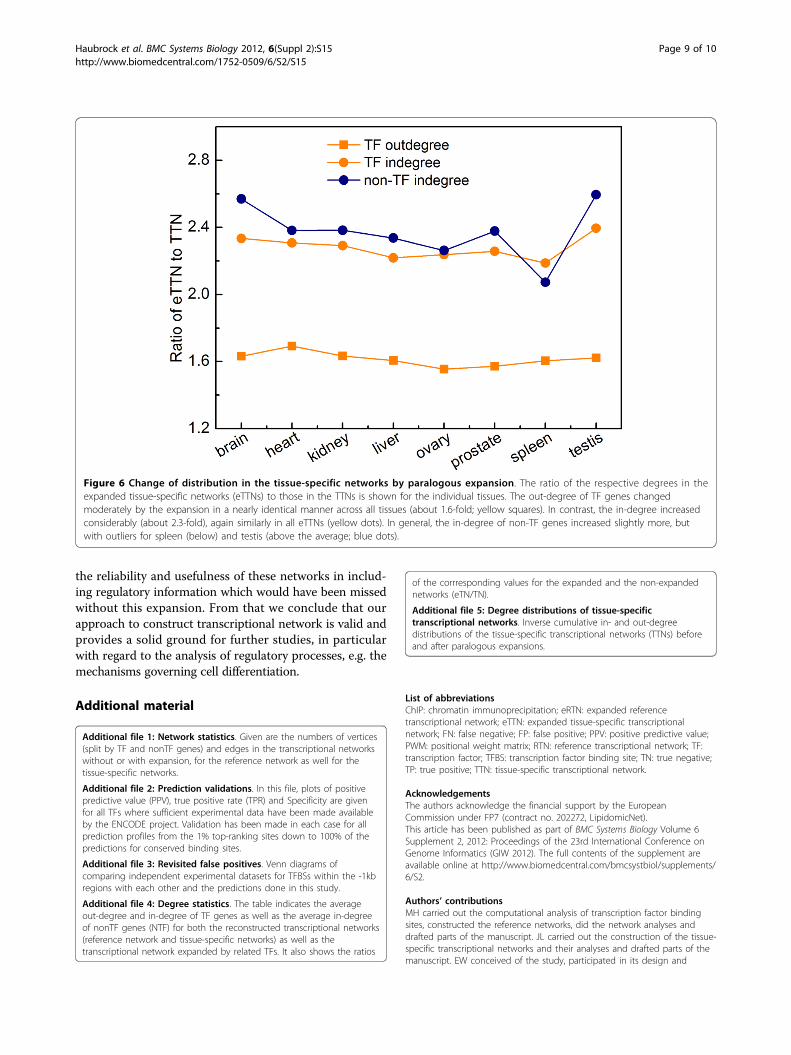
nonTFs increase much more than the average out-degreesof TFs in the eTTNs compared with the TTNs. On aver-age, the in-degree rises around 2.3 times, but the out-degree increases only about 1.6 times (Figure 6; see alsoAdditional file 4 for detailed numbers). This is under-standable since many TFs are added in the eTTNs, whichconsequently results in a larger number of regulations thateach target gene receives. The moderate increase of theout-degree is due to the fact that most of the newly addedTFs had an out-degree well above the average.Interestingly, the in-degree of TF genes is consistently
about 50% larger than that of nonTF genes. This is truefor the (e)RTN as well as for all (e)TTNs. This differenceis only slightly diminished by the paralogous expansion(see Additional file 4).However, such global increase of in- and out-degrees
does not change the features of degree distributions of theeTTNs, which all show an exponential distribution of bothin- and out-degree (Additional file 5).
Case study on the heart-specific transcription networkIt has been reported that during heart development, T-boxtranscription factors play a particularly important role[16]. Mutations in human TBX genes may result in cardio-vascular malformations. Their gene products, the TBX fac-tors, form a complex spatio-temporal pattern defining theidentity of the different heart structures [17].Human TBX factors are spread over five families, one
of them comprising TBX2, TBX3, TBX4 and TBX5
Haubrock et al. BMC Systems Biology 2012, 6(Suppl 2):S15http://www.biomedcentral.com/1752-0509/6/S2/S15
Page 5 of 10
(family 6.5.4 in our TF classification). Out of them, onlyTBX5 is associated with a positional weight matrix inTRANSFAC. However, it has been reported that forinstance TBX3 can assist pluripotent reprogramming ofembryonal fibroblasts, and is required to specify theatrioventricular system (AV) [18]. It prevents genes thatare markers for other parts of the organ (e.g., for thechamber myocardium) to be expressed in AV, one ofthem is the gene of the atrial natriuretic factor (NPPA)[19]. It is noteworthy that after paralogous expansion,
our heart network reveals NPPA as one of the morethan 2000 target genes of TBX3, a relation that wouldhave been lost otherwise.
DiscussionWith the efforts described in this paper, we made anattempt to reconstruct a realistic transcriptional networkthat (1) is void of false positive TF-target relations to theutmost extent possible, (2) includes as many regulatornodes (TFs) as possible, and (3) therefore provides a
Figure 3 Degree distributions in the reference transcriptional networks (RTNs) Inverse cumulative distribution of in- (left) and out-degree (right), in linear (top) and semi-logarithmic plot (bottom). The distributions are shown for the reference transcriptional networks(RTN) reconstructed with the indicated percentiles of top-ranking predicted and conserved TFBSs.
Haubrock et al. BMC Systems Biology 2012, 6(Suppl 2):S15http://www.biomedcentral.com/1752-0509/6/S2/S15
Page 6 of 10
reasonable basis to reconstruct tissue-specific transcrip-tional networks. In order to minimize the number offalse positive predictions, which is a well-known pro-blem in computationally identifying TFBSs, we focusedon highly conserved and high-affinity (by virtue ofMatch score) binding sites only to identify TF-targetrelations represented by the arcs in our reference net-work. Since we obtained relatively high PPV for mostTFs, we are confident that the network we obtained isreliable. This is supported further by the observation
that the FP rates we determined by comparing our pre-dictions with experimental data sets, which alwaysrepresent one (or very few) specific cellular situation(s),are highly overrated. Comparing experimental data setsfor one and the same TF, but obtained from differentcell types generally revealed minimal overlaps, confirm-ing that many alleged FPs in fact may turn into truepositives in a different cellular context, so that FP num-bers are usually overrated. Rather, we suppose thatmost, if not all, high-affinity and conserved predicted
Figure 4 Degree distributions in the expanded reference transcriptional networks (eRTNs). Inverse cumulative distribution of in- (left) andout-degree (right), in linear (top) and semi-logarithmic plot (bottom). The distributions are shown for the expanded reference transcriptionalnetworks (eRTN) reconstructed with the indicated percentiles of top-ranking predicted and conserved TFBSs.
Haubrock et al. BMC Systems Biology 2012, 6(Suppl 2):S15http://www.biomedcentral.com/1752-0509/6/S2/S15
Page 7 of 10
TFBSs provide a regulatory potential that might be usedin a certain cellular situation.We are aware that our very stringent approach results
in large numbers of false negatives, since many experi-mentally validated TFBS have a very low Match scoreand gain their functionality by the proper context ofother elements. To include this kind of context, or theproper “syntax” of promoters, will be subject of furtherstudies and an according updating of our network. Alsothe inclusion of enhancers will be a task for futurework. We have observed that inclusion of conservativityas criterion does not well apply to enhancer regions, sothat new concepts have to be developed for their identi-fication and characterization.Altogether, we are confident that the networks we have
reconstructed reflect a relevant part of reality. This isalso supported by the observed kind of degree distribu-tion of the most stringent network, which follows a clearexponential law, as was to be expected at least for the in-degree distribution (see [20] and references cited therein)and from our own earlier observations for the out-degreedistribution as well [21]. Relaxing the filter criteria leadsto degree distributions with more random characteristics.We have also shown that on the basis of such restrictive
filtering, the networks can be reliably expanded by
including related TFs and allow them to inherit all targetrelations, and with that the full out-degree, of alreadycharacterized (sub)family members. Since these newlyadded regulators predominantly provide tissue-specificregulatory information, this expanded network is a goodbasis to construct reliable transcriptional networks forindividual tissues. A first overview revealed for these net-works that their degree distributions follow the same rulesas the reference network. In addition, first investigationshave shown that also the hub composition of all these net-works was comparable. Finally, we could show that in theparticular case of heart development, paralogous expan-sion was able to rescue target genes for a specific tran-scription factor (TBX3), which otherwise would not havebeen amenable in the corresponding tissue-specificnetwork.
ConclusionsA paralog-expanded transcriptional network has been con-structed based on the knowledge of master regulator orseed sites. It has been shown that the paralogous expan-sion provides as reliable basis to reconstruct tissue-specifictranscription networks. The obtained networks show theexpected statistical and topological characteristics. A firstcase study additionally provided biological evidence for
Figure 5 Tissue distribution of the TFs in the tissue-specific transcriptional networks (TTNs) and the corresponding expandednetworks (eTTNs). Shown are the portions of TF genes that appear in the indicated numbers of tissue-specific networks. The majority of TFs inthe tissue-specific transcriptional networks (TTFs) that were derived from the RTN are expressed in many, if not all tissues studied (blue bars). Incontrast, the newly added TF paralogs in the expanded TTNs (eTTNs) show a much more tissue-specific behaviour in being expressed in onlyone or few tissues (yellow bars).
Haubrock et al. BMC Systems Biology 2012, 6(Suppl 2):S15http://www.biomedcentral.com/1752-0509/6/S2/S15
Page 8 of 10
the reliability and usefulness of these networks in includ-ing regulatory information which would have been missedwithout this expansion. From that we conclude that ourapproach to construct transcriptional network is valid andprovides a solid ground for further studies, in particularwith regard to the analysis of regulatory processes, e.g. themechanisms governing cell differentiation.
Additional material
Additional file 1: Network statistics. Given are the numbers of vertices(split by TF and nonTF genes) and edges in the transcriptional networkswithout or with expansion, for the reference network as well for thetissue-specific networks.
Additional file 2: Prediction validations. In this file, plots of positivepredictive value (PPV), true positive rate (TPR) and Specificity are givenfor all TFs where sufficient experimental data have been made availableby the ENCODE project. Validation has been made in each case for allprediction profiles from the 1% top-ranking sites down to 100% of thepredictions for conserved binding sites.
Additional file 3: Revisited false positives. Venn diagrams ofcomparing independent experimental datasets for TFBSs within the -1kbregions with each other and the predictions done in this study.
Additional file 4: Degree statistics. The table indicates the averageout-degree and in-degree of TF genes as well as the average in-degreeof nonTF genes (NTF) for both the reconstructed transcriptional networks(reference network and tissue-specific networks) as well as thetranscriptional network expanded by related TFs. It also shows the ratios
of the corrresponding values for the expanded and the non-expandednetworks (eTN/TN).
Additional file 5: Degree distributions of tissue-specifictranscriptional networks. Inverse cumulative in- and out-degreedistributions of the tissue-specific transcriptional networks (TTNs) beforeand after paralogous expansions.
List of abbreviationsChIP: chromatin immunoprecipitation; eRTN: expanded referencetranscriptional network; eTTN: expanded tissue-specific transcriptionalnetwork; FN: false negative; FP: false positive; PPV: positive predictive value;PWM: positional weight matrix; RTN: reference transcriptional network; TF:transcription factor; TFBS: transcription factor binding site; TN: true negative;TP: true positive; TTN: tissue-specific transcriptional network.
AcknowledgementsThe authors acknowledge the financial support by the EuropeanCommission under FP7 (contract no. 202272, LipidomicNet).This article has been published as part of BMC Systems Biology Volume 6Supplement 2, 2012: Proceedings of the 23rd International Conference onGenome Informatics (GIW 2012). The full contents of the supplement areavailable online at http://www.biomedcentral.com/bmcsystbiol/supplements/6/S2.
Authors’ contributionsMH carried out the computational analysis of transcription factor bindingsites, constructed the reference networks, did the network analyses anddrafted parts of the manuscript. JL carried out the construction of the tissue-specific transcriptional networks and their analyses and drafted parts of themanuscript. EW conceived of the study, participated in its design and
Figure 6 Change of distribution in the tissue-specific networks by paralogous expansion. The ratio of the respective degrees in theexpanded tissue-specific networks (eTTNs) to those in the TTNs is shown for the individual tissues. The out-degree of TF genes changedmoderately by the expansion in a nearly identical manner across all tissues (about 1.6-fold; yellow squares). In contrast, the in-degree increasedconsiderably (about 2.3-fold), again similarly in all eTTNs (yellow dots). In general, the in-degree of non-TF genes increased slightly more, butwith outliers for spleen (below) and testis (above the average; blue dots).
Haubrock et al. BMC Systems Biology 2012, 6(Suppl 2):S15http://www.biomedcentral.com/1752-0509/6/S2/S15
Page 9 of 10

coordination and drafted the manuscript. All authors read and approved thefinal manuscript.
Competing interestsThe authors declare that they have no competing interests.
Published: 12 December 2012
References1. Wingender E: The TRANSFAC project as an example of framework
technology that supports the analysis of genomic regulation. BriefBioinform 2008, 9:326-332.
2. Alamanova D, Stegmaier P, Kel A: Creating PWMs of transcription factorsusing 3D structure-based computation of protein-DNA free bindingenergies. BMC Bioinformatics 2010, 11:225.
3. Gabdoulline R, Eckweiler D, Kel A, Stegmaier P: 3DTF: a web server forpredicting transcription factor PWMs using 3D structure-based energycalculations. Nucleic Acids Res 2012, 40:W180-W185.
4. Heintzman ND, Stuart RK, Hon G, Fu Y, Ching CW, Hawkins RD, Barrera LO,Van Calcar S, Qu C, Ching KA, Wang W, Weng Z, Green RD, Crawford GE,Ren B: Distinct and predictive chromatin signatures of transcriptionalpromoters and enhancers in the human genome. Nat Genet 2007,39:311-318.
5. Mullen AC, Orlando DA, Newman JJ, Lovén J, Kumar RM, Bilodeau S,Reddy J, Guenther MG, DeKoter RP, Young RA: Master transcription factorsdetermine cell-type-specific responses to TGF-β signaling. Cell 2011,147:565-576.
6. Zaret KS, Carroll JS: Pioneer transcription factors: establishingcompetence for gene expression. Genes Dev 2011, 25:2227-2241.
7. Blankenberg D, Taylor J, Nekrutenko A, The Galaxy Team: Making wholegenome multiple alignments usable for biologists. Bioinformatics 2011,27:2426-2428.
8. Kel AE, Gössling E, Reuter I, Cheremushkin E, Kel-Margoulis OV,Wingender E: MATCH: A tool for searching transcription factor bindingsites in DNA sequences. Nucleic Acids Res 2003, 31:3576-3579.
9. ENCODE Project Consortium: A user’s guide to the encyclopedia of DNAelements (ENCODE). PLoS Biol 2011, 9:e1001046.
10. Wheeler DL, Church DM, Federhen S, Lash AE, Madden TL, Pontius JU,Schuler GD, Schriml LM, Sequeira E, Tatusova TA, Wagner L: Databaseresources of the National Center for Biotechnology. Nucleic Acids Res2003, 31:28-33.
11. Sauer T, Shelest E, Wingender E: Evaluating phylogenetic footprinting forhuman-rodent comparisons. Bioinformatics 2006, 22:430-437.
12. Xie X, Rigor P, Baldi P: MotifMap: a human genome-wide map ofcandidate regulatory motif sites. Bioinformatics 2009, 25:167-174.
13. Heinemeyer T, Chen X, Karas H, Kel AE, Kel OV, Liebich I, Meinhardt T,Reuter I, Schacherer F, Wingender E: Expanding the TRANSFAC databasetowards an expert system of regulatory molecular mechanisms. NucleicAcids Res 1999, 27:318-322.
14. Tanaka R, Yi TM, Doyle J: Some protein interaction data do not exhibitpower law statistics. FEBS Lett 2005, 579:5140-5144.
15. Li J, Hua X, Haubrock M, Wang J, Wingender E: The architecture of thegene regulatory networks of different tissues. Bioinformatics 2012, 28:i509-i514.
16. Plageman TF Jr, Yutzey KE: T-box genes and heart development: puttingthe “T” in heart. Dev Dyn 2005, 232:11-20.
17. Greulich F, Rudat C, Kispert A: Mechanisms of T-box gene function in thedeveloping heart. Cardiovasc Res 2011, 91:212-222.
18. Han J, Yuan P, Yang H, Zhang J, Soh BS, Li P, Lim SL, Cao S, Tay J, Orlov YL,Lufkin T, Ng HH, Tam WL, Lim B: Tbx3 improves the germ-linecompetency of induced pluripotent stem cells. Nature 2010,463:1096-1100.
19. Bakker ML, Boukens BJ, Mommersteeg MT, Brons JF, Wakker V,Moorman AF, Christoffels VM: Transcription factor Tbx3 is required for thespecification of the atrioventricular conduction system. Circ Res 2008,102:1340-1349.
20. Martinez NJ, Walhout AJ: The interplay between transcription factors andmicroRNAs in genome-scale regulatory networks. Bioessays 2009,31:435-445.
21. Goemann B, Wingender E, Potapov AP: Topological peculiarities ofmammalian networks with different functionalities: transcription, signaltransduction and metabolic networks. Network Biol 2011, 1:134-148.
doi:10.1186/1752-0509-6-S2-S15Cite this article as: Haubrock et al.: Using potential master regulatorsites and paralogous expansion to construct tissue-specifictranscriptional networks. BMC Systems Biology 2012 6(Suppl 2):S15.
Submit your next manuscript to BioMed Centraland take full advantage of:
• Convenient online submission
• Thorough peer review
• No space constraints or color figure charges
• Immediate publication on acceptance
• Inclusion in PubMed, CAS, Scopus and Google Scholar
• Research which is freely available for redistribution
Submit your manuscript at www.biomedcentral.com/submit
Haubrock et al. BMC Systems Biology 2012, 6(Suppl 2):S15http://www.biomedcentral.com/1752-0509/6/S2/S15
Page 10 of 10