using procurement auctions in the department of … procurement auctions in the department ... why...
TRANSCRIPT

4825 Mark Center Drive • Alexandria, Virginia 22311-1850
CRM D0007515.A3 / FinalJuly 2003
Using Procurement Auctions in the Department of Defense
Omer Alper • W. Brent Boning

This document represents the best opinion of CNA at the time of issue.It does not necessarily represent the opinion of the Department of the Navy.
Approved for Public Release; Distribution Unlimited. Specific authority: N00014-00-D-0700.For copies of this document call: CNA Document Control and Distribution Section at 703-824-2123.
Copyright 2003 The CNA Corporation
Approved for distribution: July 2003
Matthew S. Goldberg, DirectorCost and Acquisition TeamResource Analysis Division

Contents
Summary . . . . . . . . . . . . . . . . . . . . . . . . . . . . . . 1Auction savings: counterfactuals and estimates. . . . . . . 1
Navy and Army auctions . . . . . . . . . . . . . . . . 2Defense Supply Center Columbus . . . . . . . . . . . 2Differences in estimated results . . . . . . . . . . . . 3
Issues in using auctions . . . . . . . . . . . . . . . . . . . 4Auction candidates . . . . . . . . . . . . . . . . . . . 4How auctions should be conducted . . . . . . . . . . 5Collusion and industrial base issues . . . . . . . . . . 6
Introduction . . . . . . . . . . . . . . . . . . . . . . . . . . . . 7
Auctions: Literature review . . . . . . . . . . . . . . . . . . . . 9Defining auction terms . . . . . . . . . . . . . . . . . . . 9
Forward and reverse auctions . . . . . . . . . . . . . 9Four common auction formats. . . . . . . . . . . . . 10Variations . . . . . . . . . . . . . . . . . . . . . . . . 12Auction information environments . . . . . . . . . . 14Symmetric and asymmetric bidders . . . . . . . . . . 16Efficiency . . . . . . . . . . . . . . . . . . . . . . . . 17
Theoretical results in the auctions literature . . . . . . . . 17Auctions with private values and symmetric
bidders . . . . . . . . . . . . . . . . . . . . . . . . . 18Auctions with affiliated values and symmetric
bidders . . . . . . . . . . . . . . . . . . . . . . . . . 20Auctions with private values and asymmetric
bidders . . . . . . . . . . . . . . . . . . . . . . . . . 21Common values and asymmetric bidders . . . . . . . 22The effect of more bidders . . . . . . . . . . . . . . . 23
Empirical results in the auctions literature . . . . . . . . . 23Auction formats and revenue . . . . . . . . . . . . . 23Effects of additional competition . . . . . . . . . . . 24
i

The effect of open-bid auctions: evidence from DIBBS. . . . . 25DIBBS auction history and rules. . . . . . . . . . . . . . . 25DIBBS auction data . . . . . . . . . . . . . . . . . . . . . 27Analysis of DIBBS auction results . . . . . . . . . . . . . . 30
DIBBS auction savings: simple comparisons. . . . . . 30Open-bid auction savings relative to sealed-bid . . . . 33Investigating potential sample selection issues . . . . 37DIBBS auction savings: number of bidders effects . . 44Other effects of DIBBS auctions . . . . . . . . . . . . 45Sealed-bid auction savings relative to conventional
purchase . . . . . . . . . . . . . . . . . . . . . . . . 45DIBBS results and theory . . . . . . . . . . . . . . . . . . 47
Navy and Army auctions. . . . . . . . . . . . . . . . . . . . . . 49Navy auctions . . . . . . . . . . . . . . . . . . . . . . . . . 49
History . . . . . . . . . . . . . . . . . . . . . . . . . . 49Procedures . . . . . . . . . . . . . . . . . . . . . . . 51Auction data limitations . . . . . . . . . . . . . . . . 52Auction data summaries . . . . . . . . . . . . . . . . 56
Army auctions . . . . . . . . . . . . . . . . . . . . . . . . 59History . . . . . . . . . . . . . . . . . . . . . . . . . . 59Simple analysis of data . . . . . . . . . . . . . . . . . 61
Why do DIBBS results and Service auction results differ? . . . . . . . . . . . . . . . . . . . . . . . . . . . . 63
Selection bias . . . . . . . . . . . . . . . . . . . . . . 63Product differences . . . . . . . . . . . . . . . . . . . 64Auction rules . . . . . . . . . . . . . . . . . . . . . . 64Different comparisons . . . . . . . . . . . . . . . . . 65
Issues in using auctions . . . . . . . . . . . . . . . . . . . . . . 67Alternatives: auctions, negotiations, and price taking . . . 67What should be bought by auction? . . . . . . . . . . . . . 68
Items that can be specified and have acceptable switching costs . . . . . . . . . . . . . . . . . . . . . 68
Commodities and non-commodities . . . . . . . . . . 70Auctions for items with cost-quality tradeoffs . . . . . 71Multiple lines/multiple lots: combinatorial auctions
and economies of scale and scope . . . . . . . . . . 72
ii

Why should individual commands/programs use auctions?. . . . . . . . . . . . . . . . . . . . . . . . . . . 73
How should auctions be conducted? . . . . . . . . . . . . 73Auction rules . . . . . . . . . . . . . . . . . . . . . . 73Collusion concerns . . . . . . . . . . . . . . . . . . . 75
Industrial base concerns . . . . . . . . . . . . . . . . . . . 75
Appendix . . . . . . . . . . . . . . . . . . . . . . . . . . . . . . 77Price comparisons . . . . . . . . . . . . . . . . . . . . . . 77
Excluded vs included: open-bid auction purchases compared to auction-period conventional purchases. . . . . . . . . . . . . . . . . . . . . . . . 77
Within auction price comparisons . . . . . . . . . . . 77Additional regression results . . . . . . . . . . . . . . . . 80
Full regression results. . . . . . . . . . . . . . . . . . 80Subsample regression results . . . . . . . . . . . . . . 80
List of Acronyms . . . . . . . . . . . . . . . . . . . . . . . . . . 83
References . . . . . . . . . . . . . . . . . . . . . . . . . . . . . 85
List of figures . . . . . . . . . . . . . . . . . . . . . . . . . . . 89
List of tables . . . . . . . . . . . . . . . . . . . . . . . . . . . . 91
iii


Summary
The Department of the Navy, and the federal government in general,have recently entered the electronic procurement auction market-place. One prominent approach is the use of reverse auctions. In areverse auction, a buyer solicits bids from a number of vendors for aproduct. These vendors submit bids specifying the price they willcharge to provide the product. Lower bids are more likely to win theauction. Because sellers submit bids, the buyer acts as the auctioneerand lower prices are better bids than higher prices, the auction is“reversed” from the more familiar conventional or forward auction.
This paper addresses a number of questions associated with the useof reverse auctions.
• What savings can be expected from using reverse auctions?
• What should be auctioned, and how should the auction be con-ducted?
• What is the possibility of undesirable consequences, such as col-lusion or the erosion of the industrial base?
Auction savings: counterfactuals and estimates
Auction savings can be difficult to estimate because the true savingsrequire knowledge of a counterfactual—the price that would havebeen paid if every other aspect of the transaction, including timingand quantity, were the same, but a different price-setting mechanismwere used. The credibility of the estimate depends on the validity ofthe counterfactual.
Auctions are not likely to generate continuous cumulative pricereductions with repeated use. Rather, auction prices are likely to fallfrom the traditional price when auctions are first introduced, andthen vary around a new level with repeated auction use.
1

Navy and Army auctions
The Navy and the Army have conducted a number of auctions sinceMay 2000. The counterfactual used for the estimates is typically theindependent government estimate (IGE). The validity of the IGE var-ies. There is some evidence that the IGE is not always an accuratecounterfactual. In addition, the Navy auction data, especially earlyauction data, have some notable inconsistencies.
Navy auctions have covered a wide variety of items, including com-modities, services, and items produced to meet unique criteria. Armyauctions have generally been for commodities. Using the IGE as thecounterfactual, the Navy and Army estimates of the savings that havebeen realized in their auctions are as much as 25 percent of theexpected cost.
We examined a limited set of Navy auction data where the Naval AuditService found supporting data. In these 39 observations, we foundlittle evidence that total value of the purchase affected the relative sav-ings. We found savings in commodities, engineered items, and ser-vices, but because of the limited sample size, a few purchases withsignificantly above or below the expected cost had a significant effecton the magnitude of the savings.
Defense Supply Center Columbus
The Defense Supply Center Columbus (DSCC) automated a sealed-bid first-price auction mechanism that was intended to replace con-ventional procurements for selected items. The contracts could beawarded based on a number of criteria. The automated auction wasthen modified to be an open-bid, first-price procurement auction fora limited number of products.
The DSCC data provide a natural experiment in the effects of chang-ing from a sealed-bid to an open-bid auction. Using the data, and con-trolling for quantity, product class price trends, and specific items, weestimate that publicly revealing bids reduces prices on average by4.4 percent below the sealed-bid prices. The savings increase as thenumber of bidders increases. We used a rough calculation to estimate
2

that implementing a sealed-bidding auction lowers prices by about 1percent below the conventional best-value purchase.
Differences in estimated results
The Navy and Army auctions report savings that are much higherthan those we found in the DIBBS auctions. We hypothesize thatthere are at least four possible reasons why the service and DSCC auc-tion results are so different:
• First, the products that were selected for Navy and Army auc-tions might be from very different markets than those of theDSCC. If the DSCC markets are more competitive initially, thesavings from the competition engendered by the reverse auc-tion will be smaller.
• Second, the selection of products themselves might be very dif-ferent. The DSCC products are not evaluated for particularlyhigh prospective savings from auctions; if they meet certain cri-teria, such as not being a critical safety item and not being ahigh-priority purchase, they are auctioned. In contrast, eachNavy and Army auction requires a conscious decision by a pur-chaser to use a reverse auction. We do not know the criteriaused by individual buyers, but it is possible that they choose anauction when they expect savings from that choice.
• Third, the auction rules differ. The DSCC auctions allow thebidders more flexibility than do the Navy and Army auctions. Inparticular, DSCC auctions allow bidders to increase their bids.This rule might generate strategic behavior and potentiallydecrease the savings that the auction might generate.
• Fourth, the auction savings estimates are derived using differ-ent techniques. The Navy and Army auction savings are deter-mined by comparing transaction price with the IGE in eachauction. The DSCC auction savings are estimated by regressionanalysis which compares the prices of the same item undersealed-bid and open-bid auctions, while controlling for addi-tional factors such as quantity. Because the DSCC auction sav-ings are based on a large number of actual transaction prices,
3

rather than a small number of estimated prices, they may bemore accurate.
Issues in using auctions
Auction candidates
Some characteristics of the types of items that are appropriate for auc-tions can be identified. These criteria indicate that using auctionsindiscriminately to all purchases of an entire type of product mightbe inappropriate.
Good auction candidates are items that can be specified
Good auction candidates are items that can be fully specified.Because the auction generates competition on the basis of price, it isimportant that the prices compared be for essentially the same good.Thus, commodities, which are standardized items, are suitable forauctions. Services that can be well defined, and even items that mustbe produced to unique specifications, can also be suitable for auc-tion.
Some auction candidates involve tradeoffs between features and cost
In some cases, excluding consideration of alternative quality-pricecombinations is undesirable. In these cases, auctions can still be partof the purchasing process. One way to do this is to specify the value ofimproved quality, so that bidders can compete for a fully specifieditem. Alternatively, the value of the non-price features can be unspec-ified, and after the auction, the product/price proposals of the ven-dors can be compared. However, in this case, the usefulness of theauction in stimulating price competition may not be as strong.
Commodities, engineered-items, and services are possible candidates
Commodities, engineered-items, and services can in many instancesbe fully specified, so procurement auctions might be appropriate foreach of them. In some circumstances, however, even commodities arenot ideal candidates. As noted, switching costs can be a limiting fac-tor. Also, in some cases competitive commodity markets may havealready made the posted prices nearly as low as possible. Auctions for
4

uniquely specified engineered items and services can generate com-petition that leads to significant savings. However, some of these itemsmight also involve tradeoffs in the features or quality that differentvendors could provide, thus making auctions for some items less suit-able for auctions.
Thus, a general statement of applicability of auctions to differentitems might lead to the inappropriate application of auctions.
Transaction costs and the costs of switching suppliers should be considered
The costs of switching suppliers should be incorporated into the auc-tion decision. Because an auction initiates the possibility of switchingsuppliers, the costs of changing suppliers should be considered. Evenswitching commodity suppliers can have costs. For example, systemsthat streamline the purchasing process and delivery of a commoditymay exist with one supplier and not another. Even though an auctionmay be appropriate for the item, these other transaction costs shouldalso be considered, and weighed against the expected savings from anauction.
Also, the expected price savings from an auction should be weighedagainst the costs of conducting an auction. If the auction mechanismis especially efficient, or especially costly, the auction costs mightdrive the decision about whether or not to conduct an auction. Forexample, the Defense Supply Center Columbus’ primary interest inauctions was streamlining the procurement process, rather than low-ering purchase costs. In other cases, such as the full-service Navy auc-tions, the costs of the auction can be high, and are only justified forauctions with the potential to produce very large savings.
How auctions should be conducted
The rules for an auction are important. In particular, the rules mayaffect the savings by driving the bidding strategies of vendors. Unfor-tunately, the optimal auction depends on the specifics of the informa-tion available to the vendors and the nature of the market. Thus, oneauction format is not always the best, but determining the auctionenvironment can be difficult. In several circumstances, however, the
5

open-bid auction is preferred to the sealed-bid auction because itreduces the risk of the winner’s curse1 and limits the ability of a singlebidder to control the transaction price.
Collusion and industrial base issues
Collusion has been found to be a problem in some auctions, particu-larly in electromagnetic spectrum auctions, which were for very highstakes. The concern with collusion is that open-bid auctions providethe suppliers who are bidding with an opportunity to signal competi-tors legally. Although this is a possibility, there are a few reasons whycollusion may be no more of a concern than in conventional procure-ments. First, collusion can only succeed only when there are a smallnumber of bidders, and, in general, the items that are appropriate forauction have multiple potential suppliers. Second, collusive behaviorcan only be sustained if the same bidders are active in multiple auc-tions. In the spectrum example, several auctions were occurringsimultaneously.
The concern with industrial base issues is that auctions might squeezefirms’ profit margins, causing marginal firms to become unprofitable.This could lead to a consolidation of market power and ultimatelyreduce competition. However, this implies that the government iswilling to tolerate inefficient suppliers who will pass on higher prices.Inefficient vendors may be forced out, but auctions are unlikely tocreate new barriers to entry that would inhibit competitive markets.However, if the market has significant barriers to entry, such consoli-dation could present problems.
1. The winner’s curse is the problem that the auction winner might haveovervalued the object being identified. In a reverse auction setting, theproblem is that the auction winner might have significantly underesti-mated the cost of providing the good or service.
6

Introduction
Auctions have received considerable attention in recent years. Onewidely publicized example is the Federal Communications Commis-sion (FCC) auctions for electromagnetic spectrum. Since 1994, theauctions have generated huge revenues—a single auction for multiplelicenses ending in May 1996 yielded total revenues of over $9 billion[1]. Consumer Internet auction sites such as eBay, Yahoo, and Amazon,also gained wide publicity—eBay alone has nearly 50 million registeredusers, and the value of its transaction totaled more than $5 billion in2000 [2]. And businesses, especially auction service providers, reportdramatic savings that have been realized through their use of elec-tronic reverse auctions. For example, FreeMarkets, an auction serviceprovider, reports that its online auctions have saved its customers $9 bil-lion since 1995, and GE Global Exchange Services claims that its cus-tomers have reduced their costs by 7 to 39 percent, resulting in savingsof more than $200 million in the first quarter of 2002 [3, 4].
The Department of Defense is also participating in the electronicreverse auction marketplace. Naval Inventory Control Point Philadel-phia (NAVICP) conducted the first government reverse auction inMay 2000, and has established a reverse auction program using com-mercial providers. The Army’s Communications and ElectronicsCommand has conducted a number of reverse auctions using a com-mercial provider, and the Defense Supply Center Columbus hasimplemented reverse auctions using its own program.
The highly publicized success of recent auctions has generated spec-ulation on the savings that could be realized in the Department of theNavy if the use of reverse auctions were more widespread. This paperis intended to help Navy decision-makers make informed decisions.To establish a foundation for our discussion of auctions, we beginwith a definition of terms, and a review of key theoretical and empir-ical results from the economics literature. We then review and analyzeauction data that we obtained. We conclude with a discussion of someconcerns that arise when auction use is considered.
7


Auctions: Literature review
Auctions have been used to establish the trading price of items forthousands of years.2 Auctions often bring to mind the picture of afast-talking, gavel-wielding auctioneer and a room full of potentialbuyers. As the item, perhaps livestock or an antique, is presented tothe buyers, the auctioneer starts calling out prices. When someoneoffers to buy the good at that price, the auctioneer seeks anyone whowill bid a higher price. Buyers continue to bid until one buyer estab-lishes a price no other buyer will top, and the auction concludes withthe traditional “going, going, gone—sold to the gentleman in thethird row.”
Although current auction practices can be quite different, this exam-ple of a traditional auction provides a common ground for develop-ing the concepts and features of different auctions. In this section, wewill introduce different rules for auctions and then discuss differentinformation environments in which auctions take place. After layingthis foundation, we will present some of the significant results in theeconomics literature on auctions.
Defining auction terms
Forward and reverse auctions
The scenario described above is a forward auction, commonlyreferred to as simply an auction. In a forward auction, the biddersseek to purchase a good or service from the auctioneer of an item or
2. Several articles cite Herodutus’ report of Babylonian auctions forwomen of marriageable age in the 5th century BC. (See for example[5]). The sale of the Roman Empire by ascending auction in AD 193 isanother noteworthy example [6].
9

items.3 (The actual owner of the items could be someone other thanthe auctioneer, but we assume that the auctioneer acts on the owner’sbehalf.) The objective of the auctioneer is to obtain the highest pricefor the good being sold. The bidders want to pay the lowest price theycan to obtain the good, but they must compete with other bidders forthat good.
In contrast, a reverse auction involves an auctioneer who wants to pur-chase a good or service from one of several potential suppliers.Hence, the auctioneer’s goal is to obtain the lowest price. The bid-ders’ goal is to sell the product at the highest price, but they mustcompete with other bidders who are also trying to sell the product orservice. Thus, the bidding will likely start at a high price, and as thebidders compete, successively lower prices are submitted until a priceis submitted below which no other sellers are willing to go.
Four common auction formats
Every auction must specify how to submit bids, how the winningbidder is selected, and what the transaction price will be. In additionto these essential requirements, the auctioneer can impose a numberof additional conditions, and these rules can have a significant impacton the auction outcomes.4 Different auction formats developed tomeet the needs of the auctioneers. In some cases, the rules weredesigned to influence the speed of the auction. In other cases, therules were designed to encourage more aggressive bidding.
In this section, we discuss some of the more common auction formats,to provide background for readers. After defining auction types andother characteristics of the auction environment, we will discuss howthose rules and characteristics affect the auction outcomes. We will
3. It is not necessary that the final transaction involve only one seller andone buyer. Auctions can be designed to allocate goods from multiplesellers to multiple buyers. For simplicity, we will not focus on such auc-tions in this paper.
4. Reference [7] provides numerous examples where auction rules inad-vertently led to unintended (and undesirable from at least one party’sperspective) outcomes.
10

use the reverse auction as the context for describing the formats. (Aforward auction analogy exists for each format.) Thus, lower bids aremore likely to win than higher bids.
The scenario that introduced this section is an English (or Englishopen outcry) auction. A reverse auction version involves supplierswho submit successively decreasing bids until no other bidder willannounce a lower bid. The history of bids and the bidder’s identity isknown to all bidders. The winning supplier is the bidder who makesthe last (lowest) bid. The contract price is the winner’s bid. Uniqueitems, such as art work, antiques, and livestock are common examplesof items sold by English auction.5
In a sealed-bid, first-price reverse auction, each vendor/bidder sub-mits only one bid. The bids are not revealed to competing bidders.The winning bidder is the one who submits the lowest bid, and thecontract price is the amount of the winning (lowest) bid. Sealed-bid,first-price auctions are frequently used for purchasing items. Govern-ment procurements have often been sealed-bid, first-price auctions.
In a reverse Dutch auction, the buyer/auctioneer initiates the auctionby announcing an extraordinarily low transaction price. He thenannounces successively increasing prices until some provider/bidderstops the bidding. The winning bidder is the first one to stop the auc-tioneer, and the price paid is the last price announced by the auction-eer. The Dutch auction is so named because the forward Dutchauction is used in the wholesale flower market in the Netherlands. Itis also used in fish markets in Israel and tobacco markets in Canada[6].
In a sealed-bid, second-price (also called Vickrey) auction, eachbidder submits only one bid. The winner is the one with the lowest
5. A variant on the English auction is the Japanese (also called English-descending-clock or open-exit) auction. In the reverse auction version,the auctioneer announces successively decreasing prices. All vendorsare initially in the auction. As the price falls, bidders must choose theprice at which to withdraw (publicly) from the auction. The last vendorremaining is the winner, and the contract price is the price at which thenext-to-last bidder withdrew.
11
bid, and the contract price is the amount of the next-lowest bid. Amulti-unit version of the sealed-bid, second-price auction has beenused to sell U.S. Treasury securities since 1997 (the single-price auc-tion described below). This format was designed to lead bidders tobid their actual valuations.
Variations
Multiple-item auctions
The auctions we just described establish rules for setting the price andcompleting the transaction between a seller and a single buyer. (Thegood can be a “lot” or bundle of items, but it is sold as a single entity.)However, in some instances, an auctioneer may want to purchaseidentical items from several different vendors, and if so, the auctionrules must specify how the multiple vendors are to be selected, theprice each vendor will receive, and the quantity each vendor will pro-vide.
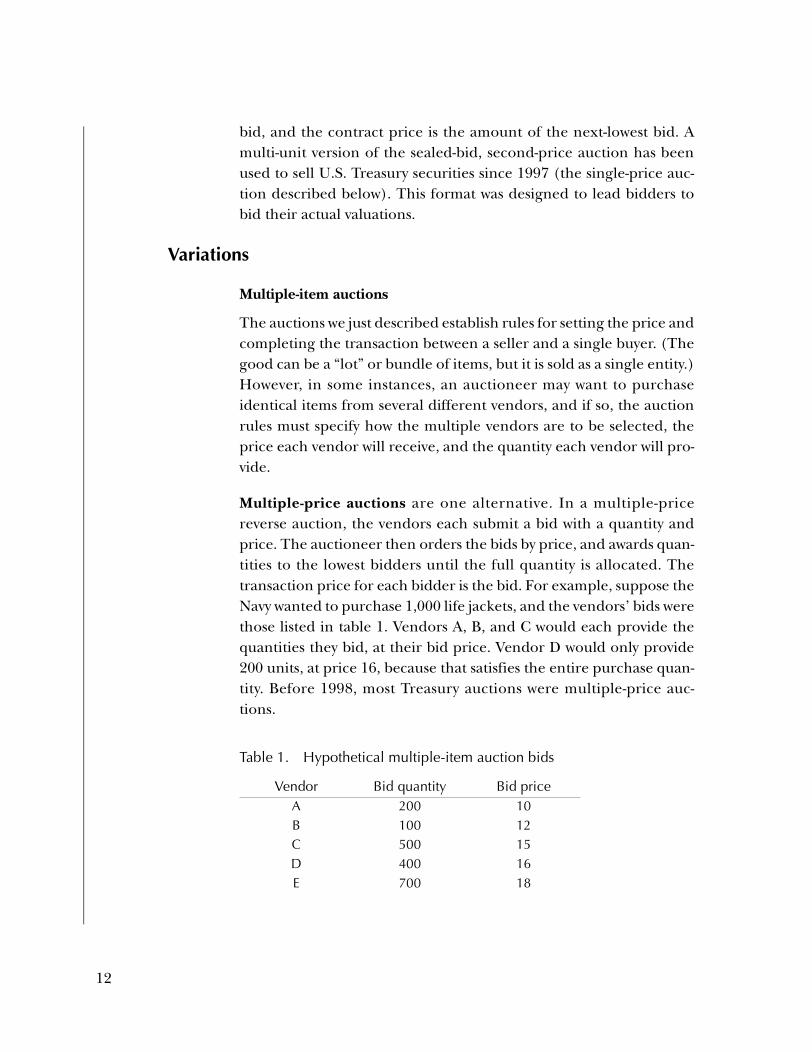
Multiple-price auctions are one alternative. In a multiple-pricereverse auction, the vendors each submit a bid with a quantity andprice. The auctioneer then orders the bids by price, and awards quan-tities to the lowest bidders until the full quantity is allocated. Thetransaction price for each bidder is the bid. For example, suppose theNavy wanted to purchase 1,000 life jackets, and the vendors’ bids werethose listed in table 1. Vendors A, B, and C would each provide thequantities they bid, at their bid price. Vendor D would only provide200 units, at price 16, because that satisfies the entire purchase quan-tity. Before 1998, most Treasury auctions were multiple-price auc-tions.
Table 1. Hypothetical multiple-item auction bids
Vendor Bid quantity Bid priceA 200 10B 100 12C 500 15D 400 16E 700 18
12

Single-price auctions are similar to multiple-price auctions. The dif-ference is that all bidders who provide any quantity do so at the sameprice. This price can be the highest bid price that provides any of thegood. In the example, the quantities remain the same, but eachvendor receives 16 per unit. Alternatively, the price can be the lowestof any vendor not winning a quantity. Because the price is not set atthe actual bid for most vendors, the single-price auction is similar tothe second-price auction introduced earlier.
Additional rules
Auction formats may include additional features. For example,reserve prices can be used to establish a ceiling in a reverse auctionabove which the auctioneer will not purchase the good from anybidder. Reserve prices can be hidden or open. Minimum-bid incre-ments can be required in open auctions; this forces one bidder toexceed the current best bid by at least the minimum increment.These minimums can speed up the auction process by eliminatingtrivial bidding increments. An auctioneer can specify fixed auctionperiods that require all bids to be submitted within a given period.Entrance fees can also be established. Proxy bidding has been usedby some on-line auctioneers, such as E-bay. In a proxy bid, the bidderstates the maximum he is willing to pay for an item. This maximum iscompared against the current best bid, and if the maximum exceedsthat bid, a bid of the current best bid plus the minimum increment isentered. Proxy bidding requires a third party to act as the auctioneer.Anonymous bidding can be incorporated into different auction for-mats. Internet-based bidding has greatly facilitated anonymous bid-ding in English auctions. Anonymity in sealed-bid auctions has alwaysbeen easy to arrange. Rank-order bidding, where bidders do notknow the values of the other bids, but only how their own bids rankrelative to the others, are similar to English auctions. Many commer-cial online auction websites have experimented with additional fea-tures, as detailed in [8].
Optimal mechanism design
Economists have devoted significant effort to developing auctionrules that guarantee efficiency, which is the condition that the bidderwith the highest valuation will win the auction assuming everyone
13

plays optimally.6 However, most of these rules become very compli-cated or cumbersome.7
One variant that seems reasonable is a hybrid between the Englishauction and the sealed-bid auction. Klemperer (1998) suggests thatthe reverse auction should start with open bidding, with the price fall-ing until all but two bidders have dropped out. Then the two remain-ing vendors should each submit a “best-and-final” sealed-bid offerthat is no higher than the last open bid. The winner is the vendor withthe lowest bid, and that bid is the transaction price [10].
Auction information environments
A key feature in every auction is the bidders’ information about thevalue of the auctioned item. That value may be known precisely toeach bidder, or may be unknown, although some signals of the valueare available to each bidder. The information structures influencebidding behavior and outcomes. Different types of auctions willaggregate these diverse bits of available, but privately held, informa-tion about the actual value of an item up for bid. This sectiondescribes the different information environments.
Economists typically model valuations as the result of draws from arandom distribution. Thus, the information environment is charac-terized by how the draws affect the valuation, and how the draws ofthe different bidders are related.
Private values
The private value environment exists when each bidder’s valuation ofthe auctioned item is known to himself, but each bidder does not
6. Intuitively, “optimal” play means that each bidder rationally bids in hisown best interest. Technically, it means each bidder follows his domi-nant bidding strategy.
7. For example, one proposed auction design requires every bidder tosubmit a sealed “bidding schedule” of his bid responding to every otherpossible bid by other bidders [9]. Although the auction has desirableproperties, it seems unlikely that vendors would be willing to participatein such a complex auction.
14
know the other bidders’ valuations. Thus, in a private values environ-ment, knowing other bidders’ information does not affect any onebidder’s valuation of the auctioned item. In other words, if a bidderknew all the private information that other bidders hold, his valua-tion of the auctioned item would not change (though the biddingstrategy could change). With private values, the valuations are mod-eled as independent draws from continuous distributions [11].
A simple private value example might be an auction for a bottle ofwine. Each bidder assesses the qualities of the specific vintage and hasa personal valuation of those qualities. If each bidder’s assessmentand valuation do not depend on other bidders’ quality assessments,then a private values environment exists. In a reverse auction context,a private values environment exists if a bidder’s estimate of the cost ofproducing the item up for bid cannot be improved by knowing otherbidders’ information. This may hold when the product in the reverseauction is produced on a repetitive basis. The private values assump-tion is most likely to hold in forward auctions for nondurable con-sumer goods [11].
Common values
By contrast, a common values environment exists when one bidder’sinformation is useful to another bidder. In the “pure common values”case, the value of the auctioned item is the same to each bidder, buteach bidder’s information about that value differs. If a bidder knewthe information that the other bidders had, he could form a differ-ent, and presumably more accurate, valuation of the auctioned item.
Milgrom provides an example of a common values environment [12].Suppose several painters are equally capable of doing a job at thesame real cost of C. However, they each estimate the cost as C+e, wheree is an error that is independent from painter to painter and has amean of 0. The error e represents the over- or under-estimate of thetime and materials that the job will require. The average of the bid-ders’ estimates should then be accurate, but each bidder’s valuationindividually will be inaccurate. Thus, knowing the estimates of otherbidders will allow any bidder to change his own valuation of the auc-tioned item. In this example, the valuations are the sum of a random
15

draw C and the error term e. Even though the errors are independent,the valuations are correlated because of the common term C.
An affiliated values environment allows the valuation to depend onboth a common element and a private element. An example might bea bid for a large, technically-demanding design project. In this case,there is a common value because the technical challenges and mate-rial costs are uncertain but would be the same for all bidders. How-ever, there are also private values because the production process andthe skills and wages of the engineers and production staff mightdiffer. The affiliated values environment includes the pure commonvalues and private values models as special cases.8
The winner’s curse—a common values problem
The winner’s curse is a problem associated with the common valuesenvironment. Suppose each bidder’s estimate of the value is based onthe imperfect signal that he receives, and the bidder submits thatvalue as his bid. Then the winning bid will be the greatest overesti-mate of the item’s value. Thus, the winning bidder is “cursed” by win-ning because he will over-pay for the auctioned item.
Knowledge of the winner’s curse causes some bidders to alter theirbidding strategies, which in turn affects the final outcome of the auc-tion. One issue in conducting auctions is knowing how the auctionrules affect the bidders’ ability to avoid the winner’s curse.
Symmetric and asymmetric bidders
A second important feature of the auction environment is the similar-ity between bidders. Bidders can be symmetric, meaning that the bid-der’s valuations and signals are drawn from the same distribution.The implication is that the bidders each treat a given set of informa-tion in the same manner, including the information they have gath-ered and the information from other bids [11]. Thus, bidding
8. The definition of affiliated values can be interpreted as “large values forsome of the variables make other variables more likely to be large thansmall.” The formal definition and interpretation of affiliated values areprovided in [11].
16

strategies are the same; that is, given the same set of information,each bidder will bid the same. Alternatively, bidders can be asymmet-ric. In this case, the bidder’s valuations are based on draws from dif-ferent distributions, although the distributions themselves arecommon knowledge. Asymmetric bidders are fundamentally differ-ent. In a reverse auction, for example, the item up for bid might berelated to an item already being produced by only one bidder. Havingalready established a production line, that bidder might be able toproduce the new item for bid at lower cost. This creates an asymme-try—one firm has an advantage. Bidding strategies and auction out-comes depend on whether the bidders are symmetric or asymmetric.
Efficiency
An efficient auction mechanism has the property that, given optimalbehavior by the participants, the winner is always the bidder with thehighest valuation. Efficiency generally varies across auction types anddepends on several characteristics of the underlying informationenvironment. An auctioneer is not always interested in an efficientmechanism. In particular, in a procurement auction, the purchase-price-minimizing auction allocates the item to the bidder with thelowest marginal cost. This is not necessarily the bidder with the high-est valuation [6]. Thus, efficiency is not our primary concern.
Theoretical results in the auctions literature
The auction theory literature dates to at least 1961, when WilliamVickrey published “Counterspeculation, Auctions, and CompetitiveSealed Tenders” in the Journal of Finance [13].9 Since the early 1980s,the field has expanded rapidly—the Journal of Economic Literature lists25 articles on auctions published in major economics journalsbetween May and September 2002 [14].
The results on the types of auctions that result in the best outcomefor the auctioneer in different environments might be useful to theNavy when deciding which auction rules to use in a given setting.
9. Vickrey’s contributions to theory of information economics were recog-nized with the 1996 Nobel Prize in Economics.
17

Though the magnitude of the difference has not been quantified inthe literature, even a marginal price improvement from appropri-ately structuring an auction on a high value purchase could yield sig-nificant savings.
We summarize here only a small selection of the most applicableresults. We will focus on the effects of different auction environmentsand rules on the transaction price.
Auctions with private values and symmetric bidders10
A single-item, private values auction with symmetric bidders is the eas-iest type of auction to analyze. In such an auction, the bidding strate-gies can be easily deduced. For example, in an English open auction,a dominant strategy is for a bidder to bid the minimum amount overanyone else until his valuation is reached, and then to drop out.Because all bidders will follow this strategy, the bidder with the high-est valuation will win the auction with a bid that just exceeds thesecond highest valuation. Theoretically, we assume that “just exceeds”is negligible, so that the transaction price is the second highest valua-tion.
In a second-price, sealed-bid auction, the dominant strategy is for abidder to bid his actual valuation. Because the transaction price whenhe wins is set by someone else’s bid, he has no incentive to shade hisbid. For example, suppose he bids his valuation. In this case, he eitherhas the highest bid and wins, but pays less than his valuation, or some-one else has the highest bid and he is just as well off as he was before.However, suppose he bids less than his valuation. Then he could losethe auction to someone else who bid more than he did, but still lessthan his actual value, so he is worse off than if he had bid his valua-tion. Bidding more than his valuation could mean he wins. If thesecond highest bid was below his valuation, the outcome (bothwinner and transaction price) is the same as if he had bid his valua-tion. However, if the second highest bid is more than his valuation, hewins but has to pay more than his value and he is worse off. Thus, the
10. The results in this summary can be found in numerous articles. Theyare nicely summarized in [11].
18

optimal bid for each bidder is the actual valuation. Given this strategy,the winning bidder is the one with the highest valuation, and theprice is the second highest bidder’s valuation.
Note that the outcomes of the first-price, open-bid auction and thesecond-price sealed-bid auction are the same. Given the restrictiveassumptions of private values and symmetric bidders, the auctions areequivalent.
In the Dutch auction, the bidder must decide at what point he will stopthe auction if no other bidder has claimed the item. In the first-pricesealed-bid auction, the bidder faces the same decision problem—hemust bid the value at which he is willing to claim the prize. The actualchoice of the bid represents a tradeoff for the bidder between the prob-ability of winning and the value of winning. In a reverse auction, bid-ding low makes it more likely that the bid is the lowest received andthus the winning value, but it also reduces the profit from winning.Conversely, a high bid means that the vendor is unlikely to win, but theprofit from winning is very high. The bid is selected to maximize theexpected payoff, considering both the probability and value of win-ning. Note, however, that the auctioneer obtains more informationfrom nonwinning bidders (namely their bids) under the sealed-bidfirst-price auction than under the Dutch auction.
The revenue equivalence theorem is a significant result in the auc-tions literature. This theorem states that, given private values, risk-neutral symmetric bidders, and the same set of bidders’ valuations,the expected winning bid in an English, first-price sealed-bid, second-price sealed-bid, or Dutch auction in a private-value, symmetric auc-tion is the same. In other words, the optimal tradeoff between win-ning and the payoff to winning in the Dutch and first-price sealed-bidauctions results in the expected value of the winning bid being equalto the second highest bidder’s valuation.11
11. Technically, the theorem requires that the auction rules result in an effi-cient outcome and that the bidder with the lowest possible valuationexpects zero surplus, that is, he expects to be exactly as well off after theauction as before. The revenue equivalence theorem has multipleproofs. For readable summaries, see [6].
19

Auctions with affiliated values and symmetric bidders
Bidding strategies in auctions with affiliated values are much morecomplicated, because a bidder is uncertain of the value of the itembeing auctioned and other bids provide information about the sig-nals that other bidders have observed. Thus, a bidder might adjust hisvaluation of an item as other bids are observed, and this adjustmentleads to changes in bids. Because auction formats differ in how muchinformation can be gathered and how that information can be used,more variation in outcomes can occur.
Milgrom and Weber established a number of relationships in the affil-iated values environment that may pertain to the decisions regardingthe use of auctions.12 Their paper [11] demonstrates the followingresults for auctions in symmetric, affiliated values environments:
• From the auctioneer’s perspective, the expected winning bid inthe auction can be ranked from best to worst as
— Open-bid, first-price (English) auction
— Sealed-bid, second-price auction
— (Tie) sealed-bid, first-price auction and Dutch auction
• If the auctioneer has information, even imperfect information,about the valuation of the item, his best policy is to truthfullyreveal it.
The intuition for the ranking of auctions is that the auction formatsdiffer in how much information the bidders can infer from bids, andhow much control the winning bidder has in setting the transactionprice. The more the price depends on private information, the morethe vendors will hedge their bids and bid a price above their cost.Thus, bidders most prefer, and auctioneers least prefer, the first-price, sealed-bid auction, because the final price is based on the win-ning bidder’s price alone, and there is no additional information
12. The results incorporate the assumption of risk-neutrality among thebidders. Firms are generally assumed to be risk-neutral, so this assump-tion seems innocuous. For a review of experiments and theory relatedto risk-averse bidders, see [15].
20

from the auction to cause bidders to bid more aggressively. In thesecond-price auction, there is less hedging because the price dependson a second bidder’s information, which will be correlated with thefirst bidder’s valuation because the valuations are affiliated. In theEnglish auction, the price depends on several bids as each bidderincorporates other bidders’ actions as signals of their information, sothat the price depends even less on private information [6, 12].
Auctions with private values and asymmetric bidders
Research in auctions with asymmetric bidders is close to the cuttingedge in auction theory. Asymmetric bidders exist when it is commonknowledge that the valuation distributions vary among bidders.Maskin and Riley have studied the outcomes when two different bid-ders are in the auctions [16]. They characterize the differencesbetween the bidders as:
• The “strong” bidder’s valuations are drawn from a distributionshifted to higher valuations, either by extending the upperlimit on the valuations, or by shifting both the upper and lowerlimits to higher valuations.
• The “weak” and “strong” bidders’ valuations are drawn fromthe same range of values, but the strong bidder is more likely tohave high valuations.
They consider the sealed-bid, first-price, and English auction (whichis equivalent to the sealed-bid, second-price auction) and derive thepreferences of the types of bidders and the revenue-generatingpotential of the auctions. Table 2 summarizes the results.
Table 2. Summary of asymmetric auction revenue theory [16]a
a. Assumes private values.
Result
Strong bidder valuation drawn from distribution with supports shifted or stretched
to higher valuations than weak bidder’s
Strong bidder valuation distribution drawn from
distribution with same supports, but higher probabilities of higher
valuationsStrong bidder’s auction preference Englishb
b. The English auction is also called an open auction, and is equivalent to a sealed-bid, second-price auction.
EnglishWeak bidder’s auction preference Sealed-bid, first-price Sealed-bid, first-priceAuctioneer’s preference Sealed-bid, first-price English
21

Klemperer offers a possible reason for this result. In a first-price auc-tion, the optimal strategy is for a bidder whose value is drawn fromthe weaker distribution bids to bid closer to his actual valuation thanthe bidder who draws from a stronger distribution. Thus, the weakbidder has a higher probability of winning and prefers the sealed-bid,first-price auction to the English auction, which is won by the bidderwith the higher distribution (and is thus favored by the strong bid-der). The expected transaction price depends on how the asymmetryarises [6].
These results might help the Navy decide which type of auction to usein a given procurement. For example, if potential bidders for a givenprocurement all use the same production process, but one consis-tently achieves lower production costs, then the situation from thesecond column of table 2 exists—the strong bidder’s valuation is fromthe same range, but the strong bidder is more likely to get the lowercost. In this case, the Navy would find an open-bid first-price auctionpreferable to the sealed-bid first-price auction. Conversely, if onebidder uses a different technology that is more likely to produce at alower cost, the Navy would prefer the sealed-bid first-price auction.Though the magnitude of the difference was not quantified in the lit-erature, even a marginal improvement from appropriately structur-ing an auction on a high-value purchase could yield significantsavings.
Common values and asymmetric bidders
Results in common values and asymmetric bidders are not well devel-oped, in part because the results depend on the particular specifica-tion of the asymmetry. It has been demonstrated that a smalladvantage in an almost common value auction (one where the privatevalues are relatively small compared to the common value) cansignificantly tilt the auction toward the stronger bidder. This smalladvantage in the private value enables the bidder to bid a little moreaggressively. Such a bid means that a weaker bidder who wins is morelikely to suffer from a winner’s curse, and thus the weaker biddermust hedge the bid a bit more [6]. Thus, even a small advantage canhave a dramatic impact.
22
The effect of more bidders
Generally, more bidders are better for the auctioneer. In a private-val-ues, symmetric environment, additional bidders will improve the pricethe auctioneer receives. Consider, for example, a sealed-bid, second-price procurement auction with private values. The dominant strategyis for each bidder to bid his own valuation. In a reverse auction, theadditional vendor can bid above the second-lowest bid, between thelowest and second-lowest bid, or below the lowest bid. In the first case,the transaction price is not changed. In the second case, the transac-tion price is lower because the new second-lowest bid is below the oldsecond-lowest bid. In the last case, the transaction price is also lowerbecause the old lowest bid becomes the second-lowest bid. The addi-tional bidder can only improve the price received by the auctioneer.
Bulow and Klemperer studied the effect of adding one bidder to anauction. They first establish that the optimal mechanism for the auc-tioneer in an affiliated-values environment is an English auction fol-lowed by a take-it-or-leave-it offer to the last remaining bidder. Thisultimatum exploits the auctioneer’s monopolist/monopsonist posi-tion. They then show that the expected price in such an auction is notas good for the auctioneer as an English auction with just one morebidder. Because the take-it-or-leave-it approach is optimal given a setnumber of bidders, this implies that any other rules the auctioneercan use to improve his expected price, such as reserve prices, are notas valuable as attracting an additional bidder [17]. Also, additionalbidders reduce the potential for collusion.
Empirical results in the auctions literature
Auction formats and revenue
The empirical research of auctions is not as developed as the theoret-ical research. One recent paper reports the results of an experimentauctioning collectible cards on the Internet using different auctionformats. The experiment involved selling matched sets of cards usingthe English and second-price, sealed-bid auctions, and anothermatched set of cards using both the Dutch and first-price, sealed-bidauctions. The experiments were performed twice, so that each of theauction formats would be first once. In the English and second-price
23

experiment, the English auction had significantly higher revenuewhen it was second, and the second-price had statistically insignifi-cant higher revenue when it was second. The pooled results found nostatistical difference, controlling for order. Under symmetric private-values auctions, theory indicates that the revenue should be the same.Under symmetric affiliated-values auctions, English auctions shouldhave higher revenue. Because the environment is not known, theseresults do not conclusively support or contradict theory.
The Dutch auctions were statistically significantly higher than theEnglish auctions regardless of ordering. Under symmetric private-values or affiliated-values auctions, theory indicates that the Dutchauction and first-price auction should have the same revenue. Thus,the results contradict theory. However, the Dutch auction resulted inmore bidder participation than did the first-price auction, possiblyaltering bidding results [18].
A study of Forest Service timber auctions found that English and first-price sealed-bid auctions did not result in statistically different reve-nues [19].
Effects of additional competition
Experimental results indicate that the number of bidders improvesthe transaction price for the auctioneer. A recent experimental studyfound that the number of bidders in first-price auctions led to betterprices for the auctioneer [20]. Simulation results demonstrated thatthe magnitude of an additional bidder’s effect declines as the numberof bidders increases in both sealed-bid first and second-price auctions[21].
The effect of additional bidders improving the outcome for the auc-tioneer is well supported with empirical evidence. One analysis exam-ined the effect of more bidders in bond auctions, oil lease auctions,and timer auctions. In every case, the auctioneer’s price improved asthe number of bidders increased. The auctions studied encompassboth private-value and common-value examples, indicating that morecompetition is better in both environments. The effect of additionalbidders is most pronounced at lower numbers of bidders. As thenumber of bidders increase, the additional impact decreases [22].
24

The effect of open-bid auctions: evidence from DIBBS
Our richest source of procurement auction data was the data weobtained from the Defense Supply Center Columbus (DSCC) Inter-net Bid Board System (DIBBS). In August 2000, DSCC converted asealed-bid, first-price auction program into an open-bid, first-priceauction program. This conversion was the result of a change in theFederal Acquisition Regulations and not related to any changes in theproduct markets or purchases.13 This provides a convenient naturalexperiment that can be used to evaluate the price effects of conduct-ing open auctions.
DIBBS auction history and rules
In August 1999, DSCC implemented an automated system for solicit-ing, evaluating, and selecting bids, called Procurement AutomatedContract Evaluation (PACE). Procurements under $25,000 (thethreshold was later raised to $100,000) that met the criteria for rou-tine purchases were processed through PACE.14 PACE solicitationsare posted to DIBBS, and registered suppliers respond with theirbids. Bidders can submit bids that deviate from the solicitation, butthese bids will be considered only if the best bid does not meet solic-itation criteria. When the solicitation closes, PACE discards bids thatare not eligible for automated awards and evaluates the bids that are
13. For a summary of the legal issues, see [5].
14. Among the criteria that disqualify an item for a PACE purchase areitems requiring first article inspection, critical safety items, high-prioritypurchases, and items using government-furnished material.
25

in accordance with the solicitation criteria.15 The evaluation includesprice adjustments for surplus materials and inspection at originrather than destination, and applies a price-reasonableness algorithmto the lowest bid. If the lowest bid satisfies the price-reasonablenessalgorithm and final automated checks for contractor responsibility,the vendor is automatically selected, notified, and sent a contract. Ifthe lowest resulting bid fails the algorithm or final checks, then PACEdoes not make a selection and a manual selection process is used.PACE does not apply best-value criteria, though these criteria may beused in the manual selection process. Essentially, PACE implementedand automated the sealed-bid, first-price auction for selected items.
In August 2000, DSCC modified the PACE program to conduct first-price, open-bid procurement auctions on DIBBS. These auctionsmodified the same procedures of the PACE procurements that hadalready been initiated. Specifically, they notified the vendors that thepurchase would be an auction, and the vendors had to agree to lettheir bids be published, anonymously, on the DIBBS website. At theend of the bidding period, PACE applied the same evaluation andselection criteria.
This implementation of open-bid auctions resulted in a set of rulesthat differs significantly from those of most commercial auctions,including those used by the Navy and Army. DIBBS auctions typicallylast 14 days and have a firm closing time, whereas most Navy andArmy auctions are initially restricted to as little as half an hour,although extensions are allowed if bids are received just before clos-ing time.16 For each auction, not only are price quotes published forDIBBS auctions, but other factors that affect price-related evaluation,
15. Bids that are not eligible are alternate bids and bids with exceptions,which include deviations from the solicitation’s item description,packaging, freight on-board or required quantity. However, quot-ing delivery that is different from the required delivery days or quotingorigin inspection when the solicitation specifies destination inspectionare not exceptions that make the bid ineligible. See DSCC Master Solic-itation.
16. DIBBS auction start and end times are specified in the solicitation[23]. The effects of open-ended and fixed bidding periods has beenstudied by [24].
26

such as Buy American status, are published as well. DIBBS allows thesubmission of quotes that are higher than the minimum bid (thus,there is no minimum bid increment) and allows bids to be revisedupward and to be withdrawn. The possibility that PACE will reject thelowest bid and revert to a manual vender selection process that mayinvolve best value criteria, rather than the lowest evaluated price cri-terion, encourages bidders to submit bids above the lowest bid.
DSCC has limited DIBBS auctions primarily to Federal Stock Classes2530 (vehicle brake, steering, and wheel parts) and 5961 (semicon-ductors and related equipment). In September and October 2000,two additional FSCs—4730 (fittings for hoses, pipes, tube, lubrica-tion, and railings) and 5930 (switches)—were included in the reverseauctions. DSCC stopped reverse auctions on these items because thecumulative demands on the computer systems were overtaxing thesystems. The FSCs were selected because DSCC thought that they hadpromise for reasonable returns from implementing auctions, thoughthey did not inform us of any specific studies that indicated theseFSCs would have abnormally high returns. Within theses FSCs, anyitem that meets the criteria for a PACE award is issued as an auctionsolicitation.
In October 2000, DSCC further modified its automated procurementsystem by implementing a fast award feature for purchases below$2500. In a fast purchase, bids are evaluated each day, and the first bidthat meets price reasonableness criteria is selected. Thus, the closingdate for the item is not fixed. Fast bids are not publicly displayed.
DIBBS auction data
The DIBBS auction data used in this analysis consist of the results ofthe sealed-bid and open-bid auctions conducted from inception in1999 through August 8, 2002. The sealed-bid data consist of 2,019contracts for 1,090 items totaling $11.0 million.17 The open-bid data
17. An item is defined by a National Stock Number (NSN). The value of theawards has been adjusted to January 2002 values using the Bureau ofLabor Statistics’ Producer Price Index (PPI) for all manufacturingindustries (Series PCUOMFG#). The number of auctions in our data setis fewer than the actual number conducted because we omit auctionsthat reverted to the manual selection process.
27

consist of 3,345 contracts for 2,413 different items, totaling $26.8 mil-lion in awards.18 In addition to price and quantity, each participatingvendor’s final bid and the date of that final bid are available. TheDIBBS data include not only the purchases made using reverse auc-tions, but also purchases made using conventional procurement prac-tices both before and after auctioning and the PACE awards madebefore auctions were implemented. These awards provide a valuabledata set for investigating the price effects of reverse auctioning.
Conventional procurements in the FSCs selected for auctionsoccurred when one of the criteria for an automated purchase did nothold. Thus, some NSNs would never be auctioned—critical safetyitems, for example. Some NSNs were purchased using either auc-tions, conventional procurements, or fast purchases, depending onthe circumstances of the purchase. Unfortunately, the data do notreveal the circumstances of the purchase. However, the only criteriathat would normally change for an item that was once auctionedwould be the priority of the item or the cost of the purchase. Thus, ifhigh-priority purchases include a price premium, comparisons ofconventional purchases with auction purchases would lead to an over-statement of auction savings. This would apply to both conventionalpurchases made once auctions were initiated and to conventionalpurchases made before the auctions were initiated because the pur-chases include an unknown mix of both high-priority and routinepurchases. However, PACE purchases before the implementation ofopen auctions applied the same criteria to the purchases that areapplied to the auction. Thus, comparisons of prices resulting fromPACE sealed-bid purchases and PACE open-bid auction purchasesprovide an estimate of the effect of using open auctions.
Table 3 provides summary statistics on the number and value ofDIBBS reverse auctions, both for sealed- and open-bid auctions.Sample sizes for both types of reverse auctions are relatively large,enabling statistical analysis. FSCs 4730 and 5930 have smaller auction
18. For this analysis, we omit 1,002 open-bid observations where the bidsdid not meet the PACE pricing algorithm and were awarded manually.This provides a comparable data set to the sealed-bid data, where we canonly tell whether the item was automatically awarded.
28
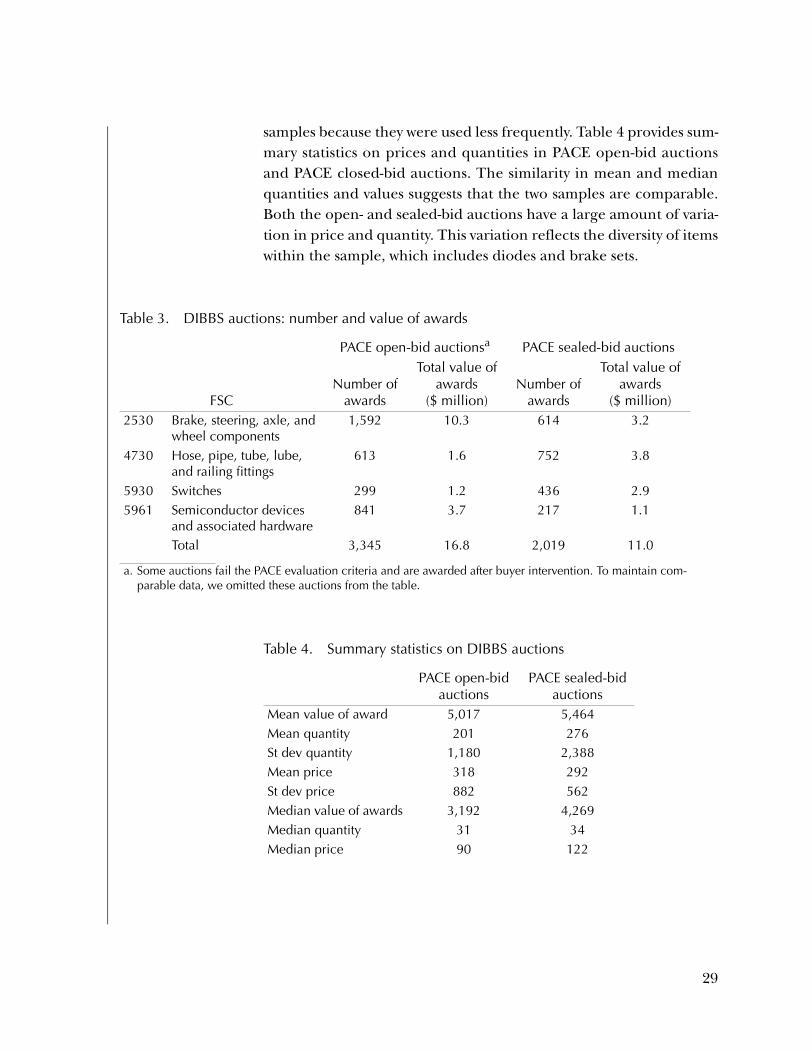
samples because they were used less frequently. Table 4 provides sum-mary statistics on prices and quantities in PACE open-bid auctionsand PACE closed-bid auctions. The similarity in mean and medianquantities and values suggests that the two samples are comparable.Both the open- and sealed-bid auctions have a large amount of varia-tion in price and quantity. This variation reflects the diversity of itemswithin the sample, which includes diodes and brake sets.
Table 3. DIBBS auctions: number and value of awards
PACE open-bid auctionsa
a. Some auctions fail the PACE evaluation criteria and are awarded after buyer intervention. To maintain com-parable data, we omitted these auctions from the table.
PACE sealed-bid auctions
FSCNumber of
awards
Total value of awards
($ million)Number of
awards
Total value of awards
($ million)2530 Brake, steering, axle, and
wheel components1,592 10.3 614 3.2
4730 Hose, pipe, tube, lube, and railing fittings
613 1.6 752 3.8
5930 Switches 299 1.2 436 2.95961 Semiconductor devices
and associated hardware841 3.7 217 1.1
Total 3,345 16.8 2,019 11.0
Table 4. Summary statistics on DIBBS auctions
PACE open-bid auctions
PACE sealed-bid auctions
Mean value of award 5,017 5,464Mean quantity 201 276St dev quantity 1,180 2,388Mean price 318 292St dev price 882 562Median value of awards 3,192 4,269Median quantity 31 34Median price 90 122
29

The auctions also vary widely in the number of vendors they attract.Table 5 gives a breakdown of the number of bidders that participatedin open-bid auction. The median number of bidders is 5 and the max-imum is 30.
Analysis of DIBBS auction results
DIBBS auction savings: simple comparisons
The DIBBS data reveal purchase prices through a sequence of pro-curement practices. A simple estimate of the savings compares theunit price received using one purchase practice with the last pricepaid under a different purchase practice for the same good. If theprocurement technique changed from one purchase to another, thechange in price provides a crude estimate of the effect of changingpractices. However, prices are quite volatile even without a change inpurchasing practices. Figure 1 illustrates the ratio of the price of anNSN to the previous purchase of that NSN for all NSNs in our datawith conventional purchases from 1996 until PACE was implemented
Table 5. Number of bidders in open-bid auctions
Number of bidders Number of open-bid PACE auctions1 2942 3703 3604 3755 3306 3097 2668 2289 20510 13711 12412 8113 6614 63
15 or more 137
30

in August 1999. For convenience, we convert the ratio to the naturallog of the ratio.19 If the price is constant, the log of the ratio is zero;if the newer price is lower than the earlier price, the log of the ratiois negative. The conventional purchases were made by a buyer whoshould apply a best-value criterion. These data do not distinguishbetween high-priority and routine purchases. We also note that thesehistograms do not control for quantities, which might have a signifi-cant effect on prices. Note that there is a wide spread in ratios. How-ever, the average of the log of the ratio is 0.0027, or an increase ofabout one-quarter of 1 percent above inflation.20
In figure 2, we present the distribution of the ratios of the price in thefirst PACE sealed-bid auction with the preceding conventional
19. We use the natural logarithm to make a doubling in price comparablegraphically to halving the price. A negative number in the graph indi-cates a decrease in price. For ratios near 1, the log of the ratio is roughlyequal to the percent change in price.
Figure 1. Histogram of log of ratio of prices in consecutive conventional purchases of the same NSN in selected FSCs, 1996–1999
20. We trimmed outliers for the histograms by omitting the largest 1 per-cent and smallest 1 percent of observations in each price ratio. We alsoinflated all prices to constant January 2002 dollars using the PPI.
Fra
ctio
n
log(conventional price/previous conventional price)−1.5 0 1.5
0
.1
.2
.3
.4
.5
31

purchase for that NSN. The distribution is somewhat different. Theweight of the distribution is below zero, with a median of -0.005. Thissuggests that the use of PACE, which is a rigorous first-price, sealed-bid auction, led to slightly lower prices. However, there are also alarge number of significant increases.
Similarly, DSCC transitioned from PACE awards, which are sealed-bidauctions, to open-bid reverse auctions for the given FSCs. The log ofthe ratio of the first open-bid auction price to the previous sealed-bidauction price is shown in figure 3. This distribution is much tighterthan the previous two, but it is still more heavily weighted toward thenegative side, with a mean of -0.057. This also suggests that open bid-ding was associated with an overall decrease in prices from sealed bid-ding. In both the sealed-bid and open-bid cases, however, priceincreased in numerous instances.21
Figure 2. Histogram of the log of the ratio of sealed-bid auction price to previous conventional purchase price of the same NSN in selected FSCs
21. Additional distributions of possible interest are provided in an appen-dix. In particular, we provide comparisons of the price from purchaseto purchase within a procurement practice. The interesting result is thatsealed bidding has the smallest variation in price changes between con-secutive purchases.
Fra
ctio
n
log(sealed−bid price/previous conventional price)−1.5 0 1.5
0
.1
.2
.3
.4
.5
32

Table 6 lists the number of observations, means, standard deviations,and medians for each of these distributions.
Open-bid auction savings relative to sealed-bid
The histograms in figures 1, 2, and 3 suggest that reverse auctions canreduce the purchase prices. However, the histograms fail to incorpo-rate several significant features of the purchase. In particular, they donot consider the quantity purchased, and they do not consider poten-tial price trends beyond the PPI. In addition, they do not consider thepotential effects of the price-reasonableness algorithm in determin-ing whether an item was a PACE or a manual purchase, and thus theeffects on the savings estimates. In this section, we ignore the poten-tial selection effects, and incorporate quantity and time trend effects
Figure 3. Histogram of the log of ratio of the open-bid auction price to previous sealed-bid auction price of the same NSN in selected FSCs
Table 6. Summary statistics of purchase-to-purchase price ratios
Log of Observations Mean SD MedianConventional/previous conventional 5942 .0027 .265 0.000Purchase first sealed-bid PACE/previous conven-tional
477 -.005 .272 -0.027
Open-bid PACE auction/sealed-bid PACE auction 600 -.059 .169 -0.029
Fra
ctio
n
log(open−bid auction price/previous sealed−bid auction price)−1.5 0 1.5
0
.1
.2
.3
.4
.5
33

by estimating an econometric model of how the purchase price isassociated with different auction mechanisms.
We estimate the effect of reverse auctions on prices by modeling priceas a function of the quantity purchased, the use of a reverse auction,and time (to control for time trends in price not captured by the PPI).Specifically, we estimate the equation
where is the real price of good i at time t, is the quantity of goodi purchased at time t, is a fixed effect for each NSN, is an indi-cator equal to one when a reverse auction was used for the purchaseand zero otherwise, is an indicator equal to one when a fastPACE procedure was used for the purchase and zero otherwise, and
is an error term. By using this log specification, the coefficient onthe reverse auction indicator can be interpreted as the percent pricechange resulting from a change in the variable. Using the fixed effectterm controls for the average price of each product. This assumesthat the quantity discount and the effect of time are the same on allprices.22
We estimate this equation on the sample of PACE purchases. Thisrestricts us to a sample of 2,668 different NSNs, covering 6,464 open-bid and sealed-bid auctions. We restrict the sample to these purchasesbecause it captures most completely the natural experiment. Theonly change in the procurement practice is that open bidding wasemployed in place of sealed bids. By restricting the choice to PACEpurchases, we omit data from both the PACE period and the auctionperiod where the item either did not qualify for PACE initially, or thebids did not satisfy the PACE post-bidding criteria. We can distinguishbetween the two in the open-bid auction data but not in the sealed-bid auction data.23
The results of estimating this equation are listed in column 1 oftable 7.24 The effect of switching from sealed bids to open bids was tolower prices by a statistically significant 3.8 percent. The regressionalso indicates that a 1-percent increase in the quantity purchaseddecreases the unit price by .2 percent. The time trend variables areinsignificant. This is not surprising because the model assumes that
pit( )ln β0 β1+ qit( ) β21RA β31FAST β4t β5t2 vi eit+ + + + + +ln=
pit qitvi 1RA
1FAST
eit
vi
34

the price trend is the same for the four FSCs in the sample. Becausethe FSCs represent very different classes of products, allowing pricetrends to vary within an FSC might be more reasonable. Column 2 oftable 7 presents estimates with a separate quadratic time trend foreach FSC. These time trends are significant for each of the FSCs. Theestimated effect of the reverse auction is to decrease prices by a statis-tically significant 4.4 percent.
22. This model incorporates quantity as an independent explanatory vari-able. Although quantity and price are endogenous in many settings,which would make the hypothesized model inappropriate, in the DIBBSenvironment, the quantity is exogenous. Two mechanisms generate thedecision to buy an item, and the quantity of that item. If the item is forDSCC stock, the decision is generated by an algorithm that incorporatesthe stocking level desired and the consumption rate, but not the cur-rent expected price.
If the item is for a specific customer, the customer provides the quantity.Several reasons make it unlikely that a DSCC customer’s choice of quan-tity is influenced by price. First, the quantity must be specified beforethe transaction price is known; thus, buying additional quantities givena low bid is not possible. Second, because the customer by definition isnot a buyer in the market—that is DSCC’s role—the customer may beunaware of market price movements. Third, the time it takes to com-plete an auction (from initial interest to purchase) is sufficiently longthat customers would not be able to take advantage of short-lived pricedrops. Fourth, the customer’s cost of having surplus inventory due toover-buying may be greater than the value of the marginal savings frombuying more when price is low. Fifth, because DSCC is a working-capital-fund activity, the price paid to DSCC by the customer is fixed for the cur-rent budget cycle, so the customer’s immediate price and budget do notbenefit from a lower auction price. Sixth, the risk of equipment down-time associated with delaying spare parts purchases until prices fall maybe greater than the value of marginal savings.
23. An alternative restriction is to limit the data only to those NSNs that hadboth a PACE sealed-bid and a PACE open-bid auction. This restricts thesample to 3,489 purchases in 933 NSNs. The results are very similar. Weuse the larger sample size because it utilizes more information on thequantity discount and time trends.
24. Again, the price data are inflated using the PPI to January 2002 dollars.
35

Open-bid auctions allow bidders to infer information from otherfirms’ bids. Thus, final bids are not based solely on the bidder’s pri-vate information, but also on information that other bidders have.This means that unusually low bids are less likely in open auctions—firms that would have made such a bid are likely to adjust their bidafter observing others bid. Further, an open-bid auction that appearslikely to go to an unusually high bid may draw additional interestfrom another firm. This suggests that the resulting open-auction win-ning bids should have a tighter distribution than those in sealed-bid
Table 7. Fixed-effects estimates of open-bid auctions, compared to sealed-bid auctionsa
(1) (2) (3) (4)Dependent variable logprice logprice logprice logprice
(adds FSC time trend)
(adds number of bidders terms)
(adds term for multiple auctions)
Ln(quantity) -0.197 -0.196 -0.194 -0.196(34.91)** (34.70)** (34.46)** (34.70)**
Open-bid auction indicator -0.038 -0.044 0.034 -0.045(3.90)** (4.33)** (1.91) (4.34)**
Award date 0.000 0.015 0.014 0.015(0.06) (4.17)** (3.93)** (4.20)**
Award date squared -0.000 -0.000 -0.000 -0.000(0.05) (4.19)** (3.94)** (4.22)**
Fast purchase -0.142 -0.137 -0.136 -0.137(10.11)** (9.70)** (9.64)** (9.68)**
Number of bids -0.019(4.66)**
Number of bids squared 0.001(3.30)**
Fifth or greater auction for NSN 0.025(0.74)
Constant 4.228 -4.680 -3.327 -5.639(0.37) (0.41) (0.29) (0.49)
Includes FSC specific time trendsb no yes yes yesNumber of observations 6,464 6,464 6,464 6,464Number of NSNs 2,668 2,668 2,668 2,668R-squared 0.27 0.28 0.29 0.28
a. Absolute value of t-statistics in parentheses. * Significant at 5 percent; ** Significant at 1 percentb. These coefficients are reported in the appendix.
36

auctions. The data support this observation. Figure 4 plots thesmoothed residuals of the estimation of column 2 above. The residu-als of the winning bid represent a relative deviation from an expectedprice given the auction mechanism, product, quantity, and date. Thesealed-bid auction data have a broader distribution than do the open-bid auction residuals.
Investigating potential sample selection issues
As we noted previously, the above estimated effect ignores potentialsample selection issues. Sample selection occurs when characteristicsthat might affect the outcome variable of interest are used to deter-mine whether an observation is included or excluded in a sample.The resulting problem is that the sample includes only observationswhere the results are likely to be higher or lower than would beexpected for a random observation.25 This difference in the selectionprocess can lead to an over- or under-estimate in the savings associ-ated with open-bid auctions. In this section, we investigate the poten-tial for selection bias problems. 26
25. Sample selection problems are common in econometric studies, andseveral techniques have been developed to address the problem. Themost prominent are the Heckman sample selection model and, morerecently, semiparametric sample selection models. However, thesemodels use an auxiliary regression of the probability of selection intothe sample. This requires variables that affect selection but not the out-come of interest. Unfortunately, such information that is exogenous toour model is unavailable. Thus, we approach the problem by examiningthe actual data.
26. If selection bias exists, theory does not indicate whether it leads to over-or under-estimates of the savings. We discuss the possible potential biaseffects in the appendix.
37

Possible selection bias source
DIBBS applies a selection process to determine whether an item is anautomated auction or a manual procurement—the procurement andbids must satisfy several criteria. The estimated open-bid auction effectis therefore the effect given that the criteria are met. The selection pro-cess only introduces a bias in the estimate if it affects the open- andsealed-bid auction samples differently. In other words, if the selectionrule resulted in a purchase in the open-bid auction period beingselected into the automated/manual sample the same as it would havebeen in the sealed-bid period, then a bias is not introduced.
We examined the reasons that items are selected out of the auto-mated procurement. During the open-auction period, we can sepa-rate the data into different groups:
• Purchases that were auctions. These are procurements whereall the criteria, both pre-bidding and post-bidding, for an auc-tion purchase were satisfied. In the open-auction period forthese FSCs, this is 3,345 procurements or 50 percent of theopen-auction period purchases. In the sealed-auction period,this is 2,019 procurements, or 34 percent of the purchases.
Figure 4. Distribution of residuals from the auction purchase model0
510
15D
ensi
ty
−1 −.5 0 .5 1Residuals from auction purchase model
Sealed auction period Open auction period
38

• Purchases that were not auction candidates. These are procure-ments where the initial criteria precluded an auction. Exam-ples are high-priority purchases and long-term contracts. Thesecriteria did not change when the purchases changed betweensealed- and open-bid auctions. These criteria do not introduceselection bias, because the selection is made exogenous to theprocess that determines the price. In the open-auction period,this is 1,984 procurements, or 29 percent of the open-auctionperiod purchases.
• Purchases that were auction candidates but became manualpurchases. These are the procurements where the bid orbidder criteria were not satisfied. Examples are that the lowbidder did not meet contractor responsibility criteria (and wasthus reviewed by a buyer), or that the low bid did not meet aprice reasonableness criterion. The second of these particularlyhas the potential to introduce selection bias. Ideally, we couldadjust the estimates to reflect this censoring. However, the cen-soring point moves over time in ways that are not directlyobservable by us. In the open-auction period, this is 795 pro-curements, or 12 percent of the open-auction period pur-chases.
The proportions of observations in these categories are provided intable 8. In addition, we have the proportions of observations from thesealed-bid period that are in parallel categories. About 50 percent ofthe open-auction period procurements were auctions, whereas about34 percent of the sealed- auction period procurements were auctions.
Table 8. Purchase mechanism by period
Open-auction period Sealed-auction periodNumber Percent Number Percent
PACE auction 3,345 50 PACE auction 2,019 34Initially auction, but converted to manual
795 12 Manual (either converted during Auction, or not candidate)
3,059 56
Not auction candidate 1,984 29
Fast purchases 578 9 Fast purchases 522 10
39

These numbers only indicate that the auction/manual mix was some-what different between these two time regimes. In itself, it presentslittle evidence that selection bias is a problem.
Examining the data for selection bias
To examine whether the excluded purchases changed significantlybetween the open- and sealed-auction periods, we examine the resid-uals from a regression of the excluded purchases. We obtain the resid-uals from the regression
where the summation is taken over the four different FSCs in the sam-ple, and is an indicator that the NSN for purchase i belongsto the FSC j. This regression assumes that the underlying price distri-bution of the manual purchases in the sealed- and open-auction peri-ods is the same, given the quantity, time-trend effects, and products.We note that two FSCs had very short open-auction periods, and thenreverted to sealed auctions. This results in time trends that do notproxy the effects of switching auction types. This regression is similarto the regression used for column 2 of table 7. The difference is thatin this regression, we only use the subsample of manual purchases,and we omit the explanatory variable for open auctions.
After controlling for these effects in a regression of the manual pur-chases during the sealed- and open-auction periods, we examine theresiduals by the different types of auctions that would have been usedif the purchase had qualified for an auction purchase. If the residualsof the open-auction period are different from those of the sealed-auc-tion period, it would suggest that the process that led to manual pur-chases during the open-auction period affected the purchasesdifferently than did the process in the sealed-auction period, and aselection bias was introduced. Conversely, if the residuals are similar,it is less likely that such a bias was introduced.
We present several alternatives to evaluate the data for selection bias:
pit( )ln β0 β1+ qit( ) β2t β3t2 Σj γj1FSCi j=t( ) δj1FSCi j=
t2+
vi eit+ + + + +ln=
1FSCi j=
40
• Graphical evidence. Obvious differences in the distributionscan be observed by simple examination of the distribution ofthe errors. We present the distribution using histograms infigure 5.27 The histograms are similar but not identical. Theopen-auction period manual purchases have a higher peak inthe density near zero. An alternative visual representation is anon-parametrically smoothed plot of the density, presented infigure 6. This shows the densities of the residuals from the twoperiods in a single plot. These plots suggest that the subsamplesare similar but not identical. They do not indicate whether theobserved differences are due to random variation or funda-mental differences.
• Statistical tests of the distributions.
— A test of the equality of the medians of the two subsamplesis one approach. The test statistic on the trimmed data hasa p-value of .907. Without trimming, the test statistic has ap-value of .768.28 The median test suggests that the subsam-ples were drawn from distributions with the same median.A t-test of the equality of the means on the trimmed data hasa test statistic of 1.9374, which has a p-value of .0527. Thisrejects equality but not at a stringent significance level. Theuntrimmed data test statistic is .8042, which has a p-value of.4213, and thus does not reject equality.
— The Wilcoxon rank-sum test of whether the two samples arefrom the same distribution is an alternative approach. Thistest statistic also does not reject the hypothesis that the sam-ples are from the same distribution; the p-value of the teststatistic is .6306. Without trimming, the Wilcoxon rank-sumtest has a p-value of .8495. This test evaluates only whethera disproportionate number of the observations from a
27. These plots trim residuals with absolute value greater than 1, reducingthe sample size from 5,837 to 5,772 observations. We trim the residualsto improve the visibility of the plots in the area where the data are con-centrated.
28. Trimming reduces the variance of the residuals, thus providing strictertests of equality.
41

Figure 5. Comparison of residuals from the manual purchase model in open- and sealed-auc-tion periods
Figure 6. Smoothed density plot of residuals from the manual purchase model
05
00
10
00
−1 −.5 0 .5 1 −1 −.5 0 .5 1
Open auction period Sealed auction period
Fre
qu
en
cy
Residuals from manual purchase model
01
23
45
Den
sity
−1 −.5 0 .5 1Residuals from manual purchase model
Sealed auction period Open auction period
42

subsample are larger than the other sample; the magnitudeof a difference does not influence the test.
— A Kolmogorov-Smirnov test of equality of distributions hasa p-value of .232. Without trimming, the Kolmogorov-Smirnov test has a p-value of .347. Thus, the Kolmogorov-Smirnov test does not reject the hypothesis that the distribu-tions are the same. This test is based on the maximum of thedifferences between the two distribution functions; it ispowerful against “lumpiness” or “clustering” of the data,but not against tails [25].
— Finally, in 1996 Li proposed a test of the closeness of the dis-tributions of samples drawn from two unknown distributionfunctions [26]. The test is essentially the normalized squareof the area between two smoothed distribution curves, suchas those in figure 6. Thus, it incorporates both how oftenthe curves differ and how big this difference is. The Li testrejects the hypothesis of equal distributions.29 Given oursample size (about 3,000 observations for both subsam-ples), it may be that we find statistical significance, thoughthe differences are not economically significant. With largesample sizes, the differences at the peak and in the neigh-borhoods of .1 and -.1 might lead to a conclusion that thedistributions differ, though the amount of the differencemight be inconsequential.30
Nevertheless, the rejection suggests caution should be usedin interpreting the estimated savings from open-bid auc-tions, because of the possibility of sample selection bias.
29. The test statistic is 6.1, which rejects the hypothesis of same distributionsat the .01 significance level.
30. This would be analogous to saying that an item priced at $100.01 ismore than an item priced at $100.00. We can say with certainty that theformer is more expensive, but that the magnitude is inconsequential.
43

DIBBS auction savings: number of bidders effects
The results in columns 1 and 2 of table 7 represent the average out-comes for the open-bid reverse auctions. However, the number of bid-ders may affect the degree of price competition and thus influencethe price dynamics in the auction, particularly in DIBBS auctionswhere there is no minimum number of bidders and bidders canincrease their prices later. To investigate these effects, we include thenumber of bidders and the number of bidders squared in the regres-sion. We include the quadratic term because the effect of an addi-tional bidder is likely to decrease as the number of bidders increases.(For example, significant price reductions might be associated withgoing from 1 to 2 bidders, but little change might be associated withgoing from 10 to 11 bidders.)31
Column 3 lists the results of the regression with the number of bid-ders included. The coefficient on the number of bids is negative andsignificant, whereas the coefficient on the number of bids squared ispositive and significant, while the coefficient on the indicator for auc-tions is positive. The coefficients imply that an auction with only onebidder will result in an increase of about 1.7 percent from the pricein a sealed-bid auction. This result may be biased because the PACEprogram applies a price reasonableness criterion to the bids. In fact,
31. In general, the equilibrium number of bidders can be influenced by theauction format. In particular, if it's true that the expected price is lowerin open-bid auctions (for the same number of bidders), this meansexpected profit is lower in open-bid auctions. If we allow the number ofbidders to adjust, we'd expect more bidders under the sealed-bid format(enough to achieve equality in expected prices between the two auctionformats).
Our analysis assumes the number of bidders is exogenous. (Because wedo not observe the number of bidders in the sealed-bid DIBBS auctions,we are unable to test this assumption empirically.) In the DIBBS con-text, the bidders never know the exact number of other bidders in anygiven auction (sealed or open). Instead, it is likely they know thenumber of potential competitors in the marketplace and may reason-ably assume they will all be potential bidders, regardless of the auctionformat, especially because the cost to participate is almost negligible.
44

42 percent of the auctions with one bidder failed the PACE screening.Thus, the price increase in an open-bid auction is likely to be morethan the model estimates. Adding a second bidder suggests that theprice is about the same as in a sealed-bid auction, and additional bid-ders lead to reduced prices. At five bidders (the median number ofbidders), savings are about 4.1 percent. The coefficients imply thatsavings continue to increase through 13 bidders and then begin todecline, but because we have relatively few auctions with more than12 bidders and we use a quadratic specification, the predicted effectof very large numbers of bidders is unreliable. These results suggestthat reverse auctions are best applied when the auction will generatea fair amount of interest from potential suppliers.
Other effects of DIBBS auctions
Effect on competition and supplier base
One frequently cited concern is that auctions might provide savingsin the short run as firms compete for business, but that the competi-tion could lead to a reduced supplier base, and ultimately to higherprices as competition wanes. To investigate this possibility, weincluded an indicator variable for open-bid auctions for NSNs thathad five or more open-bid auctions. The result is in column 4 oftable 7.
This variable was insignificant. This means that the repeated auctionhad not caused prices to increase. Our data cover only about 2 yearsof open-bid auctions, so if the shakeout effects take longer than2 years, we would not see them.
Sealed-bid auction savings relative to conventional purchase
In addition to the effect of moving from sealed bids to open bids, wecan indirectly estimate the effect of moving from conventional pur-chases to sealed-bid auctions. Our estimate of the effect of the open-bid auction relative to the sealed-bid auction relies on open- andsealed-bid period samples that have roughly the same selection crite-ria. We cannot create a set of conventional purchases prior to theintroduction of the PACE program as a control group. The problemis that there is nothing in the data to indicate which purchases prior
45

to PACE introduction would have passed the PACE criteria, and thuswould have allowed a comparison.
Instead, we infer the sealed-bid effect using a regression that includesthe entire data set—conventional, sealed-bid, and open-bid pur-chases. Table 9 provides the key results from this pooled regression.The regression indicates that the average purchase price, controllingfor quantity and time trends, during the sealed-auction period wasabout .4 percent lower than before PACE was introduced. Note thatthis average includes both the auction purchases and those that didnot meet the PACE criteria, for example high-priority or critical safetyitems. The regression also indicates that the average purchase priceduring the sealed-auction period was about 3 percent below theprices realized before PACE.
Assuming that these differences were due to the use of the sealed- andopen-bid auctions on a subset of purchases, and that the other pur-chases (after controlling for quantity, item, and time trends) had thesame prices, we can infer an overall effect. During the sealed-bidperiod, 34 percent of the purchases were auction purchases. To havea .4 percent effect on the average sealed-bid period price requires thesubsample of sealed-bid purchases to have a 1.2-percent effect. Thatis, if 34 percent of the purchase prices fell by 1.2 percent, the effecton the average prices would be .4 percent. Similarly, during the open-bid period, 49 percent of the purchases were auction purchases. A3.1-percent average decline during the period requires a 6.3-percentdecline in the auction subsample. Note that the difference between
Table 9. Regression results, pooling manual and automated purchasesa
a. Regression includes time, time-squared, and FSC-specific time trends.
Dependent variable ln(price)ln(quantity) -0.160
(77.54)**Sealed-bid auction period -0.004
(0.37)Open-bid auction period -0.031
(2.45)**
46

the sealed- and open-period purchases is 5.1 percent, which is reason-ably close to the 4.4 percent we estimated directly.
A sealed-bid auction effect of 1.2 percent is relatively small. This islikely because the conventional purchase process is very similar to asealed-bid auction. In a conventional purchase, vendors submit bids,which are then evaluated on the basis of price and other factors. Ifprice is the dominant factor (as it likely is in the commodity purchasesin this sample), a modest sealed-bid effect is to be expected.
DIBBS results and theory
The DIBBS auction data provide an excellent natural experiment toevaluate the effects of changing from a sealed-bid, first-price auctionto an open-bid, first-price auction. Controlling for time trends, quan-tity, and specific items, the data indicate that the prices are reducedon average by 4.4 percent when an open-bid auction is used.
Recall that in a symmetric, affiliated-values environment, the auction-eer will be better off with an open-bid auction than a sealed-bid auc-tion. If this describes the procurement environment, then the resultsupports theory. We cannot say with certainty what the environmentis. It seems likely that the valuations of the goods are affiliated—thereare likely both private and common values aspects. For example, thecost of producing the auctioned item depends in part on possiblyunforeseen technical difficulties that are the same for all bidders, anduncertain input prices that all bidders would incur. However, eachvendor may face idiosyncrasies that are not common but arerelated—local labor market conditions, for example—that inject pri-vate- and affiliated-values features. Thus, we could argue that the auc-tion results match perfectly with theory on expected revenue inauctions.
In this environment, the data also support the theory on the numberof bidders—that an additional bidder provides an advantage to theauctioneer.
At the same time, one could argue that the environment is an asym-metric environment because the vendors might be fundamentally
47

different. The incumbent supplier may hold an advantage, or the ven-dors may have adopted different technologies that give them differ-ent valuations of winning the contract. If this is the case, the resultswill either support or reject the theory depending on the nature ofthe asymmetry. We cannot determine the nature of the asymmetry (ifany) among the firms. Further, as we see in figure 3, the variation inthe ratio of prices when changing from sealed- to open-bid auctionsis significant. This variation could be due to randomness, or it couldbe due to differences in the nature of the symmetries and asymme-tries in the bidders.
48

Navy and Army auctions
The Navy and Army each began using reverse auctions in 2000, andhave some experience with auctions. The approaches of the two orga-nizations were similar. They contracted with auction services provid-ers and then allowed customer organizations to use the providers topurchase goods or services. This section describes the services’ expe-rience with auctions. We discuss the Army and Navy auction data,including concerns with the suitability of the data.
Navy auctions
History
The Department of the Navy conducted the first on-line reverse auc-tion in the federal government on May 5, 2000, when it began a five-auction pilot project. The pilot project was conducted by Naval Inven-tory Control Point (NAVICP) Philadelphia between May and Septem-ber 2000, and consisted of auctions for ejection-seat recoverysequencers, shipboard berthing, aircraft engine blades, MRI services,and CVN camels. These auctions were designed to test auctions as aprice negotiation mechanism for source selection criteria and prod-ucts, as shown in table 10. These on-line auctions were conductedusing the services of Freemarkets, Inc., a commercial provider of on-line auction services.
Table 10. NAVICP Reverse Auction pilot project
Item Evaluation criteria Item typeEjection seat components Price only Engineered itemShipboard berthing Technically acceptable
low priceEngineered item
Aircraft engine blades Price only Engineered itemMobile MRI services Best value ServiceCVN camels Best value Engineered item
49

Following the pilot project, NAVICP implemented two contracts forreverse auction services. A contract with Procuri.com uses a “desktop”self-service approach—the buyer (or NAVICP) runs the auction, pro-viding bidder accounts and passwords, establishing and disseminat-ing auction rules and timing, and running the software itself. NAVICPallows the Navy and Marine Corps to use the contract for free andcharges a nominal fee to non-DoN government agencies, though onlythe Air Force and the Coast Guard have used it.32 The other contrac-tor, eBreviate, provides a full-service hosted auction, even offering toprovide sourcing and market research. The desktop approach hasbeen used frequently for both small and large value auctions; the full-service approach has been used less often, and mostly for larger valueauctions.
Navy auctions have covered a wide variety of products and services,including commodity products such as refrigerators, coveralls, andpotatos; services such as drydock repairs and couriers; and equip-ment manufactured to Navy specifications, such as FLIR containersand components, E2C wheels, CVN camels, shipboard berthing, andFA–18 engines. The successful use of auctions for items that are notgenerally considered commercial off the shelf (COTS) is of particularinterest. These auctions demonstrate that a well-established marketfor an item is not a requirement for a successful auction. Rather, theprimary requirement is that the item being procured can be fullydescribed through a set of specifications.
Most of the reverse auctions have been conducted for Navy andUSMC organizations, though the Veteran’s Administration, DefenseSupply Center Philadelphia, and Air Force have also used the ser-vices. NAVICP’s summary of the Navy’s auction activity is presented infigures 7 and 8. Both NAVICP and the Fleet and Industrial SupplyCenters (FISCs) used auctions for more purchases in FY 2002 than inFY 2001. The value of NAVICP purchases decreased although a largeshare of the value of its purchases in FY 2001 were for non-NAVICPcustomers. The value of non-Navy buys in FY 2001 was inflated by two
32. The fees are dependent on the auction provider and the level of sup-port used. NAVSUP publishes the fees on the Web at http://www.auc-tions.navy.mil/order/index.html#fees.
50

very large purchases—a $21-million frozen potato auction and an$11-million coverall auction.
Procedures
Navy auctions employ the standard rules for commercial on-linereverse auctions. Typically, bidders are required to pre-qualify bydemonstrating that they are technically capable of providing the spec-ified item. Bidders are given password access to the website where theauction will be conducted. The auctions are conducted over theInternet, with a specified start and completion time, often one hour.However, to allow bidders to respond to late bids, the auction is
Figure 7. Navy auction activity—number of auctions
Figure 8. Navy auction activity—value of purchases
05
101520253035404550
FY 01 FY02
Nu
mb
er o
f au
ctio
ns
NAVICP FISC Non-Navy
-
10
20
30
40
50
60
FY 01 FY02
$ (
Mill
ion
s)
NAVICP FISC Non-Navy
51

usually automatically extended for a short period of time (for exam-ple, 5 minutes) if a bid is received within a window of the closing time.A minimum-bid increment, usually a share of the expected value ofthe purchase, is imposed on the bidders. Upon completion of bid-ding, a contracting officer reviews the final bids and determines whowill be awarded the contract. The contracting officer can apply a best-value criterion, although usually the lowest-priced, technically-accept-able criterion is used.
Auction data limitations
Difficulty: uncertain reference prices
Determining precise measures of savings from reverse auctions is dif-ficult, because no counterfactual exists to specify the cost of the itemsif a different pricing mechanism were used. One approach is to usethe independent government estimate (IGE) as the reference price.The IGE can be developed through previous purchases or marketresearch. However, in some cases, there are few previous purchases toinform the government estimate, or the available reference prices arefrom infrequent purchases or significantly modified items. This isparticularly true when the item has unique features. Further, marketresearch can result in inaccurate prices, for example, if the estimateis based on list prices that do not reflect discounts that are oftenincorporated into the final purchase price.33 When interviewing thebuyers to obtain information on the reverse auctions, we were toldthat some buyers put very little effort into determining the IGE, andthat it would be misleading to base savings estimates on the IGE.Another interviewee indicated that the IGE is often provided by therequesting activity, but that the contracting activity determines itsown IGE because its experience indicates that the requesting activity’sIGE is often inaccurate. Others have asserted that the IGE is a reason-able estimate, based on validated models.34
33. Car pricing provides a common example. Comparing purchase price tolist price would suggest that most car purchases are made with signifi-cant savings, although the actual price could be close to the average.
34. Although we have inquired, we have not learned of any studies thatreflect the accuracy of the IGE in conventional procurements.
52

Table 11 lists data from two auctions for similar items—submarinecamels and CVN camels. These data provide an example of the diffi-culties involved in using the IGE as a reference price. The IGE forCVN camels is substantially more than the transaction price, whereasthe IGE for submarine camels is very close to the actual transactionprice. There are a number of possible reasons for the difference. Per-haps the IGE is a valid reference price in both cases, but the differentproducts and competition in those particular cases simply had differ-ent results.
Another possibility is that, in this case, the IGE was an unreliable esti-mate. The CVN camels were a new item, never before procured, andthe submarine camels were an item that had been purchased previ-ously. Thus, there may have been insufficient information to form agood IGE for CVN camels.
The question we want to answer, however, is what would the transac-tion price have been if a reverse auction hadn’t been used? If the IGEis inaccurate and a price much closer to the transaction price wouldhave been obtained, then the inaccuracies in the IGE are providing afalse picture of the savings. We do not know how many of the itemsprocured by auctions had valid IGEs.
Another possibility is that the IGE for recent purchases incorporatesauction effects, so that the IGE for the submarine camel is closer tothe auction price. This would make them more accurate relative tothe transaction price, but they could be less accurate as a counterfac-tual price that would have been received had the item been procuredusing conventional practices.
Although some IGEs may be inaccurate, this does not mean that allIGEs are inaccurate, but it does suggest that they are not always theideal means for estimating the savings from auctions.
Table 11. Government-estimate and reverse-auction price example
Item Year IGE Price SavingsCVN camels (pilot program) 2000 $36,666,667 $26,766,667 27.0%Sub camels 2002 $225,000 $211,000 6.2%
53

An alternative basis is to compare the final price in the auction withthe initial bid in the auction. However, this approach also has signifi-cant drawbacks. In particular, the initial bid during the auction is sub-ject to strategic behavior by the bidder. Some bidders may initially bidan artificially high price, hoping to reap windfall profits. Because thecost of bidding down is almost zero in these auctions, there is noreason not to make an initial bid that is well above the minimum pricethe vendor would offer. Thus, the initial bid can be well above the bidthat the vendor might have submitted under a conventional procure-ment.
Another alternative is to use the price the vendor submitted in theauction qualifying proposal. However, these bids could be subject tostrategic bidding. In particular, a bidder might inflate the pre-auctionprice proposal, hoping to reap large profits if no other firm com-petes. During the auction, the bidder could drop prices dramatically.If all bidders used this strategy, the pre-auction proposal price wouldoverstate the savings. The auctioneer’s option to award the contractbased on the pre-auction price proposals may limit this behavior.35 Atthe same time, the threat of an auction might cause bidders to ini-tially propose their lowest bid, even below the bid that they wouldhave submitted under a traditional purchase. Thus, it is possible thatthe initial proposals are lower than the price that would have resultedhad a nonauction procurement been used. The pre-auction priceproposal is thus an unreliable reference price.
Difficulty: conflicting data
In addition to having several potential baselines of questionable valid-ity, some of the data that we received were conflicting or inconsistent.This may reflect the uncertainty in what should be used as the
35. If one firm makes a pre-auction proposal that is so much better than theothers, the auctioneer might determine that the other firms wereunlikely to match this proposal price, and not hold the auction. Thus,an unconstrained initial proposal could cost the firm the opportunity tocompete.
Several Navy auctions were cancelled because the bids in the initial pro-posal were considered so good that an auction was not worthwhile.
54
estimate basis, and the changes in the procurement or estimates thatcan occur during the pre-auction process. For example, the quantityof an item can change prior to the auction, and estimates can beupdated to reflect these changes. Estimates can also change to reflectadditional information. These estimates provide several opportuni-ties for conflicting information to be reported.
We received data from several sources: the NAVICP auctions office, theNAVSUP auction program manager, and the Naval Audit Service.36 Wealso received data from several buyers who were connected with indi-vidual auctions. Some of these data were in conflict between differentsources or were internally inconsistent. The Naval Audit Service reportfocused extensively on trying to document the estimates and contractprices. It found supporting documentation for the savings for 14 of 45Navy reverse auctions, and 20 of 20 Marine Corps auctions.
Some of the data, particularly that which is more recent, appears tobe reliable, as documentation processes are developed. We are lessconfident about some of the earlier data, however. Perhaps the mostcomplex example was the first auction after the pilot study. We havethe following information on this auction for personal computers:
• The initial data we received indicated that the IGE was $1 mil-lion, that the cost avoidance was $287,000, and that the costavoidance was 21 percent. The data included an annotationthat the savings were based on a purchase 3 months prior. Obvi-ously, this information is not consistent—$287,000 of$1 million is a savings of 28.7 percent, so we sought additionalinformation.
• We received an updated spreadsheet reporting the same IGEand a purchase price of $713,000 (or $1 million less $287,000)but correcting the percentage savings to 29 percent.
• We learned that the auction record had a starting price of$1.25 million, which we were told is usually the governmentestimate. The final purchase price in the record was $983,000,for savings of $267,000, or 21 percent. The estimate may have
36. The Naval Audit Service documents their findings and recommenda-tions in [27].
55

been updated to reflect new information, or the intent mayhave been to use the initial price as the basis for savings. It alsomay be that the initially reported savings of $287,000 was a typo-graphical error.
• The buyer involved indicated that the estimate was based onpurchasing 1,000 units, but that the final purchase price was fora purchase of 1,300 units.
• The Navy auction website reports on reverse auctions for com-puters on two pages. One cites 18-percent savings, the other29 percent.37
• The Naval Audit Service reports that the documented govern-ment estimate is $1,292,860, and a supported contract award of$1,277,900, which is a savings of about 1.1 percent.
This example is the most confusing one that we found. However,there are other examples of conflicting data as well. Determining theappropriate values among the conflicting data is a difficult task, as theNaval Audit Service reported. Even if the data were documented, theIGE presents problems as a valid reference point.
Auction data summaries
Naval Audit Service supported results
We are not confident that the estimated price is a valid referencepoint and that it has been accurately reported. Given this caveat, weprovide the following summaries of the data. We focus on the relativesavings between different characteristics of the auctions. If the dataare of the same quality in all auctions, then the differences might bemore meaningful than the estimated savings.
The Naval Audit Service report provides supported cost estimates andcontract awards for a total of 39 auctions. Of these, 19 were Navy auc-tions where the cost estimate is the IGE. The 20 Marine Corps auctionsused a “market estimate” that could have been an Internet quote. TheAudit Service report is unclear whether the quote was specific to thepurchase or was a catalog price obtained through the Internet.
37. http://www.auctions.navy.mil/news/successstories.html and http://www.auctions.navy.mil/news/results.html both accessed 12/20/02.
56

The savings relative to these reference prices are shown in figure 9.The USN auctions were for a variety of products, including equip-ment, services, and commodities such as lumber and cables, andranged in size from IGEs of $27,000 to almost $5 million. The USMCauctions tended to be smaller, and were typically for appliances, fur-niture, and large office products.
Figure 9 indicates that costs rarely exceeded the estimates. The sav-ings, weighted by the size of the IGE, from the reference price was 26percent; the simple average of savings was 17 percent. Given theselimited data, there is no pronounced trend in savings—the largestsavings were realized in auctions with IGEs of $5 million, $1 million,$65,000, and $37,000. Further, the lowest savings are not concen-trated at lower or higher IGEs (two of the four negative observationsare in the lower range, but two-thirds of the observations are in thelower range, so this is not disproportionate). This suggests that auc-tions generate interest for both large and small items.
The types of items procured through the auctions and savings vary.We classified the items into three categories—services, commodities,
Figure 9. Navy and Marine Corps auction savings by IGE (Naval Audit Service “supported” only)
-80
-60
-40
-20
0
20
40
60
80
10,000 100,000 1,000,000 10,000,000
IGE ($ logarthmic scale)
Per
cen
t sa
vin
gs
USN auctions USMC auctions
57

and engineered items—and calculated the savings by the differenttypes. Figure 10 presents both the weighted and unweighted savings.These should be interpreted with caution, because the auctiondescription is very brief and thus the classifications are subject toerror and the number of observations is relatively small.38
Interestingly, the lowest weighted savings were observed in commod-ity purchases, where the majority of the purchases were made. Thismight be due to differences in the way the reference price was formed(20 of the 29 commodity purchases were USMC purchases, and theMarine Corps used a different process to develop a reference price).This might also reflect the difficulties of developing a reference pricefor “unique” engineered items or services that are provided accord-ing to specifications in the procurement itself. If the IGE representsthe price that would have been obtained through conventional nego-tiations, these results may also indicate that creating a market forunique items generates significant savings.
Figure 10. Navy and Marine Corps auction weighted and unweighted average savings by type of item (Naval Audit Service “supported” auction results only)
38. For example, we classified the largest single auction, for solenoid valves,as an engineered item, on the assumption that an IGE of $5 million forvalves would involve specifically designed items. It may also have been avery large quantity purchase for a commodity solenoid valve. Becausethis purchase had 50-percent savings, it significantly affects the results.
05
10
15202530
3540
Commodity (28observations)
Engineered (8observations)
Services (3observations)
Per
cen
t
Weighted average Average
58

The differences between the weighted and unweighted savings indi-cate the role of a few large purchases. In particular, the engineereditem procurements had a very wide range of savings: Included in thesample was a $5-million IGE purchase with 50-percent savings, andtwo $30,000 IGE purchases with negative savings of 30 and 60 per-cent. The weighted average commodity savings were reduced by a$1.3-million PC purchase that had only 1-percent savings. The vari-ance further suggests that caution should be exercised in interpretingthese data. Figure 11 graphs the auction results by the type of pur-chase, and illustrates the variation in results by the type. 39
Army auctions
History
At the same time that the Navy was initiating reverse auctions, theArmy’s Communications—Electronics Command (CECOM) Elec-tronic Reverse Auctioning Project Team was initiating an Army pro-gram. The first Army auction was conducted on May 17, 2000, for asecure fax machine. Table 12 provides summary data on CECOM’sauctions. CECOM has contracted with Frictionless, a commercial auc-tion provider, to conduct its reverse auctions.
The Army auctions have been used for a less diverse set of items thanis the case for Navy and Marine Corps auctions. Most have been forcommodity-type items—the majority of CECOM’s auctions have beenfor electronic products, though they have also been used for house-hold appliances, contract closeout services, and goats. Several Armycommands, the Marine Corps, and the Air Force have used theCECOM services.
39. We also examined the data that the Audit Service was not able to verify.The results are similar to verified data. The only qualitative differencesare that in the unverified data, a higher portion of the engineered itemauctions realized savings, and there are some commodity purchaseswith negative savings.
59

Figure 11. Auction results by item type
Table 12. Army auction summary
Type of goodNumber of auctions Value of auctions
Computer 22 $19,851,127Other commodities 24 $7,147,242Services 2 $12,450
Total 46 $27,010,819
Commodities
-75-60-45-30-15
01530456075
Per
cen
t sa
vin
gs
Engineered
-75-60-45-30-15
01530456075
Per
cen
t sa
vin
gs
Services
-75
-60
-45
-30
-15
0
15
30
45
60
75
Per
cen
t sa
vin
gs
60

Simple analysis of data
The Army data include information on the estimated or beginningunit price, the actual outcome, the number of units and the numberof vendors in the auction. Using the Army data, we derived the twoestimates of savings that are provided in table 13. The first column isthe simple average of savings in each auction. The second column isthe average savings weighted by the total amount of the buy. We donot know how the baseline cost was determined in these auctions, sothe cautions concerning counterfactuals from the previous sectionalso apply here as well.
The difference in the weighted and unweighted savings averages forcomputers suggests that the savings increase as the quantitiesincrease. This could be an effect unique to the auctions, or it couldbe a quantity discount effect. Because we do not know how the base-line was established, we cannot separate these effects. Both theweighted and simple average savings are substantial.
The data also include the number of vendors bidding. The numberof vendors can indicate the level of competition, which affects the sav-ings. Figure 12 shows the savings by number of vendors. To help inter-pret these data, we provide the number of observations for eachcategory in table 14. There does not appear to be any clear pattern ofsavings as a function of the number of bidders in the auction. How-ever, note that the sample size for each of the groups is very small. Asa whole, the Army savings are fairly significant, even exceeding thesavings reported in the private sector. However, the number of obser-vations suggests caution in applying this result widely. The breadth of
Table 13. Percent savings in Army auctions
Item Simple average Weighted averageComputers 25 35Other commodities 24 25Services 62 64
Total 26 32
61

items purchased is limited, and we have not closely examinedwhether the comparison price is valid as a counterfactual.
Figure 12. Weighted average savings by number of bidders, Army auctions
Table 14. Number of bidders in auctions
Number of bidders Number of auctionsComputers Other commodities
2 1 43 4 34 6 35 4 56 3 37 18 29 3 114 116 122 1
0%5%
10%15%20%25%30%35%40%45%50%
2 3 4 5 6 7 8 9 10 11 12 13 14 15 16 22
Computers Other commodities
62

Why do DIBBS results and Service auction results differ?
The Army and Navy auction data indicate that auctions result inmuch higher savings than do the DIBBS data. This raises issues aboutwhy the differences exist and which type of data provides a more accu-rate projection of the potential for reverse auctions.
The data may differ for a number of reasons including selection bias,different product types, and different auction rules.
Selection bias
As previously noted, selection bias occurs when the observed data donot represent the entire population. In DIBBS data, this might be thecase if the FSCs that were selected for open auctions are special. Infact, DSCC selected those FSCs because it believed they thought thatauctions for those items might generate savings, though they had notformally studied the decision of which FSCs. However, once the FSCwas selected, all NSNs were subject to auctions, regardless of the spe-cifics of the items’ markets. The combination of a variety of FSCs anda uniform application of auctions once selected probably limits selec-tion bias in DIBBS data. Further, our regression is conducted basedsolely on items that met exactly the same criteria that were used forautomated procurement.
However, Navy and Army auction data might be more subject to selec-tion bias. In particular, Navy and Army auctions were the result ofdeliberate decisions to choose an auction. The buyers could chooseitems that were likely to be successfully auctioned. This might be duein part to the costs of conducting the reverse auctions. In some casesfees were charged, and in almost all cases there were additionaladministrative burdens imposed by using a procurement that was notthe familiar method. To adopt a new method required some compel-ling reason, one of which could be the possibility of high savings.Also, some of the auctions were for unusually large purchases, such aslarge lots of computers. Thus, the Navy and Army auction record todate might represent the “low-hanging” fruit, and savings from morewidespread use of auctions might not be as high.
63
Product differences
A significant number of Navy and Army auctions were for items thatdid not fit the definition of commodities. Even computers, which canbe bought off the shelf, are often customized to meet the specifica-tions of the customers. In other cases, the items were engineered (theCVN camels, for example). These products may have had limitedprice competition before the reverse auction. If the previous purchas-ing mechanism involved negotiating on both price and quality, thenthe vendors’ offers may have been more conservative, because theysought to convince the purchaser that they were providing a uniqueservice or value. Thus, they may not have competed on the basis ofprice. Because the reverse auction may have led to more detailedspecifications, and focused the competition on pricing, additionalcompetition and savings might have been realized. To the extent thatmore widespread use of auctions in the DoN would have the sameeffect, this would not bias the results. Rather, it would be an indicatorthat auctions actually have a relatively high return in the DoN.
In contrast, DIBBS auctions were for commodities, for which pricecompetition may have already occurred. In particular, because thecomparison group is the open-auction items, the “conventional” pur-chase was essentially a sealed-bid, first-price auction. Thus introduc-ing the auction may have had a smaller impact.
Further, there may be differences in the environments associated withthe different products. In particular, DIBBS items may be closer tothe private- values environment than are items in the Navy auctions.Frequently produced items might be private values because lessuncertainty is involved than there is when the item is unique or rarelyproduced. Thus, because several of the Navy auctions were for engi-neered items, the price change associated with a change from con-ventional procurement—which may be more like a sealed-bid, first-price auction to the open-bid auction—might be more pronounced.
Auction rules
DIBBS auction rules may have reduced the price competitioninduced by the open auction. In particular, a fixed-auction periodand the ability to increase and withdraw bids could have significant
64

impacts. By submitting a bid at the last possible moment, a vendorcould effectively limit the opportunity of other vendors to respondwith a lower price. By allowing price changes, some vendors couldhave made initial bids that were artificially low to discourage othervendors from bidding. Then, with the reduced competition, thevendor could change his artificially low price at the last minute,resulting in a higher purchase price. This may have restricted the sav-ings that could have been realized from DIBBS auctions. However, weonly have the final bids for each vendor, not any intermediate bids, sowe cannot determine whether this behavior occurred.
Different comparisons
A fourth possible difference is that the two results are making some-what different comparisons. The DIBBS auction results compare theopen-bid results with the sealed-bid results. Thus, if strict sealed-bidauctions have additional savings relative to conventional procure-ments, the DIBBS estimate of 4.4-percent savings is only a lowerbound. However, to the extent that conventional procurements areselected as the lowest price offer, the DIBBS results are reasonable.Further, the DIBBS estimates are based on historical transaction pricedata, whereas the Navy and Army estimates are based on the IGE. Theaccuracy of the IGE is uncertain, and may be a source of the higherestimates that are observed in Navy and Army auctions.
65


Issues in using auctions
Alternatives: auctions, negotiations, and price taking
Reverse auctions might achieve lower prices relative to traditionalnegotiation or price taking for a number of reasons. When competi-tion is focused on price, as auctions tend to do, strategic behavior bycompeting firms (even if there are only two competing firms) canlead to a Bertrand equilibrium in which price equals the lowest possi-ble price (that which would prevail in a perfectly competitive mar-ket). This contrasts with an environment in which firms can competestrategically along non-price dimensions, as can occur in negotiation,where each vendor presents a slightly unique product and seeks toextract profits from that unique position. In the latter environment,theory predicts that the equilibrium price will remain above the per-fectly competitive level when there are few suppliers. That environ-ment also contrasts with a price-taking environment, where the buyerrelies on the existing market to set the price, though the possibleimperfections in the market might enable the vendor to maintain anartificially high price.
Also, when an apples-to-apples comparison is enforced, there is lessroom for product differentiation. This constrains the other featuresthe bidders can “put on the table” and the consequent price markups.
Additionally, the transparency of open auctions may allow bidders toshare information and reduce uncertainty about the “common value”of the contract up for bid. The reduced uncertainty will lead them toshade their bids less. We used the same reasoning earlier to explainwhy the English auction is better for the auctioneer than the sealed-bid first-price auction.
Note that even the possibility of an auction may be sufficient toachieve price reductions. For example, the U.S. Postal Service(USPS) reserves the right to run an auction (after receiving initial
67

bids) in all its procurements. This means that USPS also has theoption of awarding the contract based on the initial bids. USPS willnot hold an auction if it is unlikely to yield additional savings to coverits cost. As a result, firms may submit more aggressive initial bids.
What should be bought by auction?
The question of which items are suitable for auction has generatedmuch speculation. In this section, we provide some suggestions fordeciding what to purchase by reverse auction. Some criteria extendauctions to items sometimes considered poor candidates, and someexclude items that might initially be thought of as good candidates.
Items that can be specified and have acceptable switching costs
A recent survey of commercial use of electronic reverse auctionslisted five criteria for using auctions [28]. The paper asserts that goodcandidates have the following attributes:
1. Items can be clearly specified.
2. There is a high likelihood that prices can be reduced.
3. Switching costs are acceptable.
4. Sufficient numbers of suppliers exist.
5. Suppliers are willing to participate.
Of these, the most useful criteria are that the items can be clearlyspecified and that switching costs are acceptable. The likelihood thatprices can be reduced is hard to determine in the absence of an auc-tion—it requires more knowledge than buyers normally have. TheNavy auction mechanism requires sufficient bidder competition (aminimum of two bidders and three potential suppliers) so the last twocriteria do little to help buyers decide whether an auction is appropri-ate, rather than just possible.
Items that can be specified are good candidates
Items that can be accurately and completely specified are attractiveauction candidates. When an item is purchased through an auction,
68

the selection of a vendor is focused on price. To make the best choiceby price, care should be taken that the same item is being offered byall vendors. This can be achieved when the item can be fully specifiedby design, delivery, and function descriptions.
Switching costs should be considered
The relative cost of switching providers is also an important decisioncriterion. A procurement auction implies a willingness to change to anew provider. Thus, before the auction, the buyer must determinewhether the costs of switching providers are relatively low. If there isa large investment of relationship-specific capital relative to the costof the item (and thus relative to the potential savings from lowerprices), then an auction might not be appropriate. For example, if afrequently purchased item itself costs relatively little, but the buyerhas implemented systems specifically designed to streamline pur-chases from a given contractor, then the item might not be an attrac-tive auction candidate. The potential savings may not be worth thecosts of switching providers.
Auctions can be used for items with relationship-specific investment.If the item is very expensive, even the sunk cost in the relationshipcan be small relative to the potential savings that might be obtainedfrom competition. Similarly, an auction for a long-term contract canreduce the relative value of the relationship-specific costs to the pointwhere they are not overwhelming.
Further, the costs to the providers of switching should be considered.If the purchase imposes significant retooling costs to a new providerfor relatively small purchases, the incumbent will hold a significantadvantage. In fact, because the other entrants might bid high, theincumbent will have little incentive to bid low. In contrast, a negoti-ated procurement might give the buyer the leverage by having theability to exercise an option to use an alternate provider in a long-term contract. (An auction for a long-term contract could be used tomitigate the re-tooling cost.)
Together, specificity of items and the cost of switching providers sug-gest that auctions are not appropriate for items where a strategic part-nership with a supplier is important. In a strategic purchasing
69

arrangement, the items being purchased are often jointly developed,and high relationship-specific investments are made.
Commodities and non-commodities
A common perception among Navy and Army personnel is thatonline auctions work best when the item being procured is a com-modity40 or can be bought off-the-shelf (COTS). Almost by defini-tion, commodity purchases usually satisfy the criteria for auctioncandidates, especially the two main criteria of clearly specified itemsand low switching costs. Thus, they are good auction candidates.However, the active commodity market with multiple suppliers andbuyers that generates the availability of the COTS item might alsogenerate sufficient competition to force prices nearly as low as theycan go.
Reverse auctions for customized items may yield even greater savings.Customized items can also meet the above criteria, with the potentialfor significant savings. If the buyer can accurately and completelyspecify the performance requirements and the items have multiplepotential suppliers but are not commonly traded in the market, thepotential savings may be high. Unique items with these criteria maylack an active market, and thus also lack the competition that canlower prices. Thus, a procurement auction can be used to generatethis competition where demand does not normally exist for the item.
One auction service provider reports above-average savings from auc-tions in professional services (legal, information technology, consult-ing, landscaping, etc.). These contracts can be complex and typicallymust be customized to the needs of the individual buyer, thus demon-strating that auction savings are not limited to commodities or COTSitems. This may explain the very high savings that the Navy may haverealized in the CVN camel procurement. The camels were a newlydesigned item, and several providers may have had the capability to
40. A commodity is defined as an item that is completely interchangeablein the market—one firm’s product is precisely the same as anotherfirm’s object.
70

build it. The alternative may have been negotiations, where thedegree of competition could have been lower.
Auctions for items with cost-quality tradeoffs
Auctions for fully specified items can overlook valued alternatives
One possible drawback to specifying requirements very precisely isthat there is less room for suppliers to reveal any superior informa-tion they may have about production possibilities, including reliabil-ity, durability, or the likelihood of failing to meet contractrequirements. For instance, a DoD buyer may require that the batter-ies for a given radio unit last at least a week between charges butweigh no more than 2 pounds. Several suppliers may be able to builda battery that weighs only half a pound but lasts only 6 days. Whereasthis information would likely be revealed in a traditional negotiationprocess, these suppliers would not even qualify for bidding if a pro-curement auction were to be held.
Developing better specifications through market research or specifying tradeoffs
Good market research is one way to make sure that the best availabletechnology is not inadvertently excluded from consideration. A buyerwho becomes informed about the state-of-the-art prior to determin-ing requirements and running an auction runs less risk of overlook-ing promising leads. Given this knowledge, a procurement auctionfor a well-specified product can be fruitful.
Another way around this problem is for the buyer to specify how hevalues the cost-quality tradeoffs—for example, how valuable an addi-tional ounce of weight reduction is relative to an additional hour ofbattery life. Suppliers can then consider a larger set of productionoptions to maximize the buyer’s value. In practice, it may be difficultor time-consuming to assign precise numbers to value every combina-tion of weight and battery life. As a result, procuring by auction maynot be feasible, or may not yield the hoped-for savings in transactionscosts.
71

Best value auctions
Still another way to approach the price-quality problem is to use theauction as a negotiation mechanism in a best value procurement.Here, the buyer solicits bids for an item that involves variation in qual-ity, but does not necessarily enumerate the tradeoff values. Thesetradeoff values might not be listed because the buyer does not wantto restrict the dimensions that bidders can compete in, or because thecost of specifying them is too great. The buyer selects the vendorbased on a combination of the price and non-price aspects of the ven-dors’ offers. Bidders will then compete on both price and quality fea-tures.
Thus, auctions for items involving tradeoffs can be used, but they maynot result in the same degree of price competition, because biddersmight rely on the non-price characteristics of their product to differ-entiate themselves from their competitors. The Bertrand equilibriumof a competitive market price even in the presence of imperfect com-petition relies on pure price competition. By allowing variation inproducts to enter the vendor selection decision, vendors can rely onunique attributes to set themselves apart. The resulting environmentis termed “monopolistic competition.” In general, the prices will notbe as low as those realized in perfect competition, because the sellerseach have some degree of monopoly power that enables them tomaintain higher prices. Nevertheless, the gains from additional price-quality choices may offset the foregone benefits of additional pricecompetition.
Multiple lines/multiple lots: combinatorial auctions and economies of scale and scope
Finally, auctioneers should give careful consideration both to thequantities of items and the combinations of items they put up for bidsimultaneously. There may be economies of scale or scope (syner-gies) that can be realized by grouping items together. However, thisrequires the auctioneer to know the ideal groups before the auction,which may not be possible. One alternative is to have a simultaneousauction for several related items that allows vendors to bid on theirchoice of sets of the items for a single price. This can allow the ven-dors to select the appropriate grouping of items to realize the best
72

economies of scope and scale. Such auctions are termed combinato-rial auctions. They present different challenges, one of which is howto select the winning bids. A full discussion of combinatorial auctionsis beyond the scope of this paper. For a summary, see [29].
Why should individual commands/programs use auctions?
The adoption of online reverse auctions has occurred much morerapidly in the private sector than in the federal government. A majorobstacle to expansion of government auctions is that governmentprocurement managers have less incentive to use auctions than domanagers in the private sector. A DoD procurement program officethat uses reverse auctions to achieve savings of 10 percent may fearthat its future budgets will be reduced by that amount.
Possible improved incentives
As we discussed earlier, the savings that result from an auction arehard to measure objectively, and this makes it difficult to design anincentive-pay schedule for program managers. One concern withsuch a scale is that the baselines might be “gamed” to change themanager’s rewards.
Small changes in the federal acquisition regulations may allow morewidespread use of reverse auctions in programs in which they arelikely to yield savings. For instance, legislation now under consider-ation41 would improve incentives by allowing program managers touse their budget surpluses to buy additional units of the item beingprocured.
How should auctions be conducted?
Auction rules
Auction theory and the DIBBS auctions indicate that auction rulescan significantly affect the outcomes of the auctions, including thedesired revenue. Thus, it is important to try to match the environ-
41. Service Acquisition Reform Act (SARA).
73

ment with the appropriate auction design. This is not an easy task.One must know who the bidders are, and have a fairly solid under-standing of the nature of the firms. This information may be impossi-ble or cost prohibitive to obtain. One approach to finding the bestauction format is to experiment with different formats for differenttypes of items, and then analyze the data to determine which formatyields the best results for each class of items.
In principle, auction rules can be tailored to yield the auctioneer’sdesired outcome (efficiency or minimum cost, for example). Often,however, this requires additional complexity, such as the suggestionin Maskin (2000) to require bidders to submit bidding schedules thatspecify a bid for each possible profile of their competitors’ bids. Inpractice, the costs associated with learning the auction rules may beconsiderable and may deter potential bidders from participation.Consequently, it may be efficient to opt for a simple, familiar set ofbidding rules, even if it means sacrificing some part of the desiredoutcome (by paying a slightly higher price on average, for example).The resulting increase in the number of bidders should more thanoutweigh the gains from optimal auction rules.
Auction design also affects research and development investment.Theoretical research has found that second-price auctions result instronger incentives for investment in cost-reducing R&D than first-price auctions when the competing firms are asymmetric. This isbecause investment has a negative strategic effect—competing firmsrespond to the investment by collectively bidding more aggressively,thus lowering the value of the investment.42 In contrast, in asecond-price auction, bidding strategies are independent of the dis-tributions of opponents’ costs, so there are no disincentives to invest-ments [30].
42. Specifically, the result holds when there are only two bidders, when theinvesting firm’s opponents are symmetric, and under asymmetry whenthe investment changes market leadership.
74

Collusion concerns
Many authors have commented that open auctions give bidders a fast,legal, and low-cost way to signal intentions to collude. As an example,see [31]. Also, Klemperer finds that spectrum auctions in the UnitedStates and elsewhere have fallen prey to collusion and predation [7].He concludes that auction design is not “one-size-fits-all” and that spe-cific steps can be taken to reduce the likelihood of collusion.
For instance, Klemperer (1998) suggests a hybrid auction format toreduce the potential for collusion or entry deterrence associated withopen auctions. In this hybrid format, bidding is open until only twobidders remain. The open bidding stage allows bidders to make theusual inferences from other bids about any unknown common value.However, the final two bidders must then submit sealed, “best-and-final” offers. The sealed bids make it difficult for the last two biddersto signal each other. Furthermore, when one bidder is widely per-ceived as stronger than any other, many of the weaker competitorsmay choose not to participate in an open auction. With the hybridformat, the sealed-bid stage gives weaker bidders some chance of win-ning, thereby increasing auction participation.
Despite the examples of collusion, it is possible that collusion con-cerns may not be too serious. First, collusion requires a small numberof bidders to begin with. In such markets, the suppliers would proba-bly impose some cost of market power under any procurement pro-cess. Thus, only part of any collusion costs in these markets should beattributed to auctions. Second, sustaining collusion requires biddersto have a credible way to punish those who deviate. This generallyrequires the same bidders to be active in multiple auctions, eithersimultaneously (as in the FCC auctions) or over time (as in the milkauctions).
Industrial base concerns
There is also concern that if auctions become the norm, one domi-nant supplier may eventually win a disproportionate number of auc-tions, driving all other firms out of the market. It is argued that thetraditional negotiation process allows program managers and
75

procurement executives to sustain a competitive landscape by“spreading out” contracts to a sufficient number of different suppli-ers. However, if all suppliers realize they will earn their share of gov-ernment contracts regardless of performance, they are unlikely tobecome more efficient. To the extent that auctions reduce the trans-action cost of government procurement, they may actually expandthe industrial base by encouraging more suppliers to enter the bid-ding process.
A related concern is that winning firms will bid too low on a regularbasis, thereby leading to perpetual losses. This concern does not seemreasonable because suppliers should have enough self-interest andmanagement skill to avoid this situation. No supplier is compelled tomake a bid that will not cover his costs. The CAPS study also reportsthat “there is little or no evidence that electronic reverse auctions aredriving suppliers into non-sustainable relationships with buyers [28].”
76

Appendix
Appendix
Price comparisons
In this section, we present additional data on the change in price inan item from one purchase to the next. While this is an imperfectcomparison because there is no control for quantity discounts, theyprovide information on how prices can change.
Excluded vs included: open-bid auction purchases compared to auction-period conventional purchases
Although an item is in the FSCs selected for open-bid auctions, it isoften still purchased through the traditional purchase procedures.During the open-bid auctioning period, any non-auction purchase isbecause the item either failed the pre-solicitation or post-biddingcheck. Figure 14 compares successive purchases made within theopen-bid auction period. Specifically, we compare an auction pur-chase price to the previous price for that NSN, when the previous pur-chase did not meet the pre-solicitation criteria, for example becauseit was a high-priority purchase. There are 522 observations in this his-togram, with a mean of -.159, a median of -.048 and standard devia-tion of .358. This indicates that the open-bid auction purchase pricewas noticably lower than the purchase price for the same item thatwas not eligible for an auction. If priority is the primary reason foritems switching categories, this indicates that the priority effect (likelya combination of both urgency and allowing buyers more discretionin their purchases) increases prices noticably.
Within auction price comparisons
Finally, we compare the variability in the prices of items within theauction formats. Figure 15 presents the log of the ratio of one sealed-bid purchase to the next sealed-bid purchase of an NSN, andFigure 16 presents the same information for open-bid purchases. An
77

Appendix
interesting feature of these figures is that the volatility of prices is rel-atively low compared to the variation in the conventional-to-conven-tional purchases (see figure 1 and table 6), suggesting that auctionscan actually increase price stability. Summary statistics for these twoprice ratios are provided in table 15. The mean of the change inprices was smaller in subsequent open-auction purchases than thechange when the open-auctions were first used. Repeated use ofopen-auctions will likely not continuously drive prices down.
Figure 13. Log ratio of open-bid auction purchases to conventional purchases during open-bid period
Fra
ctio
n
log(open−bid auction price/open−bid period non−auction price)−1.5 0 1.5
0
.1
.2
.3
.4
.5
78

Appendix
Figure 14. Log ratio of consecutive sealed-bid auction purchases
Figure 15. Log ratio of consecutive open-bid auction purchases
Fra
ctio
n
log(sealed−bid auction price/previous sealed−bid auction price)−1.5 0 1.5
0
.1
.2
.3
.4
.5
Fra
ctio
n
log(open−bid auction price/previous open−bid auction price)−1.5 0 1.5
0
.1
.2
.3
.4
.5
79

Appendix
Additional regression results
Full regression results
Table 7 in the text does not include the FSC specific time trend terms.For completeness, the time trends are included in table 16. In mostcases, these coefficients are statistically significant, indicating thatregressions including those time trends are preferred.
Subsample regression results
The analysis in the paper uses the sample of NSNs that had a PACEsealed- or open-bid auction. Alternatively, we could have restrictedthe sample to NSNs that had both a PACE sealed- or open-bid auction.This restricts the sample size. We provide the results of estimation
Table 15. Summary statistics of purchase-to-purchase price ratios
Log of Observations Mean SD MedianSealed-bid PACE/sealed-bid PACE 587 .021 .129 -.012Open-bid PACE/open-bid PACE 876 -.040 .171 -.017
Table 16. Time trend coefficients for results reported in table 7a
a. Absolute value of t-statistics in parentheses. * significant at 5 percent; ** significant at 1 percent
(2) (3) (4)FSC2530*t -0.016 -0.016 -0.016
(4.05)** (3.84)** (4.01)**FSC4730*t -0.018 -0.017 -0.018
(4.25)** (3.99)** (4.27)**FSC5930*t -0.016 -0.016 -0.017
(3.24)** (3.17)** (3.26)**FSC2530*t^2 0.000 0.000 0.000
(4.08)** (3.86)** (4.04)**FSC4730*t^2 0.000 0.000 0.000
(4.24)** (3.99)** (4.27)**FSC5930*t^2 0.000 0.000 0.000
(3.26)** (3.19)** (3.28)**
80

Appendix
using this sample in table 17. The results are nearly identical. Theonly difference is the effect of the number of bidders. While similarqualitatively—a single bidder will imply a price increase but multiplebidders a price decrease—the magnitudes are slightly different. Thesubsample indicates that with one bidder, the price rises .4 percent,and savings begin to accrue from the second bidder on. Again, eachadditional bidder has a smaller impact.
Table 17. Regression results on subsample of NSNs with both sealed- and open-bid auctionsa
(1) (2) (3) (4)Ln(quantity) -0.158 -0.157 -0.156 -0.157
(24.06)** (23.79)** (23.67)** (23.78)**Open-bid auction indicator -0.034 -0.048 0.020 -0.048
(3.94)** (5.11)** (1.07) (5.11)**Award date -0.001 0.001 0.001 0.001
(0.97) (0.36) (0.19) (0.36)Award date squared 0.000 -0.000 -0.000 -0.000
(0.99) (1.89) (1.78) (1.89)Fast purchase -0.150 -0.141 -0.142 -0.141
(9.50)** (8.88)** (8.96)** (8.87)**FSC2530*t -0.004 -0.004 -0.004
(1.07) (0.97) (1.07)FSC4730*t -0.005 -0.004 -0.005
(1.10) (0.89) (1.10)FSC5961*t 0.007 0.007 0.007
(1.22) (1.24) (1.21)FSC2530*t^2 0.000 0.000 0.000
(2.38)* (2.33)* (2.38)*FSC4730*t^2 0.000 0.000 0.000
(2.32)* (2.17)* (2.32)*FSC5961*t^2 0.000 0.000 0.000
(1.22) (1.24) (1.21)Number of bids -0.016
(3.89)**Number of bids squared 0.001
(2.93)**Fifth or greater auction for NSN -0.002
(0.05)
81
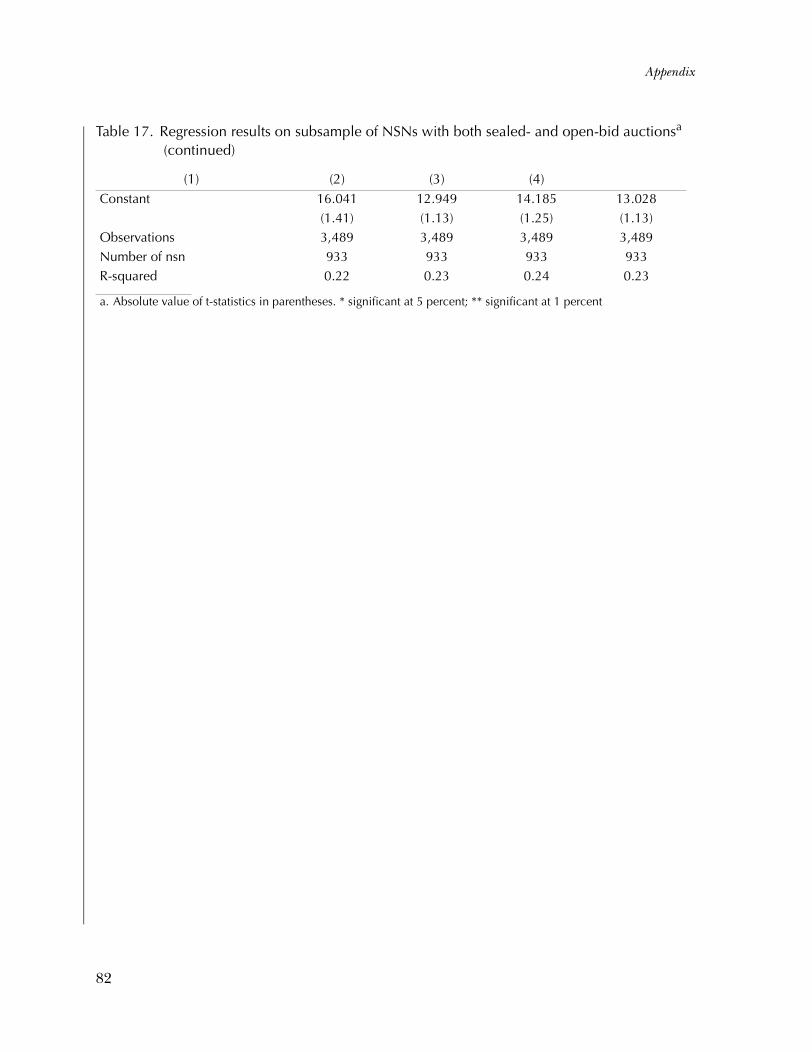
Appendix
Constant 16.041 12.949 14.185 13.028(1.41) (1.13) (1.25) (1.13)
Observations 3,489 3,489 3,489 3,489Number of nsn 933 933 933 933R-squared 0.22 0.23 0.24 0.23
a. Absolute value of t-statistics in parentheses. * significant at 5 percent; ** significant at 1 percent
Table 17. Regression results on subsample of NSNs with both sealed- and open-bid auctionsa
(continued)
(1) (2) (3) (4)
82

List of Acronyms
CECOM Army Communications-Electronics Command
COTS Commercial off-the-shelf
DIBBS DSCC Internet Bid Board System
DSCC Defense Supply Center Columbus
FISC Fleet and Industrial Supply Center
FSC Federal Stock Class
PACE Procurement Automated Contract Evaluation
NAVICP Naval Inventory Control Point
NSN National Stock Number
PPI Producer Price Index (Bureau of Labor Statistics SeriesPCUOMFG#)
FCC Federal Communcations Commission
IGE Independent government estimate
83


References
[1] http://wireless.fcc.gov/auctions/summary.html#com-pleted, accessed Dec 18, 2002
[2] http://pages.ebay.com/community/aboutebay/overview/index.html, accessed Dec 18, 2002
[3] http://www.gxs.com/gxs/press/release/press20020508,accessed December 18, 2002
[4] http://www.freemarkets.com/en/benefits/default.asp,accessed December 18, 2002
[5] Major Susan L. Turley, USAF. “Wielding the Virtual Gavel—DOD Moves Forward with Reverse Auctions.” undated manu-script
[6] Paul Klemperer. “Auction Theory: A Guide to the Literature.”Journal of Economic Surveys, 13(3), Jul 1999, pp 227-286
[7] Paul Klemperer. “What Really Matters in Auction Design.”Journal of Economic Perspectives, 16(1), Winter 2002, pp 169-189
[8] David Lucking-Reiley. “Auctions on the Internet: What’sBeing Auctioned, and How?” Journal of Industrial Economics,48(3), Sep 2000, pp 227-252
[9] Partha Dasgupta and Eric Maskin. “Efficient Auctions.” Quar-terly Journal of Economics, 65(2), May 2000, pp 341-388
[10] Paul Klemperer. “Auctions with Almost Common Values: theWallet Game and its Applications.” European Economic Review,42, May 1998, pp 757-769
85

[11] Paul R. Milgrom and Robert Weber. “A Theory of Auctionsand Competitive Bidding.” Econometrica, 50(5), Sep 1982, pp1089-1122
[12] Paul Milgrom. “Auctions and Bidding: A Primer.” Journal ofEconomic Perspectives. 3(3), Summer 1989, pp 3-22
[13] William Vickrey. “Counterspeculation, Auctions and Compet-itive Sealed Tenders.” Journal of Finance, 16, pp 8-37
[14] John McMillan, ed. “Subject Index of Articles in Current Peri-odicals.” Journal of Economic Literature, 40, Dec 2002
[15] Bruce G. Linster and David R. Mullin. “Auctions in DefenseAcquisition: Theory and Experimental Evidence.” AcquisitionReview Quarterly, Summer 2002, pp 213-223
[16] Eric Maskin and John Riley. “Asymmetric Auctions.” Review ofEconomic Studies, 67, 2000, pp 413-438,
[17] Jeremy Bulow and Paul Klemperer. “Auctions Versus Negotia-tions.” American Economic Review, 86, 1996, pp 180-194
[18] David Lucking-Reiley. “Using Field Experiments to TestEquivalence Between Auction Formats: Magic on the Inter-net.” American Economic Review, 89(5), Dec 1999, pp 1063-1080
[19] Robert G. Hansen, “Sealed-Bid Versus Open Auctions: TheEvidence.” Economic Inquiry, 24, Jan 1986, pp 125-142
[20] Jacob K. Goeree and Theo Offerman, “Efficiency in Auctionswith Private and Common Values.” American Economic Review,92(3), Jun 2002, pp 625-643.
[21] Anders Lunander, “Procurement Bidding in First-Price andSecond-Price Sealed Bid Common Value Auctions.” Manu-script, Oct 1999
[22] Lance Branman, J. Douglass Klein and Leonard W. Weiss.“The Price Effects of Increased Competition in Auction Mar-kets.” The Review of Economics and Statistics, 69(1), Feb 1987, pp24-32
86
[23] DSCC Master Solicitation for Automated Solicitations andR e su l t i ng A wa rd s ( PA CE) , a va i l a b l e a t h t tp ://dibbs.dscc.dla.mil/refs/provclauses/
[24] Alvin E. Roth and Axel Ockenfels. “Last-Minute Bidding andthe Rules for Ending Second-Price Auctions: Evidence fromeBay and Amazon Auctions on the Internet.” American Eco-nomic Review, 92(4), Sep 2002, pp 1093-1103
[25] StataCorp. Stata Statistical Software: Release 8.0, Reference Man-ual. College Station, TX: Stata Corporation, 2003
[26] Qi Li. “Nonparametric Testing of Closeness between TwoUnknown Distribution Functions.” Econometric Reviews, 15(3),1996, pp 261-274
[27] “Department of the Navy’s Reverse Auctioning Process,”NAVAUDSV P-7520.1, N2003-0030, 5 Mar 2003
[28] Stewart Beall, et al. “The Role of Reverse Auction in StrategicSourcing.” CAPS Research, 2003
[29] Sven de Vries and Rakesh Vohra. “Combinatorial Auctions: ASurvey.” INFORMS Journal on Computing, forthcoming
[30] Leandro Arozamena and Estelle Cantillon. “InvestmentIncentives in Procurement Auctions.” Review of Economic Stud-ies, forthcoming
[31] Martin Pesendorfer. “A Study of Collusion in First-Price Auc-tions.” Review of Economic Studies, 67, 2000, pp 381-411
87


List of figures
Figure 1. Histogram of log of ratio of prices in consecutive conventional purchases of the same NSN in selected FSCs, 1996–1999 . . . . . . . . . . . . . . . 31
Figure 2. Histogram of the log of the ratio of sealed-bid auction price to previous conventional purchase price of the same NSN in selected FSCs . . . . . . . 32
Figure 3. Histogram of the log of ratio of the open-bid auction price to previous sealed-bid auction price of the same NSN in selected FSCs . . . . . . . 33
Figure 4. Distribution of residuals from the auction purchase model . . . . . . . . . . . . . . . . . . . . 38
Figure 5. Comparison of residuals from the manual purchase model in open- and sealed-auction periods . . . . . . . . . . . . . . . . . . . . . . . . . 42
Figure 6. Smoothed density plot of residuals from the manual purchase model . . . . . . . . . . . . . . . 42
Figure 7. Navy auction activity—number of auctions . . . . . 51
Figure 8. Navy auction activity—value of purchases . . . . . . 51
Figure 9. Navy and Marine Corps auction savings by IGE (Naval Audit Service “supported” only) . . . . . . . 57
Figure 10. Navy and Marine Corps auction weighted and unweighted average savings by type of item (Naval Audit Service “supported” auction results only) . . . . . . . . . . . . . . . . . . . . . . . . . . 58
Figure 11. Auction results by item type . . . . . . . . . . . . . 60
89

Figure 12. Weighted average savings by number of bidders, Army auctions . . . . . . . . . . . . . . . . . . . . . 62
Figure 13. Log ratio of open-bid auction purchases to conventional purchases during open-bid period . . . . . . . . . . . . . . . . . . . . . . . . . 78
Figure 14. Log ratio of consecutive sealed-bid auction purchases . . . . . . . . . . . . . . . . . . . . . . . 79
Figure 15. Log ratio of consecutive open-bid auction purchases . . . . . . . . . . . . . . . . . . . . . . . 79
90

List of tables
Table 1. Hypothetical multiple-item auction bids . . . . . . . 12
Table 2. Summary of asymmetric auction revenue theory [16]. . . . . . . . . . . . . . . . . . . . . . . 21
Table 3. DIBBS auctions: number and value of awards . . . . 29
Table 4. Summary statistics on DIBBS auctions . . . . . . . . 29
Table 5. Number of bidders in open-bid auctions . . . . . . 30
Table 6. Summary statistics of purchase-to-purchase price ratios . . . . . . . . . . . . . . . . . . . . . . . 33
Table 7. Fixed-effects estimates of open-bid auctions, compared to sealed-bid auctions . . . . . . . . . . . 36
Table 8. Purchase mechanism by period . . . . . . . . . . . 39
Table 9. Regression results, pooling manual and automated purchases . . . . . . . . . . . . . . . . . 46
Table 10. NAVICP Reverse Auction pilot project . . . . . . . . 49
Table 11. Government-estimate and reverse-auction price example . . . . . . . . . . . . . . . . . . . . . 53
Table 12. Army auction summary . . . . . . . . . . . . . . . . 60
Table 13. Percent savings in Army auctions. . . . . . . . . . . 61
Table 14. Number of bidders in auctions . . . . . . . . . . . . 62
Table 15. Summary statistics of purchase-to-purchase price ratios . . . . . . . . . . . . . . . . . . . . . . . 80
91

Table 16. Time trend coefficients for results reported in table 7 . . . . . . . . . . . . . . . . . . . . . . . . 80
Table 17. Regression results on subsample of NSNs with both sealed- and open-bid auctions . . . . . . . . . 81
92


CR
M D
0007
515.
A3
/ Fin
al