using quality improvement collaborative approach to...
TRANSCRIPT

Using Quality Improvement Collaborative Approach to Improve
newborn outcomes in Malawi Dr Mercy Jere
International Forum London
Thursday, 27 April 2017

Background
• Malawi
– Population: 17.2 million (2015)
– Maternal mortality Rate: 439 per 100,000 live births
– Neonatal Mortality Rate: 27 per 1000 live births
• Prematurity 31%
• Asphyxia 28%
• Neonatal Sepsis 19%
– 18% deliveries are preterm
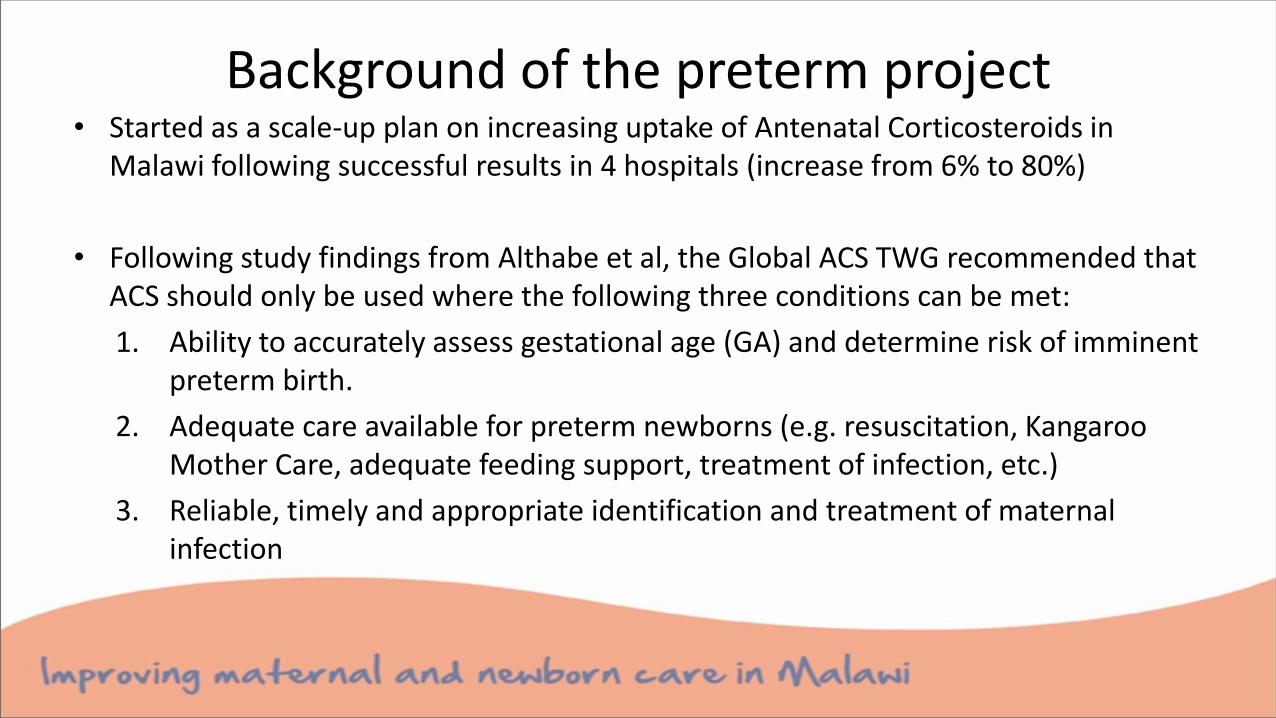
Background of the preterm project • Started as a scale-up plan on increasing uptake of Antenatal Corticosteroids in
Malawi following successful results in 4 hospitals (increase from 6% to 80%)
• Following study findings from Althabe et al, the Global ACS TWG recommended that ACS should only be used where the following three conditions can be met:
1. Ability to accurately assess gestational age (GA) and determine risk of imminent preterm birth.
2. Adequate care available for preterm newborns (e.g. resuscitation, Kangaroo Mother Care, adequate feeding support, treatment of infection, etc.)
3. Reliable, timely and appropriate identification and treatment of maternal infection
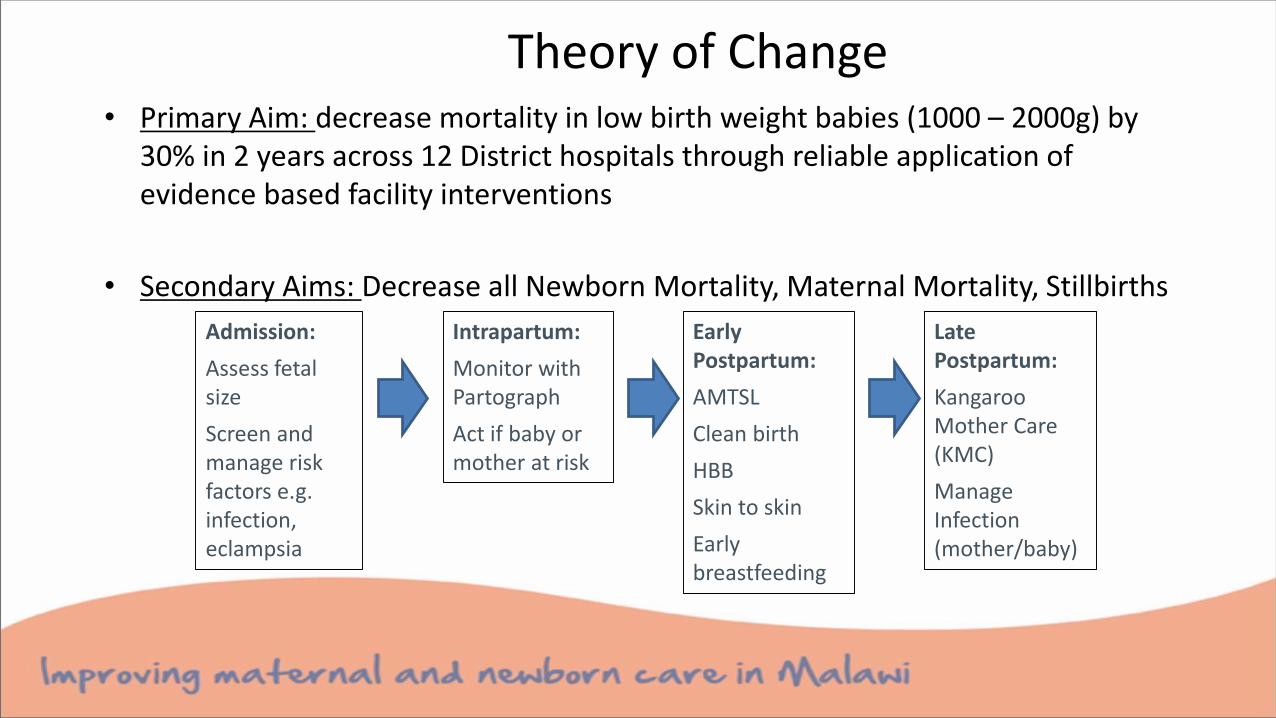
Theory of Change• Primary Aim: decrease mortality in low birth weight babies (1000 – 2000g) by
30% in 2 years across 12 District hospitals through reliable application of evidence based facility interventions
• Secondary Aims: Decrease all Newborn Mortality, Maternal Mortality, Stillbirths
Admission:
Assess fetal size
Screen and manage risk factors e.g. infection, eclampsia
Intrapartum:
Monitor with Partograph
Act if baby or mother at risk
Early Postpartum:
AMTSL
Clean birth
HBB
Skin to skin
Early breastfeeding
Late Postpartum:
Kangaroo Mother Care (KMC)
Manage Infection (mother/baby)

Activated leadership who can champion an improvement system for neonatal survival 15 Leaders & 24 District mentors trained in QI Leaders making decisions based on gaps identified (Staffing, medical equipment,
generators etc.)
Immediate access to essential commodities needed for preterm neonatal survival Hospitals established nursery and KMC units separate from the general postnatal ward Essential equipment provided
A bundle of key interventions that are reliably applied to every mother in labour and every preterm new-born infant Antenatal, Intrapartum and Postpartum
Patient & Family Centred Care from antenatal care through neonate’s discharge
Knowledgeable health workers who can expertly deliver preterm new-born care Clinical training on labour and management of the new-born In-situ trainings (parto-graph scoring, resuscitation, KMC) Introduction to Quality Improvement and Collaborative Learning Sessions
Reducing deaths of Low Birth Weight Babies in 12 Hospitals in
Malawi
Drivers of Success
Reliable Data systems Real time chart reviews and scoring processes of care against standards Hospitals using their data

Reduced deaths of Low Birth Weight Babies by 25% in 12 hospitals
0
50
100
150
200
250
300
350
400
450
Nov-1
4
Dec-1
4
Ja
n-1
5
Fe
b-1
5
Ma
r-15
Apr-
15
Ma
y-1
5
Ju
n-1
5
Ju
l-1
5
Aug
-15
Sep
-15
Oct-
15
Nov-1
5
Dec-1
5
Ja
n-1
6
Fe
b-1
6
Ma
r-16
Apr-
16
Ma
y-1
6
Ju
n-1
6
Ju
l-1
6
Aug
-16
Sep
-16
Oct-
16
Nov-1
6
Dec-1
6
Ja
n-1
7
Fe
b-1
7
Run Chart: Low Birth Weight Deaths per 1000 live births in 12 Hospitals
LB
W d
ea
th r
ate
pe
r 1
00
0 liv
e
0%
10%
20%
30%
40%
50%
60%
70%
80%
90%
100%
Nov-1
4D
ec-1
4Ja
n-1
5F
eb-1
5M
ar-
15
Apr-
15
Ma
y-1
5Ju
n-1
5Ju
l-1
5A
ug
-15
Sep
-15
Oct-
15
Nov-1
5D
ec-1
5Ja
n-1
6F
eb-1
6M
ar-
16
Apr-
16
Ma
y-1
6Ju
n-1
6Ju
l-1
6A
ug
-16
Sep
-16
Oct-
16
Nov-1
6D
ec-1
6Ja
n-1
7F
eb-1
7
Run Chart: % of KMC Babies managed as per protocol or standard
0%10%20%30%40%50%60%70%80%90%
100%
Nov-1
4D
ec-1
4Ja
n-1
5F
eb-1
5M
ar-
15
Apr-
15
Ma
y-1
5Ju
n-1
5Ju
l-1
5A
ug
-15
Sep
-15
Oct-
15
Nov-1
5D
ec-1
5Ja
n-1
6F
eb-1
6M
ar-
16
Apr-
16
Ma
y-1
6Ju
n-1
6Ju
l-1
6A
ug
-16
Sep
-16
Oct-
16
Nov-1
6D
ec-1
6Ja
n-1
7F
eb-1
7
Run Chart: % Eligible LBW babies (weight ≤2000g admitted into KMC
LS1 LS2 LS3 LS4 LS5
LS1 LS2 LS3 LS4 LS5
LS1 LS2 LS3 LS4 LS5
Learning Session 4 Key Interventions Immediate Skin to skin for all babies National neonatal monitoring tools provided to all hospitals Scoring of KMC processes of care
179
114
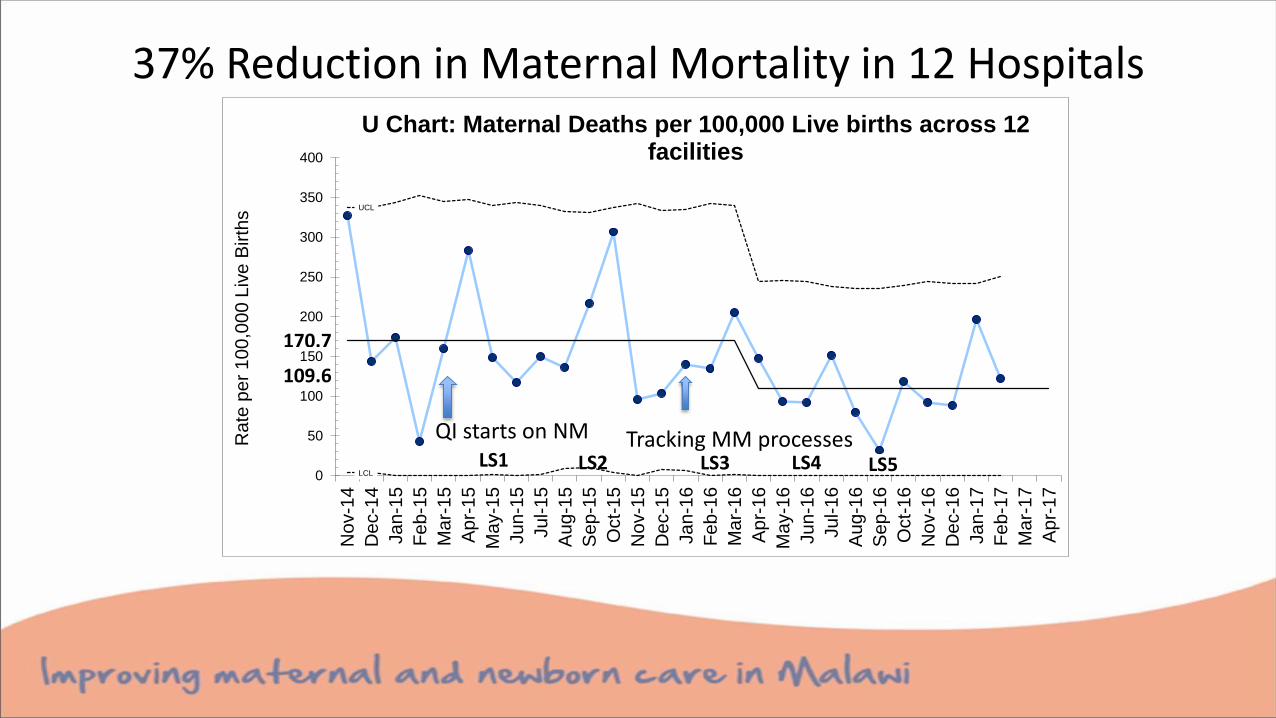
37% Reduction in Maternal Mortality in 12 Hospitals
UCL
LCL0
50
100
150
200
250
300
350
400
No
v-1
4
De
c-1
4
Ja
n-1
5
Fe
b-1
5
Ma
r-1
5
Ap
r-1
5
Ma
y-1
5
Ju
n-1
5
Ju
l-1
5
Au
g-1
5
Se
p-1
5
Oct-
15
No
v-1
5
De
c-1
5
Ja
n-1
6
Fe
b-1
6
Ma
r-1
6
Ap
r-1
6
Ma
y-1
6
Ju
n-1
6
Ju
l-1
6
Au
g-1
6
Sep-1
6
Oct-
16
No
v-1
6
De
c-1
6
Ja
n-1
7
Fe
b-1
7
Ma
r-1
7
Apr-
17
U Chart: Maternal Deaths per 100,000 Live births across 12 facilities
Ra
te p
er
10
0,0
00
Liv
e B
irth
s
170.7
109.6
QI starts on NM Tracking MM processesLS1 LS2 LS3 LS4 LS5

No change in Stillbirths and Neonatal Mortality
0.0%
0.5%
1.0%
1.5%
2.0%
2.5%
3.0%
No
v-1
4D
ec-1
4Ja
n-1
5F
eb
-15
Ma
r-1
5A
pr-
15
Ma
y-1
5Ju
n-1
5Ju
l-1
5A
ug-1
5S
ep-1
5O
ct-
15
No
v-1
5D
ec-1
5Ja
n-1
6F
eb
-16
Ma
r-1
6A
pr-
16
Ma
y-1
6Ju
n-1
6Ju
l-1
6A
ug-1
6S
ep-1
6O
ct-
16
No
v-1
6D
ec-1
6Ja
n-1
7F
eb
-17
Run Chart: Percentage of Fresh Still Births in 12 Hospital Collaborative
LS1 LS2 LS3 LS4 LS50
5
10
15
20
25
30
35
Nov-1
4
Dec-1
4
Ja
n-1
5
Fe
b-1
5
Ma
r-15
Apr-
15
Ma
y-1
5
Ju
n-1
5
Ju
l-1
5
Aug
-15
Sep
-15
Oct-
15
Nov-1
5
Dec-1
5
Ja
n-1
6
Fe
b-1
6
Ma
r-16
Apr-
16
Ma
y-1
6
Ju
n-1
6
Ju
l-1
6
Aug
-16
Sep
-16
Oct-
16
Nov-1
6
Dec-1
6
Ja
n-1
7
Fe
b-1
7
Run Chart: Neonatal Mortality Rate per 1000 Live Births
Rate
pe
r 1
00
0 L
ive
birth
s
LS1 LS2 LS3 LS4 LS5

1 hospital reduced Stillbirths by 42% by:
improving on monitoring of pregnant women in latent phase of labor
Improving monitoring of active phase of labor using the partograph (≥90% correct use)
Fortnightly chart reviews and scoring of partographs
This theory has to be tested further

Limitations• Most District Hospitals have very small
KMC rooms and Nursery units
• District Referral systems
• Many babies dying due to complications of birth asphyxia in the collaborative – Complex processes
10 mothers and guardians in a ≈9m2 KMC Room

District Collaborative
• A small scale demonstration of implementation of this QI model across a District, including birthing facilities located in primary care sites
• Focus on Maternal Newborn Health

Activated leadership who can champion an improvement system for maternal and neonatal survival 6 Leaders and 24 District mentors trained in QI District leaders in-charge of District QI activities
Immediate access to essential commodities needed for maternal and neonatal survival Provide essential equipment and drugs
A bundle of key interventionsthat are reliably applied to every mother in labour and new-born infant Antenatal Intrapartum Postpartum
Patient & Family Cantered Carefrom antenatal care through neonate’s discharge
Knowledgeable health workerswho can expertly deliver preterm new-born care Introduction to Quality
Improvement Clinical mentorship at
primary care site In-situ trainings (parto-graph
scoring, resuscitation, KMC) Clinical Mentorship of
primary care midwives at the District Hospital
Improving outcomes of mothers and newborns at District level
District Prototype

0
5
10
15
20
25
30
35
40
45
Nov-1
4D
ec-1
4Ja
n-1
5F
eb-1
5M
ar-
15
Apr-
15
Ma
y-1
5Ju
n-1
5Ju
l-1
5A
ug
-15
Sep
-15
Oct-
15
Nov-1
5D
ec-1
5Ja
n-1
6F
eb-1
6M
ar-
16
Apr-
16
Ma
y-1
6Ju
n-1
6Ju
l-1
6A
ug
-16
Sep
-16
Oct-
16
Nov-1
6D
ec-1
6Ja
n-1
7F
eb-1
7
Run Chart: Neonatal Mortality at Kasungu District Hospital
Ra
te p
er
10
00
Liv
e B
irth
s
0
100
200
300
400
500
600
700
800
900
No
v-1
4
De
c-1
4
Ja
n-1
5
Feb
-15
Ma
r-1
5
Ap
r-1
5
Ma
y-1
5
Ju
n-1
5
Ju
l-1
5
Au
g-1
5
Se
p-1
5
Oct-
15
No
v-1
5
De
c-1
5
Ja
n-1
6
Feb
-16
Ma
r-1
6
Ap
r-1
6
Ma
y-1
6
Ju
n-1
6
Ju
l-1
6
Au
g-1
6
Se
p-1
6
Oct-
16
No
v-1
6
De
c-1
6
Ja
n-1
7
Feb
-17
Run Chart: Kasungu District Hospital Maternal Mortality Rate
Rate
pe
r 1
00
,00
0 L
ive
Birth
s
Too early to see improvement in the outcome measures

…But there have been improvements in KMC process indicators