using rasch model for the calibration of test items in ...ue.edu.pk/jrre/articles/92001.pdf ·...
TRANSCRIPT

Journal of Research and Reflections in EducationDecember 2015, Vol.9, No.2, pp 82 -102
http://www.ue.edu.pk/jrre
Using Rasch Model for the Calibration of Test Items in Mathematics, Grade-91 Muhammad Sadiq, 2 Shamim Haider Tirmizi. 3 Mubashra Jamil
1 Research Scholar Ph.D., Department of Education BZU Multan2 Associate Prof., Department of Education BZU Multan3 Assistant Prof. Department of Education BZU Multan
(Email: [email protected])
The main objective of the study was the development of a semi-standardized test in Mathematics at grade 9 throughRasch modelling. The population of the study was 59,168 students of grade 9 admitted to 718 secondary schools ofBahawalpur Division (Pakistan) during session 2010-11. The schools were categorised gender-wise, locality-wise andownership-wise to ensure representation of the population in the sample. Cluster sampling was used to identify thesample. For this, 3 schools were randomly opted from each category and all the students of grade 9 in these schools wereincluded in the sample. There were 720 students. However, 642 students participated in the study due to different reasons.Two equivalent test forms, each with 43 items were developed from Mathematics of grade 9. These were ultimatelytransformed into a 86-items test to be semi-standardized. The content validity of the test was obtained by incorporatingthe opinion of teachers in Mathematics and researchers. The alternate-forms reliability of the test was 0.92. The two testforms were administered everywhere with uniformity of instructions and arrangements for two consecutive days to retainthe external validity of the test. The Rasch analysis showed more accuracy thoroughly in the appraisal of test items thanrespondents in terms of logit values, Model error estimates and fit-statistics. The major recommendations of the studywere the replication of the current study, its execution at other times during the academic session, and finding probabilitycorrect for all items and persons to see response patterns more realistically
Key words: Rasch analysis, difficulty and ability measures, precision of estimation, fit-statistics
Introduction
Assessment is an integral part of formal
education with good intentions to appraise and
monitor performance on academic tasks. This
activity shapes both curriculum and teaching
(Stobart & Gipps, 1997). It is regrettable that mostly,
assessment fails to fulfill its intended outcomes and
involve students in short cuts. Stobart (2008) is right
to say that current assessment techniques promote
shallow knowledge, put students to focus on end
points and cram curriculum. Usually, ill-defined
objectives, poorly-designed tests and superficial
expectations make assessment objectionable and
cause its abuses. Stobart (2008) sees assessment
differently as a value-laden social activity, a
procedure to create and plan things to be measured,
and a way to determine the contents and ways of
learning. The author’s view-point with all its essence
appears to open new horizons to explore ways to
shift assessment from “having mode” to “beingmode.” Testing is a way of assessment. It is anenormous enterprise and mostly relies on classroom
and standardized testing.
Haladyna and Rodriguez (2013) say that both
aspects of testing employ the same theories and
technology with somewhat different objectives. In
Pakistan, large-scale/standardized testing is not very
popular at school and college level. There is need to
proceed in this direction for across the classroom
comparisons on certain academic tasks.
No doubt, the concept of standardization is
commonly associated with psychological testing, yet
it is equally used to appraise students on academic
tasks in different content areas. No definition of test
standardization restricts it to psychological
perspective rather opens it for educational use.
Slavin (2012, p.448) supports the view point
defining standardized tests in educational context as,

JRRE Vol.9, No.2,2015
83
“tests that are usually commercially prepared fornationwide use and designed to provide accurate and
meaningful information on students’ performance
relative to that of others at their age or grade levels.”Kubiszyn and Borich (2010) confirm the claim that
standardized achievement tests are developed by test
construction experts with the assistance of
curriculum developers and classroom teachers to
compare a student’s achievement with his age andgrade cohorts. Generally, standardized group tests
cover language skills, mathematics, science and
social studies. In the same perspective, Thorndike
and Hagan (1977) disclose that such tests may focus
on a particular subject or even on a particular course
at secondary school level. Mrunalini (2011)
characterises that items for standardized tests are
expertly written, properly pretested, rigorously
analysed and scientifically refined, what be the
contents. The writer seems to ignore prominent
features of standardized testing such as nationwide
scope, uniform administration, norms for
interpretation, preparation of item profile and age or
grade based comparison. Especially, the word
“scientifically refined” creates ambiguity and makes
no contextual sense. It needs to know, what
Mrunalini means it.
Standardized testing is an integral part of
school and college education in many countries.
Kubiszyn and Borich (2010) reveal that standardized
tests are administered to 140-400 million students
worldwide yearly. Woolfolk (2011) exposes that all
the 50 states and District of Columbia in America
have policies on statewide testing. It would be rare if
a student has not experienced several standardized
tests during school days. Ormord (2012) agrees that
use of standardized achievement tests has expanded
drastically to assess students and teachers during the
recent years. Adding more, Linn and Gronlund
(2005) bring forth that norm-referenced
standardized tests dominate testing in education
either as a part of broader assessment system or
alone, being an efficient and relatively cheap mode
for assessing broader achievement goals. Narrating
such goals, Earl (2003) reveals that these tests are
profitable for accountability, evaluation, comparison,
placement, addressing educational concerns,
reviewing educational practices, diagnosing students’problems, highlighting strengths and weaknesses of
specific programs, revising curricula and rating
teachers in addition to compulsion to do so. Earl
seems to overrate standardized tests illogically,
when expects such a wide range of outcomes from
these tests. It is similar to use same prescription to
cure from all diseases. Standardized tests alone
appear helpless to actualize many of these intentions.
Even, these will be inappropriate for some results.
The statement by AERA (2000, p.127) as quoted by
Crisp (2007, p.49) clarifies the position as
“performance on standardized test should not be thesoul determinant in any either/or decision about
instructional placement, promotion or graduation.
Rather, results should be used as indicators of need
for early intervention, programmatic changes, or
more specific evaluation of learning problems.”
The large scale and varied purposive use of
standardized tests do not guarantee that these tests
are free from deficiencies and apprehensions. Test
items lose their credibility due to intensive and
repeated use. Their periodical updating on the cost
of financial loss, administrative headache and
substantial efforts is not easy (Hoffman, 2004).
Thorndike (2005) calls these tests expensive as well
as time-consuming. Carr and Connie (2004)
complaint against their overuse and misuse. Alper, et
al. (2001) blame these tests for ignoring diversified
characteristics like cultural background, native
language and institutional local environment while
comparing an examinee’s score with his/her age orgrade cohort. In the same context, Ormrod (2012)
discloses that many people take scores of
standardized tests for an indicator of classroom
achievement and force teachers to uplift scores on
these tests. The teachers feel pressure over such
demands while covering multi-elaborated

Sadiq, Tirmizi, Jamil
84
curriculum in the classroom. Paratore and
McCormack (2007) add that teachers have to work
in classes and with subject matter while
standardized tests are usually long lists of things to
be done.
Acknowledging the pros and cons of
standardized testing, the researcher decided to work
on this direction adopting a more workable approach
other than usual analyses. Indeed, traditional item
calibration depends upon the ability and numbers of
respondents used for the purpose and in this way,
results are tentative (Mehrens & Lehmann, 1973).
Item difficulty values tend to be positively biased
against high ability sample and vice versa.
Consequently, item discrimination indices become
high for a heterogeneous group but low for
homogenous group. This dilemma disturbs the true
ability variance. Highlighting more with the same,
Stanely and Hopkins (1978) reveal that inequity of
norming groups makes the inferences doubted.
Hence, achievement tests normed on the same group
are credible but Popham (1981) calls such an effort
problematic as prompt costs, exhaustion,
unmotivated responses and artificiality interpose the
task. In the same context, Rasch Measurement
Transaction (2006) bears that classical calibration
happens imprudent to missing data, adaptive testing,
having criterion based pass-fail points and test
equating with small groups. Riaz (2008) has
discussed various methods of such analysis with all
the details and intricacies. It is to clarify that the
researcher does not intend to negate traditional
methods of test item analysis. Such methods can
even out instabilities across test items to yield
trusted scores. The need is to meet key criteria
pertaining to item development, sampling and
sample size, content coverage, validity, textual and
linguistic clarity, and test administration etc. to
enhance worth of this huge and worldwide
enterprise.
In the above scenario, the alternative approach
is Rasch calibration. Wright (1967) exposes that
Rasch models ascertains object-free instrument
calibration and instrument-free object measurement
to generalize measurement beyond the specific
instrument used. Fluctuation arisen in person
abilities due to easy or difficult test is removed from
test scores. The same is done to control variation in
item difficulties happened due to the responses of a
non representative sample. This thing helps to
compare objects measured with alike-instruments
and to combine or partition instrument to meet new
measurement needs, retaining confidence in the
procedure. Being a sample-free model, there is no
need for big samples and assumes normality of
distributions along with its simplicity. Granger
(2008) discloses that Rasch calibration estimates a
person’s probable rating without imputing missingdata, test items skipped due to some reason. Further,
Rasch modelling accounts for both item-fit and
person-fit, while other item response theory (IRT)
models address item-fit only. Wisniewski (1992)
clears that Rasch model coordinates data to define
measurement usefully. It uses the same unit “logit”to quantify item difficulties and person abilities for
convenience and meaningful comparisons
(Athanasou & Lamprianou, 2009).
Vogel and Engelhard, Jr. (2011) narrate that
Rasch model sees the individual learning differences
in item-level performance, rather than determining
overall group performance as done with statistical
procedures like t-test and ANOVA. McArthur (1987)
brings forth that Rasch item calibration and
goodness-of-fit to the model correspond to classical
item analysis procedures but with prominent
distinctions. Such distinctions may include the
adjustment of difficulty logits of a new test through
“linking items” (Popham, 1981), equation ofinstruments to measure the same trait or
performance (Masters & Keeves, 1999), use of
Model error estimates for precision of agent and
object measurement (Wright, 1978), estimation of
probable outcomes of person-item interaction
(Salkand, 2007), knowledge of gain scores in the

JRRE Vol.9, No.2,2015
85
form of meaningful mathematical statements
(Wilkerson & Lang, 2007), diagnosis of classroom
assessments (Vogel & Engelhard, Jr.,2011),
evaluation of item-fit through Rasch measures to
avoid computational complexities (Karabatsos, 2000)
and also through chi-square fit-statistics to control
the suitability of data for the model (Rasch,
1960/1980).
Although, Rasch modelling is quite sensible yet
it does not safeguard against all the pitfalls of
traditional item analyses. It has its own limiting
assumptions. One is unidimensionality. It refers to
assess a single ability by a test item that is an ideal
case. Its violation happens as the basic cause of
misfit of test items (Bond & Fox, 2007). Another
assumption is local independence, no impact of
response of an item on the response of another item.
Baghaie (2008) tells, item-to-item dependence
makes parameter estimates biased. Third assumption
is the guessing factor, especially working with
multiple-choice items (MCIs), where rigorous
correct percentage can be achieved just by chance.
Being one-parameter logistic model, Rasch model
overlooks this reality. Next, Rasch modelling
expects from test items to discriminate test takers in
a uniform way. This assumption seems hard to
defend with finite data when item logistic
characteristic-curves deviate from common slopes.
Two distinct causes of unequal discriminations are
varying reliability of test items and chances of
random guessing. Additionally, Rasch modelling
also demands some knowledge of and acquaintance
with Mathematics in contrast to traditional item
analyses.
The limitations of Rasch modelling are
irrefutable. No doubt, human and environmental
factors disturb test item calibration commonly in all
modes used for the purpose. Even then, Rasch
model has its own distinctive features. Its capability
to work with small samples adequately suits to
investigate classroom practices. Elimination of
sample effect provides a base for test item selection
for varied purposes. Rasch model makes
item-to-item and respondent-to-respondent
comparisons meaningful in the form of
mathematical statements. For example, an item with
a difficulty logit 2.32 is two times harder than an
item with difficulty logit 1.16. The same is true of
respondents having ability logits 2.32 and 1.16.
Further, the use of the common unit “logit” toquantify both difficulty and ability values on the
same latent continuum facilitate inter
item-respondent comparisons. Hence, an item with a
difficulty logit 1.94 is difficult for a respondent with
ability logit 1.63 but easy for the one with ability
logit 2.19. Additionally, the probability of correct
answer on any item by any respondent can be
calculated. Similarly, a few items with known
difficulty logits can serve as “linking items” toadjust the difficulty of a newly constructed test or
equate concurrent tests to appraise same area of
performance. Further, Rasch modelling uses the
matching of difficulty and ability logits to increase
the precision of estimation as an alternative to big
samples used to reduce error estimates in traditional
calibration methods. The underlying theme of many
of such possibilities is the sample-free difficulty
measurement and test-free ability measurement.
Beyond all these, Rasch model uses simple
Mathematics in contrast to other IRT models.
Fit-statistics is an inseparable aspect of Rasch
calibration. It sees the extent to which responses meet
Rasch assumptions. These assumptions are simple
and logical as:
(i) abler persons have greater chances to success
on test items than less able persons.
(ii) a person is expected to do better on easy items
than hard items.
No doubt, Rasch assumptions provide a justified
base for response patterns but practically, these are
hard to meet. These assumptions prove quite
superficial and demand mechanical responses,
putting intervening human and environmental factors

Sadiq, Tirmizi, Jamil
86
aside. Carelessness, fumbling, plodding, response
sets, drowsiness, test anxiety, sudden illness, lucky
guessing, local climatic conditions and cheating
cause bizarre responses. However, Rasch model is a
probabilistic model that accounts for inconsistency
and awkwardness in measurement, and accepts a
plausible magnitude of misfit. It makes room upto
±0.30 points fluctuation around the ideal fit of 1.00
due to imperfect human nature in case of MCIs. Items
deviating from the prescribed limit 0.70-1.30 may be
reconsidered in terms of linguistic, dimensional,
independence, discriminative and guessing
perspectives to control intervening effects to an
affordable extent.
The interpretation of fit-statistics is simple.
Values less than 0.70 denote overfit to the model. In
simple words, test takers have responded more
correctly than the expectations of the model. Overfit
is not a very bad thing. Sometimes, inconsistencies of
human nature make the responses too good. On the
other hand, values more than 1.30 show underfit. It is
commonly regarded as misfit. In such a situation, the
score on the item is not a valid indicator of its
difficulty (Karabatsos, 2000). It reveals that test
takers have responded correctly to difficult items but
incorrectly to easy ones. This is the real concern and
threatens the measurement. One needs worrying
about it as extreme misfit cases may mislead the
interpretation of the results to reach fake conclusions.
Usually, overfit and misfit are reported in terms of
outfit and infit mean-squares to denote the nature of
randomness along with its magnitude. Outfit tells that
mismeasured items were at the extremes of the scale
while infit accounts the middle of the scale.
Wilkerson and Lang (2007) bring forth an interesting
fact that infit is more sensitive to organised mistakes
like a string of correct responses or marking the same
distracter correct repeatedly. On the other hand, outfit
is more distorted by random mistakes like
carelessness or test anxiety. In fit perspectives, an
unavoidable test item with alarming misfit may be
passed through frequent cutting and clipping to make
it “good enough” putting things doing wrong aside.Kreiner (2012) tells that George Rasch was very
cautious about such a bad happening and asked to
manage a remedy for it. However, a few content-wise
representative items may also be included in the test
without considering fit dilemma. Experts have no
objection to such rare items in the testing scheme. It
is noteworthy that the fit criteria are same for items
and respondents but from a substantive view, items
and respondents differ in this regard. Items are
supposed to do betterly than respondents. Hence, fit
rules are applied more strictly to items than to
respondents. If a few respondents do not interact
items accordingly, no need worrying. The same is not
true with test items. Karabatsos (2000) suggests a
simple way of fit-analysis through Rasch measures.
This method characterises response-fit on the same
scale as used for difficulty and ability logits. It uses
the unit “logit noise” to describe misfit. This method
considers absolute values of unwanted responses to
quantify misfit. The average misfit logit can be
calculated for each person and item, a group of
persons or a set of items and even for the entire
sample or the instrument.
For the current study, MCIs were used. No doubt,
much admissible criticism on this format is evident in
literature after the emergence of new trends in
assessment. Even then, one has to rely on MCIs for a
number of reasons. A talented test item writer can use
this format to appraise comprehension, interpretation,
application, analysis or synthesis to arrive at the
keyed answer. These tests also seem beneficial to
make judgments, inferences and generalizations.
Popham (1981) says that MCIs adequately cover
advanced intellectual skills and significant attitudinal
dispositions besides testing factual knowledge.
Athanasou and Lamprianou (2009) reveal that MCI
format is used for large scale examinations such as
the Higher School Certificate and the Scholastic
Aptitude Test, the mathematics and science
competitions in primary and high schools developed
by the University of New South Wales, the Basic

JRRE Vol.9, No.2,2015
87
Skills Tests used in many states, educational tests
distributed by the Australian Council for Educational
Research and Overseas Skills Recognition Tests due
to their versatile coverage of subject areas and
adoptability. Their utility is at the same level in many
countries other than Australia. Especially, countries
like UK and USA make copious use of this format. In
Pakistan, Federal and Provincial Public Service
Commissions and other recruitment agencies use this
test format for appraisal. Entry tests in medical and
engineering are solely MCI based. The National
Testing Service (NTS) adopts this format all alone to
judge candidacy for admission to universities of
Pakistan. These tests also make a major part of
assessment at school and college level.
The above stated virtues and functions of MCI
format are not a guarantee for their perfection as
assessment tool. These are equally criticised for a
number of reasons. MCIs seem helpless to bring
fluency and spontaneity in written expression and
retard originality. This format does not provide
opportunity to synthesize thoughts and write out
creative solutions. People blame MCIs for common
mistakes in spellings and sentence structures by
students. Simply, recognition of a response is inferior
to its construction. Problems like ambiguity in stems,
complicated syntax, heterogeneous options,
unintentional clues for correct answer, grammatical
inconsistencies between stem and options, unfair
positioning of correct answer, guessing and other
concerns are common with MCIs especially when the
test developer is inexperienced or non-professional.
Hence, a judicious and blended use of MCIs can
sufficiently justify their presence in modern
assessment. Woolfolk(2011) asks for the use of
constructed-response format, authentic assessment
and portfolio assessment to deal with testing
problems common with MCIs. In the same way,
Kaplan and Saccuzzo (2007) prefer written tests and
work samples to usual MCIs to assess students.
However, problem of comparison of performance
with these methods awaits future work. Haladyna and
Rodriguez (2013) introduce some modified and
improved versions of MCIs like multiple-mark item
format, “uncued” multiple-choice, ordered multiple-
choice and two-tiered diagnostic multiple-choice to
compensate existing flaws of this format.
The researcher opted MCIs for the study due to
the reasons like Pakistani students’ acquaintance withthis format, their focal weightage in assessment and
after all, data need to be based on dichotomous
choice for test item calibration though Simple Rasch
Model. However, their exists Rasch’s Partial CreditModel to accommodate partial award as in the case of
short answer questions but all this is beyond the
scope of current study. The researcher wants to share
another compulsion with the readers that the test
items of this study mostly cover recall of factual
knowledge and comprehension. These overlook
advanced cognitive levels. All this reflects local
standards and the researcher is helpless in this
regards. Question papers of boards of intermediate
and secondary education (BISEs) seem to revolve
around initial two phases of cognitive domain
although; much has been written in the syllabus about
objectives of teaching Mathematics at secondary
level.
Method
The study was carried out as below.
Participants
The total 59,168 students of grade 9 admitted to
718 secondary schools for session 2010-11 in the
jurisdiction of Bahawalpur division comprised the
population of the study. Further, 405 boys and 313
girls secondary schools were classified locality-wise
and ownership-wise to ensure the presence of
categorical subgroups of interest in the sample. The
cluster sampling was used to select randomly 3
schools from each category. All the students of grade
9 of these schools were included in the sample. The
categorical breakdown of the sample is given in the
table.

Breakdown of Sample
Sex-wiseRepresentation
Residence-wiseRepresentation
Institution-wiseRepresentation
Males Females Rurals UrbansPublic
SchoolsPrivateSchools
333(51.87%)
309(48.13%)
326(50.78%)
316(49.22%)
345(53.74%)
296(46.26%)
Total 642 Total 642 Total 642
Instrument
Two test forms entitled test form A and test
form B equivalent in content and format, each
bearing 45 items were developed from the
prescribed textbook of Mathematics for grade 9,
retaining a recommended proportion among
various content areas and focusing instructional
objectives. During pilot testing, two items from
each test form were debarred owing to textual and
structural complexities. To compensate curtailing,
some items were replaced to retain equivalence in
test forms. Some other items were rephrased for
clarity. The final draft of each test form comprised
43 items (see appendix). In this way, the intended
test to be semi-standardized consisted of 86 items.
The test was administered in the form of two
separately-timed tests. The reliability coefficient
remained 0.92 when calculated with
alternate-forms method
Teachers of Mathematics and researchers were
consulted to incorporate their judgment for the
validation of the tool. Certain arguments, claims
and previous evidences were considered in this
regard in a panel discussion. Replacing and
rephrasing of items in the initial draft of the tool as
suggested by experts were made to cover defined
objectives for the teaching of Mathematics and
ensure due weightage among various componential
content areas of the prescribed text as Sets 18 items,
Systems of Real Numbers 8 items, Logarithms 12
items, Algebraic Expressions and Factorization 18
items, Matrices and Determinants 12 items, and
Geometry 18 items. Each test item of the tool with
its difficulty logit (di), Model error estimate (SE),
average logit noise (|K|), infit mean-square (vi) and
outfit mean-square (ui) respectively is as under.
Procedure
The heads of the sampled schools wereconsulted in advance to seek permission for the
administration of componential tests with the
assistance of concerned class teachers. Each time
and elsewhere, the sub tests were got attempted in
3rd and 4th periods in two consecutive days. The time
allowed was one hour and twenty minutes, out of
which 20 minutes were specified for instruction and
seating arrangements, while 1 hour was for filling
the profile page and attempting the test. Efforts
were made to keep instructions uniform and orderly.
A usual but fair and conducive environment was
ensured to secure the external validity of the test.
Data Analysis and Results
In this study, difficulty logits for 86 items ranged
from-1.40 to 0.89 with a mean 0.003 as shown in
table 1. Item 68 with difficulty logit-1.40 happened
the easiest. It was respondent correctly by 529
students out of 642. The item 16 was the hardest
with a logit value 0.89 which was marked correct
only by 246 respondents out of 642. Difficulty

JRRE Vol.9, No.2,2015
89
logits for the remaining 84 items were found
between these two extremes. It was concluded that
all items were moderate in terms of difficulty. No
need was felt to exclude any item from the test
owing to its difficulty or ease.
In contrast to item difficulties, ability logits were
more dispersed on both sides with values-1.67 to
4.83 around a mean 0.06. The minimum earned
score by any respondent was 15 and the maximum
was 85 out of total score 86. The distribution of
respondents’ earned scores on the test was almostnormally distributed. It means that the sample was
adequately representative.
Model error estimates determine the accuracy of
measurement. Their low values indicate exactness
and accuracy in item difficulty and respondents’ability measurement. In current study, error
estimates for items remained low and consistent
with the mean value 0.09. It means that difficulty
logits were measured more precisely and sharply.
Two things cause this precision. One was the
appraisal of each test item by 642 respondents with
varied range of abilities due to a big and
representative sample. The other was the matching
between difficulty and ability logits due to moderate
nature of many test items.
The average Model error estimates remained
high i.e., 0.29 for ability measures. It means that
respondents’ abilities were not measured asprecisely as item difficulties. The cause behind the
phenomenon was that each respondent encountered
only 86 items, with relatively condensed range of
difficulties.
The “logit noise” is a simple measure offit-statistics introduced by Karabatsos (2000). It
uses the same scale to calculate misfit as used for
difficulty and ability logits. A positive value denotes
that response is above the expectation of the model
and vice versa. A zero reflects fit of response with
the model.
The average logit noise remained 0.18 for items
and 0.27 for respondents in current study as shown
in table 1. It means that there was less distortion in
difficulty measurement than ability measurement.
Hence, difficulty logits were measured more
precisely. It is notable that all the determinants of
Model error estimates for difficulties and abilities
work alike in the quantification of logit noise values
due to the use of same scale “logits” and the samelatent continuum for these. That is why; this method
is termed as “Fit-analysis through Rasch Measures.”This method has its own limitations. It is hard to say
that the average logit value 0.18 for items and 0.27
for respondents are good or bad indicators of the fit
phenomena because no unanimous norms are
available to decide about acceptable distortion.
Further, overfits (positive values) or underfits
(negative values) are jumbled due to taking both
values positive in the calculation of average
“absolute value” of logit noise (misfit). The averagelogit noise can be calculated for an item or the entire
test or in turn, for a respondent or the entire sample.
Owing to mentioned deficiencies, chi-square
fit-statistics is much better than this method.

Sadiq, Tirmizi, Jamil
90
Table 1
Summary Statistics for Test Items and Respondents
Sr. No. Statistics Aspects No. of CasesRange of Values
Minimum Maximum Mean Value
1 Difficulty Logits (di) Items 86 -1.40 0.89 0.003
2 Ability Logits (bv) Persons 642 -1.67 4.83 0.06
3 Model Error Estimates (SE) Items 86 0.09 0.12 0.09
4 Model Error Estimates (SE) Persons 642 0.23 1.05 0.29
5 Average Logit Noise |K| Items 86 0.06 0.37 0.18
6 Average Logit Noise |K| Persons 642 0.23 0.34 0.27
7 Infit Mean Square (vi) Items 86 0.74 1.12 0.93
8 Outfit Mean Square (ui) Items 86 0.56 1.22 0.92
9 Infit Mean Square (vi) Persons 642 0.93 1.19 1.05
10 Outfit Mean Square (ui) Persons 642 0.49 1.62 1.08
In chi-square fit-statistics method, the ideal
index for average infit and outfit mean-squares is
1.00. However, fluctuation with a range 0.70-1.30 is
admissible around the ideal fit 1.00. The criteria are
same both for item and person measures. The “infit”accounts for the middle of the difficulty or ability
scale while “outfit” covers the extremes of thesescales.
In this study, the average infit mean-square was
0.93 for items as shown in table 1. The individual
test item measures also remained within the
prescribed limit 0.70-1.30. Hence, no overfit or
misfit was observed. Simply, middle of the
difficulty scale met Rasch assumptions adequately.
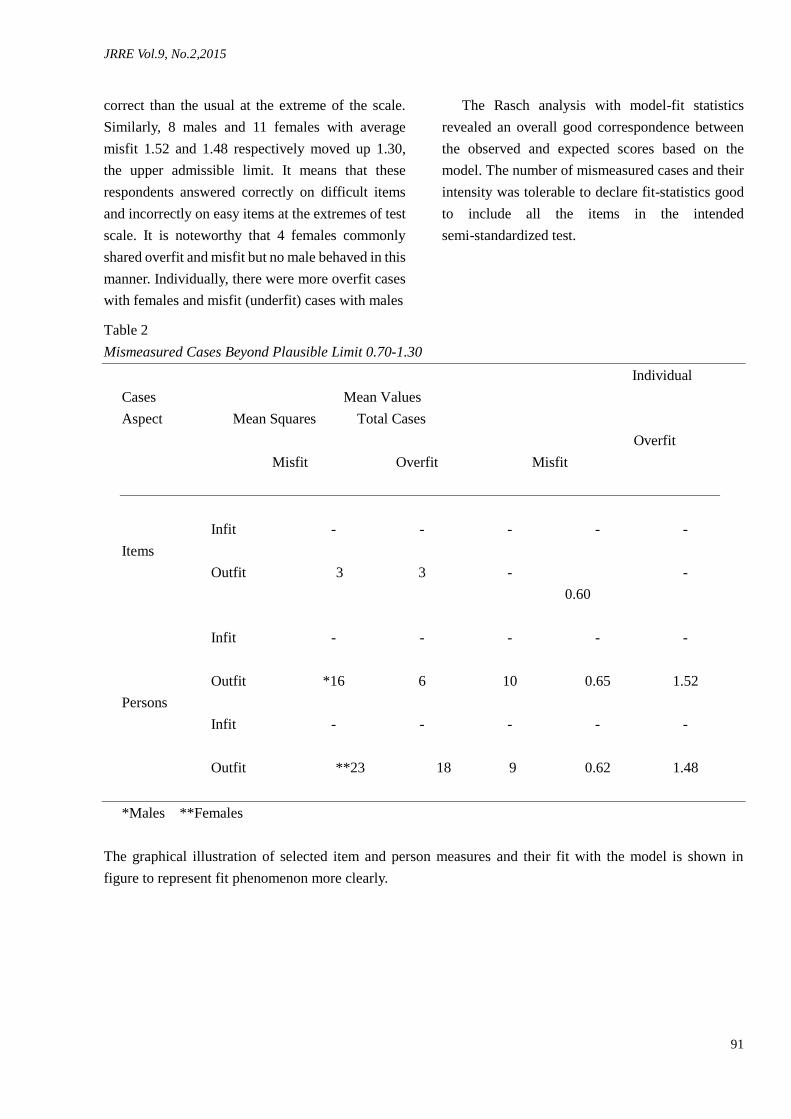
The case was not the same with outfit
mean-squares. The average outfit mean square
remained 0.92. Three individual test items 2,11 and
60 violate the Rasch assumptions with an average
value of 0.60 falling below 0.70, the lower
admissible limit as shown in table 2. It indicated an
overfit i.e., the responses on these items were more
correct than the usual at the extremes of the test
scale.
Again in current study, the average infit
mean-square was 1.05 for respondents. The
individual respondents’ ability measures alsoremained within the prescribed limit 0.70-1.30.
Hence, no overfit or misfit was observed. Simply,
middle of the ability scale met Rasch assumptions
sufficiently.
The case was not same with outfit mean-squares.
The average outfit mean-square remained 1.08.
Individually, 8 males and 18 females with average
overfit 0.65 and 0.62 respectively falling below
0.70, the admissible lower limit as shown in table 2.
It means, responses of these respondents were more
JRRE Vol.9, No.2,2015
91
correct than the usual at the extreme of the scale.
Similarly, 8 males and 11 females with average
misfit 1.52 and 1.48 respectively moved up 1.30,
the upper admissible limit. It means that these
respondents answered correctly on difficult items
and incorrectly on easy items at the extremes of test
scale. It is noteworthy that 4 females commonly
shared overfit and misfit but no male behaved in this
manner. Individually, there were more overfit cases
with females and misfit (underfit) cases with males
The Rasch analysis with model-fit statistics
revealed an overall good correspondence between
the observed and expected scores based on the
model. The number of mismeasured cases and their
intensity was tolerable to declare fit-statistics good
to include all the items in the intended
semi-standardized test.
Table 2
Mismeasured Cases Beyond Plausible Limit 0.70-1.30
Individual
Cases Mean Values
Aspect Mean Squares Total Cases
Overfit
Misfit Overfit Misfit
Infit - - - - -
Items
Outfit 3 3 -
0.60
-
Infit - - - - -
Outfit *16 6 10 0.65 1.52
Persons
Infit - - - - -
Outfit **23 18 9 0.62 1.48
*Males **Females
The graphical illustration of selected item and person measures and their fit with the model is shown in
figure to represent fit phenomenon more clearly.

Sadiq, Tirmizi, Jamil
92
Discussion and Recommendations
The researcher describes a quantitative
approach through the lens of Rasch measurement
theory for developing a semi-standardized test in
Mathematics at grade 9. A secondary purpose was
categorical comparison of respondents’performance on the test. No significant difference
of performance was seen gender-wise and
locality-wise. In this way, the substantive results of
the study remained consistent with Ahmad (2004)
and Ali (2008) who concluded the very same from
their studies. The “norms” of a standardized testgive meanings to raw scores of subsequent test
takers. For this, respondents’ raw scores on the testwere transformed to percentile ranks and T scores
in a table annexed with the study. The mean,
standard deviation and standard error of
measurement of this semi-standardized test
remained 48.92, 14.63 and 0.577 respectively to
serve as standard frame of reference for
comparison.
The underlying themes of Rasch modelling
reveal that it is considerable to address
measurement problems faced in Pakistan. At
present, boards of intermediate and secondary
education (BISEs) do not equalize difficulty level
of their question papers in different subjects for
secondary and intermediate examinations.
Consequently, the question paper in a particular
subject in one board may be comparatively
difficult, moderately difficult in other board and
considerably easy in another board. The same is
true of question papers of group I and group II in
the same board in subjects with heavy enrolment.
Owing to this, examinees suffer in two ways.
Overall positions in each board are severely
disturbed. For example, overall first position in the
board of a pre-engineering student may be scored
due to easiness of question paper in Mathematics
than that of Biology of a medical student. The
phenomenon is more confused for position holders
of general science and humanities where elective
subjects are so many. Luck seems to favour
particular students due to appearing in particular
subjects. Secondly, merit for medical, engineering
and other competitive programs becomes
JRRE Vol.9, No.2,2015
93
ridiculous when candidates passing from different
boards are rated at the face value of their marks
overlooking the passing board and difficulty of its
question papers. Owing to this, many admission
seekers are deprived of their right while others are
favoured unintentionally. All this demands that
there is need to recognise merit prior to ascertain it.
The situation is not different with recruitment
through Punjab Public Service Commission.
Numerous candidates apply for some posts.
Constraints of infrastructure compel administration
to conduct the written test in two groups for the
same post. Each group is assessed with a different
paper on MCI format. No conscious effort is made
to adjust the difficulty level of intended tests. Luck
or hardluck is greatly tied to appear in a particular
group. The affected candidates feel this
controversy and even unfold it informally but all in
vain. Further, in Pakistan, the National Testing
Service (NTS) has been assigned the responsibility
to conduct eligibility test for admission to M.A.,
M.Sc., M.Phil. and Ph.D. programs of various
universities. The test results remain valid for two
years. The NTS arranges four test yearly for the
same purpose. In this way eight tests are
administered in two years. Undoubtedly, these tests
vary in difficulty. The claim is evident from varied
corresponding percentile ranks of same raw scores
on different tests, assuming the normality of
distributions due to heavy participation each time.
The universities use raw scores of these tests to
determine merit for admission. Once again, fortune
or misfortune works. Candidates passing from
separately-timed tests may reap the benefit of
appearing in a particular test and vice versa.
The above scenario reflects need for fair and
meritorious attempts. First of all,
acknowledgement of the bitterness of current
practices is necessary to move ahead. Next steps
might be assigning the critical task of item writing
to professionals instead of laymen,
reconsideration of previous test items to note flaws
to have insight in subsequent item writing, panel
discussion on written items to refine and enrich
these, proportional representation of cognitive
levels in item writing, preparation of quality
booklets bearing principles and practical examples
of test item writing in various subjects, holding
workshops for the orientation of the test developers,
preparation of item banks for different purposes
and thoughtful allocation of final items in terms of
difficulty and cognitive level to all intended
question papers. Besides these technical tips,
human factors like sincerity, enthusiasm, devotion
and sense of responsibility can add to this art. All
the above points are worthy of consideration but
there lies one thing more. This is the empirical
touch to test items. It will reveal the
appropriateness of our claims and logic for the task
of judgmental calibration. The researcher means
test equating with the help of “linking items” andfit trial of constituting items.
Masters and Keeves (1999) state three methods
of test equating. One is “common item thresholddifference method.” In this method, two sets ofitems with purposely chosen sufficient common
items are separately calibrated. The average
threshold difference between common items of two
tests is calculated as the equating constant between
the two scales. The common items between two
sets also assist to know error estimates with mean
difference. The second method is called “anchoritem equating method.” In this method, one set ofitems is calibrated to form a scale. The threshold
values of particular items in the calibrated set
which are same to other set are used in the
calibration of the second set of items. Another,
computer-based readily applied method is
“concurrent equating method.” It combines manydata sets with common items in a way that a single
calibration of all data sets is undertaken. Owing to
the large storage capacity of computer, intended
data sets are brought to a common scale. The
procedure ascertains more consistent and stronger

Sadiq, Tirmizi, Jamil
94
measures of items in various equated data sets
(Baker & Al-Karni, 1993).
In Pakistan, each BISE may use one of the first
two methods to equate its question papers of first
group and second group in the subjects with heavy
enrolment at secondary and intermediate level. The
Punjab Public Service Commission may repeat the
same practice for its tests in two groups against the
same post. The third method is feasible for
inter-boards equivalence of question papers in the
same subject where at least ten papers are needed.
It is equally beneficial for NTS to equal all the
intended tests for candidates seeking admission to
the same program. The researcher suggests four
precautions to work with these methods. These are
scatter positioning of “linking items” in the test,coverage of same cognitive levels in common
items as in the total test, forestalling the occurrence
of probable breaches of test security for two
separately-timed tests and restrain students from
cheating, a bitter experience in Pakistan.
The major recommendations emerged from the
study were its replication, its conduction at other
times during the session to examine possible
differences, province wide and countrywide
expansion of the study to set respective level
norms, diagnosing the causes of overfit or underfit
for items and persons, suggesting BISEs to use
gratis data for research and calibration, and using
advanced software for intensive, excessive and
speedy data analysis. Prospective researchers are
suggested to expand the use of Rasch measurement
theory to calibrate test items in different disciplines
for reliable results. Further, the need is to make
Rasch’s Partial Credit Model customary tocalibrate short answer questions.
References
Ahmad, K. (2004). Calibration of
Mathematics Test for Secondary School Stage,
Unpublished M.Phil. Education Thesis, Department
of Education, Multan: Bahauddin Zakariya
University.
Ali, M.J. (2008). A Comparative Study of
Scholastic Achievement of Students of Secondary
Schools in Rural and Urban Areas in the Subject of
Math, Unpublished Thesis M.Phil. Education,
Department of Education, Multan: Bahauddin
Zakariya University.
Alper, S., Ryndak, D.L. and Schloss, C.N.
(2001). Alternative Assessment of Students with
Disabilities in Inclusive Settings, Needham Hights,
MA: Allyn and Bacon.
Athanasou, J. and Lamprianou, I. (2009). A
Teacher’s Guide to Assessment. 2nd ed., Victoria:
Thomson.
Baghaie, P. (2008). Local Dependency and
Rasch Measures, Rasch Measurement Transactions
21:3 retrieved from
www.rasch.org/rmt/rmt213b.htm on17-10-12
Baker, F.B. and Al-Karni (1991). A comparison
of two procedures for computing IRT equating
coefficients, Journal of Educational Measurement
28 (2), 147-162.
Bond, T.G. and Fox, C.M. (2007). Applying the
Rasch Model: Fundamental Measurement in
Human Sciences 2nd, Mahwah, NJ: Erlbaum.
Carr, C.S. and Connie, L.F. (2004). Educational
Leadership: Knowing the Way, Showing the Way,
Going the Way, Fulmer: Rowman and Littlefield.
Crisp, G. (2007). The e-Assessment Handbook,
New York: Continuum.
Earl, L.M. (2003). Assessment as Learning:
Using Classroom Assessment to Maximize Student
Learning, Thousand Oaks,CF: Corwin Press Inc. A
Sage Publishing Company.
Granger, C.V. (2008). Rasch analysis is
important to understand and use for measurement,
Rasch Measurement Transactions 21:3 retrieved on
17-10-12 from www.rasch.org/rmt/rmt213d.htm

JRRE Vol.9, No.2,2015
95
Haladyna, T.M. and Rodriguez, M.C. (2013).
Developing and Validating Test Items, Abingdon
(Oxon): Routledge.
Hoffman, E. (2004). A Psychological Testing at
Work, New Dehli: Tata McGraw-Hill Publishing
Company Limited.
Kaplan, R.M. and Saccuzzo, D.P. (2007).
Psychological Testing: Principles, Applications
and Issues, 5th ed., Belmont: Wadsworth/ Thomson
Learning.
Karabatsos, G. (2000). Using Rasch Measures
for Rasch Model Fit Analysis, Popular
Measurement, Vol.3, 70-71
Krenier, S. (2012). George Rasch and Item Fit,
Rasch Measurement Transactions 26:1 retrived
from www.rasch.org/rmt/rmt261b.htm on 17-10-12
Kubiszyn, T. and Borich, G. (2010).
Educational Testing and Measurement: Classroom
Application and Practice, 9th ed., Haboken, NJ:
John Wiley and Sons.
Linn, R.L. and Gronlund, N.E. (2005).
Measurement and Assessment in Teaching 8th ed.,
Dehli: Pearson Education (Indian Reprint).
Masters, G.L. and Keeves, J.P. (1999).
Advances in Measurement in Educational Research
and Assessment, Amsterdam: Pearson Education
Inc.
McArthur, D.L. (1987). Alternative Approaches
to the Assessment of Achievement, Boston: Kluwer
Academic Publishers.
Mehrens, W.A. and Lehmann, I.J. (1973).
Measurement and Evaluation in Education and
Psychology, New York: Holt, Rinehart and
Winston.
Mrunalini, T. (2011). Educational Evaluation,
New Dehli: Neelkamal Publication Pvt. Ltd.
Ormrod, J.E. (2012). Essentials of Educational
Psychology: Big Ideas to Guide Effective Teaching,
Boston, MA: Pearson.
Paratore, J.R. and McCormack, R.L. (2007).
Classroom Literacy Assessment: Making Sense of
What Students Know and Do, New York: The
Gulford Press.
Popham, W.J. (1981). Modern Educational
Measurement, Englewood Cliffs, NJ: Prentice
Hall Inc.
Rasch Measurement Transaction (2006). Rasch
Too Complicated or Too Simple? Rasch
Measurement Transactions 20:3 retrieved on
17-10-12 from www.rasch.org/rmt/rmt203b.htm
Rasch, G. (1960 / 1980). Probabilistic Models
for Some Intelligence and Attainment Tests,
Chicago, IL: University of Chicago Press.
Riaz, M.N. (2008). Test Construction:
Development and Standardization of Psychological
Tests in Pakistan, Islamabad: Higher Education
Commission.
Salkind, N.J. (2007). Encyclopedia of
Measurement and Statistics Vol.3, Thousand Oaks:
SAGE Publications.
Slavin, R.E. (2012). Educational Psychology:
Theory and Practice 10th ed., Boston: Pearson.
Stanley, J.C. and Hopkins K.D. (1978).
Educational and Psychological Measurement and
Evaluation, New Dehli: Prentice-Hall of India
Private Limited.
Stobart, G.(2008). Testing Times: The Uses and
Abuses of Assessment, 1st ed., Abingdon (Oxon):
Routledge.
Stobart, G. and Gispps, C. (1997). Assessment:
A teacher’s guide to the issues, 3rd ed., London:
Hodder & Stoughton Education.
Thorndike R.M. (2005). Measurement and
Evaluation in Psychology and Education 7th ed.,
Sadiq, Tirmizi, Jamil
96
Columbus, ohio: Pearson Prentic-Hall.
Thorndike, R.L. and Hagen, E.P. (1977).
Measurement and Evaluation in Psychology and
Education 4th ed., New York: John Wiley and Sons.
Vogel, S.P. and Engelhard, Jr., G. (2011). Using
Rasch Measurement Theory to Examine Two
Instructional Approaches for Teaching and
Learning of French Grammar. Journal of
Educational Psychology, 104( 4), 267-82.
Wilkerson, J.R. and Lang, W.S. (2007).
Assessing Teacher Competency: Five
Standards-Based Steps to Valid Measurement
Using the CAATS Model, Thousand Oaks: Corvin
Press, A SAGE Publishing Company.
Wisniewski, D.R. (1992). Mathematical Models
and Measurement. Rasch Measurement
Transactions 5:4 retrieved on 17-10-12 from
www.rasch.org/rmt/rmt54f.htm
Woolfolk, A. (2011). Educational Psychology
9th ed., Noida, UP: Dorling Kindersley Licensees of
Pearson Education.
Wright, B.D. (1967). Sample-Free Test
Calibration and Person Measurement, Research
Memorandum No. 1, Chicago: MESA Psychometric
Laboratory retrieved on 14-10-12 from
www.rasch.org/memo1.htm
Wright, B.D. (1978). The Rasch Model for Test
Construction and Person Measurement, Prepared
for Fifth Annual Conference and Exhibition on
Measurement and Evaluation, March 14, 1978. Los
Angeles: Office of the Los Angeles Country
Superintendents of Schools Division of Program
Evaluation, Research and Pupil Services

JRRE Vol.9, No.2,2015
97
Appendix
Test Form A
Subject: Mathematics Level: Grade 9 No. of Items: 43
Time:1 Hour
Note: Each item bears four responses a,b,c and d. Encircle the correct one. Please note that omitted items
will be treated as incorrect.
Sets di, SE, |K|, vi, ui
1 The notation of the set of integers is (0.38, 0.09, 0.18, 0.86, 0.78)
(a) E (b) P (c) O (d) Z
2 Null set is denoted with the symbol (-0.48, 0.10, 0.09, 0.74, 0.59)
(a) { } (b) { 0 } (c) 0 (d) { Ф }3 If the number of elements in a set A are "n" then the number of elements in P (A) will be
(0.24, 0.09, 0.15, 0.85, 0.86)
(a) n2 (b) 2n (c) 22n (d) 2n
4 Tabular form of the set {x/xєN^10<x<15} is (0.10, 0.09, 0.22, 0.77, 0.82)
(a) {10,11,12,13,14} (b) {11,12,13,14,15}
(c) {11,12,13,14} (d) {10,11,12,13,14,15}
5 A set can be presented through (-0.87, 0.10, 0.06, 1.02, 1.07)
(a) Descriptive Method (b) Tabular Form
(c) Set Builder Notation (d) All the above methods
6 The point (2,4) lies in the _______quadrant of Cartesian co-ordinate system.
(-0.14, 0.09, 0.15, 0.92, 0.85)
(a) 1st (b) 2nd (c) 3rd (d) 4th
7 The number of elements in the domain set of the binary relations {(1,1),(2,_1),(2,_3)} is
(0.47, 0.09, 0.20,0.76, 1.10)
(a) 2 (b) 3 (c) 4 (d) 6
8 The symbol '^' stands for (-0.52, 0.10, 0.21, 0.82, 0.94)
(a) or (b) and (c) less than (d) greater than
9 Sets are usually denoted by ________ alphabets. (-1.05, 0.11, 0.16, 0.93, 0.87)
(a) Latin (b) Greek (c) English (d) Arabic
Systems of Real Numbers
10 Multiplicative inverse of is (0.29, 0.09, 0.13, 0.90, 0.92)
(a) - (b) (c) -a (d) a
11 (4)3 equals to (-0.08, 0.09, 0.28, 0.79, 0.64)
(a) 4 (b) 4 (c) 4 (d) 412 X2/3 can be written as (0.38, 0.09, 0.19, 0.87, 0.80)
(a) √X / (b) 2√ (c) 3√ (d) (√ )
13 If x=4- 15, then the value of is (0.60, 0.09, 0.20, 0.86, 1.12)

Sadiq, Tirmizi, Jamil
98
(a) 1/4-√15 (b) 1/4+√15 (c) -4+√15 (d) 4+√15Logarithms
14 Antilogarithm table was developed by (-0.64, 0.10, 0.12, 0.95, 0.84)
(a) Jobst Burgi (b) Henry Briggs (c) John Napier (d) Al Khwarizmi
15 The common form of 8.24 x10 is (0.70, 0.09, 0.17, 1.06, 1.06)
(a) 82400 (b) 0.000824 (c) 0.0000824 (d) 8240000
16 The logarithmic form of 4 =64 is (0.89, 0.09, 0.37, 1.12, 1.15)
(a) log3 64=4 (b) log3 4=64 (c) log4 64=3 (d) log4 3=64
17 The characteristics of log 325 is (-0.33, 0.09, 0.16, 0.94, 1.13)
(a) 0 (b) 1 (c) 2 (d) 3
18 The single logarithmic form of log 5+log6-log2 is (0.47, 0.09, 0.16, 0.92, 0.92)
(a) log (b) log 5+6-2 (c) log 15 (d) log 9
19 If log x=3.6862, then its antilog 4855 with a right decimal point is (0.56, 0.09, 0.24, 0.79, 0.81)
(a) 48.55 (b) 485.5 (c) 0.004855 (d) 0.0004855
Algebraic Expressions and Factorization
20 The co-efficient in 3x2 is (0.24, 0.09, 0.15, 0.96, 0.90)
(a) 3 (b) x (c) 3x (d) 2
21 ___________ is a polynomial expression. (0.60, 0.09, 0.22, 1.09, 1.06)
(a) (b) 6x-2 (c) –x3 (d) 3x-2+ +2
22 Polynomial expressions can be classified with respect to (0.01, 0.09, 0.20, 1.06, 0.87)
(a) terms (b) variables (c) degrees (d) all the three
23 In algebraic expressions, ascending/descending order is made with respect to
(0.33, 0.09, 0.26, 0.99, 1.08)
(a) co-efficients (b) exponents (c) variables(d) something else
24 (a+b)2+(a-b)2 equals to (0.24, 0.09, 0.17, 0.90, 0.88)
(a) 4ab (b) 2(a2 + b2) (c) a4 – b4 (d) (a+b)4
25 In x 2-5 x +6/ x -2, x -2 is (0.01, 0.09, 0.17, 0.94, 0.82)
(a) dividend(b) divisor (c) quotient (d) remainder
26 If x + y=2 and xy =3, find the value of x 2+ y 2 (0.70, 0.09, 0.28, 1.08, 0.90)
(a) 10 (b) 6 (c) 2 (d) -2
27 Factorize x 2+ x -6 (0.24, 0.09, 0.14, 0.98, 0.93)
(a) (x +3) (x +3) (b) (x -3) (x -3) (c) (x +3) (x -3) (d) (x -2) (x +3)
28 Methods to find Least Common Multiple (LCM) are (-1.40, 0.12, 0.14, 0.89, 0.96)
(a) 2 (b) 3 (c) 4 (d) 5
Matrices and Determinants
29 Matrices were introduced by Mathematician (-0.08, 0.09, 0.09, 0.95, 0.79)
(a) Arther Kelley (b) Cramer (c) Demorgan (d) Euclid
30 A matrix with different number of rows and columns is called a_________ matrix
(-0.74, 0.10, 0.18, 1.01, 1.08)
(a) row (b) column (c) rectangular (d) square
JRRE Vol.9, No.2,2015
99
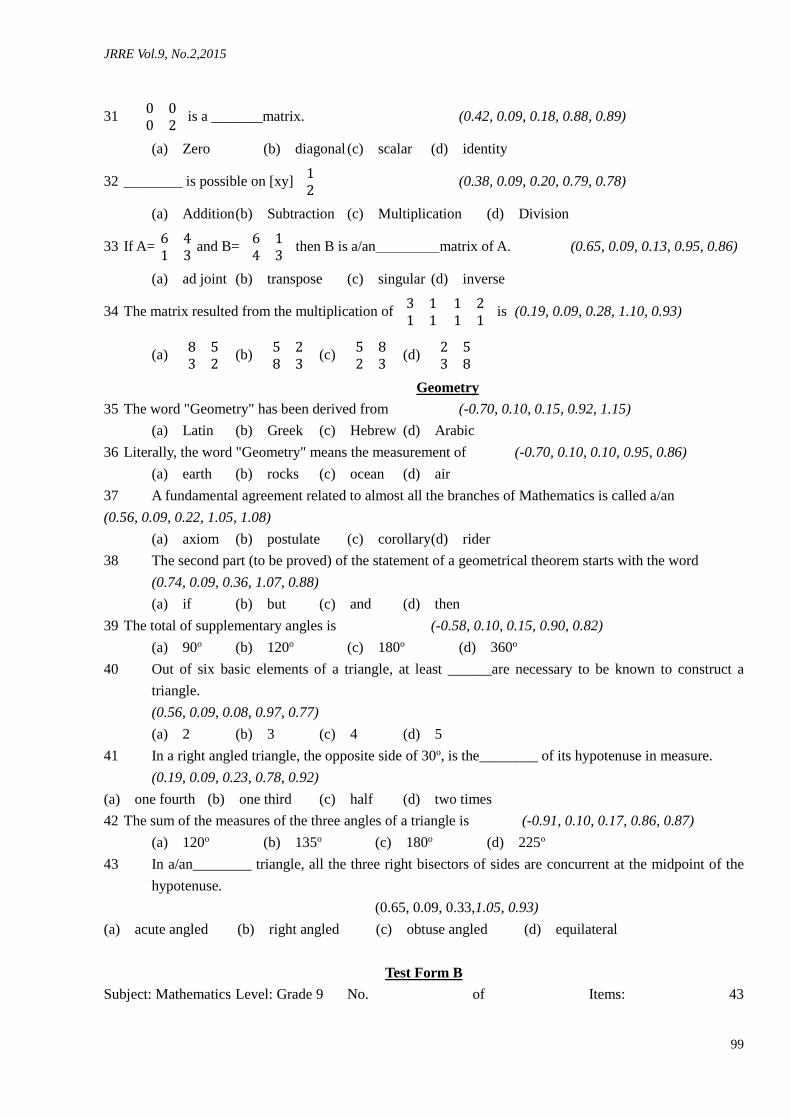
31 0 00 2 is a _______matrix. (0.42, 0.09, 0.18, 0.88, 0.89)
(a) Zero (b) diagonal (c) scalar (d) identity
32 ________ is possible on [xy] 12 (0.38, 0.09, 0.20, 0.79, 0.78)
(a) Addition(b) Subtraction (c) Multiplication (d) Division
33 If A= 6 41 3 and B= 6 14 3 then B is a/an matrix of A. (0.65, 0.09, 0.13, 0.95, 0.86)
(a) ad joint (b) transpose (c) singular (d) inverse
34 The matrix resulted from the multiplication of 3 11 1 1 21 1 is (0.19, 0.09, 0.28, 1.10, 0.93)
(a) 8 53 2 (b) 5 28 3 (c) 5 82 3 (d) 2 53 8Geometry
35 The word "Geometry" has been derived from (-0.70, 0.10, 0.15, 0.92, 1.15)
(a) Latin (b) Greek (c) Hebrew (d) Arabic
36 Literally, the word "Geometry" means the measurement of (-0.70, 0.10, 0.10, 0.95, 0.86)
(a) earth (b) rocks (c) ocean (d) air
37 A fundamental agreement related to almost all the branches of Mathematics is called a/an
(0.56, 0.09, 0.22, 1.05, 1.08)
(a) axiom (b) postulate (c) corollary(d) rider
38 The second part (to be proved) of the statement of a geometrical theorem starts with the word
(0.74, 0.09, 0.36, 1.07, 0.88)
(a) if (b) but (c) and (d) then
39 The total of supplementary angles is (-0.58, 0.10, 0.15, 0.90, 0.82)
(a) 90o (b) 120o (c) 180o (d) 360o
40 Out of six basic elements of a triangle, at least ______are necessary to be known to construct a
triangle.
(0.56, 0.09, 0.08, 0.97, 0.77)
(a) 2 (b) 3 (c) 4 (d) 5
41 In a right angled triangle, the opposite side of 30o, is the________ of its hypotenuse in measure.
(0.19, 0.09, 0.23, 0.78, 0.92)
(a) one fourth (b) one third (c) half (d) two times
42 The sum of the measures of the three angles of a triangle is (-0.91, 0.10, 0.17, 0.86, 0.87)
(a) 120o (b) 135o (c) 180o (d) 225o
43 In a/an________ triangle, all the three right bisectors of sides are concurrent at the midpoint of the
hypotenuse.
(0.65, 0.09, 0.33,1.05, 0.93)
(a) acute angled (b) right angled (c) obtuse angled (d) equilateral
Test Form B
Subject: Mathematics Level: Grade 9 No. of Items: 43

Sadiq, Tirmizi, Jamil
100
Time:1 Hour
Note: Each item bears four responses a,b,c and d. Encircle the correct one. Please note that omitted items
will be treated as incorrect.
Sets
1/44 {0,1,2,3,……….} is a set of……………….numbers. (0.10, 0.09, 0.13, 0.98, 1.06)
/(a) whole (b) natural (c) prime (d) real
2/45 Symbol stands for (-0.33, 0.09, 0.11, 0.98, 0.85)
(a) proper set. (b) equal set. (c) sub set. (d) universal set.
3/46 If the number of elements in a set A is ‘m’ and in a set B is ‘n’, then the number of elements in AxBwill be
(0.15, 0.09, 0.18, 0.96,0.85)
(a) 2 (b) 2 (c) 2 × (d) 2 ÷4/47 The set building notation of the set {2,3,5,7,11} is (-0.03, 0.09, 0.28, 0.86, 1.12)
(a) {x/x є P 3≤x≤7} (b) {x/x є P 2≤x≤7} (c) {x/x є P 3≤x≤11} (d) {x/x є P 2≤x≤11}5/48 The methods to present a set are (-1.05, 0.11, 0.11, 0.93, 0.75)
(a) 2 (b) 3 (c) 4 (d) 5
6/49 Point ____________ lies in the third quadrant of Cartesian co-ordinate system.
(0.10, 0.09, 0.18, 0.95, 0.84)
(a) (2,3) (b) (-2,3) (c) (2,-3) (d) (-2,-3)
7/50 The number of elements in the range set of the binary relations {(1,-1), (2,1), (2,-3)} is
(0.24, 0.09, 0.20, 1.03, 0.88)
(a) 2 (b) 3 (c) 4 (d) 6
8/51 The symbol ‘U’ denotes __________ set. (-1.12, 0.11, 0.12, 0.92, 0.76)
(a) union (b) intersection (c) subset (d) universal set
9/52 The right presentation of a set is (-0.23, 0.09, 0.14, 0.95, 0.86)
(a) A={a,b,c,d} (b) a={a,b,c,d} (c) A={A,B,C,D} (d) a={A,B,C,D}
Systems of Real Number
10/53 The set has no closure property with respect to addition and multiplication
(-0.14, 0.09, 0.09, 0.84, 0.99)
(a) {0} (b) {0,1} (c) {1,0} (d) {0,-1}
11/54 3x10o is equal to (0.19, 0.09, 0.15, 0.89, 0.91)
(a) 0 (b) 3 (c) 30 (d) 300
12/55 √ × √ equal to (0.33, 0.09, 0.18, 1.00, 1.00)
(a) (b) 2x (c) x (d) √213/56 If x= 2+√3, then the value of x+ is (0.47, 0.09, 0.14, 0.77, 0.82)
(a) 2-√3 (b) 4 (c) 2 √3 (d) 2x
Logarithms
14/57 The base of common logarithm is (-0.70, 0.10, 0.15, 0.86, 0.78)
(a) e (b) 2 (c) 5 (d) 10
15/58 The scientific notation of 99.99 is (0.24, 0.09, 0.24, 0.94, 0.90)
(a) 9.999x10 (b) 9.999x10⁻¹ (c) 9.999x10³ (d) 9.999x10⁻³

JRRE Vol.9, No.2,2015
101
16/59 The value of x for log2 x=5 is (0.51, 0.09, 0.21, 0.99, 1.06)
(a) 7 (b) 10 (c) 25 (d) 32
17/60 The logarithmic statement with characteristics -2 is (-0.14, 0.09, 0.09, 0.83, 0.56)
(a) log25 (b) log 0.07835 (c) log 400.3 (d) 0.00329
18/61 If log3= 0.4771 and log5= 0.6990, then the value of log 5√3 is (0.65, 0.09, 0.28, 1.04, 0.98)
(a) 0.5881 (b) 1.1595 (c) 0.4604 (d) 0.1110
19/62 The statement with the greatest antilog value is (0.47, 0.09, 0.14, 0.86, 0.96)
(a) log 3.2201 (b) log 5.4654 (c) log 0.9837 (d) log 0.09999
Algebraic Expressions and Factorization
20/63 Polynomial expression 3 +4y+6z+1 bears ____________ variables. (-0.38, 0.09, 0.32, 0.79, 1.15)
(a) 2 (b) 3 (c) 4 (d) 7
21/64 5x+ is polynomial with co-efficient as ___________ numbers. (0.42, 0.09, 0.23, 0.92, 0.93)
(a) natural (b) rational (c) irrational (d) integral
22/65 The degree of the polynomial expression 5x3yz5 is (0.01, 0.09, 0.18, 0.91, 0.86)
(a) 5 (b) 8 (c) 9 (d) 10
23/66 The ascending order of algebraic expression y4-6-4y+ + + is (0.29, 0.09, 0.27, 1.07, 1.17)
(a) + + -6-4y+y4 (b) y4-4y-6+ + +
(c) -6-4y+y4 + + + (d) + + +y4-4y-6
24/67 (a+b) (a2 – ab+b2) equals to (0.19, 0.09, 0.21, 0.97, 0.82)
(a) (a+b)3 (b) (a-b)3 (c) a3 - b3(d) a3+b3
25/68 Solve 3x2y2 ÷ 3xy3 (-1.40, 0.12, 0.13, 1.00, 0.95)
(a) x/y (b) y/x (c) x3y5 (d) 1/x3y5
26/69 Find the value of ‘n’ to make x2 +x-n a complete square. (0.51, 0.09, 0.26, 0.84, 0.87)
(a) 1/4 (b) 1/8 (c) –1/4 (d) – 1/8
27/70 Factorize x3+125 (0.10, 0.09, 0.13, 0.95, 0.85)
(a) (x+5) (x2-5x+25) (b) (x-5) (x2+5x+25)
(c) (x+5) (x2+5x+25) (d) (x-5) (x2-5x-25)
28/71 If AxB=LxH, then A will be equal to (-0.98, 0.09, 0.15, 1.02, 0.94)
(a) B/LxH (b) LxH/B (c) BxH/L (d) BxL/H
Matrices and Determinants
29/72 Matrices are typically used in (-0.14, 0.09, 0.07, 0.99, 1.02)
(a) Engineering and Medical. (b) Mathematics and Physics.
(c) Economics and Biology. (d) Statistics and Chemistry.
30/73 Two matrices are said to be equal if there ___________ are equal. (0.10, 0.09, 0.18, 0.95, 1.21)
(a) rows (b) columns (c) corresponding elements (d) all the three
31/74 2 00 2 is a __________ matrix. (-0.42, 0.09, 0.16, 0.89, 0.87)
(a) scalar (b) diagonal (c) zero (d) identical
Sadiq, Tirmizi, Jamil
102
32/75 Which operations are possible on two matrices of the same order? (0.29, 0.09, 0.36, 1.09, 0.94)
(a) Addition and subtraction (b) Addition and multiplication
(c) Subtraction and multiplication (d) All mentioned operations
33/76 If A= and B= −− , then B is a/an______ matrix of A (0.06, 0.09, 0.16, 0.94, 0.91)
(a) inverse (b) transpose (c) ad joint (d) non-singular
34/77 If two matrices are multiplied, the numbers of columns of the resultant matrix are equal
(0.38, 0.09, 0.30, 0.87, 0.85)
(a) rows of the first matrix (b) columns of the first matrix
(c) rows of the second matrix (d) columns of the second matrix
Geometry
35/78 The pioneers of Geometry are (-0.87, 0.10, 0.20, 0.84, 1.03)
(a) Indians (b) Chinese (c) Egyptians (d) Germans
36/79 Euclid wrote an important book on Geometry entitled (-0.70, 0.10, 0.25, 1.04, 0.92)
(a) Concepts. (b) Elements. (c) Fundamentals. (d) Theorems.
37/80 If an assumption is correct, then the results obtained from it are also correct. This principle is
governed by _________ method.
(0.24, 0.09, 0.32, 0.79, 0.86)
(a) analysis (b) synthesis (c) analytic-synthetic (d) reductio-Ad-Absurdum
38/81 The number of elements for proving a geometrical theorem is (0.42, 0.09, 0.23, 0.86, 1.06)
(a) 4 (b) 5 (c) 6 (d) 7
39/82 40o and 50o are ____________ angles of each other (-0.48, 0.10, 0.12, 0.94, 0.87)
(a) supplementary (b) complementary (c) vertical (d) corresponding
40/83 In any triangle, at least two angles are _________ angles. (0.24, 0.09, 0.20, 0.88, 1.03)
(a) acute (b) right (c) obtuse (d) interior
41/84 The medians of a triangle intersect each other in a ratio of (0.33, 0.09, 0.15, 0.97, 0.76)
(a) 1:4 (b) 1:3 (c) 1:2 (d) 1:1
42/85 Each angle of an equilateral triangle is _________ in measure. (-0.70, 0.10, 0.18, 0.94, 0.91)
(a) 30o (b) 45o (c) 60o (d) 75o
43/86 In a/an _______ triangle, all the three right bisectors of the sides are concurrent at a point lying
within the triangle.
(0.51, 0.09, 0.30, 1.05, 0.08)
(a) right angled (b) acute angled (c) obtuse angled (d) all the three