using remote sensing and gis to detect and monitor land...
TRANSCRIPT

Using remote sensing and GIS to detect and monitor landuse and land cover change in Dhaka Metropolitanof Bangladesh during 1960–2005
Ashraf M. Dewan & Yasushi Yamaguchi
Received: 16 November 2007 /Accepted: 1 February 2008 / Published online: 4 March 2008# Springer Science + Business Media B.V. 2008
Abstract This paper illustrates the result of land use/cover change in Dhaka Metropolitan of Bangladeshusing topographic maps and multi-temporal remotelysensed data from 1960 to 2005. The Maximumlikelihood supervised classification technique wasused to extract information from satellite data, andpost-classification change detection method wasemployed to detect and monitor land use/coverchange. Derived land use/cover maps were furthervalidated by using high resolution images such asSPOT, IRS, IKONOS and field data. The overallaccuracy of land cover change maps, generated fromLandsat and IRS-1D data, ranged from 85% to 90%.The analysis indicated that the urban expansion ofDhaka Metropolitan resulted in the considerablereduction of wetlands, cultivated land, vegetationand water bodies. The maps showed that between
1960 and 2005 built-up areas increased approximately15,924 ha, while agricultural land decreased 7,614 ha,vegetation decreased 2,336 ha, wetland/lowland de-creased 6,385 ha, and water bodies decreased about864 ha. The amount of urban land increased from11% (in 1960) to 344% in 2005. Similarly, the growthof landfill/bare soils category was about 256% in thesame period. Much of the city’s rapid growth inpopulation has been accommodated in informalsettlements with little attempt being made to limitthe risk of environmental impairments. The studyquantified the patterns of land use/cover change forthe last 45 years for Dhaka Metropolitan that formsvaluable resources for urban planners and decisionmakers to devise sustainable land use and environ-mental planning.
Keywords DhakaMetropolitan . Land use/cover .
Monitoring . Remote sensing . Change detection
Introduction
Land use/cover change analysis is an important tool toassess global change at various spatial–temporalscales (Lambin 1997). In addition, it reflects thedimension of human activities on a given environ-ment (Lopez et al. 2001). As global populationincreases rapidly, pressure exerts on the land resultingflimsy cohesion among environmental variables
Environ Monit Assess (2009) 150:237–249DOI 10.1007/s10661-008-0226-5
A. M. DewanDepartment of Earth and Environmental Sciences,Nagoya University,Furo-cho, Chikusa-ku, Nagoya 464-8601, Japan
Y. YamaguchiGraduate School of Environmental Studies,Nagoya University,Furo-cho, Chikusa-ku, Nagoya 464-8601, Japan
A. M. Dewan (*)Department of Geography and Environment,University of Dhaka,Ramna, Dhaka 1000, Bangladeshe-mail: [email protected]: [email protected]

(Green et al. 1994). The rapid changes of land use/cover than ever before, particularly in developingnations, are often characterized by rampant urbansprawling (Jat et al. 2008; Mundia and Aniya 2006),land degradation by agricultural development andtourism industry (Shalaby and Tateishi 2007), or thetransformation of agricultural land to shrimp farming(Ali 2006) ensuing enormous cost to the environment(Abduallah and Nakagoshi 2005). This kind ofchanges profoundly affects local and/or regionalenvironment, which would eventually affect theglobal environment. Human induced changes in landcover for instance, influence the global carbon cycle,and contribute to the increase in atmospheric CO2
(Alves and Skole 1996). It is therefore indispensableto examine the changes in land use/cover, so that itseffect on terrestrial ecosystem can be discerned, andsustainable land use planning can be formulated(Muttitanon and Tripathi 2005).
Like other developing countries, Bangladesh expe-rienced a fast increase of urban population in the recentdecades (14.1 million in 1981, 22.5 million in 1991,31.1 million in 2001; BBS 2001), and 35 million in2005 (CUS et al. 2006). Rapid urban growth leads tothe transformation of rural lands to built-up areas, andit is estimated that each year more than 809 km2 ofagricultural land is being diverted to cities, roads andinfrastructures in Bangladesh (BBS 1996). As agricul-ture is the mainstay of national economy, loss ofcultivated land becomes grave concern that cancontribute to the increase of landlessness and jeopar-dizing the economy. Furthermore, food shortage couldbe acute in the coming years, and it would be a greathurdle for Bangladesh to meet up the rising fooddemand for its ever growing population.
Dhaka, the capital of Bangladesh could be the bestillustration of human activities and associated envi-ronmental change. Dhaka is expanding apace, at anaverage rate of 4.24%/year and is projected to be thethird largest megacity in the world by the year 2020(World Bank 2007). The growth of the city isphenomenal after independence (Chowdhury andFaruqui 1989) and highest among other cities inBangladesh due to its socio-economic and politicalimportance. The growth is mainly attributed to thelarge influx of rural to urban migration (Islam 1996).The population of Dhaka increased from 556,712 in1961 to the current more than 12 million (World Bank2007). Rapid urbanization on the other hand, led to
the deterioration of city’s environment, particularlymounting flood risk potential (Dewan and Yamaguchi2007), severe environmental pollution (Karn andHarada 2001; Karim 1999; Azad and Kitada 1998),and spectacular growth of informal settlements (CUSet al. 2006; Islam 1996).
Even though most of the developed countries arewell equipped and updated with detailed land use/cover information, lack of and/or restricted access togeospatial database persists in developing nations,predominantly in Bangladesh. Aerial photograph, forinstance, absolutely classified for public. For thirdworld countries, remote sensing proved its effective-ness for spatial data updating (Dong et al. 1997) andparticularly to provide accurate and timely geospatialinformation illustrating land use/cover dynamics ofmetropolitan areas (Yang 2002). Unfortunately, nosuch application is available for Dhaka or its part forland use/cover change assessment. Few studieshowever, used the geospatial technique to addresssome environmental issues of Dhaka City (Dewan etal. 2007a, b; 2006, 2005; Kamal and Midorikawa2004; Maathuis et al. 1999). It is necessary to mentionhere that the city does not have any official statisticson land use pattern and even the Master Plans do notprovide either a map or a quantitative statement of theexisting land use (Islam 1996, 2005). Official land usestatistics of Dhaka Metropolitan seems to haveappeared in 1991 by ground observation (Islam1996; FAP 8A 1991). Many factors including finan-cial constraints, data scarcity, bureaucracy and/or lackof geoinformatics expertise in the planning agenciesare responsible for the absence of historical as well ascurrent land use/cover data. In addition, as many as18 ministries are effectively involved in developingDhaka (Mohit 1991) and such multiple involvementsobviously result in meager coordination. In effect, agood number of private organizations have beenevolved, generating “City Maps” by ground investi-gation and in an inefficient manner. Consequently,confusion and disparities in the data are widespreadand fairly misleading.
While current and accurate information on land use/cover is a prerequisite to the management and planningof urban areas, data paucity and up-to-date informationon land use/cover exist in Dhaka. In the absence ofsuch information, sustainable urban development can-not be achieved and may lead to the mismanagementof scarce resources which is prevalent in Dhaka (Hasan
238 Environ Monit Assess (2009) 150:237–249

and Mulamoottil 1994). Thus, space-borne remotelysensed data is deemed to be predominantly importantfor Dhaka Metropolitan, as there is a lack of consistentspatial information. Timely and reliable land coverinformation is not only imperative to comprehend thepast and present condition of the land but also used tofacilitate the development of integrated resourcemanagement policies, to achieve sustainable urbandevelopment (Alphan 2003), and to derive soundenvironmental planning.
This paper describes the results of land use/coverclassification in Dhaka Metropolitan of Bangladeshderived from topographic maps and multi-temporalremotely sensed data. Specifically, the aim of thispaper is to dynamically map and monitor the land use/cover change and to analyze the changes with respectto the baseline of 1960. Since there is a lack ofreliable data such as official land use maps andrestricted access to aerial photographs, it was appro-priate to use satellite data for the assessment of landcover change.
Description of study area
The study area is Dhaka Metropolitan of Bangladesh.Geographically, it is located between 23°58′ and 23°90′ North latitudes and 90°33′ and 90°50′ Eastlongitudes (Fig. 1). Topographically, the area is a flatland and is located mainly on an alluvial terrace,popularly known as the Modhupur terrace of thePleistocene period (Miah and Bazlee 1968). Thesurface elevation of the area ranges between 1 and14 m (Fig. 1) and most of the built-up areas located atthe elevations of 6–8 m (FAP 8A 1991). The area ofinvestigation covers 416 km2 and is surrounded byfour major river systems, namely the Buriganga,Turag, Tongi and Balu, which are flowing to thesouth, west, north and east sides, respectively. Theserivers are mainly fed by local rainfalls and alsoreceive spills from three mighty rivers crisscrossingthe country, namely the Ganges, Brahmmaputra andMeghna through their tributaries and distributaries inthe monsoon. Regionally, the area is located in thecentral Bangladesh, and lies in the sub-tropicalmonsoon zone under the humid climatic condition.The city experiences about 2,000 mm annual rainfall,of which more than 80% occurs during the monsoonseason (June–September). Currently, the annual pop-
ulation growth rate of the city is 5% compared withan annual average of 2.1% for Bangladesh (BBS2001). The process of urbanization in Dhaka isproviding both challenges and opportunities. Forinstance, Dhaka contributes 19% Gross DomesticProduct (BBS 2001) to the national economy and isplaying a pivotal role in terms of social developmentand cultural enhancement.
Data and methodology
Data acquisition and preparation
The topographic maps of 1960 (scale 1:50,000) wereobtained from Survey of Bangladesh (SOB) and usedto generate the 1960 land use/cover types. In addition,Landsat 1, 4, 5 and 7, and IRS-1D data were acquiredfor this study. Four Landsat data comprised of MSS(27 March 1975), TM (03 February 1988; 01 February1999) and ETM+ (04 January 2003) were obtained andemployed in this study. Furthermore, one IRS-1D LISSIII data (26 December 2005) was also acquired andused for the 2005 land use/cover categorization. Pleasenote that the Landsat and IRS thermal bands were notincluded to detect land cover change. Both ArcGIS(ESRI 2005) and Erdas Imagine (Leica Geosystems2006) software were used to derive land use/coverclassification in a multi-temporal approach.
First of all, the topographic maps of 1960 werescanned and rectified using a geometrically correctedimage with the ArcGIS software. As unsystematicerrors remain in commercially available remote sensingdata, geometric correction was therefore needed toreduce the error. The images used in this study weregeometrically corrected using a Landsat TM image of1997 as a reference. At least 75 well distributed groundcontrol points were used in the rectification process.The root mean square error (RMSE) varied from 0.25–0.45 pixels. Finally, a first-order polynomial fit wasapplied and all the data were resampled to 30 m pixelsize using the nearest neighbor method. The Bangla-desh Transverse Mercator System (BTM) was used asthe coordinate system which is an area-specificstandard UTM projection system for Bangladesh.Besides, a number of geospatial data includingmunicipal boundaries, road networks, geomorphicunits and elevation units have been constructed asGIS layers from diverse sources.
Environ Monit Assess (2009) 150:237–249 239

Reference data
A number of reference datasets were constructed inthis study. Due to the retrospective nature, the studyrelied on a variety of sources to develop referencedata for training area selection and accuracy assess-ment of land cover maps.
Reference data for the 1975 Landsat MSS imagewere obtained from the topographic maps of the studyarea (scale 1:50,000) published by SOB in 1973. Thetopographic maps were compiled from aerial photo-graphs and subsequent ground truthing. In addition,the 1975 land-use map (scale 1:10,000) by the Centerfor Urban Studies (CUS 1975) was also used asreference. There are nine land use categories exist inthe land use map developed by the CUS (1975). Theyare business, industrial, education, administrative,transport, open space, residential and non-urban.
The topographic maps of 1991 and one SPOTpanchromatic image of 1989 (resolution 10 m) wereused to develop reference data for the 1988 land cover.The reference data were used both for training areaselection and evaluation of the result. The land use mapof 1991 (FAP 8A, 1991) was also used to derive landcover information from Landsat image of 1988. It maybe mentioned here that the 1991 map classified landuse patterns of Dhaka into six broad categories.Among them, agriculture represented 45% and urbanbuilt-up areas constituted 39% of the total area in 1991.
The 1999 reference data were obtained from oneIRS-1D panchromatic image (spatial resolution 5.8 m)of February, 2000. Additionally, topographic maps of1997 and Dhaka Guide Map of 2001 (scale 1:20,000)were used to locate training samples on the image andto evaluate the map accuracy.
The 2003 reference data were acquired from twosources, primarily from the field and from one IKONOSpanchromatic image (resolution 1 m) of April, 2003. Anintensive fieldwork was also carried out in 2003 (6February–22 March). The 200 reference points (Fig. 1)were collected in the field using a handheld GPS. Thisinformation was then brought into GIS for overlayingwith the images for the selection of training areas andsubsequent accuracy assessment. To do so, 100reference points were used to train pixels and hundredGPS data were used for classification accuracy.
Again in 2007, a field study (12–24 February) wasconducted in the study area to obtain reference data for2005 image classification. Note that an image from the
Google Earth© and a false color composite of IRS-1Dimage (RGB 321) depicting different land cover typeswere printed on A0 size papers and taken to the field fordata collection. In the field, these color hard copies wereused to identify the existing land cover features andspecial attention was paid for the spectrally similarcovers on the IRS data. Thus a ground truth map wasprepared to locate the training pixels on the image.Additionally, 110 reference points (Fig. 1) wererecorded by a GPS and put into a GIS for evaluatingaccuracy of the derived land cover of 2005.
Land use/cover classification and change detection
A modified version of the Anderson Scheme Level I(Anderson et al. 1976) was adopted to study the landuse/cover change. Though the scheme was originallydeveloped for the USA, it is the widely used land use/cover classification system across the world (Mundiaand Aniya 2006; Shalaby and Tateishi 2007; Yuan et al.2005). The system proposed multilevel land use/coverclassification of which level I classes can be mappedfrom Landsat data or from high-altitude airphoto/imagery, whereas the extraction of information at levelsII, III, and IV requires the use of high, medium, andlow-altitude photographs, respectively. Six separableland use/cover types have been identified in this studyas water bodies, wetland/lowlands, built-up, cultivatedland, vegetation and bare soil/landfill (Table 1).
The 1960 land cover map has been developed fromtopographic maps which are created from aerial photo-graphs taken in 1955 followed by extensive groundtruthing in 1956. Two scanned topographic maps (sheetno. 79 I 5 and 6) were displayed on the computer screen.Using ArcGIS, the 1960 land cover map was digitized,edited, and leveled. Besides, a large scale map(1:20,000) of 1961 by Survey of Bangladesh (SOB)depicting the study area and its surroundings wasemployed to identify various land cover types in a GISplatform. The 1962 land use classification map withseven categories by Khan and Islam (1964) was alsouseful to distinguish the land use/cover information ontopographic maps. Finally, vector land cover data wererasterized to perform raster-based change analysis.
All the satellite data were thoroughly studied usingspectral and spatial profiles to ascertain the digitalnumbers (DNs) of different land cover types prior toclassification. Training samples were selected throughreference data and ancillary information mentioned
240 Environ Monit Assess (2009) 150:237–249

Fig. 1 Location of study area
Environ Monit Assess (2009) 150:237–249 241
earlier. Sixty–seventy training sites varying in size from286 to 8,914 pixels (5–46%) were used to locatetraining pixels on the images. Except for the bare soil/landfill category, training samples for each class were 5–12 subclasses. The training samples were then evaluatedby using class histogram plots. Training samples wererefined, renamed, merged, and deleted after the evalu-ation of class histogram and statistical parameters. Asupervised maximum likelihood classification (MLC)algorithm was subsequently applied to each imagewhich has generally been proven to obtain the bestresults from remotely-sensed data if each class has aGaussian distribution (Bolstad and Lillesand 1991).
Misclassification was observed in the classifiedland cover categories obtained from the MLCclassification. For example, certain urban surfaceswere misclassified as landfill sites due to their similarspectral characteristics. Likewise, misclassificationwas also found between the wetland/lowlands cate-gory and the cultivated land, water bodies, andlowland/wetland category. It may be noted thatinitially the wetland category was identified as aseparate class but eventually it merged with thelowland class as it was not possible to separate fromthe lowland category because of their alike spectralproperties. Post-classification refinement, therefore,was used to improve the accuracy as it is simple,efficient and easily executable method (Harris andVentura 1995). It is important to note that misclassi-fication was higher in the MSS image among thedatasets. To surmount the difficulty of misclassifica-tion, a number of strategies were considered. Forexample, thematic information (e.g. water bodies,vegetation, and bare soil) was first extracted from theV-S-W index (Yamagata et al. 1997). Then a rule-based technique using thematic information (DEM,municipal map and water bodies, etc.) was employed
to correct previously misclassified land cover catego-ries in ERDAS’s spatial modeler. Although applica-tion of the rule-based technique greatly improved theMLC classification, a small amount of misclassifica-tion was still found between wetland and cultivatedlands. This was mainly attributed to their geograph-ical contiguity. GIS tools such as Area of Interest(AOI) were afterward applied using visual analysis,reference data, and local knowledge to split andrecode these covers into their original classes. It isnecessary to mention that ground truth informationwas also of great value in the refinement process.Applying those techniques substantially improved theresult of pre-classification by the supervised algo-rithm. A 3×3 majority filter finally applied to theclassified land cover data to reduce the salt-and-pepper effect (Lillesand and Kiefer 1999).
To determine the changes in land use/cover atdifferent years, a post classification comparison ofchange detection was used. Even though this tech-nique presents few limitations (Singh 1989; Coppin etal. 2004), it is the most common approach (Jensen1996; Mundia and Aniya 2006) to compare data fromdifferent sources and dates. The advantage of post-classification comparison is that it bypasses thedifficulties associated with the analysis of imagesacquired at different times of the year and/or bydifferent sensors (Yuan et al. 2005; Coppin et al.2004; Alphan 2003). Moreover, the post classificationmethod also answers the amount, location, and natureof change (Howarth and Wickware 1981). A majorpitfall, however, is that the accuracy of the changemaps depends on the accuracy of individual classi-fications and subject to error propagation (Yuan et al.2005; Zhang et al. 2002). A comparison between theclassified maps was carried out subsequently on apixel-by-pixel basis (Jensen and Ramsey 1987).
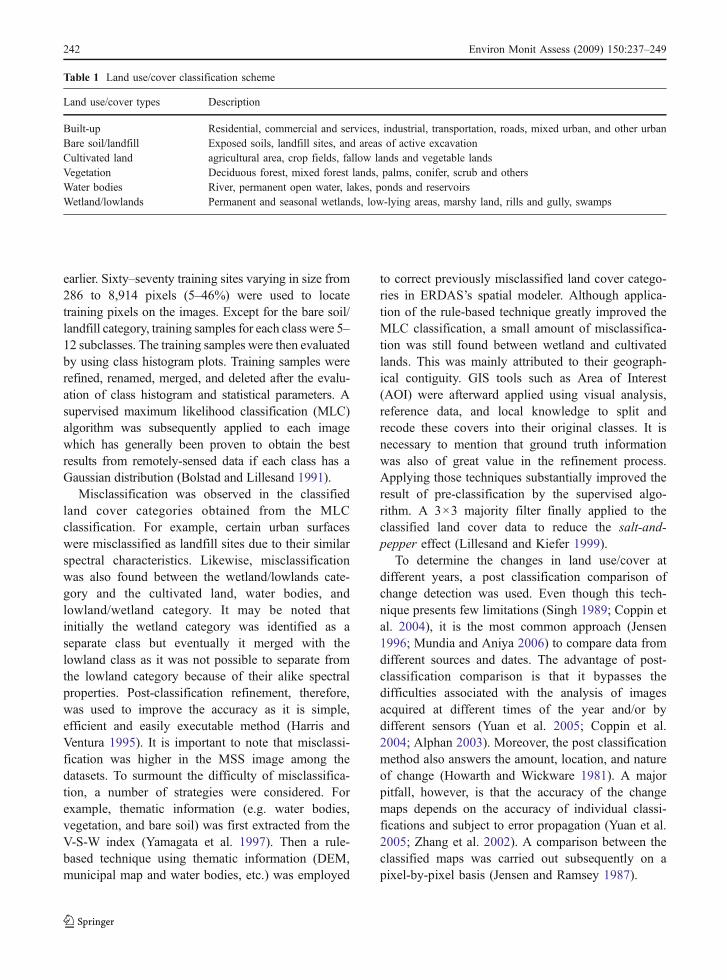
Table 1 Land use/cover classification scheme
Land use/cover types Description
Built-up Residential, commercial and services, industrial, transportation, roads, mixed urban, and other urbanBare soil/landfill Exposed soils, landfill sites, and areas of active excavationCultivated land agricultural area, crop fields, fallow lands and vegetable landsVegetation Deciduous forest, mixed forest lands, palms, conifer, scrub and othersWater bodies River, permanent open water, lakes, ponds and reservoirsWetland/lowlands Permanent and seasonal wetlands, low-lying areas, marshy land, rills and gully, swamps
242 Environ Monit Assess (2009) 150:237–249

Fig. 2 Land cover classifications from 1960 to 2005 for Dhaka Metropolitan
Environ Monit Assess (2009) 150:237–249 243

Assessing classification accuracy
Classified land cover maps from satellite data werefurther used for validation using ground truth dataobtained from a variety of sources. For the 1975,1988, and 1999 land use/cover maps, a total of125 pixels were generated using the stratified randomsampling method. Then using the geographicallocations of features available on the land use maps,high resolution images, and Survey of Bangladeshtopographic maps, accuracy evaluation of the derivedmaps were performed. To assess the accuracy of 2003and 2005 land use/cover maps, reference dataobtained from the field were utilized. In doing so,
100 reference data for 2003 and 110 field data for2005 were used to assess the classification accuracy.Finally, accuracy reports of each land cover data interms of overall accuracy, producers/users accuracy,and kappa coefficient have been generated.
Results and discussion
Land use/cover classifications from 1960 to 2005 inDhaka Metropolitan of Bangladesh are presented inFig. 2. Spatial patterns of land cover revealed thaturban growth followed certain directions between1960s and 1980s depending on the ground elevation.
Table 2 Summary of land use/cover classification statistics between 1960 and 2005 (area in hectares)
Land use/cover types 1960 1975 1988 1999 2003 2005
Area % Area % Area % Area % Area % Area %
Water bodies 2,965.2 7.1 2,976.1 7.2 2,101.5 5.1 1,886.7 4.5 2,050.9 4.9 2,101.1 5.1Wetland/lowlands 13,514.4 32.5 13,155.2 31.6 12,715.6 30.6 10,797.3 26.0 9,124.0 22.0 7,128.8 17.2Cultivated land 13,851.2 33.3 12,040.8 29.0 9,024.9 21.7 8,574.8 20.6 8,466.6 20.4 6,236.6 15.0Vegetation 6,109.8 14.7 6,585.2 15.8 5,793.8 13.9 4,391.8 10.6 3,992.2 9.6 3,773.1 9.1Built-up 4,625.4 11.1 5,550.5 13.4 10,858.9 26.1 14,486.0 34.9 16,104.6 38.7 20,549.7 49.4Bare soil/landfill 498.0 1.2 1,256.2 3.0 1,069.4 2.6 1,427.5 3.4 1,825.7 4.4 1,774.6 4.3
Fig. 3 Temporal pattern ofland use/cover change
244 Environ Monit Assess (2009) 150:237–249

For example, the earlier direction of the built-up landwas followed by north, north-west, and west trendsbut the current trend shows a horizontal expansion(Fig. 2). Historically, the direction of urban expansionof Dhaka has greatly been constrained by the lowelevation of lands, surrounding rivers, and risk offlooding. Thus major development was on the highand medium terraces usually not liable to inundation.The interpretation of the 2003 and 2005 land covermaps, however indicated that Dhaka is being startedto expand in all directions, specifically to north-east,south-east and southern trends by filling up low lyingareas. In order to lessen the flood susceptibility, earthfilling is a very popular means of land development inDhaka Metropolitan. Three sectors, namely, public,private, and individual households, are responsible forrapid land use/cover change in Dhaka. Earlier landdevelopments were mainly done by ad hoc planningby the public sector mainly onto agricultural lands.Currently, a tremendous increase of private sectors,particularly real state agencies, is noticeable in Dhaka,developing both wetlands and agricultural landswithout considering the environmental consequences.In contrast, the individual household is largelyresponsible to develop the fringe zone (Islam 1996;
2005). Land conversion by individual for speculativepurposes has greatly been influencing the develop-ment of suburb areas as observed during field visits.Furthermore, poor coordination among the organiza-tions is equally accountable to the quick loss ofnatural covers. For instance, approximately 6,000 haof Dhaka-Narayangonj-Demra (DND) project wereoriginally retained for assisting the agricultural pro-duction, which is being converted to residential landapace since 1990s without any approval from thegovernment (Islam 1996). This unauthorized landconversion is clearly implying the weakness of theinvolvement of multiple legislative agencies. Hence,unregulated expansion in Dhaka Metropolitan isunderway, and leading to disarrayed growth.
The nature of land cover changes revealed that thebuilt-up and bare soil/landfill categories have beenincreased significantly (Table 2). For instance, in1960 built-up areas were 4,625 ha (hectares) whichincreased gradually to 5,550 ha in 1975, indicatingonly 20% growth within 15 years interval. Figure 3shows the trends of land use/cover change during1960–2005. This figure can be used to discern theincredible pressure of urbanization on natural landcovers in Dhaka Metropolitan. Table 2 demonstrates
Fig. 4 Relative changes inland cover (%) in DhakaMetropolitan
Environ Monit Assess (2009) 150:237–249 245

that between 1960 and 2005, urban built-up areasincreased approximately 15,924 ha while agriculturalland decreased 7,614 ha, vegetation decreased2,336 ha, wetland/lowland decreased 6,385 ha, andwater bodies decreased 864 ha. Analysis showed thatbuilt-up areas increased to about 344% in 2005(Table 2) compared to 1960, whilst the increment oflandfill/bare soils was about 256% with the greatestincrease of built-up areas between 1975 and 1988(95%). In the same period, water bodies reducedgreatly followed by a large reduction of cultivatedland. This result affirms the earlier findings made bydifferent researchers using ground observation(Chowdhury and Faruqui 1989; Islam 1996). Toaccommodate the increasing population, the city hasbeen expanded extensively compared to its early stageand concurrently its spatial expansion has beenseverely constrained by the physical factors. There-fore most of the development has been resulted in theloss of natural resources. It has been observed that thegrowth of Dhaka is extremely faster than the mega-cities of North America and Europe. A basicdifference is noticed in the case of Dhaka’s growth.For example, mega cities in the western world grewgradually which enables these cities to effectivelydevelop the necessary services and managementfacilities for its people but the situation is just oppositein Dhaka Metropolitan due to the extreme pressure ofpopulation explosion. Consequently, local governmentis confronting diverse challenges to attain sustainabledevelopment which could be more acute in the comingyears if planning regulations are not enforced.
To evaluate the results of land cover conversion,matrices of land cover change from 1960 to 1975,1975 to 1988, 1988 to 1999, 1999 to 2003, 2003 to2005, and 1960 to 2005 were calculated and relativechanges between years have been determined (Fig. 4).
This calculation revealed that cultivated land wasused for urban development in the 1960–1975,resulted in 13% loss. From 1975 to 1988, both waterbodies (29%) and cultivated land (25%) were con-verted to built-up areas. Decadal population data wereused to find the causes of such transformation, andfound positive relationship between land coverchange and population growth. The population ofDhaka for example, was only 0.55 million in 1961which suddenly shot up to 2.6 million in 1974 with anannual growth rate of 9.32% during 1961–1974(BBS 2001). In 1981, the population rose to 3.44million when the growth rate surpassed all itsprevious records. During these periods the swampsand wetlands within the city started to disappearquickly and new areas of residential, administrative,business and commercial importance began to develop.In addition, slum and squatter settlements also sprangup in different areas of the city (Siddiqui et al. 2000).Thus the result of this study resembles to theobservation made by Siddiqui et al. (2000) and Islam(1996, 2005).
As there was little opportunity left for urbanexpansion onto agricultural lands, pressure on thevegetative cover amplified in 1988–1999 and thehighest loss of vegetation was observed in this period(24%). To meet up the growing demand of urbanland, pressure exerts on wetland/lowland coverbetween 1999 and 2005 that resulted 15% loss in1999–2003 and 21% decline in 2003–2005, respec-tively. This process of expansion evidently hasdetrimental impact on the environment, particularlythe increase of flood risk susceptibility (Dewan andYamaguchi 2007). It may be noted that the encroach-ment of low lying areas in the western rim of Dhakahas been intensified immensely after the constructionof 32 km flood embankment along the Buriganga and
Table 3 Summary of classification accuracies (%) for 1975, 1988, 1999, 2003, and 2005
Land use/cover class 1975 1988 1999 2003 2005
Producer’s User’s Producer’s User’s Producer’s User’s Producer’s User’s Producer’s User’s
Water bodies 89.5 85.0 100.0 75.0 94.7 90.0 93.8 100.0 83.3 100.0Wetland/lowlands 80.0 90.9 73.3 100.0 91.3 95.5 100.0 94.1 84.2 84.2Cultivated land 71.4 71.4 88.9 76.2 84.0 100.0 80.0 94.1 81.3 72.2Vegetation 83.3 71.4 95.0 90.5 100.0 80.0 85.7 75.0 86.7 81.3Built-up 91.3 100.0 76.9 95.2 90.5 86.4 86.4 95.0 93.1 100.0Bare soil/landfill 100.0 95.0 100.0 80.0 85.7 90.0 100.0 80.0 100.0 86.7
246 Environ Monit Assess (2009) 150:237–249
Turag rivers in 1992 (Chowdhury et al. 1998). Studiesdemonstrated that the encroachment of floodplains inthis side aggravated flood hazard in the city instead ofsecuring people from persistent flooding in themonsoon (Dewan et al. 2004; Maathuis et al. 1999).
Urbanization in the study area has been very rapidon other land covers with discontinuous patcheswhich resulted in rampant sprawling. Inadequatehousing, unplanned and haphazard development,ubiquitous urban poverty, absence of proper land usepolicy, inequity of lands, pitiable coordination amongresponsible organizations and absence of reliableinformation on the current land use practice, all arecontributing to the urban sprawling which is leadingto the unconceivable emergence of slums and squat-ters. According to a study, for instance, the slumpopulation in Dhaka has doubled in a decade, to reach3.4 million in 2006 from 1.5 million in 1996, and thenumber of slum communities increased about 70%(CUS et al. 2006). In contrast, between 1991 and2005 population of Dhaka also increased significantlywith an annual average growth of 5% which outpacedthe country’s annual growth (BBS 2001; World Bank2007). It is estimated that presently about 37% of thecity’s population live in slums (CUS et al. 2006), andthe environment of slum is extremely unhygienic asthey are located at sites such as solid waste dumps,open drains and sewers, embankment and often alongthe rail line (UN-Habitat 2003). In addition, thepeople living in slums are extremely vulnerable tonatural hazards such as floods (Rashid 2000). Thusthe accelerated growth of slum population fosters tothe loss of expensive wetlands, vegetation cover, andalso appallingly affecting both human and physicalenvironments. On the contrary, the ever-increasingurban population and its poverty result in over-exploitation of natural resources to a level which isno longer sustainable for future.
Assessment of the classification accuracy of thederived land cover maps from satellite data wascarried out. Error matrices were used to assess theclassification accuracy and are summarized for all5 years (excluding 1960 land cover) in Table 3. Theoverall accuracies for 1975, 1988, 1999, 2003, and2005 were 85.6%, 86.4%, 90.4%, 90%, and 88.2%respectively, with Kappa statistics of 82.7%, 83.7%,88.5%, 87.9%, and 85.6%. Producer’s and user’saccuracy was also consistently high, ranging from71% to 100%. The MSS resulted in the lowest overall
accuracy (85.6%) among the dataset. It can be notedthat the MSS imagery is too coarse to study landcover of urban environment and the accuracy getsreduced due to mixed pixels (Haack 1987). Moreover,decreases of image spatial resolution lead to spectralmixing of different categories produce spectral con-fusion between covers (Yang and Lo 2002). Thesecould be the reasons to have the least accuracy for theland cover map derived from the MSS data inaddition to registration error (Townshend et al.1992). Misclassifications were between built-up areasand bare soil/landfill category. In addition, somewater bodies were interpreted as wetland. Built-upareas are generally expected not to change to othercover types such as agriculture or wetland. Thechanges may have been resulted from classificationerrors. The examination of the accuracies of landcover data however, revealed that all the datasets metthe minimum USGS total accuracy set out byAnderson et al. (1976), hence the application ofrule-based post-classification refinement found to beeffective that improved the map accuracy by 10–12%.It is necessary to mention here that all the imagesused in this study represented only the winter time,therefore other seasonal data, i.e. spring image can beconsidered to determine the seasonal spectral proper-ties as well as land cover change characteristics of ahighly dynamic urban environment.
Conclusions
Multi-temporal land use/cover classification in DhakaMetropolitan of Bangladesh using topographic mapsand remote sensing was described in this paper. Usinga post-classification comparison, the dynamics of landuse/cover change are presented. The result revealedthat Dhaka has been experiencing rapid urban growthleading to the quick loss of rural and arable lands.Urban encroachment is rapid on other covers resultingrampant sprawling and environmental deterioration.Urban built-up areas increased significantly from 11%to 334% which is mainly attributed to the fast increaseof population due to large rural–urban migration.Consequently, water bodies, cultivated lands, vegeta-tion, and wetland/lowlands are reducing apace. It wasfound that much of the city’s rapid growth inpopulation has been accommodated in informalsettlements with little attempt being made to limit
Environ Monit Assess (2009) 150:237–249 247
the risk of environmental impairments. To alleviatethe adverse environmental impacts of urban expan-sion, planning regulations need to be enforced andeffective coordination should be ensured to save thefast declining natural resource base for sustainabledevelopment. Urban expansion should be restrainedon wetlands, vegetation and expensive floodplains orcultivated lands. This would save productive fertilesoils from urbanization and also contribute to theecological equilibrium. It is increasingly imperative totake a holistic approach to the management of urbanarea and its environment. Furthermore, regional andlocal land use management policy need to be revised,and integrated multi-disciplinary research should beinitiated so that sustainable urban developmentstrategy can be formulated.
The accuracy of the maps was satisfactory, the highestaccuracy obtained for the Landsat TM data while thelowest accuracy attained for the MSS image. The studytook the advantage of GIS and remote sensing techniquesto quantify the land cover change in Dhaka Metropolitanover the last 45 years. Due to the deficiency of land use/cover maps of the study area and restricted access toaerial photographs/ geospatial database, satellite data canbe operationally used to generate land use/cover dynam-ics, and are useful for Dhaka and elsewhere forsustainable land management and policy makings.
Acknowledgements We are indebted to two anonymousreferees for greatly improving the manuscript with their thoroughcritiques. We are also thankful to Md. Humayun Kabir, AssistantProfessor, Dept. of Geography & Environment, University ofDhaka, and Kh. Tanvir Hossain of the same department for theirhelp in many ways, particularly during field visits.
References
Abduallah, S. A., & Nakagoshi, N. (2005). Changes inlandscape spatial pattern in the highly developing state ofSelangor, Peninsular Malaysia. Landscape and UrbanPlanning, 77(3), 263–275.
Ali, A. M. S. (2006). Rice to shrimp: land use/land coverschanges and soil degradation in southwestern Bangladesh.Land Use Policy, 23(4), 421–435.
Alphan, H. (2003). Land use change and urbanization inAdana, Turkey. Land Degradation and Development, 14(6), 575–586.
Alves, D. S., & Skole, D. L. (1996). Characterizing land coverdynamics using multi-temporal imagery. InternationalJournal of Remote Sensing, 17(4), 835–839.
Anderson, R., Hardy, E. E., Roach, J. T., & Witmer, R. E. (1976).A land use and land cover classification system for use withremote sensor data. Sioux Falls, USA: USGS ProfessionalPaper 964.
Azad, A. K., & Kitada, T. (1998). Characteristics of the airpollution in the city of Dhaka, Bangladesh in winter.Atmospheric Environment, 32(11), 1991–2005.
Bangladesh Bureau of Statistics (BBS) (1996). AgriculturalCensus of Bangladesh. Dhaka: Ministry of Planning.
Bangladesh Bureau of Statistics (BBS) (2001). PopulationCensus 2001. Dhaka: Ministry of Planning.
Bolstad, P. V., & Lillesand, T. D. (1991). Rapid MaximumLikelihood classification. Photogrammetric Engineering& Remote Sensing, 57, 67–74.
Center for Urban Studies (CUS) (1975). Generalized land usemap of Dhaka City. Dhaka: CUS.
Center for Urban Studies (CUS)National Institute of Population,Research and Training (NIPORT) & Measure Evaluation(2006). Slums in Urban Bangladesh: Mapping and Census,2005. Dhaka: CUS.
Chowdhury, A.M., & Faruqui, S. (1989). Physical growth of DhakaCity. In S.U. Ahmed (Ed.) Dhaka: past, present and future(pp. 43–61). Dhaka: The Asiatic Society of Bangladesh.
Chowdhury, J. U., Rahman, R., Bala Islam, S. K., & Saiful, A.K. M. (1998). Impact of 1998 flood on Dhaka City andperformance of flood control works. Dhaka: Institute ofFlood Control and Drainage Research.
Coppin, P., Jonckheere, I., Nackaerts, K., Muys, B., & Lambin,E. (2004). Digital change detection methods in ecosystemmonitoring: a review. International Journal of RemoteSensing, 25(9), 1565–1596.
Dewan, A. M., & Yamaguchi, Y. (2007). GIS and remotesensing for mapping and monitoring the effect of land use/cover changes on flooding in Greater Dhaka of Bangla-desh. Poster presented at the Annual Meeting of theRemote Sensing and Photogrammetry Society 2007,Newcastle, the UK, September.
Dewan, A. M., Islam, M. M., Kumamoto, T., & Nishigaki, M.(2007a). Evaluating flood hazard for land-use planning inGreater Dhaka of Bangladesh using remote sensing andGIS techniques. Water Resources Management, 21(9),1601–1612.
Dewan, A. M., Kabir, M. H., Islam, M. M., Kumamoto, T., &Nishigaki, M. (2007b). Delineating flood risk areas inGreater Dhaka of Bangladesh using Geoinformatics.Georisk: assessment and management of risk for engineeredsystems and geohazards, 1(4), 190–201.
Dewan, A. M., Yeboah, K. K., & Nishigaki, M. (2005). Floodmapping and damage evaluation in Greater Dhaka,Bangladesh with remote sensing. Asian Profile, 33(5),495–512.
Dewan, A. M., Yeboah, K. K., & Nishigaki, M. (2006). Floodhazard delineation in Greater Dhaka, Bangladesh using anintegrated GIS and remote sensing approach. GeocartoInternational, 21(2), 33–38.
Dewan, A.M., Nishigaki, M., &Komatsu, M. (2004). DEMbasedflood extent delineation in Dhaka City, Bangladesh. Journalof Environmental Science and Technology, 9, 99–110.
Dong, Y., Forster, B., & Ticehurst, C. (1997). Radar backscatteranalysis for urban environments. International Journal ofRemote Sensing, 18(6), 1351–1364.
248 Environ Monit Assess (2009) 150:237–249

Environmental System Research Institute (2005). UsingArcGIS. Redlands, USA: ESRI.
Flood Action Plan (FAP) 8A (1991). Master Plan Study forGreater Dhaka Protection Project. Dhaka: Japan Interna-tional Cooperation Agency.
Green, K., Kempka, D., & Lackey, L. (1994). Using remotesensing to detect and monitor land cover and land usechange. Photogrammetric Engineering & Remote Sensing,60(3), 331–337.
Haack, B. (1987). An assessment of Landsat MSS and TM forurban and near-urban digital classification. RemoteSensing of Environment, 21(2), 201–213.
Harris, P. M., & Ventura, S. J. (1995). The integration ofgeographic data with remotely sensed imagery to improveclassification in an urban area.Photogrammetric Engineering& Remote Sensing, 61(8), 993–998.
Hasan, S., & Mulamoottil, G. (1994). Environmental problemsof Dhaka City: a study of mismanagement. Cities, 11(3),195–200.
Howarth, P. J., & Wickware, G. M. (1981). Procedures forchange detection using Landsat digital data. InternationalJournal of Remote Sensing, 2(3), 277–291.
Islam, N. (1996). Dhaka from city to megacity: perspectives onpeople, places, planning and development issues. Dhaka:Urban Studies Program.
Islam, N. (2005). Dhaka now: contemporary development.Dhaka: The Bangladesh Geographical Society.
Jat, M. K., Garg, P. K., & Khare, D. (2008). Monitoring andmodeling of urban sprawl using remote sensing and GIStechniques. International Journal of Applied Earth Ob-servation and Geoinformation, 10(1), 26–43.
Jensen, I. R., & Ramsey, E. W. (1987). Inland wetland changedetection using Aircraft MSS data. PhotogrammetricEngineering & Remote Sensing, 53(5), 521–529.
Jensen, J. R. (1996). Introductory digital image processing: aremote sensing perspective. Upper Saddle, NJ: Prentice-Hall.
Kamal, A. S. M. M., & Midorikawa, S. (2004). GIS-basedgeomorphological mapping using remote sensing data andsupplementary geoinformation: a case study of the DhakaCity area, Bangladesh. International Journal of AppliedEarth Observation and Geoinformation, 6(2), 111–125.
Karim, M. M. (1999). Traffic pollution inventories and modelingin metropolitan Dhaka, Bangladesh. TransportationResearch Part D, 4(5), 291–312.
Karn, S. K., & Harada, H. (2001). Surface water pollution inthree urban territories of Nepal, India and Bangladesh.Environmental Management, 28(4), 483–496.
Khan, F. K., & Islam, N. (1964). High class residential areas inDhaka city, 1608–1962. Oriental Geographer, January, 1–40.
Lambin, E. F. (1997). Modeling and monitoring land-coverchange processes in tropical regions. Progress in PhysicalGeography, 21(3), 375–393.
Leica Geosystems (2006). Erdas Imagine Tour Guides. USA:Leica Geosystems Geospatial Imaging.
Lillesand, T. M., & Kiefer, R. W. (1999). Remote Sensing andImage Interpretation. New York: John Wiley and Sons.
Lopez, E., Bocco, G., Mendoza, M., & Duhau, E. (2001).Predicting land cover and land use change in the urbanfringe a case in Morelia City, Mexico. Landscape andUrban Planning, 55(4), 271–285.
Maathuis, B. H. P., Mannaerts, C. M. M., & Khan, N. I. (1999).Evaluating urban storm water drainage using GIS and RStechniques – a case study of Dhaka City, Bangladesh.Geocarto International, 14(4), 21–32.
Miah, M. M., & Bazlee, B. L. (1968). Some aspects ofgeomorphology of the Madhupur Tract.Oriental Geographer,12, 39–48.
Mohit, M. A. (1991). Institutional arrangement for the develop-ment of Dhaka Metropolitan Area: Problems and Issues. InN. Islam, & A. I. Chowdhury (Eds.) Urban Land Manage-ment in Bangladesh. Dhaka: Ministry of Land.
Mundia, C. N., & Aniya, M. (2006). Dynamics of land use/cover changes and degradation of Nairobi City, Kenya.Land Degradation and Development, 17(1), 97–108.
Muttitanon, W., & Tripathi, N. K. (2005). Land use/coverchanges in the coastal zone of Bay Don Bay, Thailandusing Landsat 5 TM data. International Journal of RemoteSensing, 26(11), 2311–2323.
Rashid, S. F. (2000). The urban poor in Dhaka city: theirstruggles and coping strategies during the floods of 1998.Disasters, 24(3), 240–253.
Shalaby, A., & Tateishi, R. (2007). Remote sensing and GIS formapping and monitoring land cover and land use changesin the Northwestern coastal zone of Egypt. AppliedGeography, 27(1), 28–41.
Siddiqui, K., Ahmed, J., Awal, A., & Ahmed, M. (2000).Overcoming the Governance Crisis in Dhaka City. Dhaka:University Press Limited.
Singh, A. (1989). Digital change detection techniques usingremotely sensed data. International Journal of RemoteSensing, 10(6), 989–1003.
The World Bank (2007). Dhaka: improving living conditionsfor the urban poor. Sustainable Development Unit: SouthAsia Region.
Townshend, J. R. G., Justice, C. O., Gurney, C., & Mcmanus, J.(1992). The impact of misregistration on change detection.IEEE Transactions on Geosciences and Remote Sensing,30, 1054–1060.
UN-Habitat (2003). The challenges of slums: global report onhuman settlements. London: Earthscan Publication.
Yamagata, Y., Sugita, S., & Yasuoka, Y. (1997). Developmentof Vegetation–Soil–Water Index algorithms and applica-tions. Journal of Remote Sensing Society of Japan, 17(1),54–64.
Yang, X. (2002). Satellite monitoring of urban spatial growth inthe Atlanta metropolitan area. Photogrammetric Engineering& Remote Sensing, 68(7), 725–734.
Yang, X., & Lo, C. P. (2002). Using a time series of satelliteimagery to detect land use and cover changes in theAtlanta, Georgia. International Journal of Remote Sens-ing, 23(9), 1775–1798.
Yuan, F., Sawaya, K. E., Loeffelholz, B. C., & Bauer, M. E.(2005). Land cover classification and change analysis ofthe Twin Cities (Minnesota) Metropolitan Area by multi-temporal Landsat remote sensing. Remote Sensing ofEnvironment, 98(2&3), 317–328.
Zhang, Q., Wang, J., Peng, X., & Shi, P. (2002). Urban built-upchange detection with road density and spectral informationfrom multi-temporal Landsat TM data. InternationalJournal of Remote Sensing, 23(15), 3057–3078.
Environ Monit Assess (2009) 150:237–249 249