using seismic hazard assessment to study dynamic behavior
TRANSCRIPT
ORIGINAL RESEARCH
Using seismic hazard assessment to study dynamic behaviorof Gonbad-e Kavus tower (the tallest brick tower in the world)
Gholamreza Ahmadi • Rooholla Keshtkar •
Masoud Mavizchi • Mohammad Ghasem Vetr
Received: 8 April 2014 / Accepted: 3 November 2014 / Published online: 19 November 2014
� The Author(s) 2014. This article is published with open access at Springerlink.com
Abstract Gonbad-e Kavus Brick tower, which was
completed in the tenth century, is the remnant of an ancient
glorious building that is located in downtown of Gonbad-e
Kavus, Golestan, Iran. It is of note that, this massive brick
structure is known as the tallest brick tower in the world.
Unfortunately, the tower is located on a very active seismic
region, hence there is an urgent need for a careful study of
seismic behavior of the tower due to its historical impor-
tance. Hence, probabilistic seismic hazard assessment has
been performed for Gonbad region to prepare the acceler-
ation spectrum charts. Three-dimensional finite element
models of the tower are used in the nonlinear finite element
program ANSYS. Dynamic modal and dynamic analyses
by means of two spectral accelerations were conducted to
study the dynamic response. In conclusion, earthquake with
2,475 years period duration can cause damage to the
overall the tower.
Keywords Historical masonry tower � Three-dimensional
finite element model � Dynamic response � Probabilistic
seismic hazard assessment
Introduction
Most of the existing historical monumental structures are
made of masonry, using either stone or brick blocks. These
unreinforced blocky masonry structures cannot be consid-
ered a continuum, but rather an assemblage of compact
stone or brick elements linked by means of mortar joints.
Seismic events have often caused massive damage or the
destruction of such structures with great cultural
significance.
The main purpose of the current study is analysis of the
seismic response of large monumental masonry. The spe-
cific size and geometry of the old structures and also spe-
cific architectural parts such as large facades, arches and
vaults are often the main reasons for presence of seismic
damages even in a moderate earthquake. On the other hand,
the same structures of Gonbad-e Kavus brick tower are
special type of the Iranian architectural heritage.
Kavus tower of Gonbad-e Kavus, Golestan Province, is
an outstanding and innovative example of Islamic archi-
tecture with the 52.07 m height body that is registered on
UNESCO’s heritage list with international monuments
registration number of 1398 and also this is known as the
tallest brick tower in the world in 2012. Besides, Gonbad-e
Kavus known as Gonbad-e Ghabus, is a monument related
to the fourth century A.H. that was built in 1006 AD on the
order of Ziyarid ruler, Shams-ol-Ma’ali Qabus ibn
Voshmgir, and is near the ruins of the ancient city of Jorjan
in the northeast Iran located on a hillock amidst the grand
park of the city (Fig. 1).
G. Ahmadi (&) � M. Mavizchi
Department of Civil Engineering, Islamic Azad University, Yazd
Branch, Yazd, Iran
e-mail: [email protected]
M. Mavizchi
e-mail: [email protected]
R. Keshtkar
Applied-Scientific University of Golestan, Gorgan, Iran
e-mail: [email protected]
M. G. Vetr
Structural Research Center, International Institute of Earthquake
Engineering and Seismology (IIEES), Tehran, Iran
e-mail: [email protected]
123
Int J Adv Struct Eng (2014) 6:133–148
DOI 10.1007/s40091-014-0071-4

Since Iran is located on one of the world’s seismic lines,
Gonbad-e Kavus tower is located in an area with relatively
high risk of earthquake. Knowing the fact that it is a his-
torical structure with considerable age, we feel the neces-
sity to study the region with risk analysis method and to
obtain two specific spectra of the site with periods of 475
and 2,475 years for understanding the seismic behavior of
Gonbad-e Kavus tower. After obtaining two site-specific
spectra, a finite elements model is defined with the non-
linear finite elements software ANSYS, and subsequently
the features, properties and other required parameters are
presented.
According to the available evidences, this massive
masonry structure has been under threat and harmed
severely by natural and unnatural factors. People in
earlier times have damaged the body of the structure
since they thought there was treasure buried at the sur-
rounding of the foundation of the structure, thus
imposing slight damages to this tower (Fig. 2a). During
the times there have been implementations for repairing
according to Fig. 2b, c, the empty holes have been filled
using similar bricks, and old bricks have been removed
and new ones have been used, this action has hidden the
deeper cracks from sight.
Literature review
In the far past, historic monuments were built by the ancestors
and forefathers, besides the historical value it represents civ-
ilization, culture and abilities of past people. Moreover,
another factor that increased the importance of protecting
these buildings is the monument’s role in job creation and
economic interests of the countries. Note that, Iran is one of
the top ten countries in the world in terms of historical
attractions. Therefore, adopting appropriate solutions is nec-
essary in order to protect the historic monuments against
demolition. In order to improve the historic buildings against
earthquakes, a full evaluation of the building is needed to
identify the structural properties of the historic buildings.
Gonbad-e Kavus tower is a one of the historic monuments that
has a global reputation. So far in addition to restoration that
has been done to replace damaged parts, the studies were
conducted to evaluate the seismic behavior of the tower.
Among these studies, an evaluation of the tower is done by
Hejazi and Nasri (2009) in linear time history analysis using
Naghan earthquake accelerations. Another paper associated
with this tower is a nonlinear time history analysis of the tower
under the Northridge earthquake (Ahmadi et al. 2012) that
evaluated retrofit of the tower with seismic isolation systems.
Fig. 1 a Gonbad-e Kavus tower location; b aerial photo taken on 1335; c Gonbad-e Kavus in the 1950s
Fig. 2 a The destruction of the lower part of the tower due to find the treasure; b reconstruction of the damaged part in the lower part of the
tower; c reconstruction of the damaged part in the cone-shaped dome
134 Int J Adv Struct Eng (2014) 6:133–148
123

In the following, a review of the same work on masonry
towers is presented. Since a review of all experimental and
analytical studies in this regard is not possible, a summary
of the related works is presented below.
The numerical damage assessment of the masonry bell
tower called ‘‘Haghia Sophia’’ in Trabzon, Turkey, was
performed by Bayraktar et al. (2010), through utilizing
nonlinear static and dynamic analyses by nonlinear 3D
finite element modeling. Nonlinear dynamic analysis has
been performed according to east–west component of the
1992 Erzincan earthquake. A simple strategy of analysis
for the seismic assessment of the Qutb Minar in Delhi,
India, was presented by Pena and Lourenco (2010). Three
different models were used for nonlinear static (pushover)
and nonlinear dynamic analyses. A comparative numerical
study on a twelfth century masonry tower called ‘‘Matildea
bell tower’’ located in northern Italy was described by
Milani et al. (2012). To assess the safety of the tower under
seismic loads, different numerical analyses have been
performed: nonlinear static, limit, and nonlinear full
dynamic analyses. The results of an experimental campaign
composed of both non-destructive static and dynamic tests
on an illustrative masonry tower: the Italian Medieval
‘‘Torre Grossa’’ (Big Tower) of San Gimignano in Tos-
cana (Italy) was reported and discussed by Bartoli et al.
(2013). During the experimental campaign, both static and
dynamic tests were performed. By using the finite element
technique, a 3D model of the tower was built (macro-
modeling) and it was calibrated on the basis of the in situ
investigation survey. In addition to these, many useful
studies have been done about old historical structures (e.g.,
D’Ambrisi et al. 2012; Ceroni et al. 2009; Ivorra and
Pallares 2006; Lourenco 2005; Binda et al. 2005; Carpin-
teri et al. 2005; Modena et al. 2002; Riva et al. 1998).
As shown in previous researches, the seismic evaluation
methods include conventional static and dynamic analysis
with consideration of linear and nonlinear materials. In this
paper, in order to do more accurate study of the seismic
behavior of the tower and also more convenient and
accurate understanding of the geology, tectonic, seismol-
ogy, risk and available faults, risk analysis has been used.
Risk analysis helps in providing suitable acceleration
spectra so that it results in a more realistic understanding of
the seismic behavior of the tower.
In this regard, another important parameter is height-to-
width ratio of the tower, usually in previous researches,
thin ratio of most masonry towers is greater than 4. In this
regard, Asinelli tower has the most height-to-width ratio
equal to 11, while the Gonbad-e Kavus tower is a load-
bearing masonry structure approximately 52.07 m tall and
17.24 m width which its ratio of width to height is equal to
3 approximately so this is a sign of stability after
1,000 years. Besides, for the accuracy and simplicity of
modeling, a macro-modeling method is used in this paper
by which wide range of other structures are modeled.
Properties of the structure
This monument structure is located in a high hill that
consists of two parts: the first part is the base and the body,
and the second part consists of a brick conical dome.
Normal red baked brick without cover has been used for
both the facade and bearing of the structure and also Saruj
mortar (plaster lime and ashes or sand) has been used to fill
the gap among bricks.
The overall height of the structure is 52.07 m that
includes the conical dome with height equal to 15.07 m
and brick body with height equal to 37 m (Fig. 3a, b). In
considering the height of the hill (equal to 15 m), sum-
mation of the heights of structure and underneath hill gives
about 67.07 m. The foundation of the structure is a circular
foundation that consists of mixture of brick and cement.
The important feature about the foundation of the structure
apart from its height and material is the extra volume of
soil added to the surrounding of the foundation that creates
a kind of pre-stressed pattern. In this research, the soil–
structure interaction has been ignored. In other words, only
the structure is our criterion for seismic studies. On the
other hand, the very important feature of the body of the
dome is its perfect symmetry (central symmetry and axial
symmetry with respect to diameter of circular plan) in a
way that every point of the structure has a twin point in the
opposite. And also all concavities and convexities are also
symmetric on the plan. The outer circular body of Gon-
bad-e Kavus is in the form of a ten-pointed star to a conical
roof that each corner (play the role of trailer) has equal
distances from each other. The internal body is continued
like a cylinder to top of the dome, and also in the southern
part there is an entrance with 1.56 m of width and 5.53 m
of height. Other geometric properties are presented in
Fig. 3a, b by the length and cross sections.
Numerical simulation
As shown in Fig. 4, three-dimensional finite elements
models of the tower have been made with the aid of ori-
ginal nonlinear finite element program ANSYS. Then,
meshing of the model is an initial step in a finite element
analysis; hence, mesh density is considered in lower
location of body structure more than other places.
Depending on the desired accuracy and simplicity,
modeling can be done in different ways that in general can
be divided in the form of micro-modeling and macro-
modeling. The bricks are modeled greater than usual and
between them is used from members and contact
Int J Adv Struct Eng (2014) 6:133–148 135
123

components, and in fact mortar was removed from the
model and its effects will be considered in members and
contact components. As a principal rule it should be noted
that the modeling of the structures should, as far as does
not damage the results of the study, be simple. Due to the
cost and time consumed, applying micro-modeling in the
seismic analysis of the structures can be used only for
research and small samples. Therefore, in the modeling and
investigation of the seismic behavior of the large-scale
structures, a model without numerous details and
complexities of micro-modeling and provides a good rep-
resentation of the overall behavior of the structures is
needed. For example, in the macro-modeling method an
element of the tower, with large dimensions and the vol-
ume approximately 3 m3, has been modeled and meshed.
However, if it is modeled with micro method this volume
should be replaced with a large number of small elements
consisting of brick and mortar (0.25 9 0.25 9 0.06 m).
Hence, the advantage of macro-modeling approach com-
pared to micro-modeling approach is in reducing the
Fig. 3 Geometric relief of
Gonbad-e Kavus tower:
a vertical section; b cross
sections at different levels
Fig. 4 Modeling and discretization views of structure in ANSYS program
136 Int J Adv Struct Eng (2014) 6:133–148
123
computational time and computer disk space requirements
significantly. Hence in this study, the macro-modeling
approach was used, and the masonry was modeled as an
isotropic continuum. Besides, three types of elements were
used to model; SOLID65, CONTA175 and TARGE170
elements, in which the first element is used for wall and the
second and third elements are used for taking into account
the interaction between foundation and body of the build-
ing and the dome, respectively.
Mechanical properties of materials
Because of the sensitivity of societies and organizations
and relevant administrations of historical structures pre-
serving, we are not allowed to perform any tests whether
laboratory tests or environmental tests; therefore, we are
obliged to obey the instructions about seismic optimization
of masonry structure and also other researches about brick
structures that are similar to this ancient structure with
view point of age and quality.
Therefore, we have used characteristics of Imam Reza
Shrine materials and also Najmoddin Kobra monument
which are located within 200 km of this structure. These
two buildings have the same materials, arrangement, and
age compared with Gonbad-e Kavus tower. Parts of the
foundation of Imam Reza Shrine were investigated by
performing single and double-flat jack tests by Astan Quds
Razavi consulting department, the results of which are
mentioned in the paper of Mavizchi et al. (2012).
Hence, for brick wall, the following properties must be
entered in ANSYS:
• Elastic modulus (EC) = 2.33 e6 KN/m2
• Ultimate uniaxial compressive strength = 3,600 KN/
m2
• Ultimate uniaxial tensile strength = 170 KN/m2
• Poisson’s ratio (m) = 0.25
• Density (q) = 1.8 ton/m3.
Also in the present study it is assumed that the concrete
is homogeneous and initially isotropic. On the other hand,
because of the prohibition of testing, we decided to use a
laboratory sample of brick wall which was done by Nate-
ghi-Alahi and Alemi (2008), with the purpose of calibrat-
ing the nonlinear finite element program ANSYS and to
assure the proper function of the program for investigating
of the modeling the brittle walls (bricks). The result of the
laboratory wall sample under cyclic test is presented in
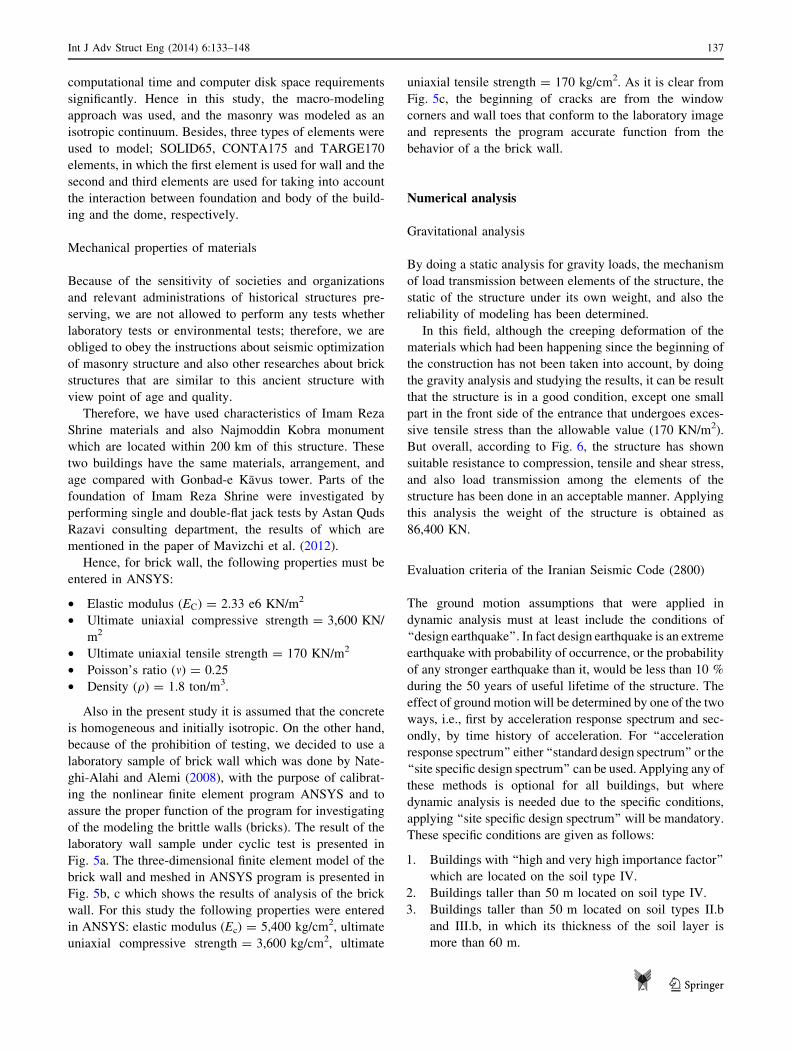
Fig. 5a. The three-dimensional finite element model of the
brick wall and meshed in ANSYS program is presented in
Fig. 5b, c which shows the results of analysis of the brick
wall. For this study the following properties were entered
in ANSYS: elastic modulus (Ec) = 5,400 kg/cm2, ultimate
uniaxial compressive strength = 3,600 kg/cm2, ultimate
uniaxial tensile strength = 170 kg/cm2. As it is clear from
Fig. 5c, the beginning of cracks are from the window
corners and wall toes that conform to the laboratory image
and represents the program accurate function from the
behavior of a the brick wall.
Numerical analysis
Gravitational analysis
By doing a static analysis for gravity loads, the mechanism
of load transmission between elements of the structure, the
static of the structure under its own weight, and also the
reliability of modeling has been determined.
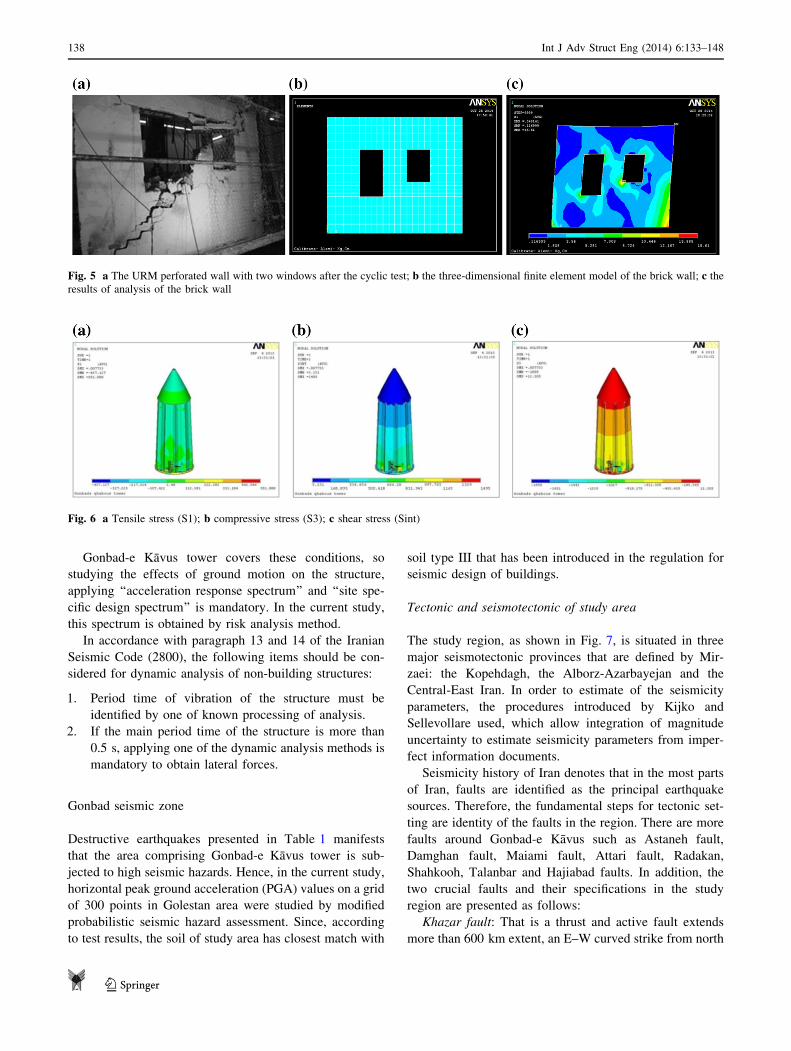
In this field, although the creeping deformation of the
materials which had been happening since the beginning of
the construction has not been taken into account, by doing
the gravity analysis and studying the results, it can be result
that the structure is in a good condition, except one small
part in the front side of the entrance that undergoes exces-
sive tensile stress than the allowable value (170 KN/m2).
But overall, according to Fig. 6, the structure has shown
suitable resistance to compression, tensile and shear stress,
and also load transmission among the elements of the
structure has been done in an acceptable manner. Applying
this analysis the weight of the structure is obtained as
86,400 KN.
Evaluation criteria of the Iranian Seismic Code (2800)
The ground motion assumptions that were applied in
dynamic analysis must at least include the conditions of
‘‘design earthquake’’. In fact design earthquake is an extreme
earthquake with probability of occurrence, or the probability
of any stronger earthquake than it, would be less than 10 %
during the 50 years of useful lifetime of the structure. The
effect of ground motion will be determined by one of the two
ways, i.e., first by acceleration response spectrum and sec-
ondly, by time history of acceleration. For ‘‘acceleration
response spectrum’’ either ‘‘standard design spectrum’’ or the
‘‘site specific design spectrum’’ can be used. Applying any of
these methods is optional for all buildings, but where
dynamic analysis is needed due to the specific conditions,
applying ‘‘site specific design spectrum’’ will be mandatory.
These specific conditions are given as follows:
1. Buildings with ‘‘high and very high importance factor’’
which are located on the soil type IV.
2. Buildings taller than 50 m located on soil type IV.
3. Buildings taller than 50 m located on soil types II.b
and III.b, in which its thickness of the soil layer is
more than 60 m.
Int J Adv Struct Eng (2014) 6:133–148 137
123
Gonbad-e Kavus tower covers these conditions, so
studying the effects of ground motion on the structure,
applying ‘‘acceleration response spectrum’’ and ‘‘site spe-
cific design spectrum’’ is mandatory. In the current study,
this spectrum is obtained by risk analysis method.
In accordance with paragraph 13 and 14 of the Iranian
Seismic Code (2800), the following items should be con-
sidered for dynamic analysis of non-building structures:
1. Period time of vibration of the structure must be
identified by one of known processing of analysis.
2. If the main period time of the structure is more than
0.5 s, applying one of the dynamic analysis methods is
mandatory to obtain lateral forces.
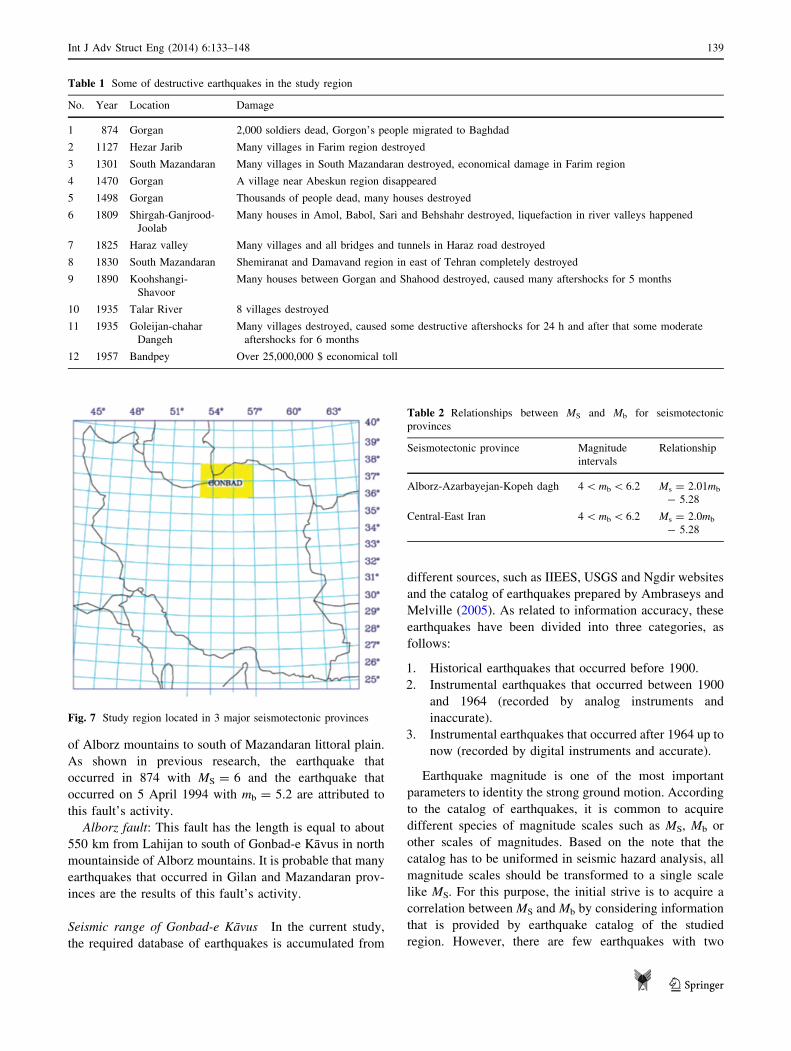
Gonbad seismic zone
Destructive earthquakes presented in Table 1 manifests
that the area comprising Gonbad-e Kavus tower is sub-
jected to high seismic hazards. Hence, in the current study,
horizontal peak ground acceleration (PGA) values on a grid
of 300 points in Golestan area were studied by modified
probabilistic seismic hazard assessment. Since, according
to test results, the soil of study area has closest match with
soil type III that has been introduced in the regulation for
seismic design of buildings.
Tectonic and seismotectonic of study area
The study region, as shown in Fig. 7, is situated in three
major seismotectonic provinces that are defined by Mir-
zaei: the Kopehdagh, the Alborz-Azarbayejan and the
Central-East Iran. In order to estimate of the seismicity
parameters, the procedures introduced by Kijko and
Sellevollare used, which allow integration of magnitude
uncertainty to estimate seismicity parameters from imper-
fect information documents.
Seismicity history of Iran denotes that in the most parts
of Iran, faults are identified as the principal earthquake
sources. Therefore, the fundamental steps for tectonic set-
ting are identity of the faults in the region. There are more
faults around Gonbad-e Kavus such as Astaneh fault,
Damghan fault, Maiami fault, Attari fault, Radakan,
Shahkooh, Talanbar and Hajiabad faults. In addition, the
two crucial faults and their specifications in the study
region are presented as follows:
Khazar fault: That is a thrust and active fault extends
more than 600 km extent, an E–W curved strike from north
Fig. 5 a The URM perforated wall with two windows after the cyclic test; b the three-dimensional finite element model of the brick wall; c the
results of analysis of the brick wall
Fig. 6 a Tensile stress (S1); b compressive stress (S3); c shear stress (Sint)
138 Int J Adv Struct Eng (2014) 6:133–148
123
of Alborz mountains to south of Mazandaran littoral plain.
As shown in previous research, the earthquake that
occurred in 874 with MS = 6 and the earthquake that
occurred on 5 April 1994 with mb = 5.2 are attributed to
this fault’s activity.
Alborz fault: This fault has the length is equal to about
550 km from Lahijan to south of Gonbad-e Kavus in north
mountainside of Alborz mountains. It is probable that many
earthquakes that occurred in Gilan and Mazandaran prov-
inces are the results of this fault’s activity.
Seismic range of Gonbad-e Kavus In the current study,
the required database of earthquakes is accumulated from
different sources, such as IIEES, USGS and Ngdir websites
and the catalog of earthquakes prepared by Ambraseys and
Melville (2005). As related to information accuracy, these
earthquakes have been divided into three categories, as
follows:
1. Historical earthquakes that occurred before 1900.
2. Instrumental earthquakes that occurred between 1900
and 1964 (recorded by analog instruments and
inaccurate).
3. Instrumental earthquakes that occurred after 1964 up to
now (recorded by digital instruments and accurate).
Earthquake magnitude is one of the most important
parameters to identity the strong ground motion. According
to the catalog of earthquakes, it is common to acquire
different species of magnitude scales such as MS, Mb or
other scales of magnitudes. Based on the note that the
catalog has to be uniformed in seismic hazard analysis, all
magnitude scales should be transformed to a single scale
like MS. For this purpose, the initial strive is to acquire a
correlation between MS and Mb by considering information
that is provided by earthquake catalog of the studied
region. However, there are few earthquakes with two
Table 1 Some of destructive earthquakes in the study region
No. Year Location Damage
1 874 Gorgan 2,000 soldiers dead, Gorgon’s people migrated to Baghdad
2 1127 Hezar Jarib Many villages in Farim region destroyed
3 1301 South Mazandaran Many villages in South Mazandaran destroyed, economical damage in Farim region
4 1470 Gorgan A village near Abeskun region disappeared
5 1498 Gorgan Thousands of people dead, many houses destroyed
6 1809 Shirgah-Ganjrood-
Joolab
Many houses in Amol, Babol, Sari and Behshahr destroyed, liquefaction in river valleys happened
7 1825 Haraz valley Many villages and all bridges and tunnels in Haraz road destroyed
8 1830 South Mazandaran Shemiranat and Damavand region in east of Tehran completely destroyed
9 1890 Koohshangi-
Shavoor
Many houses between Gorgan and Shahood destroyed, caused many aftershocks for 5 months
10 1935 Talar River 8 villages destroyed
11 1935 Goleijan-chahar
Dangeh
Many villages destroyed, caused some destructive aftershocks for 24 h and after that some moderate
aftershocks for 6 months
12 1957 Bandpey Over 25,000,000 $ economical toll
Fig. 7 Study region located in 3 major seismotectonic provinces
Table 2 Relationships between MS and Mb for seismotectonic
provinces
Seismotectonic province Magnitude
intervals
Relationship
Alborz-Azarbayejan-Kopeh dagh 4 \ mb \ 6.2 Ms = 2.01mb
- 5.28
Central-East Iran 4 \ mb \ 6.2 Ms = 2.0mb
- 5.28
Int J Adv Struct Eng (2014) 6:133–148 139
123

different species of announced magnitude scales that con-
stitute the consequence of this striving unreliable. As a
result, by using the correlations presented by Mirzaei
(1997) in Table 2 Mb is converted to MS. Also, to convert
other magnitudes to MS, correlations are presented by
Green and Hall (1994) is used.
The estimation procedure of seismic hazard
According to previous research, seismic hazard assessment
can be conducted by three different ways:
1. A deterministic approach that is based on historical
data when a particular scenario is assumed. This
method is named DSHA (deterministic seismic hazard
analysis) and shares the main aim of some recent
seismic hazard studies, i.e., the studies carried out in
Greece, Turkey and for critical infrastructures in
California.
2. A probabilistic approach in which uncertainties in
earthquake size, location and time of occurrence are
the main purposes of a study.
3. A hybrid method that involves the advantages of both
deterministic and probabilistic methods.
For the first time, Cornell et al. (1968) defined the tra-
ditional methodology of probabilistic seismic hazard ana-
lysis. Mainly given the insufficient earthquake data
available in potential seismic sources, this methodology
meets with problems in practice. To eliminate these
shortcomings and also in order to properly reflect inho-
mogeneity of seismicity in time and space, the traditional
methodology was modified by Chinese experts (Shi et al.
1992). This method includes three major steps which are
presented below:
1. Delineation of seismotectonic provinces and evalua-
tion of seismicity parameters (i.e., b value, annual
mean occurrence rate (k), and maximum possible
magnitude, Mmax in each seismotectonic province.
2. Determination of potential seismic sources that
includes estimation of Mmax in the potential seismic
sources and evaluation of spatial distribution function
for each magnitude interval in each potential seismic
source.
3. Dividing the region into a series of grid points and
assessment of seismic hazard for every grid point,
using characteristics of seismic activity in seismotec-
tonic provinces and potential seismic sources through
an earthquake ground motion attenuation relationship.
In this numerical study, the modified methodology of
probabilistic seismic hazard assessment (PSHA) is used to
prepare seismic acceleration spectrum charts of Golestan
area. For this purpose, after delineation of major
seismotectonic provinces surrounding the study area, a
uniform catalog of earthquakes including historical and
instrumental events covering the period from seventh
century A.D. to 2012 is used and also 25 potential seismic
sources are modeled as area sources in the region. Seis-
micity parameters are evaluated by using the method in
which magnitude uncertainty and incompleteness of
earthquake data are considered. Seismic hazard assessment
is done for a grid of 300 points with 0.15 (degree) intervals
using the SEISRISKIII computer program. According to
modified methodology of probabilistic seismic hazard
analysis, the present study makes available more reliable
seismic hazard evaluation for Golestan region. The corre-
sponding results are presented by acceleration spectrum
charts with 10 and 2 % PE in 50 years for soft soil.
Determination of the geometry and location of potential
seismic sources
It is of note that, seismological indications are the main
parameters to choose potential seismic source regions.
Seismic source zones can be determined by using tectonic
information of the region and epicenter distributions of
earthquakes together with other available geological and
geophysical information. In this work, 25 area sources are
delineated in the ‘‘Golestan’’ region as shown in Fig. 8.
Attenuation relationship
Attenuation relationship has a prominent role in probabi-
listic seismic hazard analysis. Note that, attenuation rela-
tionship defined the correlation of ground motion
parameters with magnitude, distance and in some cases
other parameters. Moreover, they are affected by many
factors; the most important factors are presented below:
Fig. 8 Seismic sources of the region
140 Int J Adv Struct Eng (2014) 6:133–148
123

• Source specifications, magnitude, fault rupture type and
distance to the seismogenic sources.
• Wave path, reflection, refraction and energy absorption
due to the properties of materials through which the
waves pass.
• Geology and topology of site.
Selection of proper attenuation relationship is a vital
step to validate the analysis results. Therefore, in the cur-
rent study, a worldwide attenuation relationship proposed
by Ambraseys et al. (2005) is used. In this attenuation
relationship, the functional form is as shown in Eq. (1):
Log y ¼ a1 þ a2Mw þ ða3 þ a4MwÞLog
ffiffiffiffiffiffiffiffiffiffiffiffiffiffiffi
d2 þ a25
q
þ a6SS
þ a7SA þ a8FN þ a9FT þ a10FO; ð1Þ
where y is the horizontal PGA, Mw is the moment magni-
tude, d is the surface projection of the source to site dis-
tance, SS = 1 for soft soil sites and 0 otherwise, SA = 1 for
stiff soil sites and 0 otherwise, FN = 1 for normal faulting
earthquakes and 0 otherwise, FT = 1 for thrust faulting
earthquakes and 0 otherwise and FO = 1 for odd faulting
earthquakes and 0 otherwise.
Seismicity parameters in the state of seismotectonics
Estimating Mmax of potential earthquake sources As
mentioned above, the seismic sources are specified for the
study area, the subsequent step is to specify the maximum
earthquake magnitude for each seismic source that there
are two ways to determine it:
1. The first method is the maximum historical earthquake
procedure in which the maximum historical earthquake
is enhanced by half a magnitude unit, or specified
through a recurrence relationship.
2. The subsequent method is the fault rupture length proce-
dure that the most common feature is the surface rupture
length in this method. Usually, length of fault segments is
used for determining maximum magnitude earthquake in a
seismic source zone according to previous research.
Even so, in the current study, as demonstrated in Table 3
final Mmax values in the potential seismic sources of the
study region are specified by the two above methods and
incorporated with together. Besides, one of the most
commonly used models proposed by Wells and Copper-
smith (1994) is chosen.
Table 3 Spatial distribution
functions and Mmax
Source Mmax 5.5 \ Ms \ 6 6 \ Ms \ 6.5 6.5 \ Ms \ 7 7 \ Ms \ 7.5 7.5 \ Ms \ 8
1 7 0.0017 0.0009
2 7 0.0016 0.0008
3 7.7 0.0017 0.0009 0.0003 0.0001
4 7 0.0018 0.0009
5 7 0.002 0.0009
6 6.5 0.0014
7 7.5 0.008 0.0028 0.0012
8 7.5 0.0065 0.0023
9 6.5 0.0057
10 7 0.0015 0.0009
11 6.5 0.0014
12 7 0.00180 0.0009
13 6.5 0.0015
14 7.9 0.0064 0.0025 0.001 0.0003
15 7 0.0071 0.0028
16 7 0.0073 0.0029
17 7 0.0065 0.0025
18 7.5 0.0077 0.0029 0.0011
19 7.5 0.0082 0.0029 0.0012
20 7.5 0.0069 0.0025 0.0011
21 6.5 0.0055
22 7 0.0082 0.0031
23 6.5 0.0028 0.0010
24 6.5 0.0026 0.0009
25 7 0.0035 0.0013 0.0002
Int J Adv Struct Eng (2014) 6:133–148 141
123
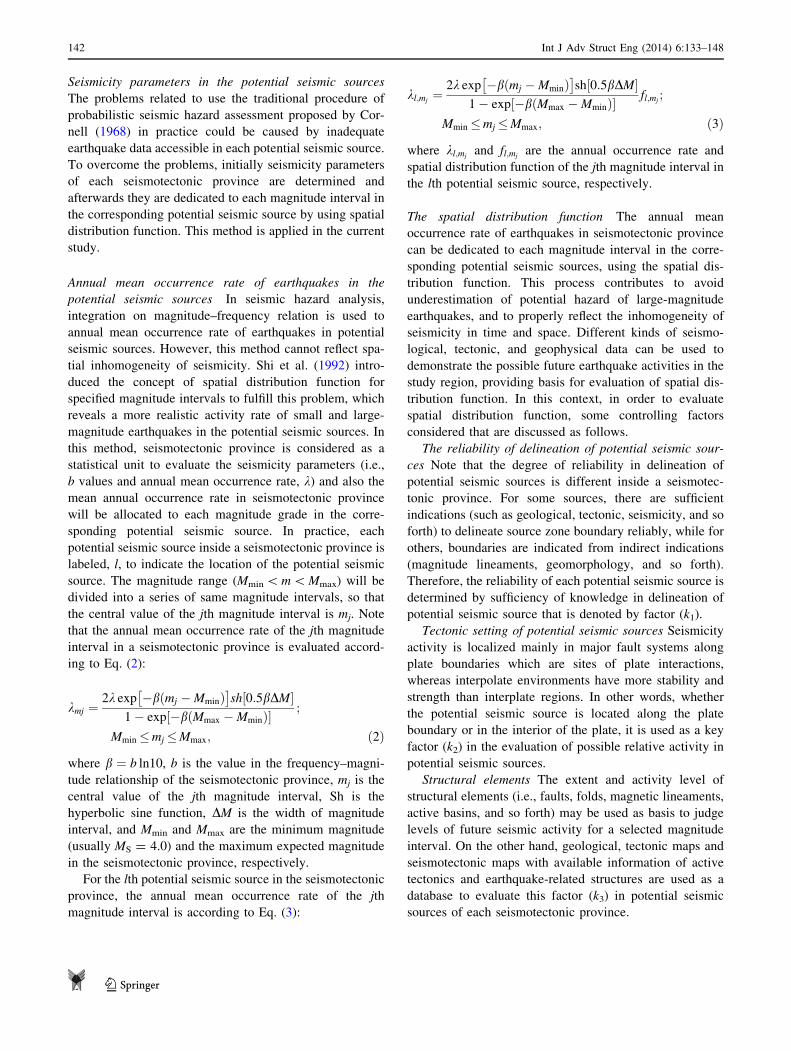
Seismicity parameters in the potential seismic sources
The problems related to use the traditional procedure of
probabilistic seismic hazard assessment proposed by Cor-
nell (1968) in practice could be caused by inadequate
earthquake data accessible in each potential seismic source.
To overcome the problems, initially seismicity parameters
of each seismotectonic province are determined and
afterwards they are dedicated to each magnitude interval in
the corresponding potential seismic source by using spatial
distribution function. This method is applied in the current
study.
Annual mean occurrence rate of earthquakes in the
potential seismic sources In seismic hazard analysis,
integration on magnitude–frequency relation is used to
annual mean occurrence rate of earthquakes in potential
seismic sources. However, this method cannot reflect spa-
tial inhomogeneity of seismicity. Shi et al. (1992) intro-
duced the concept of spatial distribution function for
specified magnitude intervals to fulfill this problem, which
reveals a more realistic activity rate of small and large-
magnitude earthquakes in the potential seismic sources. In
this method, seismotectonic province is considered as a
statistical unit to evaluate the seismicity parameters (i.e.,
b values and annual mean occurrence rate, k) and also the
mean annual occurrence rate in seismotectonic province
will be allocated to each magnitude grade in the corre-
sponding potential seismic source. In practice, each
potential seismic source inside a seismotectonic province is
labeled, l, to indicate the location of the potential seismic
source. The magnitude range (Mmin \ m \ Mmax) will be
divided into a series of same magnitude intervals, so that
the central value of the jth magnitude interval is mj. Note
that the annual mean occurrence rate of the jth magnitude
interval in a seismotectonic province is evaluated accord-
ing to Eq. (2):
kmj ¼2k exp �bðmj � MminÞ
� �
sh 0:5bDM½ �1 � exp �bðMmax � MminÞ½ � ;
Mmin �mj �Mmax; ð2Þ
where b ¼ b ln10, b is the value in the frequency–magni-
tude relationship of the seismotectonic province, mj is the
central value of the jth magnitude interval, Sh is the
hyperbolic sine function, DM is the width of magnitude
interval, and Mmin and Mmax are the minimum magnitude
(usually MS = 4.0) and the maximum expected magnitude
in the seismotectonic province, respectively.
For the lth potential seismic source in the seismotectonic
province, the annual mean occurrence rate of the jth
magnitude interval is according to Eq. (3):
kl;mj¼
2k exp �bðmj � MminÞ� �
sh 0:5bDM½ �1 � exp �bðMmax � MminÞ½ � fl;mj
;
Mmin �mj �Mmax; ð3Þ
where kl;mjand fl;mj
are the annual occurrence rate and
spatial distribution function of the jth magnitude interval in
the lth potential seismic source, respectively.
The spatial distribution function The annual mean
occurrence rate of earthquakes in seismotectonic province
can be dedicated to each magnitude interval in the corre-
sponding potential seismic sources, using the spatial dis-
tribution function. This process contributes to avoid
underestimation of potential hazard of large-magnitude
earthquakes, and to properly reflect the inhomogeneity of
seismicity in time and space. Different kinds of seismo-
logical, tectonic, and geophysical data can be used to
demonstrate the possible future earthquake activities in the
study region, providing basis for evaluation of spatial dis-
tribution function. In this context, in order to evaluate
spatial distribution function, some controlling factors
considered that are discussed as follows.
The reliability of delineation of potential seismic sour-
ces Note that the degree of reliability in delineation of
potential seismic sources is different inside a seismotec-
tonic province. For some sources, there are sufficient
indications (such as geological, tectonic, seismicity, and so
forth) to delineate source zone boundary reliably, while for
others, boundaries are indicated from indirect indications
(magnitude lineaments, geomorphology, and so forth).
Therefore, the reliability of each potential seismic source is
determined by sufficiency of knowledge in delineation of
potential seismic source that is denoted by factor (k1).
Tectonic setting of potential seismic sources Seismicity
activity is localized mainly in major fault systems along
plate boundaries which are sites of plate interactions,
whereas interpolate environments have more stability and
strength than interplate regions. In other words, whether
the potential seismic source is located along the plate
boundary or in the interior of the plate, it is used as a key
factor (k2) in the evaluation of possible relative activity in
potential seismic sources.
Structural elements The extent and activity level of
structural elements (i.e., faults, folds, magnetic lineaments,
active basins, and so forth) may be used as basis to judge
levels of future seismic activity for a selected magnitude
interval. On the other hand, geological, tectonic maps and
seismotectonic maps with available information of active
tectonics and earthquake-related structures are used as a
database to evaluate this factor (k3) in potential seismic
sources of each seismotectonic province.
142 Int J Adv Struct Eng (2014) 6:133–148
123

Characteristics of seismic activity Distribution of large
and small earthquakes may not be the same in a seismo-
tectonic province due to local differences in physical
properties of the earth’s crust. This feature is very impor-
tant to quantify and reflect such differences of seismic
activity in seismic hazard analysis. In general, there is no
appropriate method to clearly recognize and quantify such
differences. For this reason, this regional variation is gen-
erally accepted. In the current study, it is assumed that
seismic history of the region may, in part, reflects differ-
ences of physical properties to incorporate this important
element in seismic hazard analysis. Since incompleteness
of the available data and uncertainties in different earth-
quake parameters recorded earthquakes cannot fully show
such differences, it is worth nothing; therefore, in order to
consider of this factor (k4) special attention should be paid
to reliability of earthquake records.
Analysis method Yan (1993) presented the calculation of
spatial distribution function based on the controlling fac-
tors that is formulated by the method of equal weight
summation, as follows:
• A distribution coefficient Wlmjk is assigned for the
selected factor ki, in which i = 1–4, for each magnitude
interval mj in the lth potential source,
• According to Eq. (4), in each seismotectonic province
the distribution coefficient is normalized to obtain the
factor load:
Qlmjk ¼Wlmjk
P
Wlmjk
; ð4Þ
• Loads of controlling factors in each potential source are
used to define total load, Rlmj, which is simply the sum
of factor loads, as shown in Eq. (5):
Rlmj¼
X
Qlmjk; ð5Þ
• The total load Rlmjis normalized in each province to
obtain the spatial distribution function for the jth
magnitude interval in the lth potential seismic source,
as shown in Eq. (6):
flmj¼
RlmjP
Rlmj
: ð6Þ
Limitations associated with the use of these equations are:
the selected factor k in our study changes from 1 to 4, and
mj is the magnitude intervals. The number of potential
sources (l) ranges from 1 to 25.
Background earthquake In the regions in which lack of
information does not allow for delineation of potential
seismic sources, and even in areas where active faults are
defined, it is necessary to model background earthquake
(background seismicity). In the concept of background
seismicity, small and moderate-sized earthquakes may
occur in the defined area randomly. In this study, back-
ground earthquake values are defined as MS = 6 for Al-
borz-Azarbayejan and Kopedagh provinces and MS = 5.5
for Central-East Iran province.
Hazard assessment for Golestan region
So far, numerous seismic hazard forecasting models
were developed by many researchers. In this regard, the
amply used model is the Poisson model with the
assumptions that seismic occurrences are spatially and
temporally independent and the probability that two
seismic occurrences will take place coincidentally
approaches zero and at the same location. A usual pre-
sumption in most of the seismic hazard models is that
seismic sources are homogeneous. This means that every
point within the same source has identical probability of
being an epicenter for a future earthquake. On the other
hand, this presumption provides seismic hazard outputs
leading to variation at the borders of seismic zones. In
order to provide a smooth transition of probability of
seismic hazard from the seismic source to the adjacent
areas, the notion of ‘‘earthquake location uncertainty’’ is
introduced by Bender and Parkins (Bender and Perkins
1987). They supposed that each point within the zone is
considered as the mean or the most likely location of a
future earthquake; the locations of actual earthquakes are
normally distributed with standard deviation about their
mean locations. Seismic hazard evaluation of Golestan
with centrality of Kavus for 10 % probability of
exceedance (475 years return period) and 2 % probabil-
ity of exceedance (2,475 years return period) is con-
ducted for soft soil (type III); hereby, acceleration
spectrum charts has been revealed for 10 and 2 %
probability of exceedance in 50 years (Fig. 9).
Modal analysis
The modal analysis is the prerequisite for the spectrum
analysis. In other words, the results of modal analysis
can be used in the dynamic spectrum analysis. The
notable point here is that the modal analysis is done in
linear limits in ANSYS and even if nonlinear elements
and features are defined, neither of them will be con-
sidered, and consequently dynamic analysis is done in
linear limits. The graphical results of the modal analysis
for the 10 main modes, including transitional and
Int J Adv Struct Eng (2014) 6:133–148 143
123
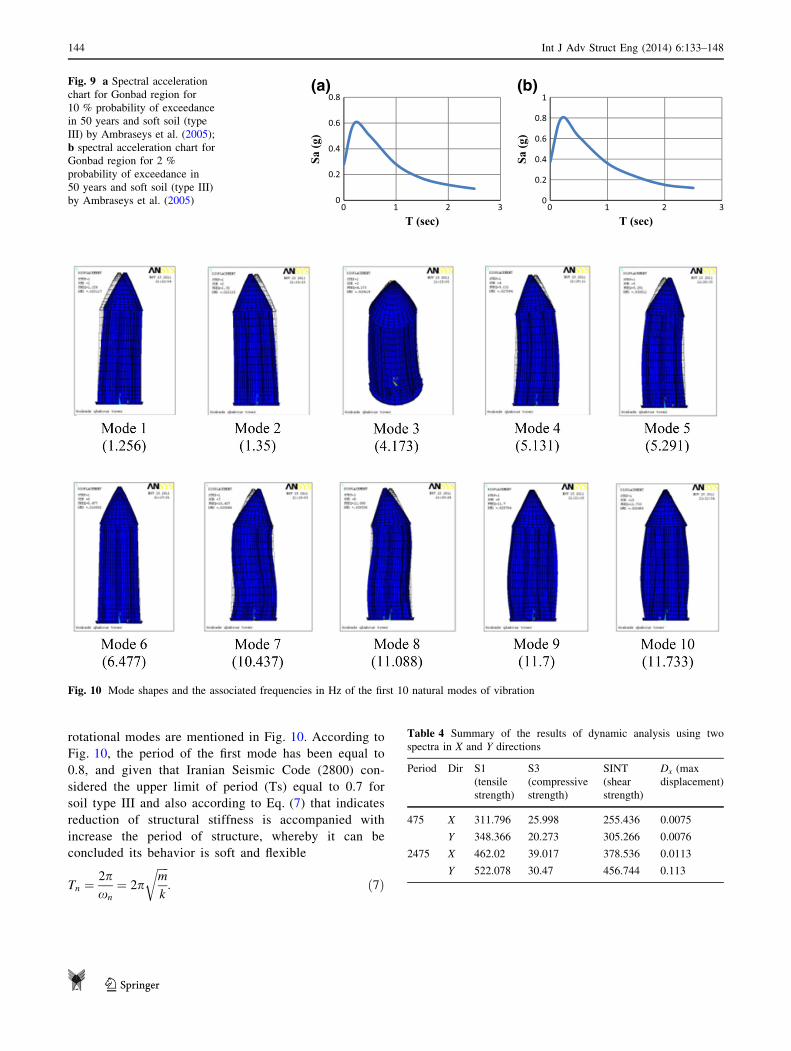
rotational modes are mentioned in Fig. 10. According to
Fig. 10, the period of the first mode has been equal to
0.8, and given that Iranian Seismic Code (2800) con-
sidered the upper limit of period (Ts) equal to 0.7 for
soil type III and also according to Eq. (7) that indicates
reduction of structural stiffness is accompanied with
increase the period of structure, whereby it can be
concluded its behavior is soft and flexible
Tn ¼ 2pxn
¼ 2p
ffiffiffiffi
m
k
r
: ð7Þ
0
0.2
0.4
0.6
0.8
Sa (g
)
T (sec)
0
0.2
0.4
0.6
0.8
1
0 1 2 3 0 1 2 3
Sa (g
)
T (sec)
(a) (b)Fig. 9 a Spectral acceleration
chart for Gonbad region for
10 % probability of exceedance
in 50 years and soft soil (type
III) by Ambraseys et al. (2005);
b spectral acceleration chart for
Gonbad region for 2 %
probability of exceedance in
50 years and soft soil (type III)
by Ambraseys et al. (2005)
Fig. 10 Mode shapes and the associated frequencies in Hz of the first 10 natural modes of vibration
Table 4 Summary of the results of dynamic analysis using two
spectra in X and Y directions
Period Dir S1
(tensile
strength)
S3
(compressive
strength)
SINT
(shear
strength)
Dx (max
displacement)
475 X 311.796 25.998 255.436 0.0075
Y 348.366 20.273 305.266 0.0076
2475 X 462.02 39.017 378.536 0.0113
Y 522.078 30.47 456.744 0.113
144 Int J Adv Struct Eng (2014) 6:133–148
123
Dynamic analysis
The dynamic analysis is not an exact analysis method
meaning that its results are not the same as the time history
analysis. But for many cases, the results are exact enough
for designing the structure. Apart from this problem, there
are some limitations for this method:
1. This method is applicable for linear analysis.
2. This method is not applicable for situations in which
there are asymmetrical excitations in its supports.
Since the spectrum analysis is done linearly, for
obtaining a logical conclusion for analysis of the results,
study of the principle stress and comparing them with the
recommended allowable stress, the parts of the structure
which are cracked and prone to compression failure have
been discovered.
Therefore according to note 2-2-4-13 of the Iranian
Seismic Code (2800), the number of seismic modes in each
perpendicular direction of the building must take the fol-
lowing conditions into account, but only any of which is
more in number: at least the three first modes, or all modes
of vibrations with period times more than 0.4 s or all
modes of vibration in which the sum of their effective
masses are more than 90 % of the total mass of the
structure. According to the results of modal analysis, there
are 25 modes which their periods of time are more than
0.4 s. Since the period time of various modes of the
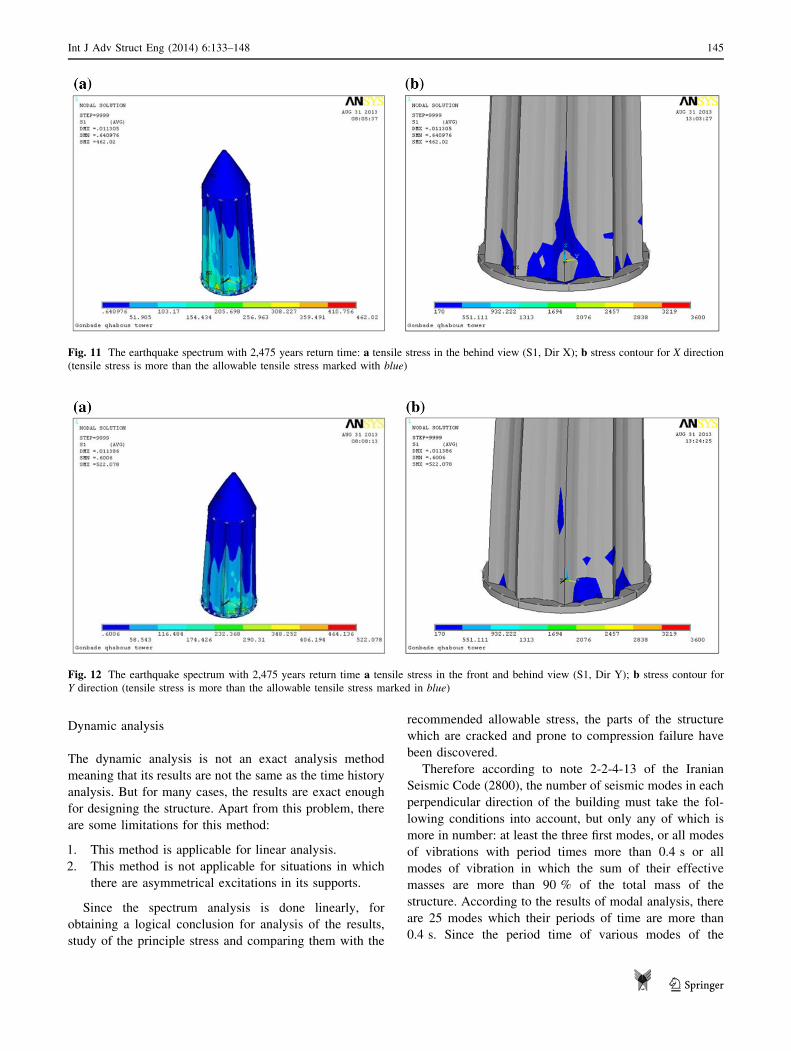
Fig. 11 The earthquake spectrum with 2,475 years return time: a tensile stress in the behind view (S1, Dir X); b stress contour for X direction
(tensile stress is more than the allowable tensile stress marked with blue)
Fig. 12 The earthquake spectrum with 2,475 years return time a tensile stress in the front and behind view (S1, Dir Y); b stress contour for
Y direction (tensile stress is more than the allowable tensile stress marked in blue)
Int J Adv Struct Eng (2014) 6:133–148 145
123

structure are very close to each other and also they do not
satisfy the Eq. (8), for combining the effects of different
modes, the Complete Quadratic Combination (CQC)
method is used.
r ¼ Tm
Tn
� 0:67; Tn [ Tmð Þ; ð8Þ
where the damping ratio is assumed as 5 % and Tn and Tm
are period times for modes n and m, respectively.
In the current study, the spectrum analysis is shown by
using two spectra that are obtained by risk analysis method
with of 475 and 2,475 years return periods, and each of
these spectra have been studied separately for both X and
Y directions. In the following, the results of this analysis
are studied and compared.
Discussion on the result of the dynamic analysis under
site-specific spectrum with 475 years and 2,475 years
return period
According to the results of spectrum analysis by using the
site-specific spectrum with 475 and 2,475 years return
period, the values of stresses and displacements obtained
for both directions (X and Y) are presented to Table 4. By
comparing the values, it can be seen that Gonbad-e Kavus
tower has a good resistance against the two spectra
obtained from risk analysis. However, according to
Figs. 11a and 12a, in the lower parts of the body during an
earthquake with probability of exceedance 2 % in 50 years,
maximum tensile stress 522.078 and 462.02 KN/m2 are
generated in Y and X directions, respectively, that are
greater than the allowable value (170 KN/m2) seen at the
backward facade of the structure. In this region, there is
possibility of cracks in the direction perpendicular to the
tensile stress that it could endanger the stability of the
structure. It can be concluded that the common methods of
retrofitting brick buildings for the lower parts of the dome
can be used to prevent cracking due to tensile stress. In
order to better delineate the parts of the tower with tensile
stress more than the allowable tensile stress using the
earthquake spectrum with 2,475 years return time, a stress
contour under the tensile stress S1 is presented in Figs. 11b
and 12b. In these figures, the parts with tensile stress more
than the allowable tensile stress are marked with blue
(Figs. 11b, 12b). In addition, that of the maximum tensile
stresses (i.e., S1) created by an earthquake with the
475 years return period in two directions of the structure
are more than the allowable value (170 KN/m2). However,
we can ignore this in the backward view of the structure
and in the connection point of the foundation and the body
because it comprises very little surface area (Fig. 13). Also,
by comparing the maximum compression stresses (i.e., S3)
and shear stresses (i.e., Sint), in Table 4, with allowable
values (i.e., 3,600 and 1,800 KN/m2, respectively) in the
earthquake with 475 years and 2,475 years return period, it
can be concluded that the maximum stresses that appear in
both directions are less than the allowable values, so that
these values indicate that the structure has enough resis-
tance under shear and compression stresses and brick
structures have good resistance under lateral forces.
Conclusions
In the current paper, seismic behavior of Gonbad-e Kavus
tower using the maps available at the organization of
Cultural Heritage of Golestan Province by finite element
software ANSYS is studied. Also the accuracy of model is
Fig. 13 The earthquake spectrum with 475 years return time: a tensile stress in the behind view (S1, Dir X); b tensile stress in the behind view
(S1, Dir Y)
146 Int J Adv Struct Eng (2014) 6:133–148
123
approved by gravity analysis, results of this analysis affirm
that load transfer is done correctly among the elements, and
the obtained weight is 86,400 KN.
Then probabilistic seismic hazard assessment has been
performed for Gonbad region. In order to prepare the
acceleration spectrum charts of the region, an area about
120 km is selected. Dividing the region to a grid of 0.15� in
longitude and latitude and using the SEISRISK III com-
puter software, seismic hazard assessment of 300 grid
points has been carried out. Peak ground acceleration
(PGA) and spectral acceleration (Sa) in T = 0.2, 0.5, 1.0,
1.5, 2.0, 2.5 s for 2 % probability of exceedance (return
period of 2,475 years) and 10 % probability of exceedance
(return period of 475 years), in soil type III, have been
estimated; consequently, PGA values are estimated to be
0.28 times gravity for 475 years return period.
Next step is modal analysis using spectral analysis; in
this step, first period time is 0.75 s that indicates the
structure is a soft construction. Then spectral analysis is
done to identify the parts of the dome with stress more than
the allowable stress. The results of spectral analysis in two
X and Y directions for earthquake with 475 years period
time show that the structure is resistant against used
earthquake spectra well, just in some very small parts in the
lowest part of dome, the maximum amount of tensile stress
exceeds the allowable stress, 170 KN/m2. However, this
part can be ignored because it is too small and it cannot
cause a serious threat to stability. But for earthquake with
of 2,475 years period duration tensile stress in more part of
the building exceeds the allowable stress, 170 KN/m2 and
deeper cracks exist in the weak parts. In other words,
earthquakes in this level can cause damage to the overall
structure of the tower.
In general, according to historical analyses, the tower
has good compressive resistance due to large load-bearing
members of the structure, and tensile resistance identifies
the weak parts. However, new technologies can suggest
good ways to improve the seismic behavior of these cul-
turally important buildings. There is hope that these efforts
lead to the protection of valuable constructions that are the
cultural and civil of signs of the country.
Open Access This article is distributed under the terms of the
Creative Commons Attribution License which permits any use, dis-
tribution, and reproduction in any medium, provided the original
author(s) and the source are credited.
References
Ahmadi GR, Mesbah A, Vetr MG (2012) Seismic vulnerability
analysis and rehabilitation of Gonbad-e-Kavous Tower (The
Tallest Brick Tower in the World). In: 15th International
Conference on Earthquake. Lisbon
Ambraseys NN, Melville CP (2005) A history of Persian earthquakes.
Cambridge University Press, Cambridge
Ambraseys NN, Douglas J, Sarma SK, Smit PM (2005) Equations for
the estimation of strong ground motions from shallow crustal
earthquakes using data from Europe and the Middle East:
vertical peak ground acceleration and spectral acceleration. Bull
Earthq Eng 3(1):55–73
ANSYS (2007) Finite element analysis system, SAS IP Inc., US
ANSYS (2007) Elements reference, release 11.0, SAS IP Inc., US
Anthony J, Wolanski BS (2004) Flexural behavior of reinforced and
prestressed concrete beams using finite element analysis. Faculty
of the Graduate School, Marquette University
Bartoli Gianni, Betti Michele, Giordano Saverio (2013) In situ static
and dynamic investigations on the ‘‘Torre Grossa’’ masonry
tower. Eng Struct 52:718–733
Bayraktar Alemdar, Abdurrahman Sahin D, Ozcan Mehmet, Yildirim
Faruk (2010) Numerical damage assessment of Haghia Sophia
bell tower by nonlinear FE modeling. Appl Math Model
34(1):92–121
Bender B, Perkins DM (1987) SeisriskIII: a computer program for
seismic hazard estimation. US Geol Surv Bull 1772
Binda Luigia, Zanzi Luigi, Lualdi Maurizio, Condoleo Paola (2005)
The use of georadar to assess damage to a masonry Bell Tower
in Cremona, Italy. NDT & E Int 38(3):171–179
Carpinteri A, Invernizzi S, Lacidogna G (2005) In situ damage
assessment and nonlinear modelling of a historical masonry
tower. Eng Struct 27:387–395
Ceroni F, Pecce M, Voto S, Manfredi G (2009) Architectural, and
structural assessment of the bell tower of Santa Maria Del
Carmine. Int J Archit Herit 3(3):169–194
Cornell CA (1968) Engineering seismic risk analysis. Bull Seismol
Soc Am 58(5):1583–1606
D’Ambrisi Angelo, Mariani Valentina, Mezzi Marco (2012) Seismic
assessment of a historical masonry tower with nonlinear static
and dynamic analyses tuned on ambient vibration tests. Eng
Struct 36:210–219
Datta TK (2010) Seismic analysis of structures. Wiley, Hoboken
Ghodrati Amiri G, Razavian Amrei SA, Motamed R, Ganjavi B
(2007) Uniform hazard spectra for different northern part of
Tehran, Iran. J Appl Sci 7(22):3368–3380
Green, Russell Andrew, William J Hall (1994) An overview of
selected seismic hazard analysis methodologies
Hejazi M, Nasri A (2009) Structural analysis of Dome Qaboos. In: 8th
International Congress on Civil Engineering. Shiraz university,
Shiraz (in persian)
Instruction for seismic rehabilitation of existing unreinforced
Masonry Buildings No.376 (2007) Technical Criteria Codifica-
tion and Earthquake Risk Reduction Affairs Bureau (in persian)
Iranian Network Management Services Company (irmeco) (2010)
Seismic retrofit of experiences and lessons. Science and Liter-
ature Publishing (in persian)
Ivorra Salvador, Pallares Francisco J (2006) Dynamic investigations
on a masonry bell tower. Eng Struct 28(5):660–667
Kachlakev D, Miller T, Yim S, Chansawat K, Potisuk T (2001) Finite
element modeling of concrete structures strengthened with FRP
laminates: final report
Kayabali K, Akin M (2003) Seismic hazard map of Turkey using the
deterministic approach. Eng Geol 69(1–2):127–137
Klugel JU, Mualchin L, Panza GF (2006) A scenario-based procedure
for seismic risk analysis. Eng Geol 88(1–2):1–22
Krinitzsky EL (2003) How to combine deterministic and probabilistic
methods for assessing earthquake hazards. Eng Geol 70(1–2):
157–163
Lourenco PB (2005) Assessment, diagnosis and strengthening of
Outeiro Church, Portugal. Constr Build Mater 19(8):634–645
Int J Adv Struct Eng (2014) 6:133–148 147
123

Mavizchi M, Mavizchi M, Alemi F (2012) The vulnerability seismic
assessment and providing reinforcement strategies for ‘‘Naj-
moddin Kobra’’ historical monument. In: 15th International
Conference on Earthquake. Lisbon
Milani G, Casolo S, Tralli A, Naliato A (2012) Seismic assessment of
a medieval Masonry Tower in Northern Italy by limit, nonlinear
static, and full dynamic analyses. Int J Archit Herit 6:489–524
Mirzaei N (1997) Seismic Zoning of Iran. Ph.D. dissertation in
Geophysics, Institute of Geophysics, State Seismological
Bureau, Beijng, People’s Republic of China, p 134
Mirzaei Noorbakhsh, Gao Mengtan, Chen Yun-tai (1999) Delineation
of potential seismic sources for seismic zoning of Iran.
J Seismolog 3(1):17–30
Modena C, Valluzzi MR, Tongini FR, Binda L (2002) Design choices
and intervention techniques for repairing and strengthening of
the Monza cathedral bell-tower. Constr Build Mater 16:385–395
Moratto L, Orlecka-Sikora B, Costa G, Suhadolc P, Papaioannou Ch,
Papazachos CB (2007) A deterministic seismic hazard analysis
for shallow earthquakes in Greece. Tectonophysics 442(1–4):
66–82
Mualchin L (2005) Seismic hazard analysis for critical infrastructures
in California. Eng Geol 79(3–4):177–184
Nakajima M, Choi IK, Ohtori Y, Choun YS (2007) Evaluation of
seismic hazard curves and scenario earthquakes for Korean sites
based on probabilistic seismic hazard analysis. Nucl Eng Des
237(3):277–288
Nateghi-Alahi F, Alemi F (2008) Experimental study of seismic
behaviour of typical iranian urm brick walls. In: 14th Interna-
tional Conference on Earthquake. Beijing, China
No, Standard (2005) 2800 Iranian Code of Practice for Seismic
Resistant Design of Buildings’’, Third Revision, Building and
Housing Research Center, Iran (in persian)
Pace B, Boncio P, Brozzetti F, Lavecchia G, Visini F (2008) From
regional seismic hazard to ‘‘scenario earthquakes’’ for seismic
microzoning: a new methodological tool for the Celano Project.
Soil Dyn Earthq Eng 28(10–11):866–874
Pena Fernando, Lourenco Paulo B, Mendes Nuno, Oliveira Daniel V
(2010) Numerical models for the seismic assessment of an old
masonry tower. Eng Struct 32(5):1466–1478
Repeated Author (2009) How to eliminate non-damaging earthquakes
from the results of a probabilistic seismic hazard analysis
(PSHA)—A comprehensive procedure with site-specific appli-
cation. Nuclear Engineering and Design 239 (12):3034-3047
Riva Paolo, Perotti Federico, Guidoboni Emanuela, Boschi Enzo
(1998) Seismic analysis of the Asinelli Tower and earthquakes in
Bologna. Soil Dyn Earthq Eng 17(7–8):525–550
Shabani E, Mirzaei N (2007) Probabilistic seismic hazard assessment
of the Kermanshah-Sanandaj Region of Western Iran. Earthq
Spectra 23(1):175–197
Shi Zhenliang, Yan Jiaquan, Gao Mengtan (1992) Research on the
principle and methodology of seismic zonation. Acta Seismol
Sin 5(2):305–314
Tasnimi A (2005) Behavior of the brick buildings with or without
Skein Disaster Research Center, Tehran (in persian)
Tavakoli B, Ghafory-Ashtiany M (1999) Seismic hazard assessment
of Iran. Ann Geophys 42 (6)
Wells DL, Coppersmith KJ (1994) New empirical relationships
among magnitude, rupture length, rupture width, rupture area,
and surface displacement. Bull Seismol Soc Am 84(4):974–1002
Architectural and Historical background and of Gonbad-e Kavus
Tower. Pictures and maps gathered from Golestan Cultural
Heritage
IIEES: International Institute of Earthquake Engineering and Seis-
mology. http://www.iiees.ac.ir
Ngdir: National Geoscience Database of Iran, http:/WWW.ngdir.ir
USGS. US Geological Survey, http:/WWW.USGS.gov
Whc.unesco: World Heritage Convention. United Nations Education,
Scientific and Cultural Organization, http://whc.unesco.org/en/
statesparties/IR
Yan J (1993) Principals and methods to determine spatial distribution
function. In: Proceedings, PRC/USSR Workshop on Geodynam-
ics and Seismic Risk Assessment. Beijing, pp 159–167
148 Int J Adv Struct Eng (2014) 6:133–148
123