using simulation and the theory of constraints · pdf fileusing simulation and the theory of...
TRANSCRIPT
Copyright is vested with IMHC
Using Simulation And The Theory Of Constraints To Optimise Materials Handling Systems
Author: Willie Vermaak Co-Author: Dannie Venter Anglo Technical Division
1. INTRODUCTION
Simulation, especially with modern day computer technology, is a powerful tool that can be used to create a virtual representation of any real-life or planned system. A simulation model can be used to perform what-if scenarios and predict future system behaviour, as well as to make recommendations for improvements to the system. When building a simulation model, most dependencies between the different elements (sub-systems) comprising the total system, as well as variations within the behaviour of the system can be included in the model, to arrive at an accurate enough representation of the system in question.
However, just like a surgical knife in the hands of an incompetent surgeon, can do more damage than good to a patient, even fatally wounding the patient, so can simulation lead to fatal decisions for a business. If not applied within a correct framework that can guide it, and determine the direction of the solution that is sought, buying simulation software can be the worst investment a business makes.
The Theory of Constraints (T.O.C.) is such a framework that can be used to guide a simulation project to ensure that the right questions are asked and the right solutions obtained. The Theory of Constraints provides a set of principles that enables a global understanding of a system, and leads us in the direction of the solution that will truly optimise system performance.
Using Simulation, guided by the Theory of Constraints, allows decision-makers to deal with any process as a totally integrated system, including all variations and interdependencies between sub-systems. It guides management in deciding on the goal of the business, identifying the constraints that prohibit us from better performance, and lead management in the direction of the solution. As a combined tool, simulating the T.O.C.-way, enables management to:
identify the correct areas for improvement (to elevate or eliminate current capacity constraints),
accurately test alternatives to arrive at the best solution,
and ultimately to optimise the overall performance of the system (business).
It is not the intention of this paper to comprehensively discuss T.O.C. or simulation, but rather to introduce the reader to the underlying concepts of these philosophies/techniques, and to show how T.O.C. and simulation can be used to optimise any materials handling system.

USING SIMULATION AND THE THEORY OF CONSTRAINTS TO OPTIMISE MATERIALS HANDLING SYSTEMS W. Vermaak and D. Venter
Copyright is vested with IMHC Page 2 of 19
2. A SIMPLE SYSTEM
Consider the following simple system: four processes (machines) “A” to “D” in a flow line, with variable processing times. Assume processed parts are moved from one process to the other without any time delay.
Figure 1: A simple system
Even for this simple system, assuming a constant supply of raw materials, similar (but variable) processing times, no materials handling delays and no breakdowns, it is impossible, at first inspection, to answer questions like:
What will be the inventory build-up between “B” and “C” at a specific time?
What will be the average lead-time per finished part?
Reasons for this are:
All (or at least some) of the sub-systems in any system is mutually dependent, i.e. in our example “C” must wait for “B” to finish processing a part before it can start processing that part.
Inherent in any real-life system is variation, i.e. systems are stochastic of nature. Processing times and other factors influencing the system are not constant but vary according to some statistical distribution. In our example we used a triangular distribution of minimum 4, most likely 5, and maximum 6 time units for the processing time at each sub-system.
Systems are dynamic, always changing.
A first reasonable guess for the average lead-time per finished part might be 5 time units per part. But…because of the variation and inter-dependencies in the system, the actual average lead-time is close to 6 time units.
From this simple example it is clear that for the complex systems we manage in real-life, it is impossible to predict system behaviour and therefore make informed and scientifically-based decisions without an understanding of the nature of systems, as well as the tools to accurately simulate system behaviour. Without these, we can at most count on our experience or “gut feel”. In today’s competitive world, that is surely not enough anymore.
A B C D
Time: (4,5,6)
Time: (4,5,6)
Time: (4,5,6)
Time: (4,5,6)
Raw Materials Finished Goods
4 = the minimum time.
5 = the most likely time. 6 = the maximum time.

USING SIMULATION AND THE THEORY OF CONSTRAINTS TO OPTIMISE MATERIALS HANDLING SYSTEMS W. Vermaak and D. Venter
Copyright is vested with IMHC Page 3 of 19
3. THEORY OF CONSTRAINTS
3.1. Background
Israeli physicist turned industry researcher, Eli Goldratt, developed the Theory of Constraints. After switching in 1978 from research in physics to researching industry, and introducing a computerised scheduling system in 1979, he started coming to the fore as one of the leading new thinkers about industry and the problems it faces.
He developed the Theory of Constraints and the consequent Thinking Process as an all-encompassing new set of principles for managing industry.
His book The Goal [1] went a long way in making the principles of T.O.C. more widely known and accepted.
3.2. Theory of Constraints overview
The ultimate goal of every business is to make money, to maximise profit. There are however constraints in the way of achieving this goal. As the name suggests, T.O.C. deals with these constraints, how to identify it, and how to eliminate or elevate them. Most common is the capacity constraint (physical constraint e.g. the slowest process), but it also deals with policy constraints (constraints in industry brought about by counteractive or ineffective policies). “The core idea in the Theory of Constraints (T.O.C.) is that every real system such as a profit-making enterprise must have at least one constraint. If it were not true, then the system would produce an infinite amount of whatever it strives for.” [2]
The constraint governs the performance of the whole system. The system can only produce as fast as the constraint can. Increasing the capacity of the constraint will ensure increased capacity for the whole system. Increasing the capacity of sub-systems other than the constraint does not guarantee improved system performance, in most cases it only increases inventory and costs with no improved production (throughput).
T.O.C. suggests a five-step process for continuous improvement of any system:
Step 1: Identify the system’s constraint(s).
The following questions can be asked:
Which resource always causes us to be late on due dates, behind on schedule?
For which resource are we always waiting?
In front of which resource is a constant build-up of inventory?
Which resource always has to work overtime?
Of which resource do we have too few?
Which resource consistently has the highest utilisation?
Step 2: Decide how to exploit the system’s constraints.
Every effort must be made to get the most out of the constraint. No time must be wasted or lost on this resource.

USING SIMULATION AND THE THEORY OF CONSTRAINTS TO OPTIMISE MATERIALS HANDLING SYSTEMS W. Vermaak and D. Venter
Copyright is vested with IMHC Page 4 of 19
Step 3: Subordinate everything else to the decision(s) in step 2.
All the other resources must be subordinated to the efforts to exploit the constraint. If necessary, schedules must be adjusted, work re-allocated etc. Everybody must co-operate to get the maximum out of the constraint.
Step 4: Elevate the constraint(s)
Upgrade the resource or buy more of the resource, increase its capacity.
Step 5: When the constraint has been broken, close the loop.
When the constraint resource has been adequately improved, the constraint will shift to another resource, and must yet again be identified and broken. The process must be repeated. This ensures continuous improvement.
3.3. A Simple System – revisited
Consider the example of a simple system described before. In this case, however we change the processing time for parts on machine “C” to a triangular distribution of (7,8,9) time units. This makes “C” the slowest resource and therefore the capacity constraint in the system. Because “C” is consistently slower than “A” and “B”, there will be a consistent build-up of inventory in front of “C” (note the triangle depicting
Figure 2: A simple system with a constraint.
inventory). This is if we allow “A” and “B” to operate at their capacities. Of course, due to the variation inherent to the system, slight inventories will build up periodically between any two machines, but will just as quickly be depleted again. Inventory in front of the constraint will however consistently build up.
A few assumptions can be made regarding this system by just using what was learned so far from the Theory of Constraints and a bit of “common sense”.
The system will at best produce one part every 7 time units (the best production rate for the constraint). As will be shown later with the aid of simulation, the actual production rate for the system is worse - closer to one part every 9 time units (again, because of the variation and inter-dependencies inherent to the system).
There will be a consistent build up of inventory in front of “C”.
Improving the performance of either “A” or “B” will not increase system performance, but only increase the inventory in front of “C”.
Improving the performance of “D” will not increase system performance, but only increase waiting time for “D” (time spent waiting for parts from “C”).
Improving the performance of “C” will definitely increase system performance, to the degree where “C” is no longer the capacity constraint.
Raw Materials Finished Goods A B C D
Time: (4,5,6)
Time: (4,5,6)
Time: (7,8,9)
Time: (4,5,6)

USING SIMULATION AND THE THEORY OF CONSTRAINTS TO OPTIMISE MATERIALS HANDLING SYSTEMS W. Vermaak and D. Venter
Copyright is vested with IMHC Page 5 of 19
3.4. What the Theory of Constraints does not do
1T.O.C. is a set of principles or guidelines for managing (improving) system
performance. It describes the direction of the solution, the “what to change” and “what to change to”. It does not, however supply the T.O.C. practitioner with detailed, scientifically based tools for analysing and predicting system behaviour. It relies greatly on “common sense” to indicate the direction of the solution, and to a lesser degree on detailed numerical analyses to determine the actual “nuts and bolts” of the solution.
This gap is uniquely filled by computer simulation. Simulation is a detailed and mathematically sound tool for analysing and predicting system behaviour. T.O.C. supplies the framework within which simulation can be used to optimise any materials handling system.
Following are a few examples of where simulation can be effectively used to complement a T.O.C. implementation:
Identify the Constraint
T.O.C. relies on a process of logical deduction without much mathematical analysis to find the constraint. For any reasonably complex real-life system, this is very difficult, and in many cases arbitrary. Simulation can be, and has with success been used, to pinpoint the constraint with certainty.
Predicting the shift of the constraint
As with identifying the constraint in the first place, T.O.C. again relies on logical deduction and the measurements put into place during the implementation of the solution to indicate when and to where the constraint will shift. By using simulation this process can be fine-tuned, and the shift of the constraint can be predicted with much more certainty. It also enables its user to perform effective contingency planning for when the shift occurs and test different “what-if” scenarios to be ready for implementation when needed.
Testing alternatives for exploiting and/or elevating the constraint
Ideas for increasing constraint capacity can be accurately tested before implementing. This will ensure that the right projects are implemented and that the return on time and money invested is maximised.
4. SIMULATION
4.1. What is Simulation?
A few definitions by experts:
“Simulation is the use of a model (not necessarily a computer model) to conduct experiments which, by inference, convey an understanding of the behavior of the system modeled. Computer modeling is the programming of a computer to produce a “system surrogate” having variables whose values over time are determined by the same laws of dynamics as the variables of a real-world or hypothesised system” [3]
“Simulation is a problem solving tool. Simulation characterizes a problem. It helps find candidate solutions, and provide a means for evaluating them.” [4]
1 This is the conclusion of the author based on own experience with a T.O.C. implementation, and might be contested by other T.O.C. practitioners

USING SIMULATION AND THE THEORY OF CONSTRAINTS TO OPTIMISE MATERIALS HANDLING SYSTEMS W. Vermaak and D. Venter
Copyright is vested with IMHC Page 6 of 19
Simply said – simulation is building a model of a system that acts like the system and can be used to understand and predict the system’s behaviour.
4.2. What are the benefits of Simulation?
Having an accurate model or representation of a real-world or hypothetical system, allows the user to play around with it without the risk involved in a real-life situation. This has significant benefits:
It fosters creativity. New and daring scenarios can be tested.
It allows more accurate planning. System behaviour can be accurately predicted. Simulation takes into account the inter-dependencies and variation inherent to the system, as well as the dynamic nature of factors influencing the system (breakdowns, material quality, etc.). This makes it superior to “gut feel” and static mathematical (spreadsheet) modelling.
It is relatively inexpensive. Large, capital-intensive new ventures or improvements to existing operations can be thoroughly tested and optimised before actually committing heavy finances. Compared to potential expensive mistakes that can be avoided by simulating first, the cost of performing the simulation is usually negligible.
Having an accurate model of the system that can be experimented with, allows people with many different areas of expertise to co-operate and test scenarios for optimising system performance.
4.3. A simple system – revisited
Consider the variation of a simple system described in paragraph 3.3.
Figure 3: A simple system with a first and second constraint.
Remember: “C” is the slowest resource and therefore the capacity constraint in the system. Because “C” is consistently slower than “A” and “B”, there will be a consistent build-up of inventory in front of “C” (note the triangle depicting inventory). Of course, due to the variation inherent to the system, slight inventories will build up periodically between any two machines, but will just as quickly be depleted again. Inventory in front of the constraint will however consistently build up.
In this case, the processing time on “D” is changed to the triangular distribution (5 - the minimum time, 6 – the most likely time, 7 – the maximum time), which makes it slower than both “A” and “B”, but faster than “C”. “C” is still the constraint in the system, but if the performance of “C” is improved to say triangular(4,5,6), then “D” will become the new constraint in the system.
Raw Materials Finished Goods A B C D
Time: (4,5,6)
Time: (4,5,6)
Time: (7,8,9)
Time: (5,6,7)

USING SIMULATION AND THE THEORY OF CONSTRAINTS TO OPTIMISE MATERIALS HANDLING SYSTEMS W. Vermaak and D. Venter
Copyright is vested with IMHC Page 7 of 19
We made a few assumptions in paragraph 3.3. These and other assumptions can now be tested with simulation. For instance, by simulating the system we can now accurately determine:
The production rate of the system.
Where is the constraint in the system? Although this is already obvious in this example, it almost never is this obvious in real-life systems, and in the absence of simulation capabilities, sometimes a constraint is arbitrarily chosen just to get the T.O.C. process on its way.
The size of the inventory needed in front of “C” to keep the constraint busy when either “A” or “B” is down. Remember we want to exploit the constraint, get the maximum production possible from it.
What will be the new production rate of the system for a given improvement of the constraint? In other words, what is the expected return on investment, payback period etc.
To where will the constraint shift if “C” is improved adequately, and what will be the new production rate? Also this is obvious in this example, but it rarely is so in real-life systems.
Two other concepts need discussing before we apply all this to a real-life example.
5. DRUM-BUFFER-ROPE SCHEDULING
The concepts of the Troop Analogy for a manufacturing plant, and its consequent use in developing the Drum-Buffer-Rope scheduling approach, is discussed in detail in The Race by Goldratt and Fox [5]. This section will briefly summarise that.
5.1. The Troop Analogy
Figure 4: The Troop Analogy
Compare an industry system (e.g. a manufacturing plant) with a troop of marching soldiers.
The first soldier is the first process and the last soldier is the last process in the system.
The marching on the road is similar to a manufacturing plant processing raw material to produce finished goods. The soldier in front firstly steps onto a certain piece of road, and the others follow, just as the first process firstly processes the
Marching Troops
Raw Material Finished Goods
Work-in-Process (Inventory)

USING SIMULATION AND THE THEORY OF CONSTRAINTS TO OPTIMISE MATERIALS HANDLING SYSTEMS W. Vermaak and D. Venter
Copyright is vested with IMHC Page 8 of 19
raw material and then it is passed on down the line, until it emerges as finished goods at the end of the line.
The relative space between the soldiers depict inventory or work-in-process. As the soldiers spread out, inventory increases.
The relative sizes of the troops depict the processing speed or capacity of each. The smallest soldier will be the capacity constraint.
As the march continues, the soldiers will spread out more (inventory increases), because of their different walking speeds (capacities).
Inventory ties up money and must be reduced; therefore the faster soldiers must walk slower.
If the overall marching speed is reduced, the production rate (throughput) decreases and we make less money.
The goal of business is to make more money, therefore we must find a way of reducing inventory without reducing the throughput.
We must find a way of preventing the soldiers from spreading, while maintaining the maximum possible marching speed. There are several possibilities for achieving this. A few of them will be shortly discussed.
Option 1: Rearrange the troops from the smallest to the biggest.
Figure 5: Troops re-arranged
This will eliminate spreading, because every soldier is faster than the one in front of him, and will keep up with him. The whole troop will be forced to march at the pace of the slowest soldier who will be in front. So, spreading will be eliminated without reducing the overall speed of the troop.
In real-life however this is impossible or at best too expensive. The order of processes in a plant can’t just be changed, and to upgrade all processes to get their respective capacities in order from lowest to highest, will be enormously expensive.
Option 2: Rope the soldiers together
Figure 6: Troops roped together
Work-in-Process (Inventory)
Raw Material Finished Goods
Raw Material Finished Goods
Work-in-Process (Inventory)

USING SIMULATION AND THE THEORY OF CONSTRAINTS TO OPTIMISE MATERIALS HANDLING SYSTEMS W. Vermaak and D. Venter
Copyright is vested with IMHC Page 9 of 19
This will limit spreading to the length of the ropes in between each soldier. This length can be chosen to allow for inventory needed for the process. The overall speed of the troop will also not be reduced, because everyone will be forced to walk at the speed of the slowest troop.
This method works very well in some cases, examples being the Just-In-Time system of the Japanese, or the traditional assembly line (typically linked with conveyor belts). However, a major problem with this system is the fact that the whole troop is halted if only one soldier drops his gun, or “any significant disruption at any work center will cause the overall flow to stop and throughput to be lost” [Goldratt and Fox, The Race]. To counteract this effect, the length of rope between sub-systems can be increased, which in turn increases inventory. For this kind of system to work at all, very high reliabilities of all equipment throughout the process are required (which is in many cases either too expensive or impractical to achieve). The lower the reliability of the sub-systems and the system as a whole, the more inventory is needed to protect throughput.
Option 3: Drum-Buffer-Rope Scheduling
Figure 7: Drum-Buffer-Rope arrangement
The first soldier is roped to the slowest soldier. This prevents the first soldier from walking faster than the slowest soldier walks, and consequently prevents the whole troop from spreading more than the length of the rope between the first and slowest soldier allows. The slowest soldier carries the drum and gives the marching pace for the whole troop. The soldiers behind the first soldier and in front of the weakest soldier will march on the heels of the first soldier (they can march faster than the slowest soldier, and the first soldier is limited to the pace of the slowest soldier). Likewise, the soldiers behind the slowest soldier will march on the heels of the slowest soldier. The only space in the troop will be in front of the slowest soldier. Using the analogy: the only significant inventory in the system will be in front of the slowest soldier, which fits in with the T.O.C. principle of exploiting the constraint. All possible measures should be taken to prevent the constraint from stopping, so it is supplied with enough inventory in front of it to keep it busy in case of normal disruptions in the system upstream of it. Also, the first process in the system will only start on new work, if the inventory buffer in front of the constraint is smaller than the predetermined level. No excess inventory will build up in the system.
This solution minimises the inventory in the system (the only inventory is in front of the constraint), while maximising throughput (the overall speed of the troop is not reduced). In fact, by exploiting the constraint the overall speed of the troop is increased.
Raw Material Finished Goods
Work-in-Process (Inventory)
Drum
USING SIMULATION AND THE THEORY OF CONSTRAINTS TO OPTIMISE MATERIALS HANDLING SYSTEMS W. Vermaak and D. Venter
Copyright is vested with IMHC Page 10 of 19
The process of Drum-Buffer-Rope scheduling starts at the maximum (exploited) schedule for the constraint and the schedules for the rest of the processes are derived form that. The first process is scheduled to start on new work just to maintain the buffer in front of the constraint. All other processes are scheduled to process the work they receive as soon as they receive it.
6. CASE STUDY – A TYPICAL MINE
The concepts discussed so far will be applied in the following hypothetical example to show the power of integrating simulation with T.O.C.
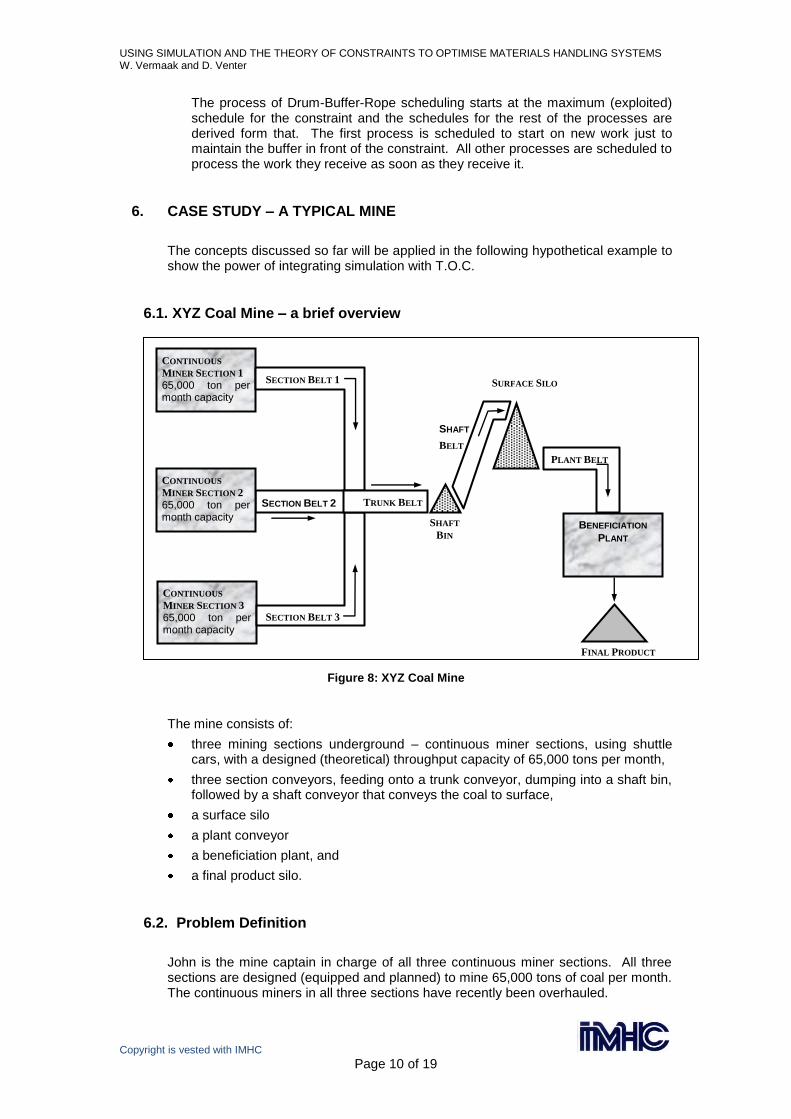
6.1. XYZ Coal Mine – a brief overview
Figure 8: XYZ Coal Mine
The mine consists of:
three mining sections underground – continuous miner sections, using shuttle cars, with a designed (theoretical) throughput capacity of 65,000 tons per month,
three section conveyors, feeding onto a trunk conveyor, dumping into a shaft bin, followed by a shaft conveyor that conveys the coal to surface,
a surface silo
a plant conveyor
a beneficiation plant, and
a final product silo.
6.2. Problem Definition
John is the mine captain in charge of all three continuous miner sections. All three sections are designed (equipped and planned) to mine 65,000 tons of coal per month. The continuous miners in all three sections have recently been overhauled.
CONTINUOUS
MINER SECTION 1
65,000 ton per month capacity
CONTINUOUS
MINER SECTION 2
65,000 ton per month capacity
CONTINUOUS
MINER SECTION 3
65,000 ton per month capacity
SECTION BELT 2 TRUNK BELT
BENEFICIATION
PLANT
FINAL PRODUCT
SECTION BELT 1
SECTION BELT 3
PLANT BELT
SURFACE SILO
SHAFT
BIN
SHAFT
BELT

USING SIMULATION AND THE THEORY OF CONSTRAINTS TO OPTIMISE MATERIALS HANDLING SYSTEMS W. Vermaak and D. Venter
Copyright is vested with IMHC Page 11 of 19
The shuttle cars in Sections 1 and 2 are relatively new, but Section 3 has for some reason inherited all the older shuttle cars. In spite of this, on paper all three sections should reach its designed production of 65,000 tons per month with relative ease.
The mine manager at XYZ Coal Mine conducts weekly performance meetings with his management team. At these meetings the performance of each department, according to the Weekly Mine Report, is discussed. The Weekly Mine Report (see figure 9) shows the efficiencies of each department in terms of equipment utilisation, production cost in rand per ton and total production for the week versus planned production. The market demand for coal from the mine is 185,000 tons per month. However, the mine only achieves an average monthly production of 170,000 tons per month.
Figure 9: Weekly Mine Report - Original
The plant sometimes sells more than that when the mine is experiencing cash flow problems, but that depletes the surface stock levels, and can therefore only be done once in a while.
For obvious reasons John always goes to these meetings without much enthusiasm. His sections always have the lowest utilisation and are seldom on target with the planned production and cost per ton. What makes matters even worse for John is that he has already tried almost everything in his power to improve the performance of his three sections, with little or no result. He is still the main culprit in every weekly performance meeting, and the mine manager and the other members of the management team are starting to become impatient with him.
USING SIMULATION AND THE THEORY OF CONSTRAINTS TO OPTIMISE MATERIALS HANDLING SYSTEMS W. Vermaak and D. Venter
Copyright is vested with IMHC Page 12 of 19
6.3. The Traditional Approach – Local Optimisation
The mine is currently preparing for the annual capital budget, and it was decided that the capital budget this year would be focussed on the continuous miner sections, and especially Section 3. The shuttle cars in Section 3 will be replaced with new battery cars. This will improve the utilisation of equipment in Section 3, and increase production from this section. Together with a few smaller improvement projects in Sections 1 and 2, the expectation is that the production from the three mining sections, and therefore the mine, will increase to 185,000 ton per month. This is equal to the market demand for coal from XYZ Coal Mine at the moment.
With the substantial expected production increase and sufficient market demand, the payback period, N.P.V. (net present value) and I.R.R. (internal rate of return) for these capital projects fall well within the corporate guidelines for capital projects, and is approved without much resistance.
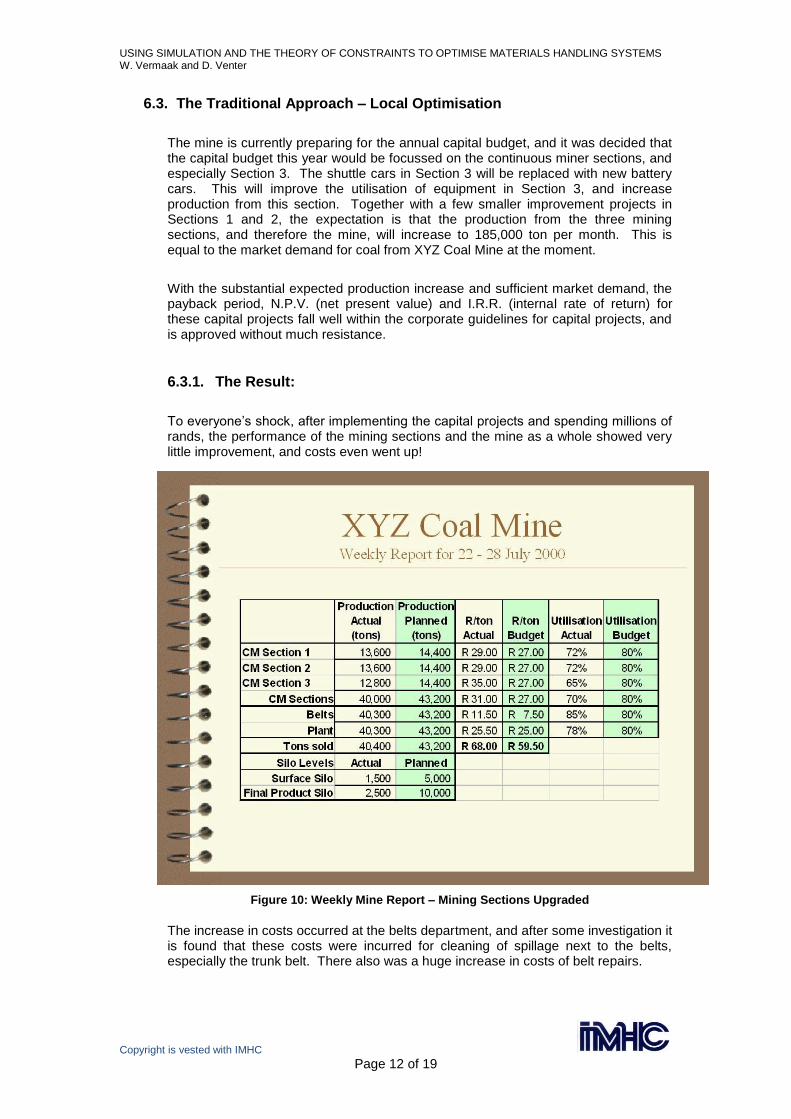
6.3.1. The Result:
To everyone’s shock, after implementing the capital projects and spending millions of rands, the performance of the mining sections and the mine as a whole showed very little improvement, and costs even went up!
Figure 10: Weekly Mine Report – Mining Sections Upgraded
The increase in costs occurred at the belts department, and after some investigation it is found that these costs were incurred for cleaning of spillage next to the belts, especially the trunk belt. There also was a huge increase in costs of belt repairs.

USING SIMULATION AND THE THEORY OF CONSTRAINTS TO OPTIMISE MATERIALS HANDLING SYSTEMS W. Vermaak and D. Venter
Copyright is vested with IMHC Page 13 of 19
Most importantly, the total production of the mine only increased by about 300 tons per week. The additional income derived from this is not nearly enough to justify the capital spending done to improve system performance.
6.4. Another solution – Simulating the Theory of Constraints-way
The management team now realises that there is a deeper problem here that needs to be identified and solved. They contract the services of a simulation/T.O.C. expert. After simulating the mine’s operations and analysing the results from a T.O.C. viewpoint, the following is found:
The cars loading in the sections work according to the following profile:
Figure 11: Car Loading Profile
This means that about 60% of the total tons per shift are tipped into the feeder-breaker in only four hours, which is equal to an average of 180 tons per hour for these four hours. The peak load on any section conveyor is however not equal to 180 tons per hour, but the set rate of the feeder-breaker at that section. (The feeder-breaker has a small storage capacity into which the cars tip. It is then fed onto the section conveyors at the set rate of the feeder-breaker). The simulation showed that it often happens that two or more cars tip within short intervals of each other at a tip, which causes an instantaneous peak load of up to 500 tons. The feeder-breakers are set to handle this, and consequently transfers the peak load to the section conveyors. With the upgrading project of the mining equipment, the rates of the feeder-breakers were initially also increased to account for the upgrades to the mining equipment. The feeder-breakers were set to 600 tons per hour, so that these would not pose a problem.
However, the simulation also clearly showed occasions where peak loads on two or all three of the section conveyors simultaneously reaches the trunk belt. This caused an instantaneous peak load on the trunk belt of up to 1,500 tons per hour.

USING SIMULATION AND THE THEORY OF CONSTRAINTS TO OPTIMISE MATERIALS HANDLING SYSTEMS W. Vermaak and D. Venter
Copyright is vested with IMHC Page 14 of 19
The trunk belt was not designed for this. In fact, the simulation model showed that the trunk belt was already almost loaded to capacity with the original production rate of the mining sections. This led to the substantial spillage and conveyor breakdowns that were experienced after the upgrade. Consequently the rates of the feeder-breakers were decreased again. This rate was only slightly higher than the original rate, thus the new throughput of only 40,300 tons per week.
The cars in the mining sections experience long delays waiting to tip, due to the slow feeder-breakers. The mining sections actually have ample spare capacity and are not the capacity constraint. The low utilisation of these sections is due to these long waiting times for the system downstream.
6.4.1. Conclusions:
The trunk belt is the capacity constraint. As soon as the capacities of the mining sections upstream from it were increased, it could not handle the extra flow and spillage occurred. Consequently the mining sections had to be tuned down again, leaving only a small improvement for a substantial investment.
The mining sections were not the problem at all. They experience long waiting times due insufficient conveyor capacity. This leads to the low utilisation of equipment in these sections.
If the capacity of the trunk conveyor is sufficiently increased to handle the 185,000 tons per month, the plant will become the next constraint and will have to be investigated.
The upgrading of the mining sections was a local optimisation of a department that was seemingly under performing. It attempted to cure the symptoms (low utilisation) and failed to solve the core problem of the system (its capacity constraint). It only led to increased costs. In fact, millions of rands were spent at the wrong place. The simulation showed that the capital should rather have been spent on the trunk conveyor belt.
6.4.2. The Solution
Since it is now known where the constraint is, the improvement process can be focussed to eliminate the constraint. Applying the five focussing steps of T.O.C. for continuous improvement (paragraph 3.2) guides this process.
The trunk conveyor belt was identified as the constraint.
During brainstorming sessions with the relevant personnel, a list of ideas to increase the capacity of the trunk belt was generated. The best ideas were tested by doing scenario tests with the simulation model that was already developed. The following projects were then elected to be implemented immediately:
Reschedule maintenance on the trunk belt to ensure that the trunk belt is not stopped during the peak periods of mining production.
Increase stock levels for all parts associated with the trunk belt, to ensure repairs are done as quickly as possible.
Implement additional routine quality checks on all parts used for trunk belt maintenance, to minimise downtime.
Re-allocate best maintenance personnel to service the trunk belt, and perform routine inspections of all equipment associated with the trunk belt.

USING SIMULATION AND THE THEORY OF CONSTRAINTS TO OPTIMISE MATERIALS HANDLING SYSTEMS W. Vermaak and D. Venter
Copyright is vested with IMHC Page 15 of 19
Install small holding bins at the end of all three section conveyors to ensure a smoothed feed onto the trunk belt. This will eliminate the extra high peak loads on the trunk belt.
The simulation proved that the constraint would be broken if all these are implemented successfully. The system (mine) will reach its target throughput of 185,000 tons sold per month. The constraint will then shift to the plant. Contingency planning for when the plant becomes the constraint can now be done and tested with simulation.
6.4.3. The Result
The improvement projects were implemented, at a much lower cost than the upgrading of the mining sections, and the throughput of the system increased significantly, to just over 185,000 tons per month.
Figure 12: Weekly Mine Report - Simulation/T.O.C.

USING SIMULATION AND THE THEORY OF CONSTRAINTS TO OPTIMISE MATERIALS HANDLING SYSTEMS W. Vermaak and D. Venter
Copyright is vested with IMHC Page 16 of 19
At a selling price of R70 per ton, compare the three scenarios:
Throughput per
month Improvement Investment made
Original 40,000 x 4.3 x R70 = R 12.04M
With Mining Sections upgrade
40,400 x 4.3 x R70 = R 12.16M
1% improvement Millions of rands
With T.O.C. / Simulation
43,200 x 4.3 x R70 = R 13.00M
8% improvement A few thousand rands
Table 1: Comparison between improvement scenarios
7. THE VERDICT
In the modern business world with increasing competition, technology improving daily, ever-changing markets, and rising costs, it is essential for any business to continuously improve. By using the Theory of Constraints to direct our improvement efforts, and utilising simulation modelling to facilitate the correct understanding of the complex systems we manage, we will ensure that the limited capital available to us will be spent at the right places and achieve the maximum results.
The principles discussed in this paper are applicable to all materials handling systems and can be (and have been) used in all industries with great success.

USING SIMULATION AND THE THEORY OF CONSTRAINTS TO OPTIMISE MATERIALS HANDLING SYSTEMS W. Vermaak and D. Venter
Copyright is vested with IMHC Page 17 of 19
REFERENCES:
[1] Eli Goldratt, The Goal, N.P.I. S.A., 1992.
[2] Noreen, Smith and Mackey, The Theory of Constraints and its Implications for Management Accounting, The North River Press, 1995.
[3] McLeod, John, Simulation, Volume 51, Number 4, October, Simulation Councils, Inc., 1988.
[4] Thomas J. Gogg and Jack R.A. Mott, Improve Quality and Productivity with Simulation, JMI Consulting Group, 1992.
[5] Eli Goldratt and Robert Fox, The Race, North River Press, Inc., 1986

USING SIMULATION AND THE THEORY OF CONSTRAINTS TO OPTIMISE MATERIALS HANDLING SYSTEMS W. Vermaak and D. Venter
Copyright is vested with IMHC Page 18 of 19
Willie Vermaak Educational Qualifications: Matric
Tertiary qualification: B.Eng. (Industrial) at University of Pretoria (1991-1994)
Computer literacy: Windows, MSOffice, and Arena
Passport: South African
Current Position: Industrial Engineer
From: 2000/02/01
Main Job Functions: Simulation and optimization of mining, beneficiation and other related operations.
Publications: C-Cut Simulation Project, Techno News, Anglo Technical Division, First Quarter 2001.
Previous projects: Landau Colliery – simulation of railway transport system
Kriel Colliery – simulation of underground conveyor belt system
Premier Mine – simulation of proposed block-caving operation and underground infrastructure in steady state.
Previous positions
Employer: Iscor Thabazimbi mine
Position held: Senior Analyst, Target Setting, Continuous Improvement
From: 1999 – 2000
Main job functions: - Negotiated and set financial targets for different departments, based on continuous improvement targets for the mine.
- Involved in the training of unit leaders on the mine, in the principles of continuous improvement in Iscor.
Employer: Iscor Thabazimbi Mine
Position held: Industrial Engineer
From: 1998 – 1999
Main job functions: Mine Planning office
: Compiling the operational budget for Mining Production (including all physical standards)
: Techno-economical evaluation of different mining strategies
TOP project (total operational performance)
: Acted as facilitator through process, culminating in compiling of project plans and budgets.
Theory of constraints (T.O.C.) project
: trained as T.O.C. principles expert
: presented T.O.C. training program to Mine Production team
: responsible, together with Manager, Continuous Improvement, to facilitate T.O.C. process on mine.
Employer: Iscor Thabazimbi Mine
Position held: Industrial Engineer in training
From: 1995 – 1997
Main job functions: - simulation projects of mining and beneficiation operations
- economic feasibility studies
- bonus reward system for geological drilling team
- relieving as superintendent mining production
- analytical studies on the mining process (physical standards, time utilization, costs, etc.)

USING SIMULATION AND THE THEORY OF CONSTRAINTS TO OPTIMISE MATERIALS HANDLING SYSTEMS W. Vermaak and D. Venter
Copyright is vested with IMHC Page 19 of 19
D J Venter
Personal Details
Full Name: Daniel Johannes Venter
Education qualification: Matric
Tertiary qualifications: National Diploma Organisation and Workstudy, 1989, Technikon SA
Masters Diploma Production Management 1996, PMI
Professional affiliations: None
Awards: None
Computer literacy: MSOffice; Arena; Access
Passport: South African
Current position: Simulation Engineer
Period: 1998-02-16 to date
Main Job functions: Simulation and optimisation of conveyor belt handling systems, underground mining processes, mining cycles, continuous flow processes, ship loading systems, logistic and transportation systems
Publications: C-Cut Simulation Project, Techno News, Anglo Technical Division, First Quarter 2001.
Previous projects: Shangani Mine: Underground Transport Simulation
Elandsrand GM: Ore Flow Simulation
Vaal Reefs GM: Surface Rail Simulation
Arnot Colliery: Conveyor Simulation
Western Deep Levels: Development cycle evaluation
Previous Positions
Employer: self-employed
Position held: Consultant
Period: 1996-11-01 to 1997-02-15
Main job functions: Simulation, benchmarking, facilities planning, process re-engineering, logistic system development
Employer: Vaal Reefs Gold Mine
Position held: Sectional Industrial Engineering Officer
Period: 1983-10-01 to 1996-09-03
Main job functions: Facilities planning and design, process re-engineering, method study, simulation, logistic system development, labour rightsizing, work measurement
Employer: HL&H Mining Timber
Position held: Depot Manager
Period: 1980-01-30 to 1983-09-30
Main job functions: Production management, fleet control, logistic system management, stock control, sawmill management, timber treatment plant management and control.