using smart grids to enhance use of energy efficiency and
TRANSCRIPT
Using Smart Grids to Enhance Use of Energy-Efficiency and Renewable-Energy Technologies
APEC Energy Working Group
May 2011
Report prepared for the APEC Energy Working Group by Pacific Northwest National Laboratory 902 Battelle Boulevard Richland, WA 99352 USA Principal Investigators
Mia Paget Tom Secrest Steve Widergren
Contributors Patrick Balducci Alice Orrell Cary Bloyd
For Asia Pacific Economic Cooperation Secretariat 35 Heng Mui Keng Terrace Singapore 119616 Tel: (65) 68919 600 Fax: (65) 68919 690 Email: [email protected] Website: www.apec.org © 2011 APEC Secretariat APEC# 211-RE-01.2 PNNL-20389
iii
Executive Summary
The Fukui Declaration from the Ninth Asia Pacific Economic Cooperation (APEC) Energy Ministers Meeting (EMM-9), June 2010, states that “smart grid technologies, including advanced battery technologies for highly-efficient and cost-effective energy storage, can help to integrate intermittent renewable power sources and building control systems that let businesses and consumers use energy more efficiently, and they can also help to enhance the reliability of electricity supply, extend the useful life of power system components, and reduce system operating costs.” The energy ministers further instructed the APEC Energy Working Group (EWG) “to start an APEC Smart Grid Initiative (ASGI) to evaluate the potential of smart grid capabilities to support the integration of intermittent renewable energies and energy-management approaches in buildings and industry.” This report directly supports the ASGI Phase 1: Survey of Smart Grid Status and Potential of Smart Grid. The report also builds upon a series of APEC projects undertaken by the APEC Energy Working Group and its Expert Group on New and Renewable Energy Technologies that were developed to support calls from APEC Leaders and Energy Ministers to promote the development and utilization of APEC energy-efficiency and renewable-energy resources. These include the Chinese Taipei-led 2008 APEC Photovoltaic Conference, the United States (US)-led APEC Workshop on Grid Integration of Renewable Energy, and the Japanese-led project on Addressing Grid-interconnection Issues in Order to Maximize the Utilization of New and Renewable Energy Sources. The project also takes advantage of APEC specific research undertaken by Asia Pacific Energy Research Centre in Japan.
At the core of the smart grid vision is the transformation of the electric supply chain from a centralized, producer-controlled network to one that is less centralized and more consumer-interactive. With their wide range of size and level of development, the APEC members can act as an important test bed and evaluator for smart grid technology deployment and practices. This is important because of the significant growth expected in electricity consumption in the coming decades (from 9,385 TWh in 2005 to 16,442 TWh in 2030 in APEC economies) and the related investment of $6.2 to $8.4 trillion required to meet electricity and heat demand (APERC 2009). There is an opportunity to guide this expansion using the full range of smart grid enabling technologies and practices that take advantage of the transition to less centralized electricity production while creating a more economic, efficient, and reliable electricity production and consumption system. This project is the first step in engaging APEC member economies in the development of coordinated smart grid development strategies.
The picture of electrification across the APEC economies is complex. APEC members are in various states of smart grid development, ranging from no activity, to conducting demonstrations, and engaged in joint projects with other economies. Each member economy has unique attributes that influence the benefits of smart grid capabilities and affect the priorities given to deployment strategies. To help provide insight into this complex topic, this report surveys APEC economies and characterizes the status of smart grid activities. It also identifies APEC economies that are actively pursuing smart grid capabilities to address environmental and economic sustainability goals. Finally, the report explores the potential application of smart grid capabilities to resolve renewable integration and energy-efficiency concerns (such as variability and uncertainty in amount of renewable wind or solar generation) so that future directions or roadmaps in this area can be developed by interested economies.
Policy centers and global forums have articulated the concept that smart grid technology deployment provides an opportunity to stimulate economic growth while promoting environmentally sustainable
iv
approaches to the generation and consumption of electricity (MEF 2009). By investing in automation technology for the electric system, human resources can be put to work to develop, deploy, and maintain smart grid devices and systems that deliver greater operating efficiency, and enable the integration of more environmentally friendly generation and end-use systems.
This study was undertaken to address APEC’s expressed desire to minimize the learning time to understand the implications of smart grid concepts so members can advance their thinking in a timely manner and advance strategies regarding smart approaches that can help meet their environmental-sustainability and energy-efficiency policy goals. As significant investments are needed to grow and maintain the electricity infrastructure, consideration needs to be given to how information and communications technology can be applied to electricity infrastructure decisions that not only meet traditional needs for basic service and reliability, but also provide the flexibility for a changing mix of generation sources (such as the adoption of a higher fraction of renewable generation) with sensitivity to environmental and societal impacts.
Survey Findings
The findings of the survey indicate a great diversity of awareness of smart grid concepts and technologies. Policy makers and service providers have at least an introduction to smart grid concepts, with some member economies moving forward with smart grid roadmaps. However, customers are significantly less aware of smart grid capabilities and their benefits. While many service providers have some level of engagement with consumers to have load participate in meeting system operational needs, it is mainly confined to large industrial facilities. The engagement of end-use systems in demand response through real-time pricing signals or other incentives is low, with wealthier and more urban member economies showing the most activity in this direction. Of all smart grid technology deployments, advanced metering infrastructure is receiving the most attention. While this is a logical first step in a roadmap of smart grid deployments that will enable other capabilities, it is only a start and addresses a small fraction of the potential benefits from implementing smart grid capabilities. Even after measurement and communications systems, such as AMI, are installed, significantly more work will be needed to advance energy efficiency and support the integration of significant amounts of renewable resources.
In searching for correlations between those APEC members who responded to the survey, the strongest correlations were found when comparing member economies with similar urbanization and gross domestic product (GDP) per capita metrics. Because of the great diversity within APEC, no single smart grid deployment strategy or roadmap is adequate; however, significant benefit will be gained by exchange of information and experience between members, particularly where their situations and characteristics align.
Challenges Facing Smart Grid Deployments
The report reviews several challenges affecting smart grid deployments. First among these is greater awareness of smart grid capabilities and their benefits for advancing energy-efficiency and renewable-resource integration policies. Another significant challenge is the speed with which new ideas and deployment strategies are being generated. Rapid changes in information and communications technologies and how they are being deployed in other areas of an economy (e.g., manufacturing, finance, healthcare) offers new solutions for consideration in smart grid deployments. This can challenge

v
decision-making as there is pressure to revisit project definitions and approaches. Other challenges are summarized below according to technical, business and financial, and societal issues.
• Technical − Constantly changing technologies means that a heterogeneous mix of technology must be
accommodated. Existing generation and delivery infrastructure (i.e., legacy) systems must be adapted to work with new technologies.
− Being flexible to changing technologies requires identifying the important interfaces between technology components.
− Achieving alignment across service providers, end-users, and technology suppliers is difficult particularly in a growing, international marketplace. Interoperability can allow multiple parties to connect their devices and systems for proper interaction, but attaining interoperability is difficult.
• Business and Financial − Understanding and communicating the value proposition of a smart grid deployment for each
stakeholder in the electricity supply chain is daunting. − The financial environment for risk and reward can challenge business plans for smart grid
investments. − Regulatory understanding and sensitivity to providing an appropriate environment for smart
grid investment takes time. Regulatory decisions (or lack of decision) can create new challenges.
− Developing an appropriate incentive structure that aligns economic and regulatory policies with energy-efficiency and environmental goals needs to be tailored to each member economy.
• Societal − Strategies need to account for a variety of policy objectives (affordability, sustainability,
growth, and cultural values). − Assigning value to externalities, such as environmental impacts, is difficult, but necessary, in
balanced decision-making. − Understanding and accounting for the beneficial aspects of smart grid investments as a
mechanism for job creation and advancing a technically skilled workforce needs development.
Priority Considerations
In the face of these and other challenges identified in this report, a number of activities are already underway within APEC member economies. Many members have public policy goals for energy-efficiency and renewable-energy resources. Several members have drafted or are developing smart grid roadmaps. Demonstration and pilot projects are providing experience with technology deployments and gathering information that will lead to business plans and value propositions that must be agreeable to the many parties involved. While each member economy must discover the path forward that meets its unique needs, and while realization of the smart grid will continue to evolve as time, decisions, and events progress, progress can be made immediately in a number of priority areas. A summary of some of these priority areas follows:
• Policy Goals. Consideration should be given by APEC to develop a common framework for describing smart grid policies supporting renewable energy and energy efficiency. Such a framework could be used as a starting place for each member economy and serve to help engage all electricity stakeholders (including consumers, service providers, suppliers, and regulators) in shaping these goals.
vi
• Education. An important result from the survey was the need for better education on the nature of smart grid and its role in supporting energy efficiency and renewable-energy integration. Programs should be developed to communicate smart grid concepts and their relationship to achieving sustainability policy goals. The message needs to be tailored to the different stakeholder audiences.
• Roadmap. Consideration should be given by APEC to create a common framework for smart grid roadmap development. Such a framework could be used as a starting place for each member economy. The creation of such a framework can draw upon several of the existing roadmaps developed inside and outside of APEC. Important aspects to include in roadmap development are categorization of smart grid assets, applications they support, and the value proposition (costs and benefits). Metrics that can be reasonably and periodically measured also need to be defined so that progress can be monitored (e.g., USDOE 2009). Responsibilities (e.g., leaders and agencies) for carrying out activities identified through the roadmap process also need to be clearly identified.
• Interoperability. APEC members need to consider their active participation in interoperability discussions that are setting the direction for international information and communications technology standards that support the integration of smart grid devices and systems. Such participation will be important to achieving import/export policy goals related to smart grid equipment and services. Under the APEC Regulatory Cooperation Advancemnet Mechanism for Trade-Related Standards and Technical Regulations (ARCAM), APEC will develop recommendations for cooperation on smart grid interoperability standards.
• Methods and Workshops. The development of frameworks, metrics, and other tools can be coordinated through a series of APEC-sponsored workshops. To organize such meetings and in recognition that additional workshops may be useful given the changing landscape, consideration should be given to the creation of a smart grid working group within APEC.
Regarding creation of a smart grid working group, APEC members are encouraged to participate in ASGI, which was recently established by the APEC Energy Working Group.
vii
Acknowledgments
The authors would like to acknowledge and thank the APEC project overseers, Mr. Dan Ton from the Office of Electricity Delivery & Energy Reliability at the US Department of Energy and Mr. Jeff Skeer from the Office of Policy and International Affairs at the US Department of Energy for their support and guidance throughout this project.
The authors also greatly appreciate the time and valuable contributions of the follow individuals: Ms. Beth Riordan, Department of Climate Change and Energy Efficiency, Australia Mr. Darcy Blais, Natural Resources Canada, Canada Mr. Yanshan Yu, Office State Electricity Regulatory Commission of China, People’s Republic of China Mr. Eddie Wu, Electrical & Mechanical Services Department, Hong Kong, China M. Sjachdirin, Ministry of Energy and Mineral Resources, Indonesia Mr. Satoshi Morozumi, New Energy and Industrial Technology Development Organization, Japan Dr. Tran Thanh Lien, Asia Pacific Energy Research Centre, Japan Mr. Dae Kyeong Kim, Korea Electrotechnology Research Institute, Republic of Korea Mr. Charan Jit Sing, Tenaga Nasional Berhad, Malaysia Mr. Francisco Acosta, Director General of Generation, Transmission and Transformation of Electric Power, Mexico Ms. Jennifer Wattie, Ministry of Economic Development, New Zealand Mr. Alexey Konev, Russian Energy Agency, Russia Mr. Eng Kiat Chan of the Energy Market Authority, Singapore Dr. Yie-Zu (Robert) Hu, Industrial Technology Research Institute, Chinese Taipei Mr. Pham Thanh Tung, Ministry of Industry and Trade, Viet Nam Mr. William Chandler, Transition Energy International, Ltd., USA Mr. Tawatchai Sumranwanich, Electricity Generating Authority of Thailand, Thailand

ix
Acronyms and Abbreviations
AC alternating current ADB Asian Development Bank AIIC Australian Automotive Industry Innovation Council AMI advanced metering infrastructure AMR automatic meter reading APEC Asia-Pacific Economic Cooperation APERC Asia Pacific Energy Research Centre ARPA-E Advanced Research Projects Agency-Energy ARRA American Recovery and Reinvestment Act ASEI Asia Solar Energy Initiative ASGI APEC Smart Grid Initiative ATVM Advanced Technology Vehicle Manufacturing BPA Bonneville Power Administration CEM Clean Energy Ministerial CO2 carbon dioxide CRIEPI Japan’s Central Research Institute of Electric Power Industry DA distribution automation DC direct current DG distributed generation DR demand response DS distributed storage DSM demand side management EE energy efficiency EEI Edison Electric Institute EISA US Energy Independence and Security Act of 2007 EMA Singapore’s Energy Market Authority EMM Energy Minister’s Meeting EPPA Emissions Prediction and Policy Analysis EPRI Electric Power Research Institute EPSG Experimental Power Grid Center ESC Singapore’s Energy Subcommittee EU European Union EV electric vehicle EWG APEC Energy Working Group FA feeder automation FACTS flexible AC transmission systems
x
FERC US Federal Energy Regulatory Commission GDP gross domestic product GHG greenhouse gas GW gigawatt HVAC heating ventilation and air conditioning ICE internal combustion engine IEA International Energy Agency IES Singapore’s Intelligent Energy System IEEE Institute of Electrical and Electronics Engineers ICT information and communication technologies ISGAN International Smart Grid Action Network IT Information Technology KEPCO Korea Electric Power Corporation KSGI Korean Smart Grid Institute KW kilowatt KWh kilowatt-hour MC Mitsubishi Corporation MEF Major Economies Forum MELCO Mitsubishi Electric Corporation METI Japan’s Ministry of Economy, Trade and Industry MMC Mitsubishi Motors Corporation Mt megaton MW megawatt MWh megawatt-hour NARUC National Association of Regulatory Utility Commissioners NEDO New Energy and Industrial Technology Development Organization NIST National Institute of Standards and Technology NOx mono-nitrogen oxides NO and NO2 NRDC National Resource Defence Council PEV plug-in electric vehicle PHEV plug-in hybrid electric vehicle PMU phasor measurement unit PNNL Pacific Northwest National Laboratory PV photovoltaic R&D research and development RAC Royal Automobile Club RD&D Research, Development and Demonstration RE renewable energy
xi
SAIDI system average interruption duration index SG smart grid SGCC Smart Grid Corporation of China SGMM Smart Grid Maturity Model SO2 sulphur dioxide T&D transmission and distribution TWh terawatt-hour US United States USD United States Dollar ($) USDOE United States Department of Energy V volts VAR volt-ampere reactive VMT vehicle miles travelled

xiii
Contents
Executive Summary .......................................................................................................................... iii Acknowledgments .............................................................................................................................vii Acronyms and Abbreviations ............................................................................................................ ix 1.0 Introduction ............................................................................................................................. 1.1
1.1 Smart Grid: Economic Growth with Clean Energy ........................................................ 1.2 1.2 Smart Grid Goals of APEC ............................................................................................. 1.3 1.3 Scope of Smart Grid for Sustainability ........................................................................... 1.3 1.4 Approach ......................................................................................................................... 1.5 1.5 About this Document ...................................................................................................... 1.5
2.0 Situation within APEC ............................................................................................................ 2.1 2.1 Survey Results ................................................................................................................. 2.1
2.1.1 Status of Smart Grid from Survey Results ........................................................... 2.1 2.1.2 Smart Grid Potential for Energy Efficiency and Renewables Integration ............ 2.6
2.2 Investigation of Smart Grid Activity in APEC ............................................................... 2.9 2.2.1 APEC Smart Grid Overview ................................................................................ 2.9 2.2.2 Individual Member Economy Information ......................................................... 2.13
2.3 Related Information about Smart Grid Globally ........................................................... 2.19 3.0 Smart Grid Technologies: Status and Application ................................................................. 3.1
3.1 Integration of Renewable Resources ............................................................................... 3.1 3.1.1 Understanding Integration of Renewable Resources with Smart Grid................. 3.1 3.1.2 Examples of Integration of Renewable Resources ............................................... 3.4 3.1.3 Facilitators, Barriers, and Strategies for Integration of Renewable Resources .... 3.6
3.2 Plug-In Electric Vehicle Integration................................................................................ 3.9 3.2.1 Understanding Integration of PEV with Smart Grid ............................................ 3.9 3.2.2 Examples of Integration of PEV with Smart Grid.............................................. 3.13 3.2.3 Facilitators, Barriers, and Strategies to PEV Integration ................................... 3.15
3.3 System Operations Efficiencies .................................................................................... 3.18 3.3.1 Understanding Operational Efficiencies of Smart Grid ..................................... 3.19 3.3.2 Examples of Operations Efficiencies with or without Smart Grid ..................... 3.23 3.3.3 Strategies for Smart Grid Operations Efficiencies ............................................. 3.26
3.4 Efficiency and Carbon Reduction Verification ............................................................. 3.27 3.4.1 Measurement and Verification with Smart Grid ................................................ 3.28 3.4.2 Examples of Verification with or without Smart Grid ....................................... 3.30 3.4.3 Strategies for Verifying Efficiency and Carbon Reduction ............................... 3.32
3.5 Financial Business Case ................................................................................................ 3.33 3.5.1 Understanding Financial Aspects of Smart Grid ................................................ 3.34
xiv
3.5.2 Examples of Financial Aspects with or without Smart Grid .............................. 3.37 3.5.3 Strategies for Financial Aspects of Smart Grid .................................................. 3.40
4.0 Challenges to APEC Smart Grid Deployments ....................................................................... 4.1 4.1 Technical ......................................................................................................................... 4.1 4.2 Business and Financial .................................................................................................... 4.3 4.3 Societal ............................................................................................................................ 4.4
5.0 Conclusions and Recommendations ........................................................................................ 5.1 5.1 High-Value Activities Underway .................................................................................... 5.1 5.2 Priorities Going Forward for APEC ................................................................................ 5.2 5.3 Considerations for Roadmap Development .................................................................... 5.4
5.3.1 The Need for Specialized Roadmaps ................................................................... 5.4 5.3.2 Coordination of Methodology, Issues, and Timing .............................................. 5.5 5.3.3 APEC Smart Grid Initiative ................................................................................. 5.5
5.4 Areas for Further Study ................................................................................................... 5.6 6.0 References ............................................................................................................................... 6.1 Appendix A APEC Smart Grid Survey Form ................................................................................. A.1 Appendix B Summary Survey Results ............................................................................................ B.1
xv
Figures
Figure 2.1. Percent of Stakeholder Groups Familiar with a Smart Grid in APEC .......................... 2.2 Figure 2.2. Economies without AMI Are More Rural and Have Lower GDP/Capita .................... 2.3 Figure 2.3. Economies with Real-Time Pricing Are Wealthier and More Urban ........................... 2.4 Figure 2.4. Survey Responses on Policies to Encourage Renewable Generation and Smart Grid . 2.7 Figure 2.5. Electric Service Provider Expectation of Smart Grid Uses and Benefits ..................... 2.8 Figure 2.6. APEC Generating Capacity .......................................................................................... 2.9 Figure 2.7. Electricity Generation by Form of Renewable Energy ............................................... 2.10 Figure 2.8. Four Priorities Underlying Australia’s AMI Program ................................................ 2.13 Figure 3.1. Impact of Smart Grid to Increase Renewable-Energy Penetration in Korea ................ 3.6 Figure 3.2. Transportation Electrification ..................................................................................... 3.12 Figure 3.3. Jeju Smart Grid Test-Bed ........................................................................................... 3.15 Figure 3.4. Generation and Distribution Asset Utilization for a Typical US Utility .................... 3.20 Figure 3.5. Advanced Metering Penetration Nationwide in Recent FERC Surveys ..................... 3.24 Figure 3.6. Example of Consumer Interface for Smart Grid Pilot Program ................................. 3.31 Figure 3.7. Compounding Benefits of Smart Grid Investments .................................................... 3.33 Figure 3.8. APEC Economies Electricity Consumption vs. Gross National Income .................... 3.34 Figure 3.9. Framework for Conceptualizing the Business Case for Smart Grid ........................... 3.35
Tables
Table 1.1. Smart Grid Costs and Benefits ....................................................................................... 1.3 Table 2.1. Survey Response on Demand Response to Reduce Peak Generation ............................ 2.6 Table 2.2. APERC Forecasted Renewable Share of Capacity and Generation in 2030................ 2.11 Table 3.1. Operational Costs and Efficiency Mechanisms from Smart Grid Applications .......... 3.19 Table 3.2. Survey Responses for Utility Benefit of Using Smart Grid Technology ..................... 3.38

1.1
1.0 Introduction
The application of smart grid technology promises to provide benefit to electricity consumers and our economies by better utilizing electric system assets to securely satisfy consumer energy demands at a lower monetary and environmental cost. This report reviews the status of the deployment of smart grid technologies within APEC economies, and in particular, discusses the potential application of this technology to enhance the integration of renewable energy and to advance greater levels of energy efficiency.
The APEC energy ministers instructed the APEC Energy Working Group (EWG) “to start an APEC Smart Grid Initiative (ASGI) to evaluate the potential of smart grid capabilities to support the integration of intermittent renewable energies and energy-management approaches in buildings and industry.” This report directly supports the ASGI Phase 1: Survey of Smart Grid Status and Potential of Smart Grid. The report also builds upon a series of APEC projects undertaken by the APEC Energy Working Group and its Expert Group on New and Renewable Energy Technologies that were developed to support calls from APEC Leaders and Energy Ministers to promote the development and utilization of APEC energy-efficiency and renewable-energy resources. These include the Chinese Taipei-led 2008 APEC Photovoltaic Conference, the United States (US)-led APEC Workshop on Grid Integration of Renewable Energy, and the Japanese-led project on Addressing Grid-interconnection Issues in Order to Maximize the Utilization of New and Renewable Energy Sources. The project also takes advantage of APEC specific research undertaken by Asia Pacific Energy Research Centre in Japan.
Smart grid technology uses digital technology and communication to coordinate the actions of intelligent devices and systems throughout the electricity system: from large scale generation networked with transmission infrastructure, to the distribution of power to consumers (factories, commercial buildings, and residences), and down into the equipment and systems that use electricity in these facilities. Through automation, better information, and coordination, smart grid technology can help provide the flexibility needed to integrate variable generation that is a characteristic of some renewable resources such as wind and solar generators. Smart grid technology can also enhance efficiencies in the transmission and distribution delivery infrastructure, generation, and end-use systems by optimizing system performance and increasing asset utilization.
The environment surrounding smart grid is characterized by continual, rapid developments in technologies, regulations, and institutions. From early visionary concepts, smart grid actions are now emerging into an early growth phase consisting of demonstrations and technology deployments.
The picture of electrification across the APEC economies is complex. APEC members are in various states of smart grid development, ranging from no activity, conducting demonstrations, and engaging in joint projects with other economies. Each member economy has unique attributes that influence the benefits of smart grid capabilities and affect the priorities given to deployment strategies. To help provide insights into this complex topic, this report surveys APEC economies and characterizes the status of smart grid activities. It also identifies APEC economies that are actively pursuing smart grid capabilities to address environmental and economic sustainability goals. Finally, the report explores the potential application of smart grid capabilities to resolve renewable-integration and energy-efficiency concerns so future directions or roadmaps in this area can be developed by interested economies.
1.2
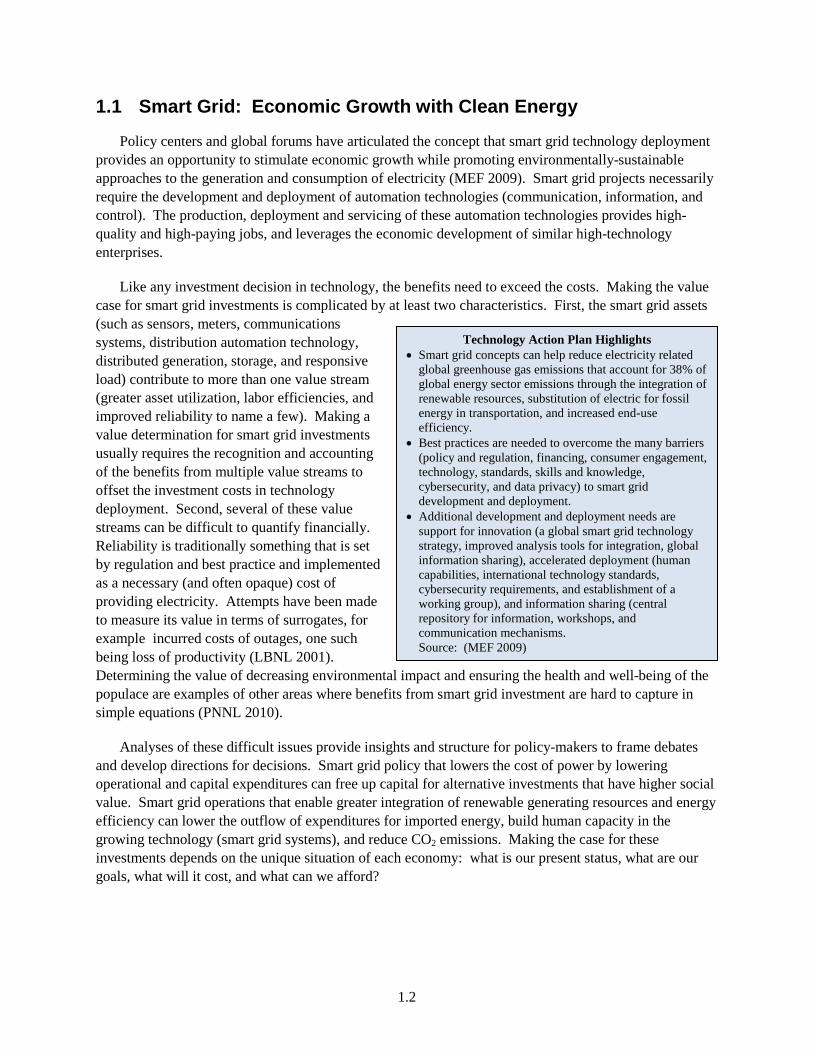
Technology Action Plan Highlights • Smart grid concepts can help reduce electricity related
global greenhouse gas emissions that account for 38% of global energy sector emissions through the integration of renewable resources, substitution of electric for fossil energy in transportation, and increased end-use efficiency.
• Best practices are needed to overcome the many barriers (policy and regulation, financing, consumer engagement, technology, standards, skills and knowledge, cybersecurity, and data privacy) to smart grid development and deployment.
• Additional development and deployment needs are support for innovation (a global smart grid technology strategy, improved analysis tools for integration, global information sharing), accelerated deployment (human capabilities, international technology standards, cybersecurity requirements, and establishment of a working group), and information sharing (central repository for information, workshops, and communication mechanisms. Source: (MEF 2009)
1.1 Smart Grid: Economic Growth with Clean Energy
Policy centers and global forums have articulated the concept that smart grid technology deployment provides an opportunity to stimulate economic growth while promoting environmentally-sustainable approaches to the generation and consumption of electricity (MEF 2009). Smart grid projects necessarily require the development and deployment of automation technologies (communication, information, and control). The production, deployment and servicing of these automation technologies provides high-quality and high-paying jobs, and leverages the economic development of similar high-technology enterprises.
Like any investment decision in technology, the benefits need to exceed the costs. Making the value case for smart grid investments is complicated by at least two characteristics. First, the smart grid assets (such as sensors, meters, communications systems, distribution automation technology, distributed generation, storage, and responsive load) contribute to more than one value stream (greater asset utilization, labor efficiencies, and improved reliability to name a few). Making a value determination for smart grid investments usually requires the recognition and accounting of the benefits from multiple value streams to offset the investment costs in technology deployment. Second, several of these value streams can be difficult to quantify financially. Reliability is traditionally something that is set by regulation and best practice and implemented as a necessary (and often opaque) cost of providing electricity. Attempts have been made to measure its value in terms of surrogates, for example incurred costs of outages, one such being loss of productivity (LBNL 2001). Determining the value of decreasing environmental impact and ensuring the health and well-being of the populace are examples of other areas where benefits from smart grid investment are hard to capture in simple equations (PNNL 2010).
Analyses of these difficult issues provide insights and structure for policy-makers to frame debates and develop directions for decisions. Smart grid policy that lowers the cost of power by lowering operational and capital expenditures can free up capital for alternative investments that have higher social value. Smart grid operations that enable greater integration of renewable generating resources and energy efficiency can lower the outflow of expenditures for imported energy, build human capacity in the growing technology (smart grid systems), and reduce CO2 emissions. Making the case for these investments depends on the unique situation of each economy: what is our present status, what are our goals, what will it cost, and what can we afford?
1.3
1.2 Smart Grid Goals of APEC
This report was undertaken to address APEC’s expressed desire to minimize the learning time to understand the implications of smart grid concepts so members can advance their thinking in a timely manner and advance strategies regarding smart approaches that can help meet their environmental sustainability and energy-efficiency policy goals. As significant investments are needed to grow and maintain the electricity infrastructure, consideration needs to be given to how information and communications technology can be applied to electricity infrastructure decisions that not only meet traditional needs for basic service and reliability, but also provide the flexibility for a changing mix of generation sources with sensitivity to environmental and societal impacts.
To meet environmental and national-security goals, smart grid investments can support the integration of renewable generation resources to decrease energy import and reduce CO2 emissions. With so much investment in the electricity system, funding opportunities also need to consider how they support economic development and labor force capability goals.
1.3 Scope of Smart Grid for Sustainability
This document reports on the status of smart grid technology deployments by APEC members to enhance the use of renewable energy and energy efficiency, and provides guidance for achieving the potential from smart grid capabilities. This is important because of the significant growth expected in electricity consumption in the coming decades (from 9,385 TWh in 2005 to 16,442 TWh in 2030 in APEC economies) and related investment of $6.2 to $8.4 trillion to meet electricity and heat demand (APERC 2009). In this context, smart grid technologies have great potential.
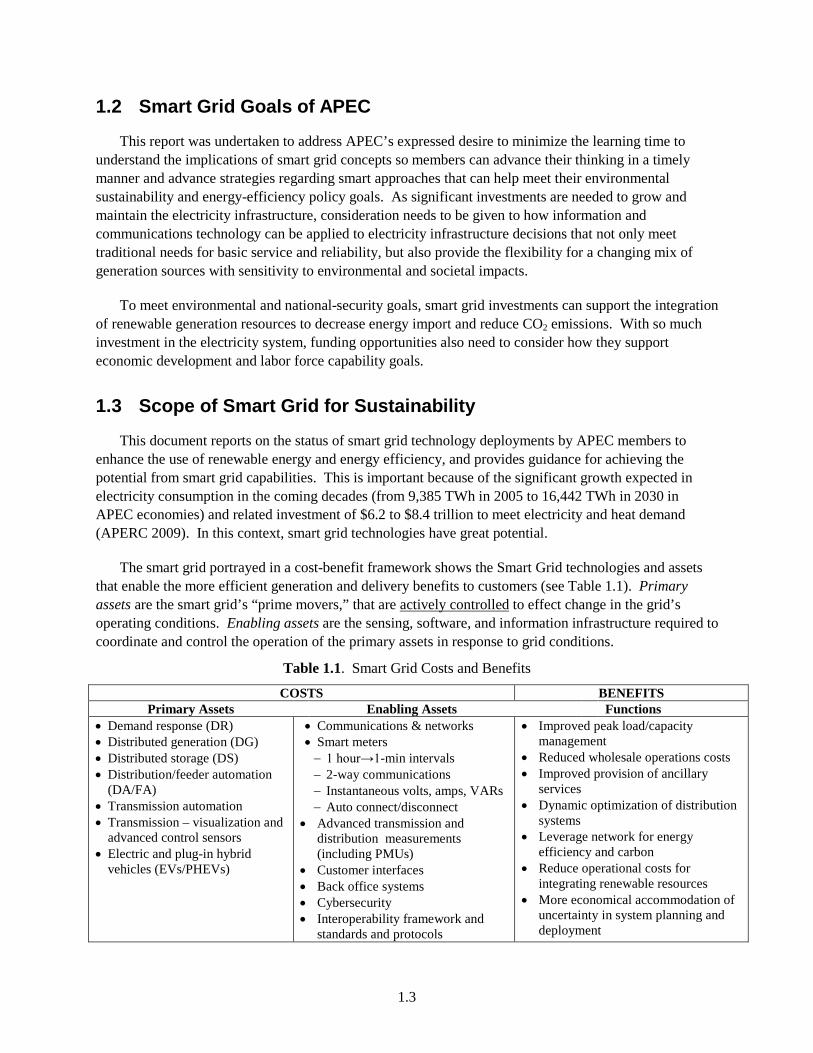
The smart grid portrayed in a cost-benefit framework shows the Smart Grid technologies and assets that enable the more efficient generation and delivery benefits to customers (see Table 1.1). Primary assets are the smart grid’s “prime movers,” that are actively controlled to effect change in the grid’s operating conditions. Enabling assets are the sensing, software, and information infrastructure required to coordinate and control the operation of the primary assets in response to grid conditions.
Table 1.1. Smart Grid Costs and Benefits
COSTS BENEFITS Primary Assets Enabling Assets Functions
• Demand response (DR) • Distributed generation (DG) • Distributed storage (DS) • Distribution/feeder automation
(DA/FA) • Transmission automation • Transmission – visualization and
advanced control sensors • Electric and plug-in hybrid
vehicles (EVs/PHEVs)
• Communications & networks • Smart meters − 1 hour→1-min intervals − 2-way communications − Instantaneous volts, amps, VARs − Auto connect/disconnect
• Advanced transmission and distribution measurements (including PMUs)
• Customer interfaces • Back office systems • Cybersecurity • Interoperability framework and
standards and protocols
• Improved peak load/capacity management
• Reduced wholesale operations costs • Improved provision of ancillary
services • Dynamic optimization of distribution
systems • Leverage network for energy
efficiency and carbon • Reduce operational costs for
integrating renewable resources • More economical accommodation of
uncertainty in system planning and deployment
1.4
Functions include operational strategies for the grid that use smart grid assets to obtain benefits such as lower cost and emissions, improved power quality and reliability, and integration of renewable-energy sources. Examples of smart grid benefits are described below:
• Providing advanced infrastructure and institutional foundations. Standards, pricing mechanisms and automated transmission, distribution and customer systems to support functions such as outage prevention, accelerated restoration, automated demand response, and standalone micro-grid capabilities.
• Enabling clean and renewable-energy resources. Engaging demand response and distributed storage to accommodate higher penetration and seamless and cost-effective integration of renewable generation resources.
• Supporting electric capacity. Managing peak load capacity to displace the need for new/upgraded generation, transmission and distribution systems; managing transformer loading to extend their lifetimes; and managing reactive power that needs to be supplied by power plants to maintain proper system voltages and support electricity delivery.
• Improving power quality and reliability. Regulation through minute and sub-minute control of supply/demand balance, rapid restoration of service interruptions, cost effective servicing of critical loads.
• Optimizing electric system operational efficiency. Dynamic optimization, voltage regulation, ramping and load following, enabling reducing cost of operations based on marginal production costs and reducing transmission loads when congestion costs are high.
• Enabling increased energy efficiency. Smart grid devices and communications that enable the deployment of active efficiency measures to deliver increased energy efficiency and carbon savings.
The report includes a survey and a review of smart grid implementation activities to formulate policies and programs to guide the development of smart grid programs in APEC economies. The survey focuses on smart grid technologies and practices that are being used today or that can potentially be used in different APEC economies to increase the adoption of energy-efficiency and renewable-energy technologies.
The guidance portion of the report extends the findings of the earlier Technology Action Plan (MEF 2009) to identify potential benefits and provide input for the formulation of smart grid programs to enhance the use of renewable energy and energy efficiency for developed, developing, and less developed conditions in APEC economies. The guidance draws from significant related smart grid activities presently in progress.
Based upon the presentation of the results of this work, follow-on activities, such as a workshop, may be arranged to further examine findings of the study and establish a path forward for future progress in these areas.
1.5
1.4 Approach
This document provides information for APEC members to better understand the potential of smart grid technologies to increase the use of renewable energy and energy efficiency in their economies in a manner appropriate for their populations and development needs. The approach taken to create the document first gathered information from three sources:
• A survey of APEC members
• A review of APEC member smart grid domestic and international activities
• A review of broader efforts (beyond APEC) to identify smart grid applications and benefits.
The first two items are used to assess APEC member needs and capabilities with respect to smart grid technologies. The third item assesses how smart grid technologies and practices are being used today or can potentially be used to increase the adoption of energy-efficiency and renewable-energy technologies to meet customer loads.
The findings from these sources are then combined and build upon the Major Economies Forum (MEF) Technology Action Plan (TAP) report (MEF 2009) to develop guidance on how smart grid technologies can best be used to enhance the use of renewable energy and energy efficiency across the APEC region. The guidance is segmented in recognition of the differing needs of urban and rural customers, and with and without electrical grid infrastructure in place.
1.5 About this Document
The smart grid area is undergoing rapid change. The concepts themselves are being reconsidered as they adapt to address economic, geographical, climate, cultural, and political differences within APEC and the world. This situation, together with the fast changing nature of smart grid technologies, creates a dynamic landscape. As such, this document is intended to provide guidance, not solutions, to assist APEC members in determining rational paths forward.
Chapter 1 of the report provides the overall introduction and reviews the approach taken in the project. Chapter 2 includes a survey and a review of smart grid implementation activities to formulate policies and programs to guide the development of smart grid programs in APEC economies. The survey focuses on smart grid technologies and practices are being used today or can potentially be used in different APEC economies to increase the adoption of energy efficiency and renewable-energy technologies. Although the landscape of smart grid programs and technology is changing rapidly, the chapter attempts to describe the present situation of smart grid deployment within APEC, and also reports on relevant information from literature surveys, an area where new material is being published monthly.
The guidance portion of the report is given in Chapter 3 which extends the findings of the earlier TAP (MEF 2009) to identify potential benefits and provide input for the formulation of smart grid programs to enhance the use of renewable energy and energy efficiency for developed, developing, and less-developed conditions in APEC economies. The guidance draws from significant related smart grid activities presently in progress. A number of technologies and concepts are linked under the banner of smart grid. These technologies can provide greater advantages when used in synergistically with other smart grid enabling technologies. Chapter 3 discusses integration of renewable resources, plug-in electric vehicles

1.6
(PEV), system operation efficiencies, energy-efficiency and carbon-reduction verification, and financial mechanisms as they relate to smart grid technologies. The aim is to provide an introduction to each technology or topic as it relates to smart grid versus traditional approaches. Examples from APEC economies are mentioned along with a discussion of potential benefits and implications with respect to smart grid implementation.
Chapter 4 of the report presents the technical, business and financial, and societal challenges to APEC smart grid deployments in APEC economies. Each APEC economy will face unique challenges in deploying smart grids, depending on many factors such as market structure, degree of industrialization, urbanization, population density, status of installed electric power system, environmental and economic drivers, along with many other factors. Some challenges must be addressed at the local, regional, or national level, while others can be addressed in part by global efforts such as the APEC Smart Initiative or the International Smart Grid Action Network being established as an activity of the Clean Energy Ministerial. The nature of the challenges evolve considerably as smart grid deployments progress through different stages of penetration and depth—from the early test-bed stage, to having widespread installation of enabling technologies, to employing integrated, higher-level smart grid functions. Recognizing the potential barriers to smart grid deployment and variety of challenges ahead is a first step needed to develop effective smart grid roadmaps and action plans.
Overall conclusions and recommendations are provided in Chapter 5 of the report. To provide a starting point for addressing smart grid challenges, Chapter 5 describes impactful, high-value smart grid activities, priorities, recommendations for roadmap development, and some areas ripe for further study. Based upon the presentation of the results of this work, follow-on activities, such as a workshop, may be arranged to further examine findings of the study and establish a path forward for future progress in these areas.
2.1
2.0 Situation within APEC
Though the landscape of smart grid programs and technology is changing rapidly, this report attempts to describe the present situation of smart grid deployment within APEC. To accomplish this, a survey was developed and circulated to APEC representatives in the member economies with interest in smart grids and its application to renewable-resource integration and energy efficiency. The document also reports on relevant information from literature surveys, an area where new material is being published monthly.
2.1 Survey Results
The purpose of the survey is to obtain direct information from APEC members on their familiarity with, plans for, and issues relevant to the use of smart grid technologies. The information will be used to help with the development of recommendations and guidance for implementation of smart grid programs and technologies to increase the utilization of renewable resources and energy efficiency.
The survey (included in Appendix A) is composed of five sections:
• The Baseline section is oriented to familiarity of all concerned parties (customers, utilities, and policy makers) with the smart grid concept, technologies, and applications.
• The Standards, Institutional, and Policy/Regulatory sections are to identify issues relevant to these three domains.
• The Other section asks if the respondent can specify issues not addressed by a survey question and for other information that might be helpful in developing the status and recommendations.
2.1.1 Status of Smart Grid from Survey Results
This subsection provides a summary discussion of the responses to the 16 surveys returned, with a graphical discussion that links the survey responses to economy characteristics.1 A copy of the responses to the 25 survey questions is provided in percentage terms in Appendix B.
2.1.1.1 Survey Responses to Smart Grid Baseline Questions
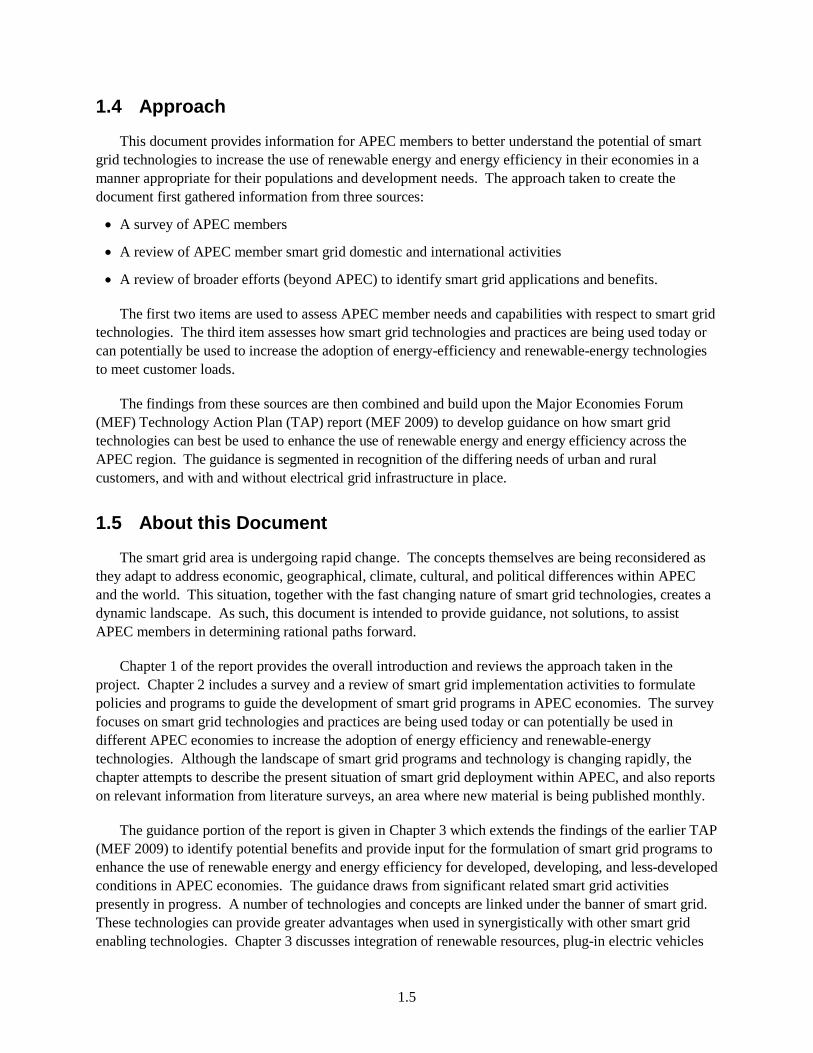
Figure 2.1 summarizes the general responses from APEC economies regarding how familiar different stakeholder groups may be with a smart grid. All economies included in the survey indicate that customers have either no familiarity with a smart grid, or it is familiar to only a minority of customers. The majority of APEC economies indicate that only zero to 25% of customers are aware of smart grid concepts or technologies.
The awareness across policy makers and electric utility providers shows much greater differentiation across the member economies. Over a third of the member economies indicate that 75% to 100% of policy makers and utility providers are now aware of the concept of a smart grid. At the other extreme,
1 The member economies participating in the survey were Australia; Canada; The Peoples Republic of China; Hong Kong, China; Indonesia; Japan; Republic of Korea; Malaysia; Mexico; New Zealand; Russia; Singapore; Chinese Taipei; Thailand; The United States; and Viet Nam.
2.2
“…there is a difference between being aware and sufficiently knowledgeable to act...”
less than a third of the member economies indicate that zero to 25% of policy makers and utility providers are aware of a smart grid, while the remaining member economies fall in-between in smart grid awareness of policy makers and electric utility providers.
Figure 2.1. Percent of Stakeholder Groups Familiar with a Smart Grid in APEC
• Awareness of the smart grid concept and technologies is highest among utilities and policy makers and lowest among customers, with customers being highly favorable or neutral in approximately 25% and 30% of the member economies, respectively. Awareness is hampered by the definition of a smart grid, varies regionally (by jurisdiction) even within large economies, but awareness will increase beyond large commercial and industrial customers as many emerging demonstrations proceed and interactions occur.
• To the extent that smart grid technologies are perceived to reduce the need for new supply resources, customer receptivity is improved, as many electricity generation projects face public opposition.
• Customers are concerned about the cost of electricity, are interested in receiving information about their electricity use, and expect to save money in a smart grid environment. However, whether they act on information and the ability of the smart grid to provide electricity savings is much less certain.
• Utilities are divided almost evenly between perceiving some benefit to their operations, through cost reduction (capital and operation) and operating metrics (e.g., reliability of service measures, frequency control, etc.). The realization of benefits is highly variable and dependent upon the ownership structure (e.g., public or private, and scope of the organization including generation, transmission, and distribution assets).
• Smart grid technology adoption is evenly divided between 1) adoption has not started; 2) adoption plans are in place, but adoption has not started; and 3) adoption is in progress.
• The fact that advanced metering infrastructure (AMI) alone is only a part of the smart grid technology and does not constitute a smart grid by itself is evidenced by the response of 75% of the member economies that indicated they have installed AMI with plans by most to install more, yet 25% or less of the respondents have used the AMI capability to conduct demand response or to integrate distributed generation resources (including renewables).
0% 20% 40% 60% 80% 100%
Electric utilities, Providers
Policy makers
Customers0-25%25-50%51-75%76-100%
2.3
“Time of use pricing available for about two decades in the form of day/night tariff has had poor acceptance, as customers do not have high discretionary load and incentives are not high enough to influence customer behavior and retailers are not motivated to provide adequate incentives.”
• Coupled to this, only 3 electric service providers in the 16 member economies, have the ability to send price signals to customers in an electronic format.
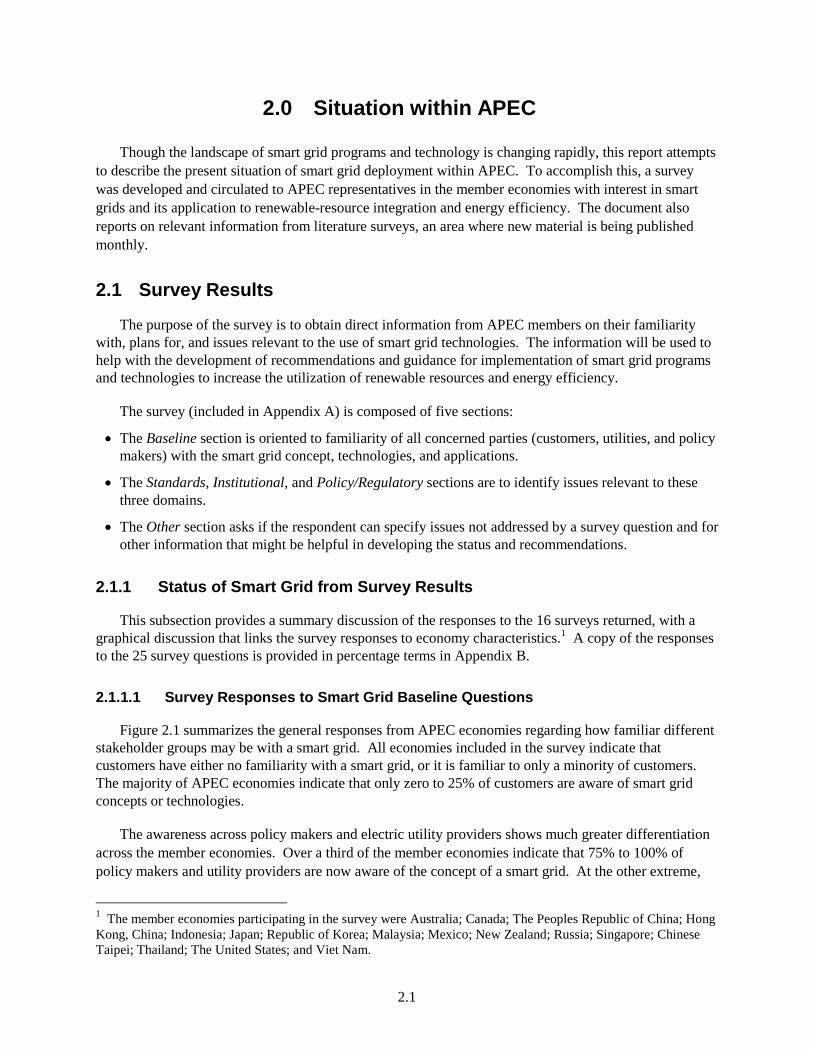
Figure 2.2. Economies without AMI Are More Rural and Have Lower GDP/Capita
Figure 2.2 illustrates clear correlation between both the amount of AMI currently installed in an member economy and the degree of urbanization and GDP per capita. The diameter of the bubbles corresponds to the extent that AMI is installed, used, or planned. Visibly, the more rural member economies (and those with the lowest GDP per capita) have no existing AMI, although three member economies indicate plans to install AMI. The member economies using AMI for demand response or for integrating distributed generation tend to be the most urban and wealthiest.
• The largest barrier to smart grid technology adoption is justifying the value proposition by the service provider and the customer, followed by regulatory constraints and technology standards that inhibit or slow the introduction of smart grid technologies.
• Electricity rates vary enormously across APEC economies and approaches to apportioning rates across residential, commercial, and industrial users also vary greatly. The ability to relate smart grid capabilities in a rate structure has a bearing on how smart grid is valued and how cost recovery may be conceived in member economies. Nearly all 75% of themember economies have average and time-of-use prices, and approximately 50% or fewer of the member economies employ critical peak or real-time pricing. The critical peak and real-time pricing schemes are generally limited to large commercial and industrial customers, although some member economies have been piloting these differential pricing schemes in the small commercial and residential markets.
05
101520253035404550
0% 20% 40% 60% 80% 100%
GDP
/Cap
ita
Percent Urban Population No existing AMISome installed AMIUsing AMI for DRUsing AMI for Integrating DG
2.4
A Smart Grid Action Out of necessity, in one island economy “…many small utilities collectively pool resources and shed load.”
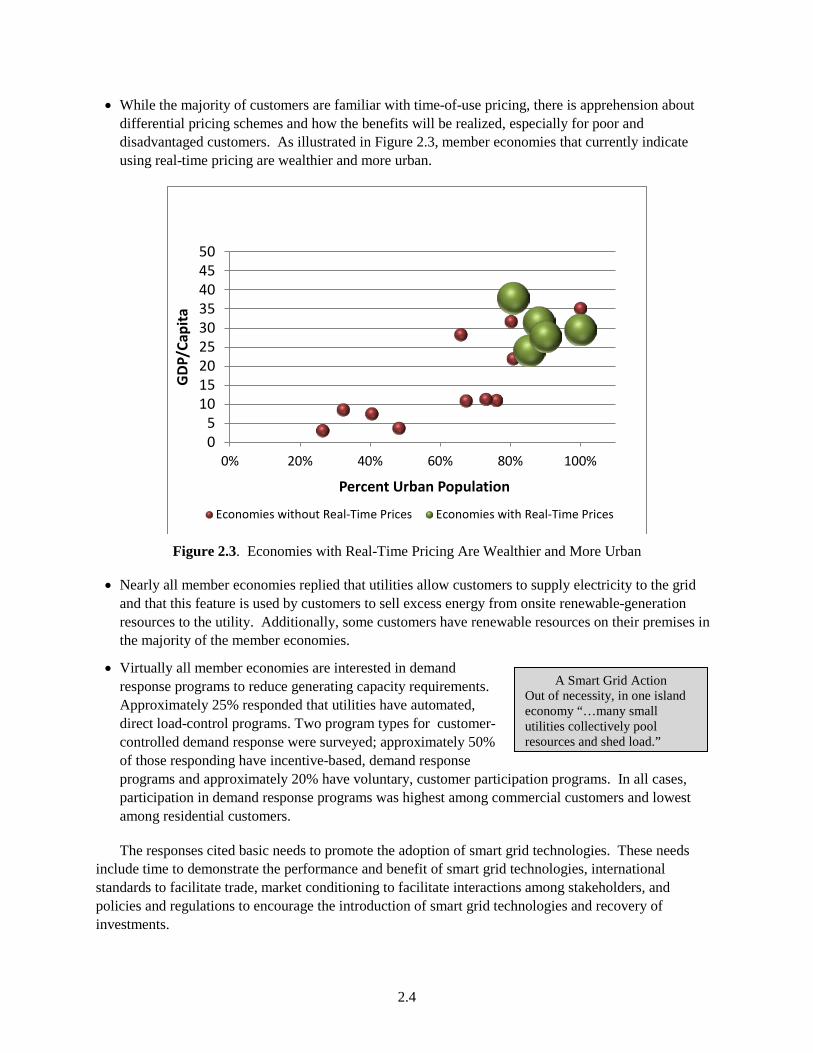
• While the majority of customers are familiar with time-of-use pricing, there is apprehension about differential pricing schemes and how the benefits will be realized, especially for poor and disadvantaged customers. As illustrated in Figure 2.3, member economies that currently indicate using real-time pricing are wealthier and more urban.
Figure 2.3. Economies with Real-Time Pricing Are Wealthier and More Urban
• Nearly all member economies replied that utilities allow customers to supply electricity to the grid and that this feature is used by customers to sell excess energy from onsite renewable-generation resources to the utility. Additionally, some customers have renewable resources on their premises in the majority of the member economies.
• Virtually all member economies are interested in demand response programs to reduce generating capacity requirements. Approximately 25% responded that utilities have automated, direct load-control programs. Two program types for customer-controlled demand response were surveyed; approximately 50% of those responding have incentive-based, demand response programs and approximately 20% have voluntary, customer participation programs. In all cases, participation in demand response programs was highest among commercial customers and lowest among residential customers.
The responses cited basic needs to promote the adoption of smart grid technologies. These needs include time to demonstrate the performance and benefit of smart grid technologies, international standards to facilitate trade, market conditioning to facilitate interactions among stakeholders, and policies and regulations to encourage the introduction of smart grid technologies and recovery of investments.
05
101520253035404550
0% 20% 40% 60% 80% 100%
GDP
/Cap
ita
Percent Urban Population
Economies without Real-Time Prices Economies with Real-Time Prices
2.5
“One of the major constraints is the lack of regulation to facilitate the introduction of the smart grid technology.”
Institutional arrangements, market design, and consumer expectations are currently focused around a model of a large scale central generation and a simple accumulative meter. Changes are required to accommodate a more dynamic, AMI, multiple flow, technology-based and consumer-centric model.
Needs: • Prove smart grid in developed
economies • International standards to facilitate trade
opportunities • Market conditions that facilitate
interaction • Regulations to allow introduction of
smart grid technologies and recover investment.
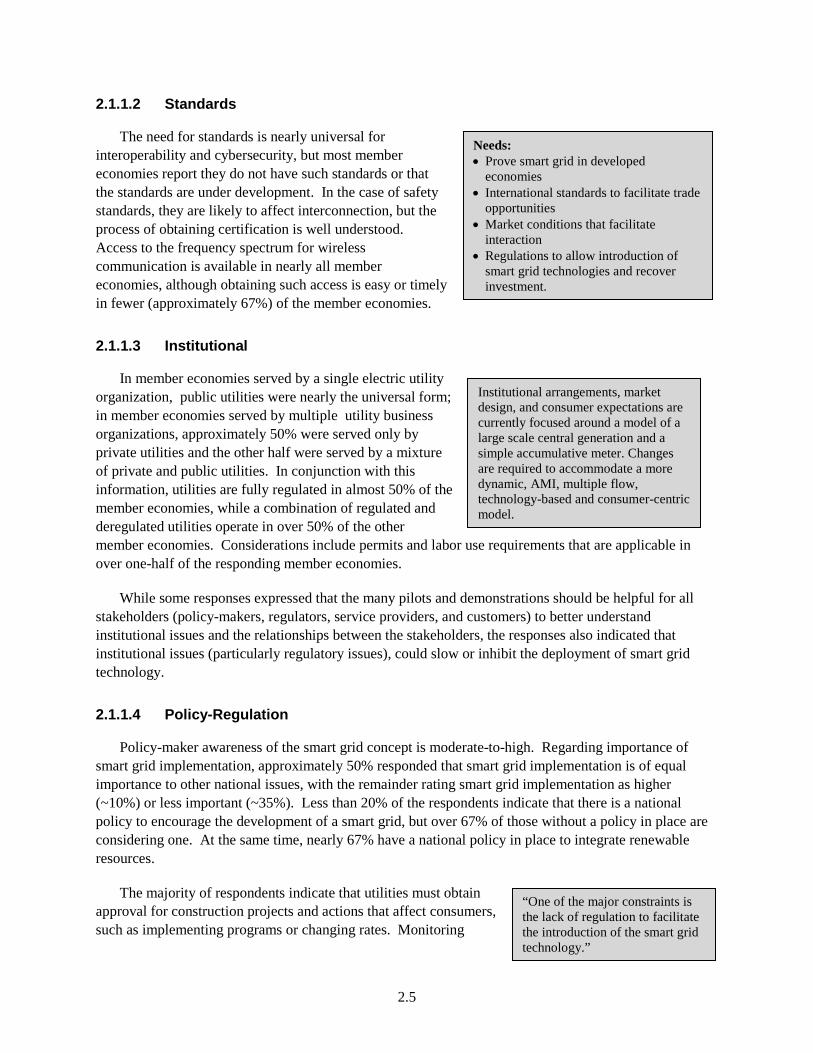
2.1.1.2 Standards
The need for standards is nearly universal for interoperability and cybersecurity, but most member economies report they do not have such standards or that the standards are under development. In the case of safety standards, they are likely to affect interconnection, but the process of obtaining certification is well understood. Access to the frequency spectrum for wireless communication is available in nearly all member economies, although obtaining such access is easy or timely in fewer (approximately 67%) of the member economies.
2.1.1.3 Institutional
In member economies served by a single electric utility organization, public utilities were nearly the universal form; in member economies served by multiple utility business organizations, approximately 50% were served only by private utilities and the other half were served by a mixture of private and public utilities. In conjunction with this information, utilities are fully regulated in almost 50% of the member economies, while a combination of regulated and deregulated utilities operate in over 50% of the other member economies. Considerations include permits and labor use requirements that are applicable in over one-half of the responding member economies.
While some responses expressed that the many pilots and demonstrations should be helpful for all stakeholders (policy-makers, regulators, service providers, and customers) to better understand institutional issues and the relationships between the stakeholders, the responses also indicated that institutional issues (particularly regulatory issues), could slow or inhibit the deployment of smart grid technology.
2.1.1.4 Policy-Regulation
Policy-maker awareness of the smart grid concept is moderate-to-high. Regarding importance of smart grid implementation, approximately 50% responded that smart grid implementation is of equal importance to other national issues, with the remainder rating smart grid implementation as higher (~10%) or less important (~35%). Less than 20% of the respondents indicate that there is a national policy to encourage the development of a smart grid, but over 67% of those without a policy in place are considering one. At the same time, nearly 67% have a national policy in place to integrate renewable resources.
The majority of respondents indicate that utilities must obtain approval for construction projects and actions that affect consumers, such as implementing programs or changing rates. Monitoring
2.6
The integration of renewable resources is dependent on the size and diversity of the load, with an upper limit of ~20% to 25% without additional spinning reserve capacity to reduce intermittency or the use of smart grid communication and control strategies. (PNNL 2010)
power quality and reliability is required in nearly 67% of responding member economies, and such requirements are being considered in two of the six member economies that responded no.
2.1.2 Smart Grid Potential for Energy Efficiency and Renewables Integration
For the increased integration of renewable resources and energy efficiency for customers, 50% responded that customers expect the smart grid will help with the integration or use of renewable energy, and 75% of respondents said that some customers have renewable resources installed on their premises. In the case of utilities, 94% responded that the smart grid would provide either some or a definite benefit (50% and 44%, respectively) to increase the integration of renewables.
On a positive note, 81% responded that customers are allowed to supply electricity to the grid through bi-directional metering, and 75% of customers with renewable generation on their premises do so. While a high percentage of member economies responded affirmative, the practice of bi-directional metering is confined to a relatively small number of customers because of technical issues regarding voltage stability and reverse flow. Coupled with bi-directional metering, 63% of respondents said that their economy has a standard for the integration of renewable technologies and an additional 19% responded that a standard was under development.
However, the high expectations and standards may not be sufficient to achieve the integration of renewable supply technologies. Aspects of the smart grid are helpful, if not necessary, to facilitate the integration of renewable resources by replacing the need for standby generating capacity (spinning reserve) to offset the intermittency of renewables.
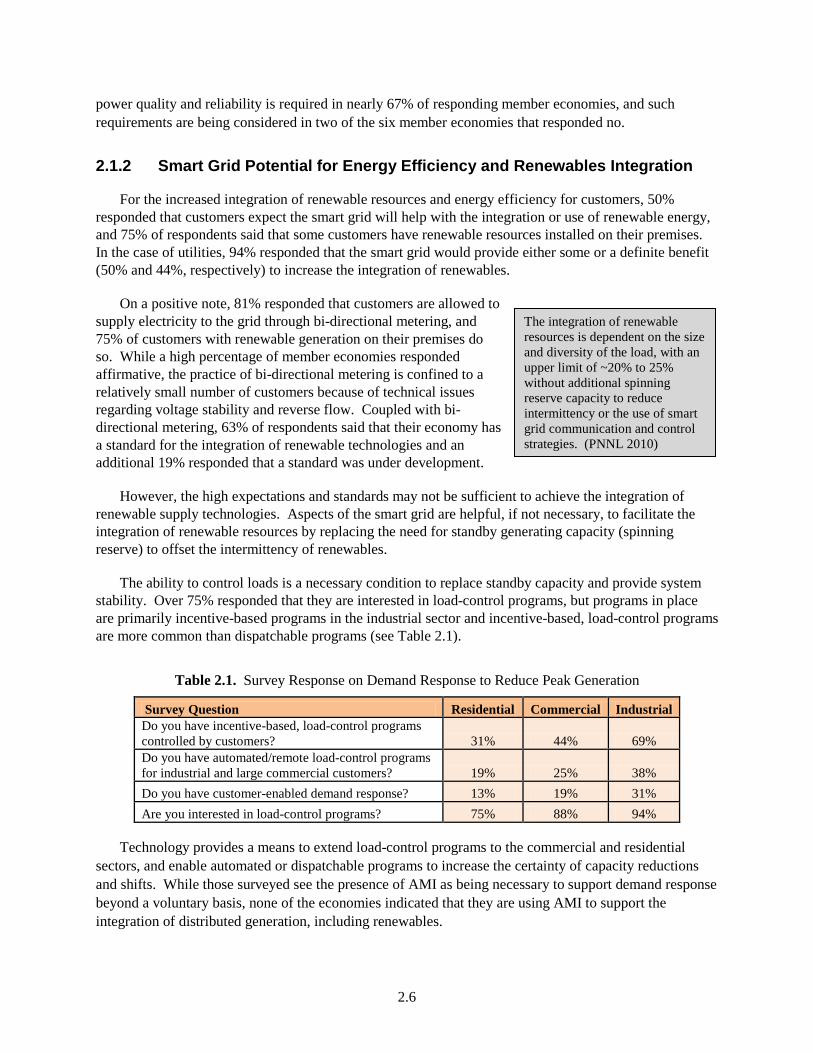
The ability to control loads is a necessary condition to replace standby capacity and provide system stability. Over 75% responded that they are interested in load-control programs, but programs in place are primarily incentive-based programs in the industrial sector and incentive-based, load-control programs are more common than dispatchable programs (see Table 2.1).
Table 2.1. Survey Response on Demand Response to Reduce Peak Generation
Survey Question Residential Commercial Industrial Do you have incentive-based, load-control programs controlled by customers? 31% 44% 69% Do you have automated/remote load-control programs for industrial and large commercial customers? 19% 25% 38% Do you have customer-enabled demand response? 13% 19% 31% Are you interested in load-control programs? 75% 88% 94%
Technology provides a means to extend load-control programs to the commercial and residential sectors, and enable automated or dispatchable programs to increase the certainty of capacity reductions and shifts. While those surveyed see the presence of AMI as being necessary to support demand response beyond a voluntary basis, none of the economies indicated that they are using AMI to support the integration of distributed generation, including renewables.
2.7
Perception of Barriers: • Utility and customer cost recovery • National policy to set framework for
development • Regulatory inflexibility impede the
introduction of smart grid technologies • Lack of standards or standards unable
to keep up with rapidly changing technology.
Leading challenges to deploying smart grid technology to achieve demand response are interoperability, cybersecurity, and communication. In the cases of interoperability and cybersecurity, 88% and 69%, respectively, responded that standards do not exist in their economies. In the case of communications, 88% responded that communication access is available, and over 50% responded that obtaining access is relatively easy or other modes of communication other than wireless are available. In addition to the absence of technology standards (interoperability and cybersecurity), other regulatory constraints applicable to service provider investment in smart grid technology apply: 69% responded that the presence of regulatory inertia, and 88% responded that recovery of investment cost was an issue.
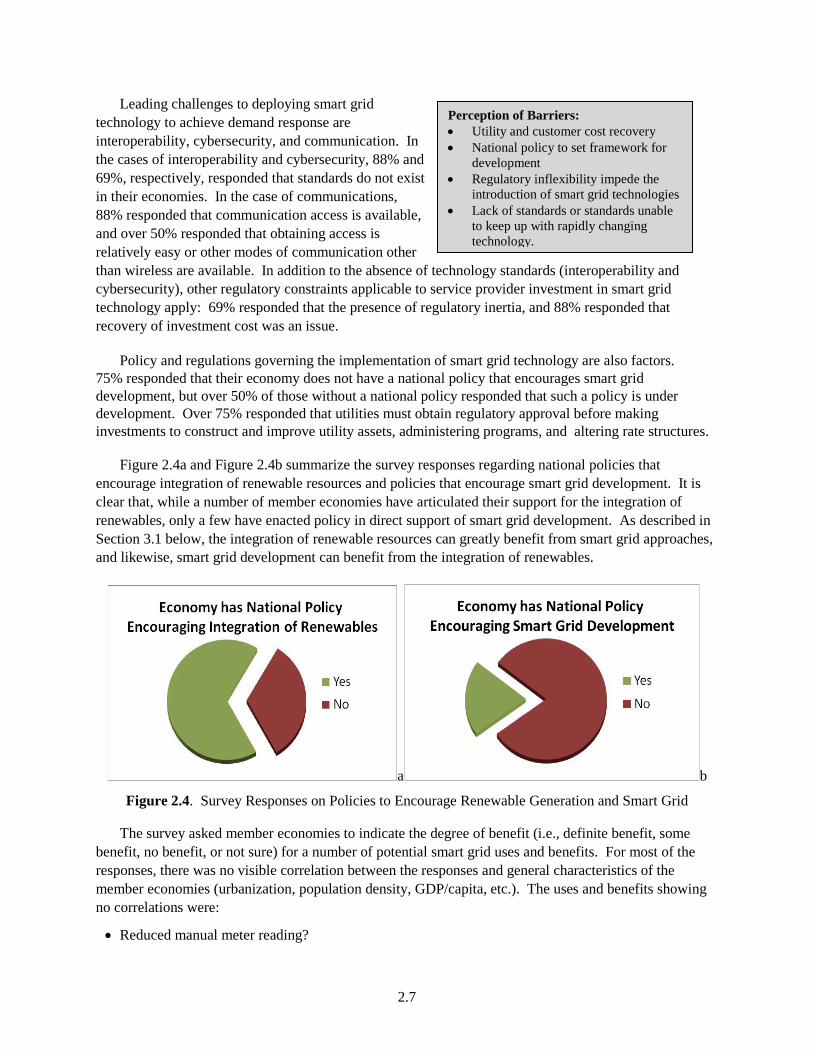
Policy and regulations governing the implementation of smart grid technology are also factors. 75% responded that their economy does not have a national policy that encourages smart grid development, but over 50% of those without a national policy responded that such a policy is under development. Over 75% responded that utilities must obtain regulatory approval before making investments to construct and improve utility assets, administering programs, and altering rate structures.
Figure 2.4a and Figure 2.4b summarize the survey responses regarding national policies that encourage integration of renewable resources and policies that encourage smart grid development. It is clear that, while a number of member economies have articulated their support for the integration of renewables, only a few have enacted policy in direct support of smart grid development. As described in Section 3.1 below, the integration of renewable resources can greatly benefit from smart grid approaches, and likewise, smart grid development can benefit from the integration of renewables.
a b
Figure 2.4. Survey Responses on Policies to Encourage Renewable Generation and Smart Grid
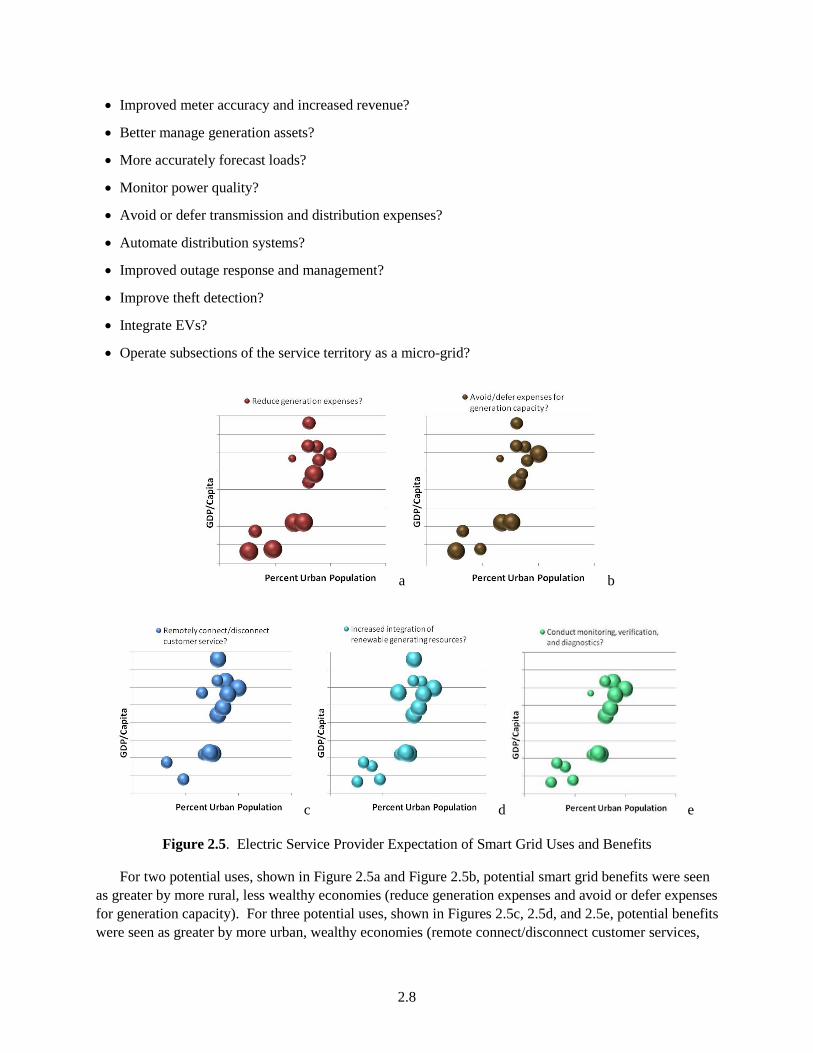
The survey asked member economies to indicate the degree of benefit (i.e., definite benefit, some benefit, no benefit, or not sure) for a number of potential smart grid uses and benefits. For most of the responses, there was no visible correlation between the responses and general characteristics of the member economies (urbanization, population density, GDP/capita, etc.). The uses and benefits showing no correlations were:
• Reduced manual meter reading?
2.8
• Improved meter accuracy and increased revenue?
• Better manage generation assets?
• More accurately forecast loads?
• Monitor power quality?
• Avoid or defer transmission and distribution expenses?
• Automate distribution systems?
• Improved outage response and management?
• Improve theft detection?
• Integrate EVs?
• Operate subsections of the service territory as a micro-grid?
Figure 2.5. Electric Service Provider Expectation of Smart Grid Uses and Benefits
For two potential uses, shown in Figure 2.5a and Figure 2.5b, potential smart grid benefits were seen as greater by more rural, less wealthy economies (reduce generation expenses and avoid or defer expenses for generation capacity). For three potential uses, shown in Figures 2.5c, 2.5d, and 2.5e, potential benefits were seen as greater by more urban, wealthy economies (remote connect/disconnect customer services,
c d e
a b
2.9
increase integration of renewable generating resources, and conduct monitoring, verification, and diagnostics).
Survey responses were studied to determine where similarities in responses across member economies can be either clearly observed or not observed as a function of underlying characteristics of the member economies that might impact smart grid development or planning (population, population density, urbanization, wealth, and per capita electricity consumption). For most survey questions, no significant correlations could be determined. Significant correlations were not found with overall population or population density. In general, the strongest correlations were found with urbanization and GDP per capita—both factors appear to impact the rate of adoption of smart grid technologies and the perception of potential benefits related to smart grid.
2.2 Investigation of Smart Grid Activity in APEC
The following material provides information on smart grid efforts gathered from APEC news sources and member economy specific websites, reports, and press releases.
2.2.1 APEC Smart Grid Overview
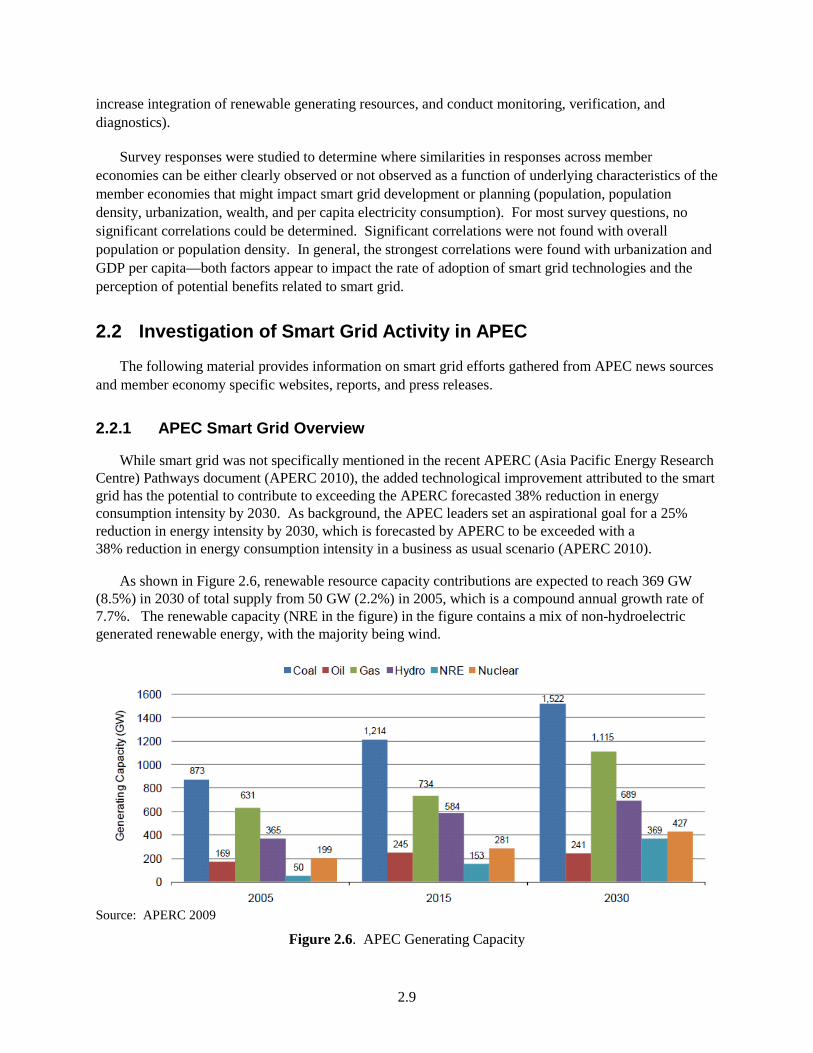
While smart grid was not specifically mentioned in the recent APERC (Asia Pacific Energy Research Centre) Pathways document (APERC 2010), the added technological improvement attributed to the smart grid has the potential to contribute to exceeding the APERC forecasted 38% reduction in energy consumption intensity by 2030. As background, the APEC leaders set an aspirational goal for a 25% reduction in energy intensity by 2030, which is forecasted by APERC to be exceeded with a 38% reduction in energy consumption intensity in a business as usual scenario (APERC 2010).
As shown in Figure 2.6, renewable resource capacity contributions are expected to reach 369 GW (8.5%) in 2030 of total supply from 50 GW (2.2%) in 2005, which is a compound annual growth rate of 7.7%. The renewable capacity (NRE in the figure) in the figure contains a mix of non-hydroelectric generated renewable energy, with the majority being wind.
Source: APERC 2009
Figure 2.6. APEC Generating Capacity
2.10
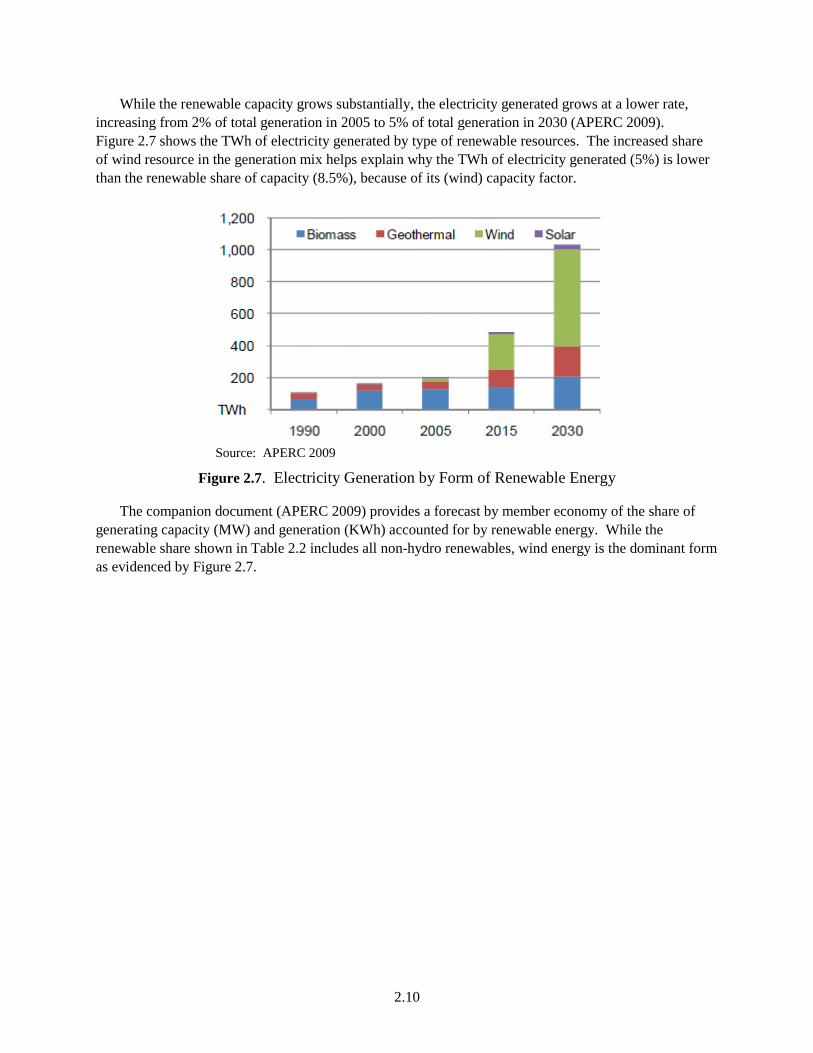
While the renewable capacity grows substantially, the electricity generated grows at a lower rate, increasing from 2% of total generation in 2005 to 5% of total generation in 2030 (APERC 2009). Figure 2.7 shows the TWh of electricity generated by type of renewable resources. The increased share of wind resource in the generation mix helps explain why the TWh of electricity generated (5%) is lower than the renewable share of capacity (8.5%), because of its (wind) capacity factor.
Source: APERC 2009
Figure 2.7. Electricity Generation by Form of Renewable Energy
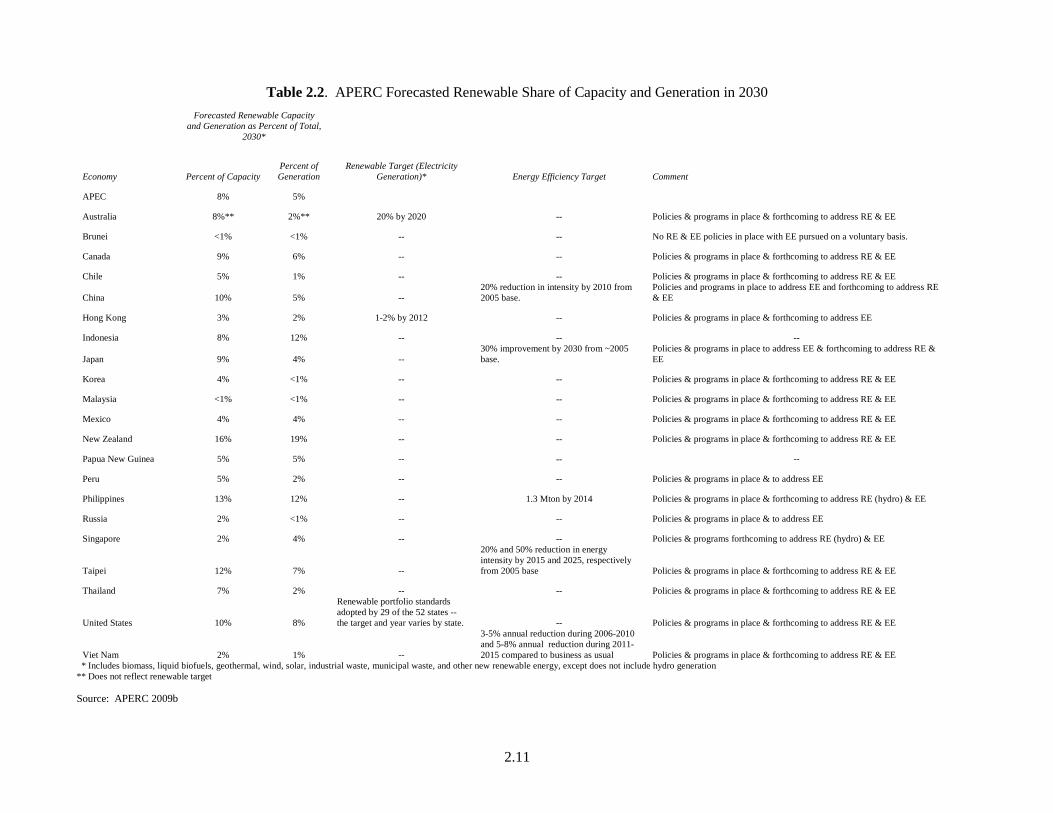
The companion document (APERC 2009) provides a forecast by member economy of the share of generating capacity (MW) and generation (KWh) accounted for by renewable energy. While the renewable share shown in Table 2.2 includes all non-hydro renewables, wind energy is the dominant form as evidenced by Figure 2.7.
2.11
Table 2.2. APERC Forecasted Renewable Share of Capacity and Generation in 2030
Forecasted Renewable Capacity and Generation as Percent of Total,
2030*
Renewable Target (Electricity Generation)*
Percent of Capacity
Percent of Generation Energy Efficiency Target
Economy Comment
APEC 8% 5%
Australia 8%** 2%** 20% by 2020 -- Policies & programs in place & forthcoming to address RE & EE
Brunei <1% <1% -- -- No RE & EE policies in place with EE pursued on a voluntary basis.
Canada 9% 6% -- -- Policies & programs in place & forthcoming to address RE & EE
Chile 5% 1% -- -- Policies & programs in place & forthcoming to address RE & EE
China 10% 5% -- 20% reduction in intensity by 2010 from 2005 base.
Policies and programs in place to address EE and forthcoming to address RE & EE
Hong Kong 3% 2% 1-2% by 2012 -- Policies & programs in place & forthcoming to address EE
Indonesia 8% 12% -- -- --
Japan 9% 4% -- 30% improvement by 2030 from ~2005 base.
Policies & programs in place to address EE & forthcoming to address RE & EE
Korea 4% <1% -- -- Policies & programs in place & forthcoming to address RE & EE
Malaysia <1% <1% -- -- Policies & programs in place & forthcoming to address RE & EE
Mexico 4% 4% -- -- Policies & programs in place & forthcoming to address RE & EE
New Zealand 16% 19% -- -- Policies & programs in place & forthcoming to address RE & EE
Papua New Guinea 5% 5% -- -- --
Peru 5% 2% -- -- Policies & programs in place & to address EE
Philippines 13% 12% -- 1.3 Mton by 2014 Policies & programs in place & forthcoming to address RE (hydro) & EE
Russia 2% <1% -- -- Policies & programs in place & to address EE
Singapore 2% 4% -- -- Policies & programs forthcoming to address RE (hydro) & EE
Taipei 12% 7% --
20% and 50% reduction in energy intensity by 2015 and 2025, respectively from 2005 base Policies & programs in place & forthcoming to address RE & EE
Thailand 7% 2% -- -- Policies & programs in place & forthcoming to address RE & EE
United States 10% 8%
Renewable portfolio standards adopted by 29 of the 52 states -- the target and year varies by state. -- Policies & programs in place & forthcoming to address RE & EE
Viet Nam 2% 1% --
3-5% annual reduction during 2006-2010 and 5-8% annual reduction during 2011-2015 compared to business as usual Policies & programs in place & forthcoming to address RE & EE
* Includes biomass, liquid biofuels, geothermal, wind, solar, industrial waste, municipal waste, and other new renewable energy, except does not include hydro generation ** Does not reflect renewable target Source: APERC 2009b
2.12
“Smart grids may offer methodologies of integration, in particular sub-areas of a grid where communication, control and protection may be implemented to achieve high levels of integration and reliability.” (APEC 2010b)
In addition, the report (APERC 2009) contains economy-level information on the targets for renewable energy and energy efficiency, and the presence of policies and programs pertaining to these two resources. While virtually all of the APEC economies have policies and programs in place or forthcoming to address renewable energy and energy efficiency, the targets set for these resources, with a few exceptions, are modest or nonexistent. This finding is consistent with a 2002 study (APEC 2002) in which improvements in renewable-energy infrastructure (financing, policy, manufacturing base, communications, market demand, educational programs, and information networks) are more important than the technology. While smart grid technologies cannot directly resolve many of the infrastructure issues, they can reduce risks associated with integration and operation of renewable technologies, thereby indirectly address the financing, policy, manufacturing areas.
An assessment of standards (APEC 2006) recommended three priority areas to harmonize the development of standards:
• Manufacture and installation solar water heaters
• Installation of grid connected photovoltaic (PV) systems
• Installation of standalone power systems.
At the time of the report, it was determined that grid-connected PV systems were being installed in eight member economies, with incentives offered in six member economies. In the case of standalone power systems, 17 to 18 member economies were installing such systems, with incentives offered in eight member economies.
To enable several smart grid capabilities, many member economies are installing smart meters. A recent study by Pike Research forecasts an increase in the total number of installed smart meters in Asia Pacific from 52.8 million in 2010 to 350.3 million by 2016, a compounded annual growth rate of 37% (Pike 2011).
Further, a recent assessment of issues surrounding the implementation of renewable technologies into grid networks is contained in (APEC 2010b). The report provides a thorough review of grid connection issues and best practices with the note that the best practices are not universally applicable because of differences in grid design, sizes and types of loads, and characteristics of the renewable resource. In addition to the technical issues related to grid connection, the assessment discusses policy, regulatory, institutional, and human capacity issues that may impact smart grid implementation. The report provides a list of research topics and research projects conducted by APEC economies that bear upon grid connection of renewable resources.
Another APEC report (APEC 2010c) provides best practices for the use of renewable technologies in urban areas, with sections on lessons learned, obstacles, and an action plan (i.e., roadmap) to address technical, policy, regulatory, institutional, and financial issues. The report calls out the need for smart grid technology to integrate increasingly large amount of renewable resources.
Another report (APEC 2007) on village power refers to the harmonization of grid connection standards for renewable technologies for operation in a micro-grid mode when grid connection is lost.
2.13
While not specifically directed to a smart grid, use of smart grid technologies would face the same obstacles as other village power technologies: 1) knowledge of the technology, 2) training and education to users and local technicians, 3) system maintenance and routine check-ups, 4) system ownerships and revenue collection, 5) government policies and regulatory framework supporting renewable energy-based village power technologies, 6) commercialization of technologies, 7) financial mechanisms, and 8) initial costs of technologies.
2.2.2 Individual Member Economy Information
This section contains a review of information available from member economy sources.
2.2.2.1 Australia
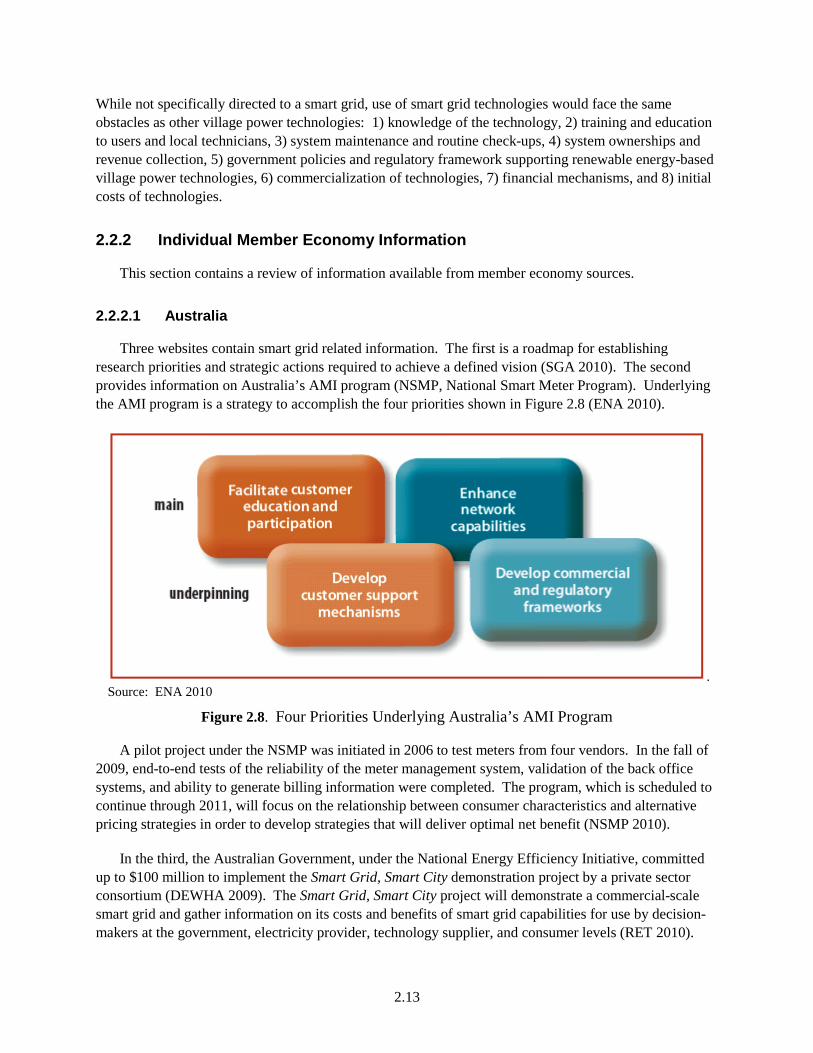
Three websites contain smart grid related information. The first is a roadmap for establishing research priorities and strategic actions required to achieve a defined vision (SGA 2010). The second provides information on Australia’s AMI program (NSMP, National Smart Meter Program). Underlying the AMI program is a strategy to accomplish the four priorities shown in Figure 2.8 (ENA 2010).
. Source: ENA 2010
Figure 2.8. Four Priorities Underlying Australia’s AMI Program
A pilot project under the NSMP was initiated in 2006 to test meters from four vendors. In the fall of 2009, end-to-end tests of the reliability of the meter management system, validation of the back office systems, and ability to generate billing information were completed. The program, which is scheduled to continue through 2011, will focus on the relationship between consumer characteristics and alternative pricing strategies in order to develop strategies that will deliver optimal net benefit (NSMP 2010).
In the third, the Australian Government, under the National Energy Efficiency Initiative, committed up to $100 million to implement the Smart Grid, Smart City demonstration project by a private sector consortium (DEWHA 2009). The Smart Grid, Smart City project will demonstrate a commercial-scale smart grid and gather information on its costs and benefits of smart grid capabilities for use by decision-makers at the government, electricity provider, technology supplier, and consumer levels (RET 2010).
2.14
“… the Canadian smart grid will not be developed or deployed in a vacuum. The United States, Europe, much of Asia, Australia, and New Zealand are all moving forward with smart grid innovation….Monitoring and engaging those conversations will be vital to ensuring that the Canadian smart grid vision is congruent to those of other jurisdictions.” Source: CEA 2010
2.2.2.2 Brunei Darussalam
No information located.
2.2.2.3 Canada
CanmetENERGY maintains a website devoted to smart grid activities and information (CE 2009). They state that a major driver is the integration of renewable energy. CanmetENERGY’s work is organized to address five issue areas:
1. Using the current network infrastructures in an optimal way
2. Improving the quality of service
3. Ensuring the integrity of the network
4. Reducing the cost of isolated networks
5. Optimizing the electricity production.
In addition, the website provides links to success stories that highlights interconnection standards, guidelines, technical assistance, and other related information.
Smart grid demonstrations are underway or planned in areas served by more than 20 utilities (CE 2010) in one or more of the five general areas to address the topics. While elements of each demonstration vary because of regional differences, the common theme is the need to develop communications networks. The Canadian Electricity Association recently stated the need to balance the high expectations with the evolutionary change in the grid system to facilitate demand response, integration of renewable-distributed generation, integration of EVs, optimization of asset use, and problem detection (CEA 2010). This requires that stakeholders (policy-makers, regulators, service providers, vendors, and customers) be involved to develop a vision and remain vested in the process to understand changes as they occur (CEA 2010).
2.2.2.4 Chile
No information located.
2.2.2.5 People’s Republic of China
In a recent presentation to the World Energy Congress, Liu Zhenya, President of the State Grid Corporation of China (SGCC), presented a strategy for China’s “strong and smart” grid to integrate smart technologies into an efficient and interconnected platform to serve the public (SGCC 2010). Zhenya’s presentation also addressed work in high-voltage AC and DC systems, and integration of renewable and EVs. Although English language versions were not located, Zhenya also has edited two books titled Smart Grid Technology and Knowledge of Smart Grid (SGN 2010a).
2.15
The North China Grid has completed the installation of a smart grid project in a residential block to demonstrate the integration of smart grid technologies to integrate renewable resources and enable customers to reduce electricity consumption in response to price signals (SGN 2010b). The State Grid Energy Research Institute spoke on the importance of the transmission, the integration of renewable-distributed resources, and preparation to accommodate EVs (SEON 2010).
2.2.2.6 Hong Kong, China
Hong Kong is in the initial stages of developing a policy to deal with smart grid with recommendations to provide governance (Close 2010) and use Hong Kong’s broadband network to help implement the smart grid technology (CCoCHK 2010). Information on the website of one of the two electric utilities that serve Hong Kong also indicates that smart grid efforts are in the planning stages (CLP 2010).
2.2.2.7 Indonesia
Indonesia has expressed interest in smart grid implementation, especially associated increasing the efficiency of existing grids and developing smaller-scale smart grid programs (MEF 2009). Because Indonesia is composed of over 17,000 small and large islands, smart grid technologies related to integrating renewable-energy systems into small and micro-grids are of particular interest to energy planners.
2.2.2.8 Japan
The smart grid effort in Japan appears to be at an early stage with the strategic energy plan calling for coordination of relevant policies across agencies, conducting demonstration projects both domestically and internationally, and international standardization (METI 2010a). The Smart Grid Community Alliance has been formed with four working groups to develop international strategies, international standardization, a roadmap, and a smart house information infrastructure (JSCA 2010).
Demonstrations will take place in four cities to use smart grid technologies to manage energy consumption and integrate EVs distributed generation (METI 2010b and METI 2010c). The electric research power industry is developing the Triple “I” (Intelligent, Interactive, and Integrated) Power Systems to link demand and supply, and to integrate renewable-distributed resources (CRIEPI 2010).
2.2.2.9 Republic of Korea
The South Korean government initiated the “Low Carbon Green Growth” vision in 1968 that led to the establishment of the Korean Smart Grid Institute (KSGI) (KSGI 2010a). The KSGI is responsible for implementing the Korea Smart Grid Roadmap to develop and use smart grid technologies to integrate renewable resources and economic growth (KSGI 2010b). The KSGI has over 100 member companies and pursues five tasks to establish infrastructure, conduct research and analysis, mediate between the government and private sector stakeholders, harmonize standards, and conduct training (KSGI 2010a and KSGI 2010b).
2.16
A demonstration will be conducted in a city on Jeju Island to test IT strategies, integrate distributed generation technologies (wind, PV, and fuel cell), integrate EVs, and provide energy management for customers (KSGI 2011). Korea was also the lead, along with Italy, in the MEF Smart Grid Technology Action Plan (MEF 2009).
2.2.2.10 Malaysia
Malaysia indicates interest in renewable energy (hydro-electric, solar, and wind), conservation, thermal electricity generation technologies (MEC 2010a), but believes the time is not right to pursue smart grid implementation citing the high investment required (MEC 2010b).
2.2.2.11 Mexico
A press release from the Secretary of Energy indicates that implementation of smart grid technologies is being discussed at the national level to achieve integration of renewable resources and enable customers to manage energy consumption (SENER 2010). A second report indicates that the Federal Electricity Commission (CFE) is preparing a tender for implementation of a pilot project (BNA 2010). In 2010, a team from SENER and CFE became the first organization to apply the Smart Grid Maturity Model (SGMM) at the national level as well as the three CFE divisions, representing different regions, load profiles, and conditions within Mexico (SGMM 2010). One of the state’s goals was to use the SGMM process as an aid in developing a national smart gird roadmap.
2.2.2.12 New Zealand
New Zealand government policy targets renewable resources (including hydro generation) to provide 90% of electricity supply in 2025, with a proposed energy efficiency target of 55 petajoules of saving across the economy by 2015 (NZMED 2010). The implementation of AMI systems to help in achieving this goal is led by industry (NZEC 2009). In their report, the Electricity Commission recommended to the government that “it is not necessary to extensively regulate the roll-out of AMI at this time as the benefits of regulation do not outweigh the costs.” However, the Electricity Commission did recommend regulatory action to address interoperability, data security, and inadvertent disconnection of consumers from the AMI systems that are installed.
2.2.2.13 Papua New Guinea
No information located.
2.2.2.14 Peru
No information located.
2.2.2.15 The Philippines
The Philippines are beginning to make investments in a smart grid. A press release on the Department of Energy’s website indicates that a portion of a $250 million loan supported by the Asian Development Bank and The World Bank will be used for smart grid investments (PHDOE 2009).
2.17
Another article indicates that the Energy Regulatory Commission is drafting rules for the implementation of smart grid technology (Star 2010).
2.2.2.16 Russia
The Russia Energy Agency (REA) and the Federal Grid Company (FGA) are creating a smart grid technology platform under name of the Intellectual Power System of Russia (REA 2010). The goal of this effort is to coordinate the modernization and innovational development of the Russian power sector and is meant to link all elements of the Russian power system, including generation, transmission, distribution, trade, consumption, and governance. Russia has also recently chosen the city of Belgorod as a major smart grid demonstration site.
2.2.2.17 Singapore
The lead for Singapore’s smart grid efforts, the Energy Market Authority, announced the completion of a smart metering trial involving about 400 consumers. The trial demonstrated the success of using an Automatic Meter Reading System together with e-payment systems in Singapore to create an electricity retailing platform to service small electricity consumers based on a pre-paid concept. Building on the success of this trial, EMA intends to conduct a larger-scale pilot project, called the Intelligent Energy System (IES) pilot project. The IES pilot seeks to test and evaluate new applications and technologies around a smart grid. The IES pilot will integrate advanced information & communication technology with the power system to allow two-way communication (riding on the Automatic Meter Reading System) between electricity consumers and grid operators. About 4,500 consumers will participate in this pilot. The success of the IES pilot project will enable EMA to progressively roll out workable solutions for the whole of Singapore, further opening up the electricity retail market for competition and enabling households to enjoy benefits of retail competition. The pilot is expected to be completed by 2013.
In addition to EMA’s efforts, the Economic Strategies Committee released a report titled Energy Resilience and Sustainable Growth. The report recommends investing in energy infrastructure in advance of demand increases and cites the role of intelligent energy systems (MOF-ESC 2010). The formation of the Experimental Power Grid Center (EPGC) was announced, with EPGC being a multi-organization that will conduct Research and Development on distributed and renewable energy resources and the smart grid.
2.2.2.18 Chinese Taipei
Taiwan Power Company’s 2010 Sustainability Report indicates that a 20-year plan (2007 to 2027) is underway to plan smart grid efforts and implement smart grid technologies in the transmission and distribution system (Taipower 2010).
2.2.2.19 Thailand
Thailand has recently announced a number of activities to increase the role of smart grid in their economy. In early 2011, the Provincial Electrical Authority (PEA) announced its Smart Grid Roadmap project, which has a goal of applying advanced technologies to optimize the operation of the power system to serve people through Thailand. PEA also is investing heavily to modernize its information
2.18
infrastructure. It has recently completed one of the largest and most sophisticated fiber optics networks in the world and has began testing Automatic Meter Reading (AMR) with 36,000 of its largest customers (PEA 2011). A conference also was held in Thailand in 2010 to discuss smart grid concepts and technologies and to increase their knowledge and contacts (TSGSU 2010).
2.2.2.20 United States
The smart grid effort in the United States was formally initiated with the passage of the Energy Independence and Security Act (EISA) of 2007. Major provisions of EISA assigned deployments, research, coordination, and demonstration functions to the US Department of Energy (USDOE) and development of protocols and standards for interoperability to the National Institute for Science and Technology (NIST), with involvement of the relevant stakeholders (EISA 2007).
The USDOE prepared a vision for the electric system, in which 100% of the power would flow over a smart grid by 2030 (USDOE 2003) and defines the functional characteristics of a smart grid (NETL 2009). The USDOE’s most recent multi-year research plan (USDOE 2010a) provides for work in five topic areas:
1. Standards and best practices
2. Technology development
3. Modeling
4. Analysis
5. Evaluation and demonstrations.
In addition, USDOE has invested approximately $600 million to demonstrate various aspects of smart grid technologies and $3.5 billion to modernize grid infrastructure through investment grants (USDOE 2010b; ARRA-SGP 2010). NIST also has a major role for the development of interoperability standards to ensure that the many components interface and communicate (NIST 2010).
The stakeholders involved in U.S. efforts are identified here. The Federal Energy Regulatory Commission (FERC) has regulatory responsibility for the interstate transmission of all forms of energy, which pertains to the interface of the smart grid with the interstate transmission of electricity (FERC 2009). The National Association of Regulatory Utility Commissioners (NARUC) provides a forum for state utility commissioners to exchange information to help guide the deployment of smart grid technologies by regulated utilities (NARUC 2010). Three major utility organizations are the Edison Electric Institute, which represents member utility issues to include smart grid topics; the American Public Power Association, which represents municipal-owned utilities; and the National Rural Electric Cooperative Association, which represents rural electric cooperatives. In addition, the Electric Power Research Institute (EPRI) pursues smart grid research for member utilities.
2.2.2.21 Viet Nam
The only information related to smart grid technology was on the Viet Nam Power Resource Partners Corporation website that provided a brief discussion of the smart grid concept (PRP 2010).
2.19
2.3 Related Information about Smart Grid Globally
The literature has many announcements and much other information on the activities of firms and economies in the smart grid sphere. Rather than try to capture information on individual projects, this discussion focuses on information provided by sources outside of APEC that provides major findings that may help contribute to broader smart grid issues. Given the amount of information available in the literature, this discussion does not make a pretense about being complete, but does hope to capture the essence of findings and thoughts that pertain to the smart grid subject.
A recent study was completed based on a survey that included seven APEC economies (Australia, Canada, China, Japan, Singapore, South Korea, and the United States) to better understand “… consumer opinions and preferences toward electricity management programs” (Accenture 2010b). Key findings are that bill increases, utility (remote) control of electricity consumption, and data privacy are major issues, with social pressure being the greatest motivator to participate in an energy-management program (Accenture 2010a, b). The full report (Accenture 2010a) provides responses by economy to the many individual questions and issues.
A study by the World Economic Forum and Accenture concludes that implementation of smart grid requires regulatory reform to allow utilities to earn returns on energy efficiency, and movement by stakeholders toward an understanding of the societal returns and away from purely financial returns (WEF 2009). While this report targets developed economies with an aging infrastructures, the above conclusions, challenges, and solutions presented have broad application. A list of factors also serves as the starting point for developing a roadmap:
• Market structure regarding the level of regulation and utility integration
• Federalization regarding central vs. local decision making
• National ambition regarding domestic use or export of a technology
• Leadership regarding vision and willingness to make decisions
• Political alignment of policy makers
• Consumer willingness to adopt change
• Set specific goals that are attainable.
A report for The World Bank (CRA 2005) examined the implementation of dynamic pricing in six member economies, three of which are APEC members (China, Thailand, and Viet Nam). Four major lessons were learned to improve the effectiveness of time varying prices:
• Rate structure is important to incentivize behavior by utilities and consumers, by reducing the utility’s supply-side costs more than customer-bill reductions.
• Minimize the duration of the peak period that the time varying prices are applied to maximize customer acceptance.
• Limit the time to periods in which the peak to off-peak ratio is highest.
• Monitor the effectiveness of rates and modify as necessary to maintain customer participation and cost-effectiveness.
2.20
“USA is the leader in consumer technology, …. the Europeans are ahead in integrating renewable energy into the grid, and …. the Chinese are doing impressive things with infrastructure.” Source: Logica 2010
An international survey of utilities by Microsoft (Microsoft 2010) indicates that 8% of utilities have completely adopted smart grid technology, nearly 40% are in the process of adopting smart grid technology, and over 50% have not yet started the adoption process. The greatest barrier is financial, followed by technical and organizational. The most important applications (in order of importance) are distribution systems, smart metering, consumer energy management, and integration of renewable resources, the least important is connection of EVs. The major challenge that companies faced for deploying smart grid technology were led by financial, followed by technical and organizational. Nearly 40% responded that business operations would have to be restructured, over 30% were not sure, and approximately 30% said business operations would not be affected. With respect to integration of renewable resources and time-of-use pricing, approximately 40% expressed a near term (less than 3 years) need to do so, declining to approximately 5% in 10 years.
The European Union (EU) smart grid vision is for a Research, Development and Demonstration (RD&D) program for Europe’s electricity supply networks to be flexible, accessible, reliable, and economic. Elements of the vision to help form the strategy are for a toolbox of proven technical solutions, harmonize regulatory and commercial frameworks in Europe, establish shared technical standards and protocols, develop information, computing and telecommunication systems, and interface new and old designs of grid equipment to ensure interoperability. Implementation of smart grid technology will require the involvement of all stakeholders to include governments, regulators, consumers, generators, traders, power exchanges, transmission companies, distribution companies, power equipment manufactures and information and communication technologies providers, with coordination at the regional, national and European levels. A research agenda has been developed with five research areas and 19 tasks to accomplish the vision (EU 2007).
A survey of 13 Australian electricity generation, transmission, and distribution utilities was conducted to assess the strategies, priorities, and challenges for smart grid adoption in Australia (Logica 2010). All see the benefits of smart grid (increased reliability, automation, demand response, and reduced distribution loss), but are unsure about the best implementation scheme given the number of options and unknowns. Major concerns identified by the utilities are improving customer engagement, developing a business case for investments, managing large amounts of data, and developing consensus standards to implement a common solution. While the survey is centered on Australia, it provides information common to a broader audience.
A report by the Major Economies Forum includes, but does not focus specifically on APEC. Much of the discussion applies, as it provides barriers, best practice policies, and opportunities for the development and deployment of smart grid technologies (MEF 2009). The report calls for individual and collective to support technology innovations, accelerate deployment through industry standards, capacity building, and regulation, and information sharing. Information is provided on the types of smart grid activities by the participating MEF economies, including the APEC economies.
3.1
3.0 Smart Grid Technologies: Status and Application
A number of technologies and concepts are linked under the banner of smart grid. These technologies can provide greater advantages when used synergistically with other smart grid-enabling technologies. This section discusses integration of renewable resources, PEVs, system operation efficiencies, energy-efficiency and carbon-reduction verification, and financial mechanisms as they relate to smart grid technologies. The aim is to provide an introduction to each technology or topic as it relates to smart grid versus traditional approaches. Examples from APEC economies are mentioned along with a discussion of potential benefits and implications with respect to smart grid implementation.
3.1 Integration of Renewable Resources
Renewable-energy resources vary widely in type and scalability. They include biomass, waste, geothermal, hydro, solar, and wind. Renewable-energy resources can be used for standalone or islanded (system isolated) power generation, but their benefits are greatly enhanced when they are integrated into broader electric power grids. With greater use of smart grid technologies, higher degrees and rates of penetration can be accommodated. Each resource is different from the grid’s perspective and some are easier to integrate than others.
Renewable generation has the benefit of enhancing sustainability (reducing environmental impacts), reducing greenhouse gas (GHG) emissions, reducing dependence on local or imported fossil fuels, and increasing energy security through diversification of energy sources. Variable generation, provided by many renewable-energy sources, can be a challenge to electric system operations, but when used in conjunction with smart grid approaches, responsive distributed generation also can be a benefit to system operations if coordinated to relieve stress in the system (e.g., line overloads, etc.). Smart grid approaches can reduce barriers and facilitate integration of renewable resources.
3.1.1 Understanding Integration of Renewable Resources with Smart Grid
Key characteristics of renewable resources that impact their integration into power grids are their size (generation capacity as compared to other sources of power generation on a system), their location (both geographically and with respect to network topology), and their variability (minute-by-minute, daily, seasonally, and intermittently). Renewable-energy sources can range from very small-scale to quite large-scale facilities and, in many cases, can be designed or controlled as aggregate sources. For resources such as hydro and wind, siting tends to be geographically constrained and may often be distant from load centers, while other resources, such as small-scale solar and biomass generation, is less site-specific. In many cases, renewable resources are connected to power grids at the distribution level where there is less active management, although larger resources, such as wind farms tend to be connected at the transmission level. Geothermal, biomass, and hydro-power generation are considered base-load power plants in that they can operate continuously at maximum capacity;whereas, resources such as solar and wind power generation are dependent on environmental factors, making them more variable.
Wind and solar energy are both intermittent resources meaning the availability of the resource varies without control. Wind behavior changes daily and seasonally, and sunlight is only available during daylight hours. Both wind and solar energy can be viewed as aggregate resources from the point of view
3.2
of a power grid, with levels that vary within a 10 minute to 1 hour time frame, so they do not represent the same form of intermittency as an unplanned interruption in a large base-load generator.
3.1.1.1 Renewable Resources as Smart Grid Assets
Smart grid technology can control renewable resources to effect changes in the grid’s operating conditions and can provide additional benefits as distributed generation assets or when installed at the transmission level.
Small, electricity-generating systems located at or near the place where the energy is used and connected at the distribution level is referred to as distributed generation. Residential-scale wind and solar energy projects are examples of distributed generation. Distributed generation assets can support weak grids, adding grid voltage and improving power quality. Having generation close to load can reduce transmission losses and infrastructure costs and can support the operation of local islands of electricity to reduce impacts of widescale black-outs.
Older and newer renewable resources exist with differing degrees of controllability. Renewable resources with sophisticated control systems can interact with power grid control systems and participate in fulfilling functions such as ancillary services, which can be further enhanced by systems that enable aggregation of resources. For example, in certain situations, distributed generation can be used in conjunction with capacitor banks for management of power flows or to manage active and reactive power. The use of power electronics for integrating photovoltaic and wind generation provides additional flexibility to provide combinations of real and reactive power to support voltage objectives. When aggregated by smart grid technology over an area, distributed renewable resources can contribute to other transmission-level ancillary services, such as spinning reserves.
3.1.1.2 Smart Grid Connections to Renewable Resources
Smart grid technologies and concepts can significantly reduce barriers to the integration of renewable resources and allow power grids to support a greater percentage of variable renewable resources. Renewable resources may be viewed as less firm (reliable and predictable) than traditional plants and more complex to manage (because of their small size, large number, and need for more advanced markets and controls). Enabling smart grid technology, such as distributed storage, demand response, advanced sensing, control software, information infrastructure, and market signals, increases the ability to influence and balance supply and demand. With smart grid technology, grid operators can better coordinate and control the system in response to grid conditions, thus allowing integration of increasingly greater levels of renewable resources more effectively and at lower cost.
The integration challenges of renewable resources depend on the geographic, economic, and regulatory environment. In Denmark, for example, wind power alone supplies over 20% of total electricity demand (EWEA 2005). In APEC economies, current degrees of penetration of renewable-energy resources vary from 0.4% to 65% of total electricity consumption (Renewables 2010). As the penetration level increases, more advanced control of the power system is required to maintain system reliability (Potter 2009). In some cases, barriers to integration of renewable resources are primarily technical and in some cases the barriers are primarily legal and regulatory. In either case, smart grid technologies can reduce barriers and increase benefits of integration.
3.3
AMI and other communication mechanisms (e.g., Internet-based services) engage demand response and distributed storage to accommodate higher penetration and cost-effective integration of renewable-energy generation. Smart grid technologies that support the integration of renewable resources at the distribution level include AMI, distributed storage, demand response, and distribution automation. Advanced and automated integration systems, such as inverters and converters with communications software interfaces, enable distributed management and application integration for renewable generation. Other technologies such as advanced circuit breaker protection systems support bi-directional flow in distribution systems supporting distributed generation.
Standards, such as those for interconnection and the overall development of a smart grid, are essential to removing barriers to integration. Consistent standards and regulations allow for more rapid, less costly, more reliable, and more controllable integration of renewable resources. As one example, the development and use of the Institute of Electrical and Electronics Engineers Standard1547, “Standard for Interconnecting Distributed Resources with Electric Power Systems,” has created uniformity in the interconnection process across the United States and enabled an increase in stable interconnections of distributed renewable-energy resources.
In contrast, there is a lack of standards on how to define storage in the United States, preventing it from being consistently compensated. In January 2010, FERC approved transmission rate incentives for a battery storage project in California (FERC 2010). This decision marks the first time that FERC has declared that batteries can be considered transmission facilities (Gish 2010). In other rulings, FERC has approved rules for energy-storage devices defined as generators. This new ruling further muddies the debate of whether energy storage in the United States should be treated as generation, transmission, or a combination. Without clear guidelines and policies, this segmentation of energy-storage compensation methods may continue on a case-by-case basis, which is time-consuming and confusing for energy-storage providers.
Without smart grid capabilities, load balancing at the transmission level can be achieved primarily using thermal and hydro-electric plants. With increasing degrees of smart grid implementation, balancing can take advantage of demand response, automated interconnections, and energy storage. Advanced sensors and transmission automation allow the system to run closer to the “edge” and more flexibly respond to power variations. As renewable-energy integration increases, more advanced control of the power system will be required to maintain system reliability. This control is dependent on having information about the resources. A smart grid relies on information to “make” smart decisions. Intermittent renewable-energy resources, such as wind and solar, cannot be operated in a conventional manner because their “fuel” supplies are variable, but the fuel availability can be predicted (Potter 2009) and this forecast information can be used to manage renewable-energy integration.
3.1.1.3 Potential Benefits of Smart Integration of Renewable Resources
Renewable resource facilities range in size from smaller, distributed energy resources to larger, transmission interconnected facilities. Smart grid technologies can help integrate both small and large facilities. Large facilities can help manage peak load capacity and provide grid balance. Small facilities can alter the distribution network’s characteristics by changing it from a passive, radial infrastructure, in which power traditionally flows toward the end users, to a bi-directional network, in which the flow direction is not pre-determined and is time-dependent (MEF 2009). Distribution-level facilities can provide energy security to limit the extent of a system disturbance and allow for faster recovery.
3.4
Distributed generation can also reduce the need for investments in grid reinforcement infrastructure, particularly if installed in conjunction with active distribution system management that provides controls and operational metrics.
Smart grid technologies, such as transmission and distribution automation and active distributed energy resources, allow a diverse and changing mix of renewable-energy resources to be accommodated on the grid. When an intermittent resource cannot produce energy for a long period of time, replacement energy is needed. Replacement energy typically comes from large-scale power plants that can ramp up or down to follow the load and provide grid balance. These “regulating” power plants can generate energy from both conventional fossil fuels, such as natural gas or coal, or renewable resources, such as biomass and hydro-electric.
If a renewable resource can provide replacement energy instead of fossil fuel power plants, the potential for carbon reduction is substantial. Pacific Northwest National Laboratory (PNNL 2010) estimated the indirect impacts of reduced needed reserve capacity to support a wind energy penetration rate of 25% in the United States to be a 5% reduction in US electricity consumption and a 5% reduction in associated CO2 emissions. The potential indirect reductions are based on the assumption that the capital cost savings from avoiding new construction of fossil fuel power plants is reinvested in cost-effective energy efficiency or renewable generation facilities.
In conjunction with more widespread smart grid technologies and forecasting, supply from renewable resources can be viewed more reliably and used as an integral contributor to system capacity.
3.1.2 Examples of Integration of Renewable Resources
Various APEC economies are addressing the issues of renewable-energy integration. A few examples are provided here.
3.1.2.1 Asia Solar Energy Initiative Example
In May 2010, the Asian Development Bank (ADB) announced its Asia Solar Energy Initiative (ASEI) to generate 3,000 MW of solar power over the coming three years in Asia and the Pacific region (ADB 2010). The initiative is encouraging the development of the associated transmission and distribution systems with smart meters and storage batteries to support the integration of large-scale solar PV and concentrated solar thermal projects, urban solar PV, and off-grid solar PV and battery projects.
Before the ASEI was started, the region had less than 500 MW of installed solar capacity. The capacity is expected to reach 1,000 MW by the end of 2011 before the final goal of 3,000 MW is achieved in May 2013, three years from the launch of the initiative (Eco-Business 2010).
3.1.2.2 United States Wind Integration Example
The Columbia River Gorge in the US Pacific Northwest has a strong wind resource and, thus, many wind energy facilities. The area also has many hydroelectric dams. Normally the two resources are a good pairing and can balance each other, but this balancing act can become impossible when there is a surge in wind combined with a significant amount of water available (i.e., after a spring melt).
3.5
The Bonneville Power Administration (BPA), a federal agency that oversees power transmission in the Pacific Northwest, has partnered with Iberdrola Renewables and Constellation Energy Control and Dispatch on a balancing pilot program (Wald 2010). These partners will provide BPA with a diverse and large pool of generation with which to balance its wind energy, rather than BPA having to rely solely on hydropower for balancing. Constellation will provide the controls on the generators so they can receive information from a central control room to enable generation to be increased or decreased as needed (Wald 2010).
Using smart grid enabling assets, this project is expected to increase hydro-system flexibility (NAW 2010), delay the need for additional transmission lines, and allow for more wind energy to be added to the grid.
3.1.2.3 Singapore and Indonesia Island Examples
Singapore is in the process of implementing a smart micro-grid with clean and renewable-energy technologies on the 10 km2 island of Pulau Ubin, which is located northeast of Singapore (EMA 2010a). The island is “off-grid” and the new micro-grid infrastructure will replace the diesel generators currently being used on the island. Proposal submissions from companies for their technologies to be included in the project are currently be solicited and reviewed. This project provides an opportunity for Singapore to build a new smart grid from the ground up, rather than having to modify an existing grid system. Indonesia is similarly considering a smart micro-grid pilot project on the Bali island of Nusa Penida. The island currently generates electricity from diesel, wind, and solar sources. Wind power represents about 14% of the generation supply, but its intermittency has caused grid instability. The Directorate General of New, Renewable Energy and Energy Conservation (DGNREEC) would like to implement smart micro-grid technologies on the island to mitigate this problem.
3.1.2.4 Korea Test Bed Example
Korea launched a national smart grid program to help it become a low carbon economy and a society capable of recovering from climate change. The first phase of the project has been to build a Smart Grid Test Bed on Jeju Island. The overall program and Test Bed have five implementation areas: 1) smart power grid, 2) smart consumers, 3) smart transportation, 4) smart renewables, and 5) smart electricity service (KSGI 2010a). The Test Bed project is being used to evaluate and verify some smart grid technologies developed in Korea. Once the performance of these technologies are verified, Korea hopes to use them to develop international standards and for export.
The goal of the smart renewables sector of the project is to build smart renewable-energy generation across the nation using micro-grids to enable houses, buildings, and villages to be energy self-sufficient with the desire that 30% of households are energy self-sufficient by 2030 (KSGI 2010a).
Korea has also modeled the expected effects to be realized in 2030 from its smart grid program. It expects the economy’s greenhouse gas emissions will be reduced by 230 million tons, the building of new power plants will be prevented, and there will be a decrease in energy imports (KSGI 2010b). In addition to direct energy and environmental benefits, Korea also expects its smart grid to create 50,000 jobs annually and improve its export market (KSGI 2010b).
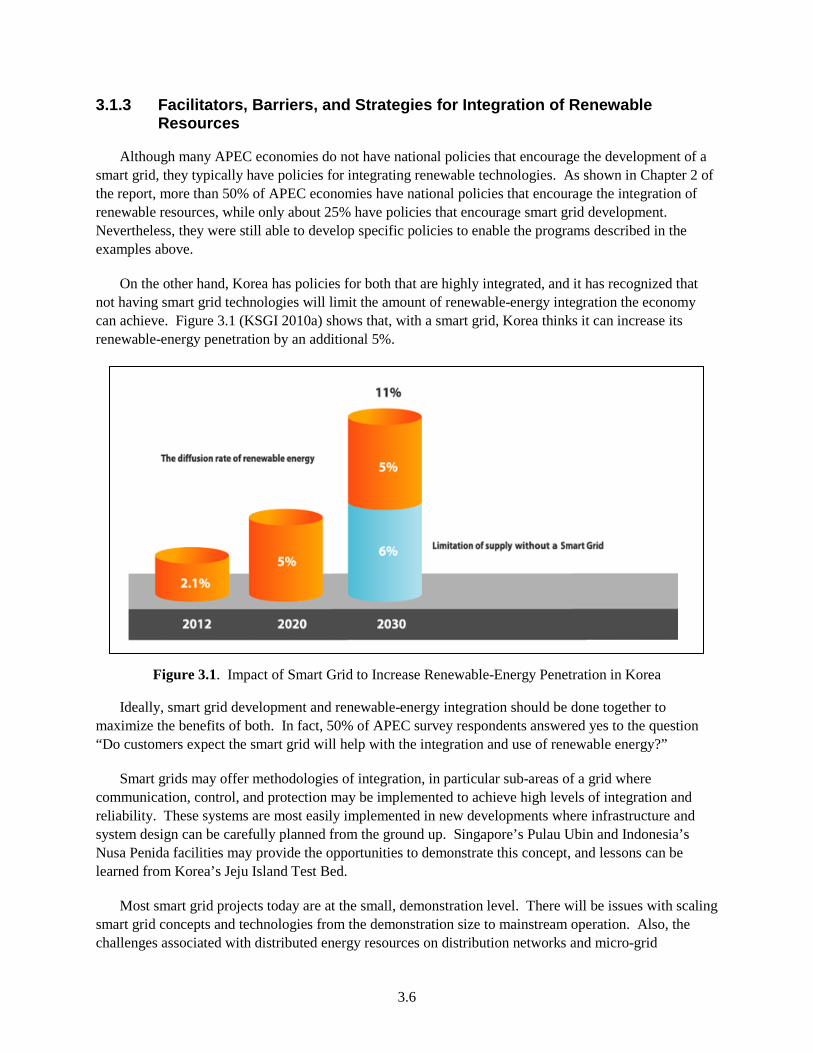
3.6
3.1.3 Facilitators, Barriers, and Strategies for Integration of Renewable Resources
Although many APEC economies do not have national policies that encourage the development of a smart grid, they typically have policies for integrating renewable technologies. As shown in Chapter 2 of the report, more than 50% of APEC economies have national policies that encourage the integration of renewable resources, while only about 25% have policies that encourage smart grid development. Nevertheless, they were still able to develop specific policies to enable the programs described in the examples above.
On the other hand, Korea has policies for both that are highly integrated, and it has recognized that not having smart grid technologies will limit the amount of renewable-energy integration the economy can achieve. Figure 3.1 (KSGI 2010a) shows that, with a smart grid, Korea thinks it can increase its renewable-energy penetration by an additional 5%.
Figure 3.1. Impact of Smart Grid to Increase Renewable-Energy Penetration in Korea
Ideally, smart grid development and renewable-energy integration should be done together to maximize the benefits of both. In fact, 50% of APEC survey respondents answered yes to the question “Do customers expect the smart grid will help with the integration and use of renewable energy?”
Smart grids may offer methodologies of integration, in particular sub-areas of a grid where communication, control, and protection may be implemented to achieve high levels of integration and reliability. These systems are most easily implemented in new developments where infrastructure and system design can be carefully planned from the ground up. Singapore’s Pulau Ubin and Indonesia’s Nusa Penida facilities may provide the opportunities to demonstrate this concept, and lessons can be learned from Korea’s Jeju Island Test Bed.
Most smart grid projects today are at the small, demonstration level. There will be issues with scaling smart grid concepts and technologies from the demonstration size to mainstream operation. Also, the challenges associated with distributed energy resources on distribution networks and micro-grid
3.7
demonstrations are different than those of large-scale renewable integration. Singapore’s Pulau Ubin Island has just 100 people, while mainland Singapore has 5 million people. As smart grid deployments grow, technology failure rates must conform to maintenance levels supported by business plans. Communications and information management and control need to be designed on architectures proven to scale. While the system operations impacts from the integration of large numbers of distributed renewable resources or variable renewable resources can be estimated and accounted for in plans, actual operating experiences will differ. The flexibility provided by smart grid capabilities is expected to mitigate these issues and can help in the evolution of each economy’s electric grid.
3.1.3.1 Identifying Resources
The smart grid vision for India’s Power Sector: A White Paper (USAID 2010) offers recommendations and case studies applicable to many APEC economies. It shares the idea that a smart grid should really be clusters of micro-grids that interact with the larger, traditional grid and these micro-grids should use small-scale, renewable-energy sources. The report Major Economies Forum’s Technical Action Plan: Smart Grid (MEF 2009) offers case studies on how different economies around the world are handling the integration of renewable generation with their smart grid programs. The first Clean Energy Ministerial (CEM), which was held in Washington, D.C., in July 2010, built upon and expanded the MEF smart grid activities when it established the International Smart Grid Action Network (ISGAN) with the goal of accelerating the development and deployment of smart electricity grids around the world (ISGAN 2010). A principal goal of ISGAN is to focus high-level government attention on the smart grid suite of technologies capable of cost effectively reducing GHG emissions while responding to changing electricity generation and demand. ISGAN will sponsor activities that accelerate smart grid deployment along five key areas of engagement:
1. Smart grid policy, regulation and finance
2. Standards policy
3. Research, development, and demonstration of pre-competitive technologies
4. Workforce skills and knowledge
5. Engagement of smart grid users and consumers at all levels.
Within these areas of engagement, four interrelated projects have been identified that will capture, assess, and synthesize the growing smart grid knowledge base and develop related core methodologies:
1. Establishment of an inventory of smart grid enabling programs and policies
2. Creation of in-depth case studies using a common framework
3. Development of benefit-cost methodologies and policy toolkit to help decision makers assess smart investments
4. Regular synthesis of insights from ISGAN and related projects for high-level policy makers, such as CEM Ministers.
ISGAN is currently in the process of being structured as an IEA Implementing Agreement and as such will be open to all APEC Economies to join.
3.8
3.1.3.2 Recognizing Opportunities and Implications
Capacity to absorb renewable resources and constraints to integration may in some cases be determined more by economic and regulatory rules, rather than technical and practical constraints. Treating integration of renewable resources in isolation, rather than as an integrated part of the power grid, can increase barriers and result in losing potential benefit from both the renewable resources and from associated the smart grid infrastructure.
Different factors in APEC economies will impact strategies toward integration of renewables. Most of these factors, which are described below, are directly related to smart grid approaches.
• Power system characteristics: mix, penetration of renewables, variability of load, variability and intermittency of power generators
• Stability and reliability of supply, flexibility and robustness
• Transmission and distribution infrastructures and plans for extensions and modifications
• Connection requirements and standards
• System operations and aggregation capabilities
• Market, institutional and legal characteristics of the power sector.
A smart grid needs technologies, standards, and policies to be successful. A step-by-step or phased approach is recommended to develop all the pieces and many of these pieces are already available. For example, interconnection and interoperability standards exist or are being developed in multiple APEC economies and can be used as templates by those economies without them. Standards provide alignment, and when standards are followed and processes are consistent, costs can be reduced (GWAC 2009a). (GWAC 2009b), (GWAC 2009c).
Each member economy needs to decide how to recognize the value of environmental concerns and electricity reliability. Both items have significant public good aspects and are sensitive to the integration of renewable resources. Providing incentives financially or through regulation can be difficult. Smart grid capabilities can help enact policy, by supporting markets that reflect the value of environmental impact or providing monitoring capability to assure that reliability and environmental regulations are enforced. Smart grid technology deployment needs to be consistent with the renewable resource policy decisions. Similarly, policy decisions need to recognize smart grid investments that need to be supported to successfully achieve desired outcomes.
APEC economies without policies for either smart grid development or the integration of renewables have the opportunity to develop overarching policies that will increase the rate of and decrease the cost of renewables integration. A number of strategies can be employed to move toward more-effective, less-costly integration and reduce barriers:
• An integrated approach for smart grid development and renewable resource integration is needed.
• Metrics are needed to quantify potential savings.
• Dynamic system studies on renewable resources and interactions with power system control.
• Dynamic modeling and forecasting associated with renewable resources.
3.9
• Infrastructure upgrades (enabling more than just renewable resources), including grid extensions, grid reinforcements, backup capacity, controllable load, and demand response.
• Develop and enable market and trade mechanisms for variable-output power and other characteristics of renewable resources. If policies permit, implement priority dispatch for power from renewables.
• Plans to mitigate increase in balancing cost as renewable penetration increases through use of smart grid assets (storage, demand response, smart interconnections, etc.)
• Cost of grid extension and grid reinforcement associated with renewable resources needs to be considered within the context of the system as a whole and using smart grid technologies, as part of a broader strategy to build a smart grid infrastructure which will enable multiple benefits.
• Use smart grid communication and control technologies to enable aggregation of renewable resources.
• Use smart grid technologies to adapt power grid control processes and times, so that forecasting resources and time-frames relevant to renewable assets can be used.
• Use smart grid to enable balancing and settlement procedures that do not discriminate against variable output energy resources or smaller-scale, distributed renewable resources.
3.2 Plug-In Electric Vehicle Integration
This section of the report examines PEVs, including EVs and PHEVs, in terms of market adoption, influence on energy and environmental goals, and how they are enabled through enhanced smart grid integration. EVs are powered exclusively by electric drivetrains. A PHEV is a hybrid EV with batteries that can be recharged when plugged into an electric outlet and an internal combustion engine (ICE) that can be activated when batteries require recharging.
3.2.1 Understanding Integration of PEV with Smart Grid
Smart grid capabilities support PEV deployment through real-time pricing structures, bi-directional energy flows, bi-directional metering, and vehicle-to-grid applications. Real-time pricing encourages customers to recharge vehicles during off-peak hours at reduced cost. Bi-directional metering enables customers to purchase energy at off-peak hours and sell stored energy back to the electricity service provider during peak periods at higher rates. Smart charging enables vehicles to optimize charging hours to minimize impacts on the grid. These elements encourage greater market adoption by enhancing the customer’s return on investment and minimize the need to invest in infrastructure to meet the demands placed on the electrical grid.
In the absence of smart grid technologies, PEV deployment will only serve to increase the overall load and strain placed on the grid. With smart grid technologies, PEVs could represent a grid resource for distributed storage and demand response. Such resources can benefit the integration of other environmentally sustainable technologies, particularly variable renewable generation, such as wind and solar.
3.10
3.2.1.1 Market Adoption of PEVs
Market adoption of PEVs in APEC over the next 50 years will depend on the ability of each member economy’s electrical grid to accommodate the additional strain placed upon it by large-scale penetration of PEVs. Other factors that will influence adoption include motor fuel prices, advancements in battery technologies, and the ability of automotive manufacturers to present consumers with cost-effective, attractive alternatives to traditional ICE vehicles. Though rates of market penetration are currently low, with the USDOE’s Energy Information Administration (EIA) estimating there are currently 24,265 PEVs on-road in the US representing 0.01% of the light duty vehicle fleet (USDOE 2010c), several recent forecasts prepared by research institutes and industry suggest PEV adoption could grow significantly over the next 10 to 30 years.
In the US, market forecasts of PHEV adoption have generally converged at around 30% to 40% by 2040. With the exception of a recent study conducted by the University of California at Berkeley (Becker and Sidhu 2009), ultimate EV penetration rates are forecast at below 10% of light-duty vehicle sales (PNNL 2008, BCG 2009, Becker 2009, EPRI- NRDC 2007, Green Car Congress 2011, Lin 2010, Sullivan 2009, USDOE 2010d).
In addition to the US market penetration forecasts presented, recent market assessments have been completed in several other APEC economies, including Japan, China, and New Zealand. The Boston Consulting Group (BCG) recently assessed the market for EVs, PHEVs, and other alternative fuel vehicles in four markets for 2020—the US, China, Japan, and Western Europe. The study uses BCG’s propulsion-market model to explore three deployment scenarios differentiated based on assumptions governing oil prices, tax incentives, and government regulation of CO2 emissions. Based on the scenarios defined for the study, PEV sales were forecast in 2020 at 5% for US, Japan, and China under the steady pace scenario. Under the acceleration scenario for which higher oil prices and tax incentives align to drive demand for PEVs, market penetration reaches 10% in North America by 2020, 21% in China, and 22% in Japan (BCG 2009).
The more aggressive BCG forecast (acceleration scenario) could be accurate in China, where the government has established a 15% market penetration goal for PEVs by 2020. Another recent forecast of PHEV adoption in Japan estimated that given certain aggressive assumptions governing the price markup of PHEVs relative to traditional internal combustion engine technology, PHEV adoption could fully penetrate Japan by 2050. Under this scenario, PHEV would be the technology that displaces the conventional gasoline-fueled car (Karplus 2009). In New Zealand, PHEV adoption was forecast using the New Zealand Ministry of Transport’s Vehicle Fleet Emissions Model, which estimated fleet penetration levels of 11.8% in 2030 and 35% in 2040 (Hemery and Smith 2008).
As demonstrated through these market forecasts, PEV market penetration is underway and expected to reach significant levels in the next 20 to 30 years in many APEC economies. The rapid penetration of PEVs represents challenges for integration and grid operation. It also represents an opportunity for implementing smart grid technologies and using PEVs as an enabling asset in a smart grid system.
3.2.1.2 Energy, Price, and Environmental Impacts of PEVs
There are a number of studies that have estimated the energy system, electricity price, or environmental impacts of PEVs in APEC economies. These impacts drive both the need for PEV
3.11
technologies as well as the associated issues with integrating them into the existing grid. Studies reviewed for this report included:
• EPRI and the National Resource Defense Council (NRDC), in a report published recently, used three distinct models to estimate the impact of PHEVs on GHG emissions under nine scenarios. Under the various scenarios, estimated annual GHG emissions were reduced by 163 to 612 metric tons, with results differentiated based on market penetration rates and electric sector CO2 intensity (EPRI-NRDC 2007).
• A report recently published by the Oak Ridge National Laboratory (ORNL) examines the impacts of PHEV market penetration over a future time period (2020 and 2030) for the 13 NERC regions in the US. ORNL found that electricity prices were sensitive to market penetration, with price impacts differentiated significantly by region. For the western NERC region, prices increased by only 1.2% to 2.7% but grew significantly in other regions. This finding stands in contrast to those presented in (Scott 2007), which found that large-scale market penetration of load-leveling, off-peak PHEV charging could reduce utility system average costs of power.
• Hori (2008) evaluated the effects of introducing PHEVs in Japan on CO2 emissions. Hori concluded that emissions reductions for PHEVs relative to ICE vehicles would be 58%.
• Karplus (2009) used the Massachusetts Institute of Technology’s (MIT’s) Emissions Prediction and Policy Analysis (EPPA) model to examine the effects of PHEVs on electricity output, refined oil consumption, CO2 emissions, and carbon prices in Japan and the US. The findings of this study suggest that for both the US and Japan, refined oil consumption would drop by 30% with the PHEV adoption scenarios outlined in the report. Further, US CO2 emissions would decrease by 10% while Japanese carbon emissions would drop by 19% relative to the no PHEV scenario.
• Huo (2010) examined the environmental implications of EVs in China and found that results were highly dependent on the CO2 intensity of the electricity generation plants supplying the power to the EVs. Electricity power plants in China are largely coal-powered, with coal accounting for between 65% and 98% of total power generated within the six interprovincial power grids in 2008. Thus, high adoption rates of EVs were found to increase SO2 emissions by factors ranging from 3 to 10 and double NOx emissions compared to current ICE vehicles. With that noted, the benefits of PEVs would still be realized at least partially through the transference of airborne pollutants away from highly congested cities to rural areas where most power plants are located.
• Simpson (2009) examined the environmental impact of a fleet of one million EVs on Australia. The study examined scenarios of adoption with and without smart grid integration. The study found that without vehicle-to-grid ancillary services, one million EVs would reduce national GHG emissions by 0.9 million tons of CO2 equivalent (Mt CO2-e) using the current generation mix in Australia and 3.8 Mt CO2-e when recharged with power stations using 100% green energy sources. When vehicle-to-grid ancillary services are linked to a smart grid to enable greater penetration of renewable-energy sources, the reduction in GHG emissions grew to 41 Mt CO2-e or 8% of total national emissions.
The findings of these studies indicate that the price and environmental impacts of PEV adoption vary significantly between economies and even within an economy from region to region based on a number of characteristics—generation mix, load capacity factors, market penetration, the presence of incentive programs, charging requirements, presence of smart grid assets. In the US, studies on the impacts of PEV adoption on electricity prices are mixed. With respect to the impact of PEV adoption on emissions, however, each study reviewed for this report agrees that CO2 emissions decline because of the shift away
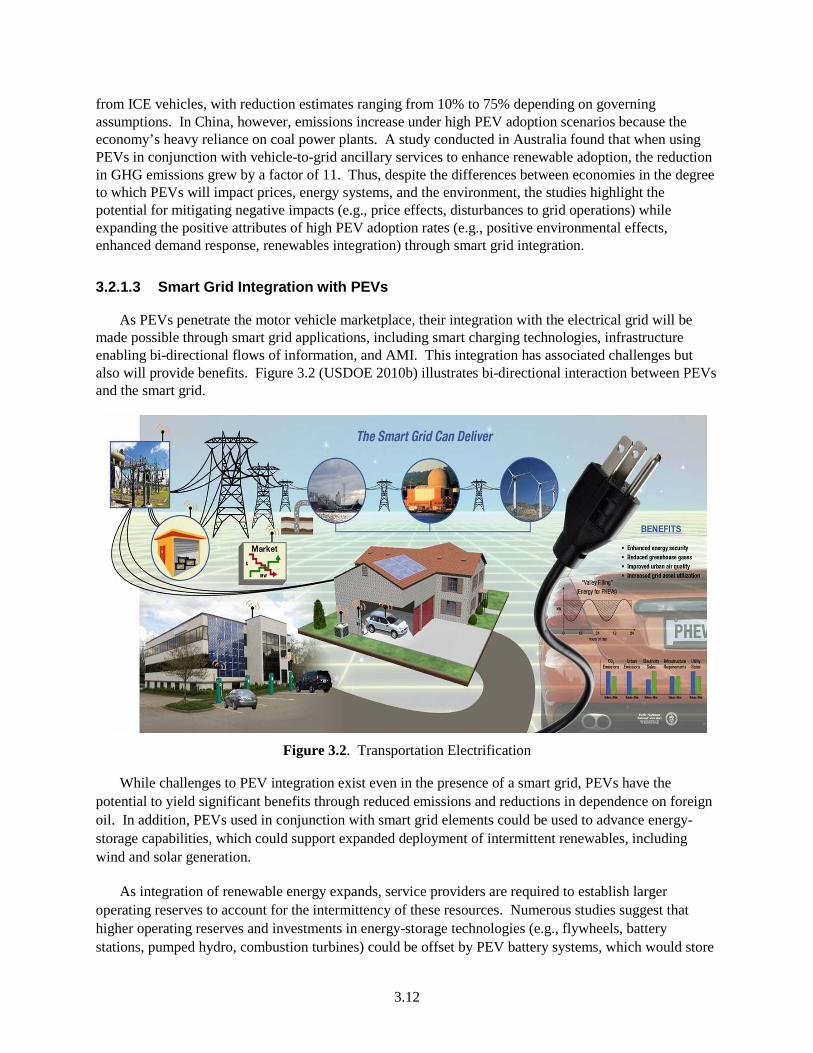
3.12
from ICE vehicles, with reduction estimates ranging from 10% to 75% depending on governing assumptions. In China, however, emissions increase under high PEV adoption scenarios because the economy’s heavy reliance on coal power plants. A study conducted in Australia found that when using PEVs in conjunction with vehicle-to-grid ancillary services to enhance renewable adoption, the reduction in GHG emissions grew by a factor of 11. Thus, despite the differences between economies in the degree to which PEVs will impact prices, energy systems, and the environment, the studies highlight the potential for mitigating negative impacts (e.g., price effects, disturbances to grid operations) while expanding the positive attributes of high PEV adoption rates (e.g., positive environmental effects, enhanced demand response, renewables integration) through smart grid integration.
3.2.1.3 Smart Grid Integration with PEVs
As PEVs penetrate the motor vehicle marketplace, their integration with the electrical grid will be made possible through smart grid applications, including smart charging technologies, infrastructure enabling bi-directional flows of information, and AMI. This integration has associated challenges but also will provide benefits. Figure 3.2 (USDOE 2010b) illustrates bi-directional interaction between PEVs and the smart grid.
Figure 3.2. Transportation Electrification
While challenges to PEV integration exist even in the presence of a smart grid, PEVs have the potential to yield significant benefits through reduced emissions and reductions in dependence on foreign oil. In addition, PEVs used in conjunction with smart grid elements could be used to advance energy-storage capabilities, which could support expanded deployment of intermittent renewables, including wind and solar generation.
As integration of renewable energy expands, service providers are required to establish larger operating reserves to account for the intermittency of these resources. Numerous studies suggest that higher operating reserves and investments in energy-storage technologies (e.g., flywheels, battery stations, pumped hydro, combustion turbines) could be offset by PEV battery systems, which would store
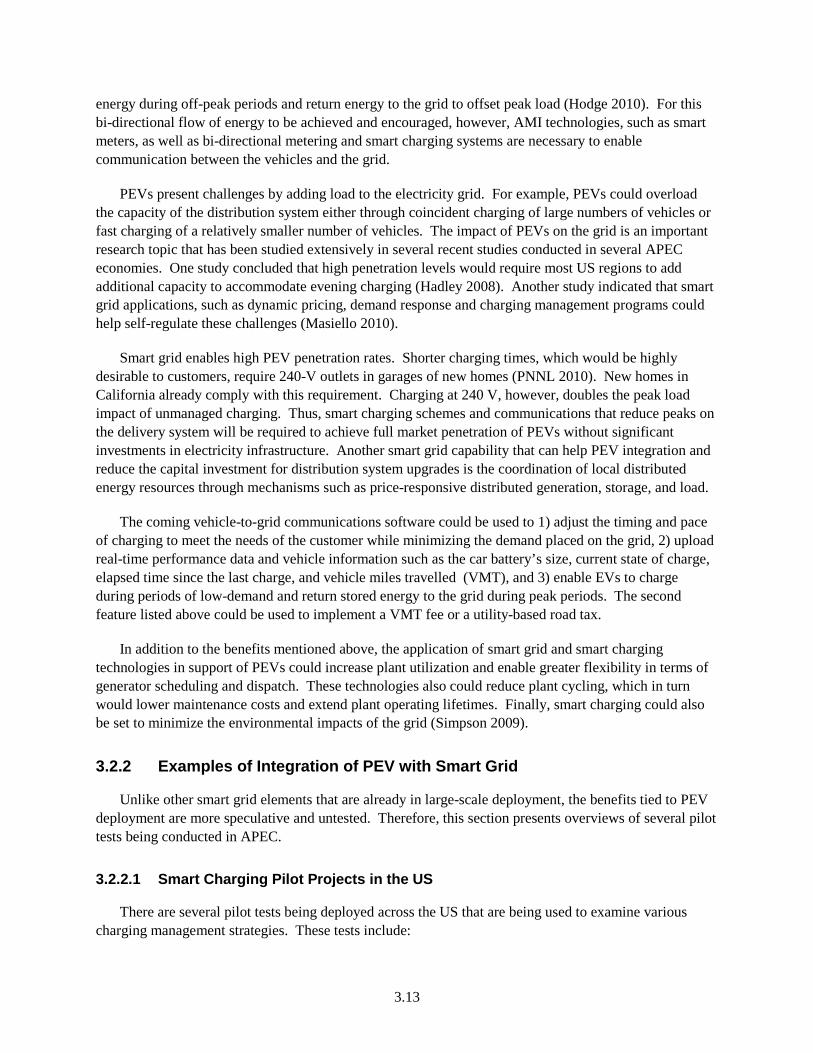
3.13
energy during off-peak periods and return energy to the grid to offset peak load (Hodge 2010). For this bi-directional flow of energy to be achieved and encouraged, however, AMI technologies, such as smart meters, as well as bi-directional metering and smart charging systems are necessary to enable communication between the vehicles and the grid.
PEVs present challenges by adding load to the electricity grid. For example, PEVs could overload the capacity of the distribution system either through coincident charging of large numbers of vehicles or fast charging of a relatively smaller number of vehicles. The impact of PEVs on the grid is an important research topic that has been studied extensively in several recent studies conducted in several APEC economies. One study concluded that high penetration levels would require most US regions to add additional capacity to accommodate evening charging (Hadley 2008). Another study indicated that smart grid applications, such as dynamic pricing, demand response and charging management programs could help self-regulate these challenges (Masiello 2010).
Smart grid enables high PEV penetration rates. Shorter charging times, which would be highly desirable to customers, require 240-V outlets in garages of new homes (PNNL 2010). New homes in California already comply with this requirement. Charging at 240 V, however, doubles the peak load impact of unmanaged charging. Thus, smart charging schemes and communications that reduce peaks on the delivery system will be required to achieve full market penetration of PEVs without significant investments in electricity infrastructure. Another smart grid capability that can help PEV integration and reduce the capital investment for distribution system upgrades is the coordination of local distributed energy resources through mechanisms such as price-responsive distributed generation, storage, and load.
The coming vehicle-to-grid communications software could be used to 1) adjust the timing and pace of charging to meet the needs of the customer while minimizing the demand placed on the grid, 2) upload real-time performance data and vehicle information such as the car battery’s size, current state of charge, elapsed time since the last charge, and vehicle miles travelled (VMT), and 3) enable EVs to charge during periods of low-demand and return stored energy to the grid during peak periods. The second feature listed above could be used to implement a VMT fee or a utility-based road tax.
In addition to the benefits mentioned above, the application of smart grid and smart charging technologies in support of PEVs could increase plant utilization and enable greater flexibility in terms of generator scheduling and dispatch. These technologies also could reduce plant cycling, which in turn would lower maintenance costs and extend plant operating lifetimes. Finally, smart charging could also be set to minimize the environmental impacts of the grid (Simpson 2009).
3.2.2 Examples of Integration of PEV with Smart Grid
Unlike other smart grid elements that are already in large-scale deployment, the benefits tied to PEV deployment are more speculative and untested. Therefore, this section presents overviews of several pilot tests being conducted in APEC.
3.2.2.1 Smart Charging Pilot Projects in the US
There are several pilot tests being deployed across the US that are being used to examine various charging management strategies. These tests include:
3.14
• The Idaho National Laboratory is leading a field test of 57 PHEVs with real-time data captured from vehicles in Washington, Oregon, California, and Hawaii.
• Seattle City Light is operating a field test on 13 Toyota Priuse vehicles s to investigate the impact of a PHEV fleet deployed in an urban environment.
• Duke Energy, Progress Energy, and Advanced Energy are leading a field test involving the smart charging of 12 Toyota Priuse vehicles to examine the requirements of supporting vehicles as they roam between service areas (Sustainable Business 2008).
These pilot projects are designed to collect performance data required to improve the design of PEVs, vehicle-to-grid charging strategies and technologies.
3.2.2.2 University of Western Australia’s Renewable Energy Vehicle Project
The University of Western Australia is testing 10 vehicles that have been converted to EVs. The project will involve a two-year trial of vehicles from 10 of the largest government and industry fleets in the region. To date, the City of Perth, City of Swan, Department of Environment and Conservation, Department of Transport, Main Roads Western Australia, Royal Automobile Club (RAC), Telstra, Water Cop, and the West Australian have agreed to participate in the test. The trial will be supported by 10 fast-recharge bays posted around Perth.
Data will be collected from wireless connections to charging stations and vehicles via black box recorders. The project is designed to serve as a small-scale demonstration with application to larger charging networks and vehicle-to-grid capabilities. Based on the data collected through the pilot test, the research team will evaluate PEV charging behavior and examine the implications of PEV adoption on grid capacity requirements.
3.2.2.3 The New Energy and Industrial Technology Development Organization EV-based Smart Grid System (Japan)
Mitsubishi Corporation (MC), Mitsubishi Motors Corporation (MMC), and Mitsubishi Electric Corporation (MELCO) have partnered with the New Energy and Industrial Technology Development Organization (NEDO) to establish an EV-based smart grid system comprised of PV systems, EVs, and recycled lithium-ion batteries, at MMC’s EV factory in Okazaki, Japan.
As part of this project, the batteries in EVs driven by factory workers to and from work at the factory will be recharged using PV and grid systems. An energy-management system will be developed for the factory and used to optimize energy consumption and conserve plant energy.
The project will also focus on the development of a charging management system, which will minimize the charging burden on the vehicles, as well as to employ the energy-management system to use vehicle batteries as a supplemental source of energy for the factory. The research conducted by MC, MMC, MELCO, and NEDO will be used to assess and address the barriers to wide-scale adoption of PEVs and the deployment of renewable-energy sources.
3.15
3.2.2.4 Jeju Smart Grid Test-bed (Korea)
In August of 2009, the Korean government and a consortium of energy groups that includes the Korea Smart Grid Institute (KSGI), Korea Electric Power Corporation (KEPCO), and the Korea Smart Grid Association broke ground, on Jeju Island, South Korea, for what is planned to be the largest smart grid community in the world. Once constructed and fully operational, the Jeju Smart Grid Test-Bed will include a network of interconnected smart grid resources, including wind farms, intelligent transmission and distribution infrastructure, smart meters, smart buildings, and EV charging infrastructure, see Figure 3.3 (KSGI 2011). This project is designed to test the world’s most advanced smart grid technologies and develop business models for advancing their application. The ₩64.5-billion (Won) ($57.5-million) test-bed is expected to be constructed and fully operational by 2013 (KSGI 2011).
Figure 3.3. Jeju Smart Grid Test-Bed
Smart transportation will be a key element of the Jeju test-bed, which will include EV charging stands and a charging station designed to enable motorists to replace discharged batteries. The smart transportation component of the test-bed will be run by three consortia comprised of 42 companies led by KEPCO, SK Energy, and GS Caltex. In addition to installing and operating the EV charging stations, the companies involved in the smart transportation practice area are designing fast- and slow-charging interfaces, plug-in and contactless EV chargers, dynamic pricing tariffs for EV charging, battery management systems, and the architecture for micro-grids dedicated to EV charging facilities (Bae 2010).
3.2.3 Facilitators, Barriers, and Strategies to PEV Integration
Based on the lessons learned through pilot tests and the findings of other PEV-related research currently being conducted, a number of barriers to PEV market adoption and integration have been identified in APEC economies. Technical barriers include those related to battery technologies, the automotive manufacturing process, supply-chain, refueling and range limitations, and electricity-infrastructure capacity. Barriers relevant to this report include the following:
3.16
• Battery technology limitations impact the charging and discharging aspects and the operational sensitivity to battery life. Smart charging capabilities that take into account these limitations and coordinate charging and discharging scenarios during peak loading on the grid or within a distribution feeder are critical to PEV integration.
• Supply chains will need to evolve in order to build suppliers of everything from power transistors to high-density circuit boards. The battery-recycling industry and processes need to be developed. Batteries will need to be designed to reliably enable the bi-directional flow of energy during both the charge and discharge modes.
• The limited ability to refuel while traveling and significant limitations in the range of all-EVs limit market penetration. While this challenge continues today, electric-vehicle charging stations are being installed across the US and by 2015, Pike Research estimates that nearly 1 million charging stations will be in place in the US with 4.7 million available worldwide (Pike Research 2010a). Approximately one-third of all light-duty vehicles park in the street with very limited or no access to a 120-V or 240-V power supply. Infrastructure, including smart charging, would need to be developed to provide access to recharging outlets for those customers who live in high-density apartment and condominium complexes.
• There are many smart grid components that would encourage PEV deployment (e.g., real-time pricing structures, AMI, distribution automation, etc.); however, these technologies and policies are not fully developed.
3.2.3.1 Resources for Advancing PEV Adoption
This section highlights resources committed by some APEC economies to advance PEV adoption, beginning with US efforts. In the United States, USDOE encourages EV development through investments outlined in the American Recovery and Reinvestment Act (ARRA) and USDOE’s Advanced Technology Vehicle Manufacturing (ATVM) Loan Program. Together, these programs are supporting the “… development, manufacturing, and deployment of the batteries, components, vehicles, and chargers necessary to put millions of EVs on America’s roads” (USDOE 2010d).
USDOE’s Advanced Research Projects Agency-Energy (ARPA-E) is providing an additional $80 million to transformative research and development (R&D) projects designed to advance battery- and electric-drive component technology beyond the current state of the art. The ATVM Loan Program to date has provided nearly $2.6 billion to Nissan, Tesla, and Fisker to establish EV manufacturing plants in Tennessee, California, and Delaware, respectively.
In the US, consumer incentives are either planned or provided in 21 states located primarily in the western and northeastern United States. For example, Arizona lowers licensing fees for EVs, and California offers rebates of up to $5,000 for EVs, $3,000 for PHEVs, and $1,500 for electric motorcycles. Oregon recently put $5,000 tax credits in place to offset conversion or purchase costs for PHEVs, and allows $1,500 tax credits for EVs. These incentives are in addition to federal tax credits of $2,500 to $7,500 for EVs and PHEVs depending on battery size.
There are several efforts underway in Australia to enhance the development and ultimate adoption of PEVs. The Australian government has established a new program of support for the nation’s automotive industry. The $6.2 billion New Car Plan for a Greener Future includes the $1.3 billion Green Car
3.17
Innovation Fund and the $3.4 billion Automotive Transformation Scheme. These grant programs are designed to support R&D and commercialization efforts tied to low emission vehicles. In Australia, the Automotive Industry Innovation Council (AIIC) was established to provide leadership in transforming the automotive industry by addressing challenges faced in the transportation sector (e.g., climate change, sustainability, industry competitiveness, regulatory reform, workplace capability, access to new technology) and communicating with the Australian Government regarding innovation policies and goals (Day and Davies 2010). Finally, the Australia Automotive 2020 Roadmap Project, which was commissioned by the AIIC was established to identify future strategic goals, priorities, and opportunities to enable development of technologies tied to vehicle electrification, lightweight materials, gaseous fuels, and intelligent communication systems. The roadmap, which was finalized and presented during August 2010, represents a program designed to understand the capabilities of the Australian automotive industry and point it towards opportunities that will align with emerging social, environmental, and technology trends (Auto CRC 2010).
In China, a group of 16 state-owned companies have formed a coalition to perform PEV R&D, develop standards for PEVs, and to place 500,000 alternative energy vehicles on the road in the next three years. The coalition of state-owned companies includes automakers Dongfeng, Chang’an and FAW Group. These companies plan to invest a combined $15 billion toward the development of PEVs. Also in China, consumers in five cities (Shanghai, Shenzhen, Hangzhou, Hefei, and Changchun) will have their EV purchases subsidized by the Chinese government. In those five urban areas, consumers will receive an $8,785 price reduction on EVs and $7,320 on PHEVs. These subsidies will be paid directly from the Chinese government to carmakers, which will reduce the price of PEVs.
3.2.3.2 Implications and Strategies for PEV Integration
As the implications of transitioning to PEVs come into focus, there are a number of issues that APEC economies will continue to address in the coming years. Here are highlights of some of the most salient issues relating to smart grid capabilities to enable PEV integration as well as strategies used to address barriers to deployment.
Smart grid components (e.g., real-time pricing structures, AMI, smart charging and discharging) would encourage PEV deployment. As 240-V outlets are increasingly used to accelerate battery charging times, smart charging systems and distribution automation capabilities (switching and voltage control) will be required to mitigate the impact of vehicle charging. Smart grid integration with PEVs also will enhance grid utilization and enable greater flexibility in terms of generator scheduling and dispatch. PEVs enabled through smart grid capabilities could also be used as energy-storage devices to manage the integration of intermittent renewables.
Some of the smart grid technologies that will enable PEV adoption are specific to the PEV (e.g., smart charging). Others are more general smart grid-enabling technologies (e.g., AMI). These technologies could serve both as enablers for PEVs and for demand response, dynamic pricing, and other smart grid-enabled functions. These multiple uses imply that consideration of cost and funding for PEVs should be made in conjunction with a broader analysis of smart grid impacts. Conversely, in cases where there is considerable drive or political will supporting PEV adoption and implementation, this can be used to motivate implementation and accelerate adoption of related smart grid-enabling technologies more broadly (e.g., AMI, substation automation, dynamic pricing), which will compound the benefits above and beyond those associated with PEVs alone.
3.18
In light of the benefits, barriers, and resources associated with PEV integration, a number of strategies and recommendations were identified in the literature, including:
• The US and several other APEC economies (e.g., Australia, China, South Korea, and Japan) continue to support research and studies, including pilot tests of vehicle components. Some of these pilot tests were reviewed in this section of the report.
• Several APEC economies are investing directly in the development of batteries, EVs, and advanced automotive technologies and components
• The US. Japan, and China have set goals for PEV penetration and have established roadmaps for achieving those goals. In the US, the USDOE has set goals for its investments in EV-battery, component, and manufacturing technologies, which are designed to achieve several milestones:
– Lower the cost of some EV batteries by 70% by 2015
– Enable US manufacturers to produce a sufficient number of batteries and components to support the annual production of 500,000 electric-drive vehicles by 2015
– Boost the production capacity of US manufacturers to 20% of the world’s advanced vehicle battery supply by 2012 and 40% by 2015.
• In the US, the State of California is requiring 240-V outlets in building codes. Building code strategies may be difficult to implement in some developing economies.
• Korea has established a smart grid roadmap that includes a long-term vision for smart transportation (in addition to the smart power grid, the smart consumer, smart renewable energy, and smart electricity service). The smart grid Roadmap identifies three phases for implementing goals related to smart transportation. In the first stage of development (2010 to 2012), EV charging infrastructure will be built and tested while EVs are deployed in pilot tests such as the Jeju Smart Grid Test-bed. The second stage of the roadmap (2012-2020) calls for nationwide deployment of EV charging facilities and effective EV maintenance and management. In the third, and final, stage of the roadmap (2021 to 2030), EV charging methods will be diversified, EV charging facilities will be made commonly available, and EVs will be used as portable energy-storage devices (KSGI 2010a).
• Programs to encourage PEV deployment through subsidies, rebates, and tax incentives have been established at the federal and state levels in the US, and in several APEC economies.
These and other strategies have been devised and implemented within APEC economies. While the impacts of these strategies have varied, the trend clearly outlined in the literature is the persistence on the part of APEC economies to continue the march toward the development of the PEV, which underscores the importance of deploying smart grid capabilities that support PEV to grid integration.
3.3 System Operations Efficiencies
When considered across the entire scope of the smart grid, there are many opportunities to realize operational efficiencies for the electric system. The opportunities fall into three main areas: 1) efficient use of capital investments, 2) efficient real-time operations, and 3) efficient maintenance and administration. All of these areas can contribute to reduce costs of operation or the ability to provide more value for the money.
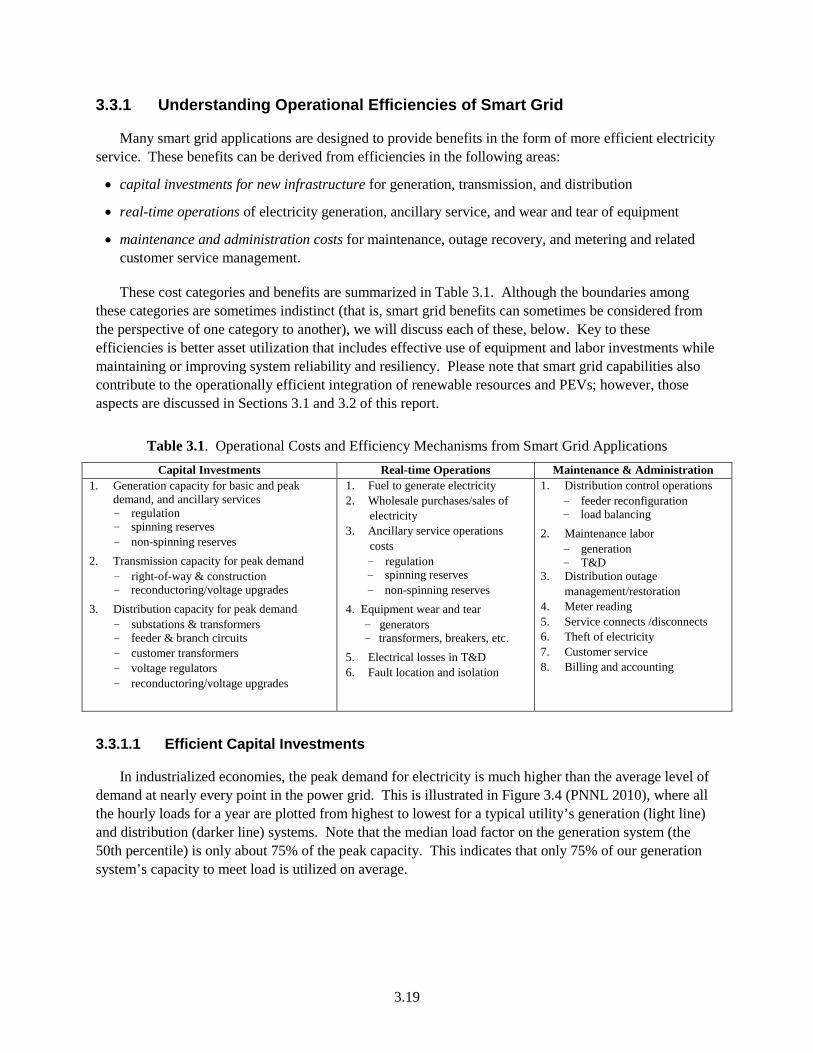
3.19
3.3.1 Understanding Operational Efficiencies of Smart Grid
Many smart grid applications are designed to provide benefits in the form of more efficient electricity service. These benefits can be derived from efficiencies in the following areas:
• capital investments for new infrastructure for generation, transmission, and distribution
• real-time operations of electricity generation, ancillary service, and wear and tear of equipment
• maintenance and administration costs for maintenance, outage recovery, and metering and related customer service management.
These cost categories and benefits are summarized in Table 3.1. Although the boundaries among these categories are sometimes indistinct (that is, smart grid benefits can sometimes be considered from the perspective of one category to another), we will discuss each of these, below. Key to these efficiencies is better asset utilization that includes effective use of equipment and labor investments while maintaining or improving system reliability and resiliency. Please note that smart grid capabilities also contribute to the operationally efficient integration of renewable resources and PEVs; however, those aspects are discussed in Sections 3.1 and 3.2 of this report.
Table 3.1. Operational Costs and Efficiency Mechanisms from Smart Grid Applications Capital Investments Real-time Operations Maintenance & Administration
1. Generation capacity for basic and peak demand, and ancillary services − regulation − spinning reserves − non-spinning reserves
2. Transmission capacity for peak demand − right-of-way & construction − reconductoring/voltage upgrades
3. Distribution capacity for peak demand − substations & transformers − feeder & branch circuits − customer transformers − voltage regulators − reconductoring/voltage upgrades
1. Fuel to generate electricity 2. Wholesale purchases/sales of
electricity 3. Ancillary service operations
costs − regulation − spinning reserves − non-spinning reserves
4. Equipment wear and tear − generators − transformers, breakers, etc.
5. Electrical losses in T&D 6. Fault location and isolation
1. Distribution control operations − feeder reconfiguration − load balancing
2. Maintenance labor − generation − T&D
3. Distribution outage management/restoration
4. Meter reading 5. Service connects /disconnects 6. Theft of electricity 7. Customer service 8. Billing and accounting
3.3.1.1 Efficient Capital Investments
In industrialized economies, the peak demand for electricity is much higher than the average level of demand at nearly every point in the power grid. This is illustrated in Figure 3.4 (PNNL 2010), where all the hourly loads for a year are plotted from highest to lowest for a typical utility’s generation (light line) and distribution (darker line) systems. Note that the median load factor on the generation system (the 50th percentile) is only about 75% of the peak capacity. This indicates that only 75% of our generation system’s capacity to meet load is utilized on average.
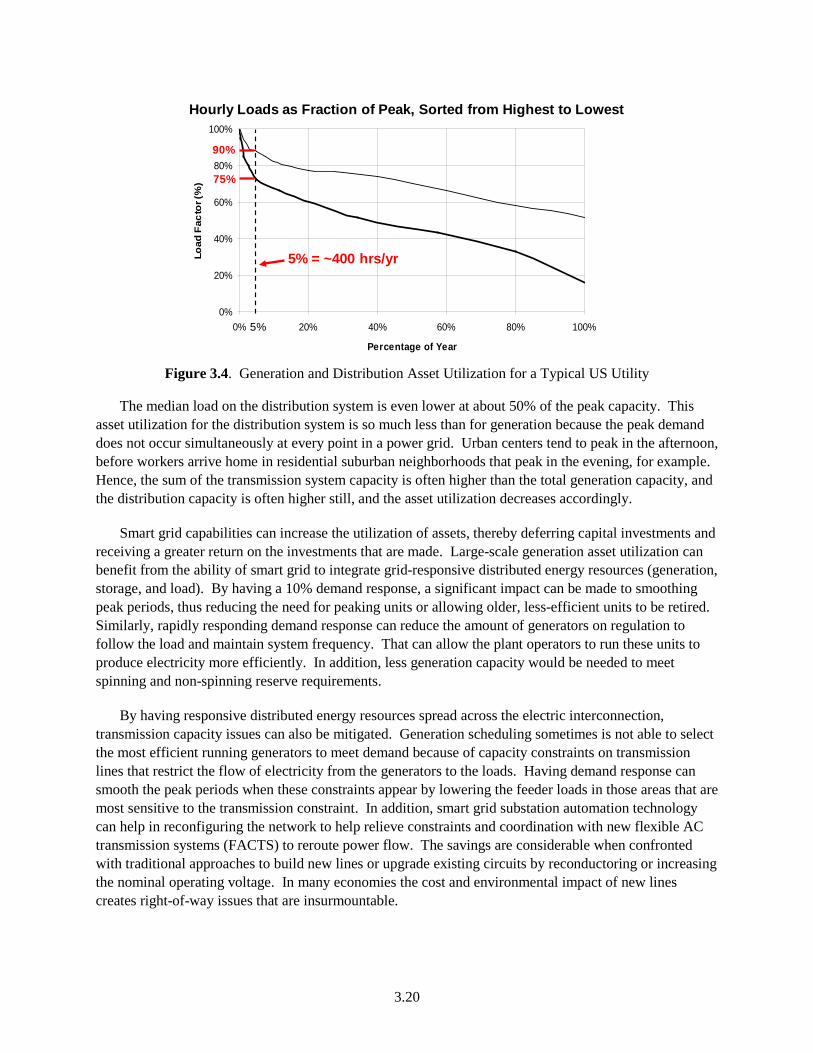
3.20
Figure 3.4. Generation and Distribution Asset Utilization for a Typical US Utility
The median load on the distribution system is even lower at about 50% of the peak capacity. This asset utilization for the distribution system is so much less than for generation because the peak demand does not occur simultaneously at every point in a power grid. Urban centers tend to peak in the afternoon, before workers arrive home in residential suburban neighborhoods that peak in the evening, for example. Hence, the sum of the transmission system capacity is often higher than the total generation capacity, and the distribution capacity is often higher still, and the asset utilization decreases accordingly.
Smart grid capabilities can increase the utilization of assets, thereby deferring capital investments and receiving a greater return on the investments that are made. Large-scale generation asset utilization can benefit from the ability of smart grid to integrate grid-responsive distributed energy resources (generation, storage, and load). By having a 10% demand response, a significant impact can be made to smoothing peak periods, thus reducing the need for peaking units or allowing older, less-efficient units to be retired. Similarly, rapidly responding demand response can reduce the amount of generators on regulation to follow the load and maintain system frequency. That can allow the plant operators to run these units to produce electricity more efficiently. In addition, less generation capacity would be needed to meet spinning and non-spinning reserve requirements.
By having responsive distributed energy resources spread across the electric interconnection, transmission capacity issues can also be mitigated. Generation scheduling sometimes is not able to select the most efficient running generators to meet demand because of capacity constraints on transmission lines that restrict the flow of electricity from the generators to the loads. Having demand response can smooth the peak periods when these constraints appear by lowering the feeder loads in those areas that are most sensitive to the transmission constraint. In addition, smart grid substation automation technology can help in reconfiguring the network to help relieve constraints and coordination with new flexible AC transmission systems (FACTS) to reroute power flow. The savings are considerable when confronted with traditional approaches to build new lines or upgrade existing circuits by reconductoring or increasing the nominal operating voltage. In many economies the cost and environmental impact of new lines creates right-of-way issues that are insurmountable.
0%
20%
40%
60%
80%
100%
0% 20% 40% 60% 80% 100%
Percentage of Year
Load
Fac
tor (
%)
5%
5% = ~400 hrs/yr
75%
90%
Hourly Loads as Fraction of Peak, Sorted from Highest to Lowest
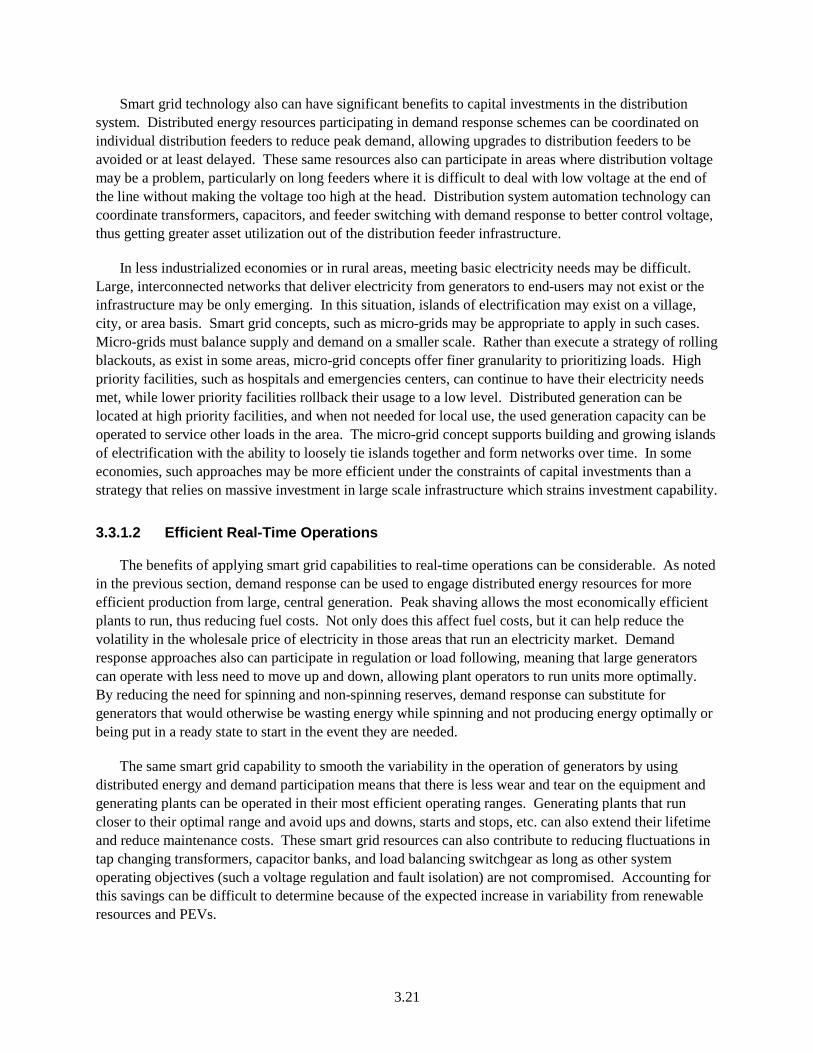
3.21
Smart grid technology also can have significant benefits to capital investments in the distribution system. Distributed energy resources participating in demand response schemes can be coordinated on individual distribution feeders to reduce peak demand, allowing upgrades to distribution feeders to be avoided or at least delayed. These same resources also can participate in areas where distribution voltage may be a problem, particularly on long feeders where it is difficult to deal with low voltage at the end of the line without making the voltage too high at the head. Distribution system automation technology can coordinate transformers, capacitors, and feeder switching with demand response to better control voltage, thus getting greater asset utilization out of the distribution feeder infrastructure.
In less industrialized economies or in rural areas, meeting basic electricity needs may be difficult. Large, interconnected networks that deliver electricity from generators to end-users may not exist or the infrastructure may be only emerging. In this situation, islands of electrification may exist on a village, city, or area basis. Smart grid concepts, such as micro-grids may be appropriate to apply in such cases. Micro-grids must balance supply and demand on a smaller scale. Rather than execute a strategy of rolling blackouts, as exist in some areas, micro-grid concepts offer finer granularity to prioritizing loads. High priority facilities, such as hospitals and emergencies centers, can continue to have their electricity needs met, while lower priority facilities rollback their usage to a low level. Distributed generation can be located at high priority facilities, and when not needed for local use, the used generation capacity can be operated to service other loads in the area. The micro-grid concept supports building and growing islands of electrification with the ability to loosely tie islands together and form networks over time. In some economies, such approaches may be more efficient under the constraints of capital investments than a strategy that relies on massive investment in large scale infrastructure which strains investment capability.
3.3.1.2 Efficient Real-Time Operations
The benefits of applying smart grid capabilities to real-time operations can be considerable. As noted in the previous section, demand response can be used to engage distributed energy resources for more efficient production from large, central generation. Peak shaving allows the most economically efficient plants to run, thus reducing fuel costs. Not only does this affect fuel costs, but it can help reduce the volatility in the wholesale price of electricity in those areas that run an electricity market. Demand response approaches also can participate in regulation or load following, meaning that large generators can operate with less need to move up and down, allowing plant operators to run units more optimally. By reducing the need for spinning and non-spinning reserves, demand response can substitute for generators that would otherwise be wasting energy while spinning and not producing energy optimally or being put in a ready state to start in the event they are needed.
The same smart grid capability to smooth the variability in the operation of generators by using distributed energy and demand participation means that there is less wear and tear on the equipment and generating plants can be operated in their most efficient operating ranges. Generating plants that run closer to their optimal range and avoid ups and downs, starts and stops, etc. can also extend their lifetime and reduce maintenance costs. These smart grid resources can also contribute to reducing fluctuations in tap changing transformers, capacitor banks, and load balancing switchgear as long as other system operating objectives (such a voltage regulation and fault isolation) are not compromised. Accounting for this savings can be difficult to determine because of the expected increase in variability from renewable resources and PEVs.
3.22
Real-time operations can also be made more efficient by better controlling resistive losses in the transmission and distribution delivery system. Automation equipment and responsive distributed energy resources can contribute to better achieving nominal voltage levels, thereby reducing losses from low voltages and potential stalling of induction motor equipment, such as HVAC units.
Smart grid monitoring technology is anticipated to provide much more visibility, particularly in the distribution portions of the system. Greater use of smart relays at these lower voltage levels will locate and isolate faults more rapidly. Using digital relays instead of mechanical relays also allows for active protection systems, improving the operation of relays to avoid false trips, enabling intelligent load shedding, and adaptive reclosing. In addition, coordination among relays and distribution automation equipment promises to reduce the size of the area affected by a fault and support quicker restoration.
In addition to being able to mitigate the extent of a system disturbance in a distribution system, monitoring and distribution automation can help integrate distributed generation and support micro-grid implementations. In less developed economies, micro-grid deployment can bring real-time operational efficiencies by generating during times of high price or system stress, and they can separate the micro-grid into islanded operation should the main electric system become stressed or unstable. By having the generation closer to the load, system electricity losses also are reduced. The ability to run connected or islanded provides flexibility in situations where meeting the basic demand for electricity may be a challenge.
While the previous discussion emphasizes real-time operation efficiencies in the distribution system, smart grid technologies also provide real-time monitoring and control capabilities that enable transmission system operators to anticipate, detect, and correct problems; optimize dispatching of generators, manage system voltages; and switch lines and equipment. The combination of advanced devices (such as phasor measurement units), data assembly, computation, visualization, and decision-making tools enable many functions surrounding monitoring and control such as improved state-estimation, real-time congestion management, post-disturbance analysis, benchmarking and system model validation, and system restoration and protection mechanisms. In addition, wide area monitoring systems coupled with adaptive control equipment can detect and mitigate situations when the power system is under stress. These capabilities can improve the reliability and resilient operation of a networked system as well as enhance operational efficiency.
3.3.1.3 Efficient Maintenance and Administration
Beyond real-time operations, many activities are performed by service providers over longer scheduled periods. These activities include adjustments to configuration settings, maintenance of equipment, response to outages, and interactions with the customers and their end-use systems. Smart grid technology can contribute to efficiencies in this area as well.
Over the course of seasons and years, distribution systems need to be adjusted in response to load growth, construction, and other demographic changes. Distribution automation and enhanced monitoring in the distribution system can contribute to more timely and less labor intensive adjustments to feeder reconfiguration. Information can be more readily gathered to understand load balancing issues on feeders and change the configuration of the feeders in response. Less frequent field visits should be necessary, thus saving labor and truck movements.

3.23
By stressing the equipment less in the real-time operations (see previous section) less maintenance and associated labor should be required. In addition, monitoring of the equipment and system behavior can reveal improper operation of generators, transformers, and other infrastructure. Diagnostic capabilities that will allow more targeted scheduled maintenance are emerging in many areas.. Rather than picking a periodic maintenance time that is too frequent or too long, crews can be dispatched when telltale signs are discovered by diagnostic monitoring. Given the fact that the highest frequency of failures occurs after installation or maintenance, accuracy regarding when maintenance needs to occur can result in significant savings.
In dealings more directly related to the customer, smart grid technology offers many areas for greater service provider efficiency. Having isolated faults in tighter areas and having information from meters as to who is with and without power, means that fewer customers are affected and work crews can more quickly and accurately understand the cause of the outage so service can be restored more quickly. With AMI systems, meter reading and customer connects and disconnects are now done remotely. Bills no longer need to be estimated and can be handled with more accuracy, and theft of electricity by improper connections can be discovered more quickly and with less effort. The ability to take this field information and use for analysis and input into customer billing and accounting systems allows for more efficient administration.
One thing to plan and monitor carefully is the care and maintenance of the smart grid technology itself. The value proposition relies upon the fact that the cost of the smart grid-related equipment and its maintenance will be more than covered by the benefits in efficiency and functionality. Nevertheless, an arguably additional benefit is that the installation and maintenance workforce required for smart grid equipment will require a workforce trained in a higher level of technology, thereby improving the quality of the workforce in general.
3.3.2 Examples of Operations Efficiencies with or without Smart Grid
A number of smart grid-related efforts are underway across APEC for integrating a diverse set of generation resources and achieving better asset utilization from demand response, distributed generation, and energy storage.
3.3.2.1 United States Example
Capital investment efficiencies are appearing due to an increase in demand response programs. In the US, a recent study sponsored by EPRI and the Edison Electric Institute (EEI) estimated that 37% of the growth in electricity sales (419 TWh) between 2008 and 2030 could be offset through energy-efficiency programs, and 52% of peak demand growth (164 GW of capacity) could be offset by a combination of energy-efficiency and demand-response programs. More specifically, approximately 2,824 MW of peak demand was forecasted to be offset by 2010 through price-responsive policies; 13,661 MW of peak demand could be offset through price response by 2020, and 24,869 MW could be offset by 2030 (Rohmund 2008).
A recent report from FERC based on a 2010 survey estimates the potential demand response from all US demand response programs to be 58 gigawatts (GW), or nearly 7.6% of US peak demand (FERC 2011). This represents a growth of about 40% from the level reported in a similar 2008 FERC survey.
3.24
The report also explains developments to remove barriers to demand response including state policy changes to address negative financial effects to regulated utility companies, revisions in wholesale market rules for demand participation, and industry efforts to better assess the cost-effectiveness of demand response.
This same report shows a strong trend for installing smart meters, see Figure 3.5 (FERC 2011). These meters help support the increase in demand response programs and also provide efficiency benefits for meter reading, service connection, and more accurate and timely billing. A recent study conducted by The Brattle Group for the Edison Foundation’s Institute for Electric Efficiency (IEE 2011) looked at prototypical electric utilities in different regions of the US and forecasted benefit-cost ratios over a 20-year period ranging from 1.4 to 1.9 when considering multiple-benefit streams, including support for remote metering, outage avoidance, remote connection, consumer access to consumption information, demand response, and EV integration.
With the help of an economic stimulus program initiated by the federal government, Smart Grid Investment Grant projects are spending over $2 billion in advanced meter deployments. These are expected to increase the penetration levels significant in the next two years (USDOE 2010b).
Figure 3.5. Advanced Metering Penetration Nationwide in Recent FERC Surveys
3.3.2.2 Korea Example
The Republic of Korea has made an early start in using information technology to increase reliability and efficiency in the transmission and distribution grid. By applying advanced technology around real-time load monitoring systems, distribution automation systems, and energy-management systems, in 2008 KEPCO (Korea Electric Power Corporation) was able to decrease its transmission and distribution loss to 4.01%, decrease its SAIDI (System Average Interruption Duration Index) to 16 minutes, and increase its load factor to 76.6%. Under the Power IT Program, KEPCO has continued to make efforts to apply information technology in the electricity industry since 2005. Its mission is the development, integration, and application of technologies to facilitate the transformation of the electric infrastructure to cost-effective, secure, high-quality, reliable electricity services to consumers. The program is a cooperative effort between the government, KEPCO, academies, R&D institutions, and industries. Recently, Korea has extended the Power IT Program to smart grids and is currently re-defining its roadmap to implement smart grids economy-wide (KEPCO 2008).
3.25
Korea’s Smart Grid Roadmap 2030 (KSGI 2010a) includes a smart electricity service component that aims to give consumers a choice of electricity rates (including real-time rates) and allow the sale of distributed renewable energy. This is expected to promote demand-side engagement of capacity issues including power derivatives such as spinning reserve. The Power IT projects are being conducted now to provide experience for future deployments and export markets. Efficiencies in capital investments and real-time operations are also included in the roadmap, including the deployment of grid monitoring technology and transmission and distribution automation equipment to predict, detect, and address failures more effectively, as well as support the integration of distributed energy resources.
The demonstration and trials being conducted in the Jeju Island project mentioned in previous sections also are expected to contribute important information about system operational efficiencies.
3.3.2.3 People's Republic of China Example
The SGCC is interested in applying smart grid technologies for more efficient capital investments and real-time operations in the bulk generation and transmission areas. The location of energy resources and growing economic areas are unevenly distributed. This necessitates the strengthening of the transmission network with intelligent control and the flexibility to accommodate a variety of generation resources, particularly variable renewable resources. SGCC has created a three-phase smart grid development plan. An initial phase laid the groundwork in pilot projects and technical standards, including a demonstration project at the Shanghai World Expo. In phase 2 (2011 to 2015), SGCC is investing $283 billion in the transmission network including $46 billion in smart grid-related management systems and smart meters. The final 5-year phase will focus on the interconnection of generation into this system. Transmission upgrades are budgeted at $241 billion of which $46 billion are dedicated to smart grid technology (SGCC 2009).
3.3.2.4 Singapore Example
Singapore’s Energy Market Authority has a smart grid initiative under the Intelligent Energy System (IES) pilot project with goals to enhance reliability and operational efficiencies (EMA 2010b). The IES pilot is to be implemented in two phases. Phase 1 (2010 to 2012) will focus on implementing key infrastructure components such as AMI, while Phase 2 (2012 to 2013) will focus on smart grid applications. A TOU tariff structure and demand side management are aspects of their plan to enable retail choice in products and services, enable the integration of distributed energy resources (including renewable generation and electric vehicles), and deploy a new outage management system to more efficiently address failures of supply. Singapore is piloting smart meters together with programs for demand response, distributed generation management, and outage management. Residential, commercial and industrial end-users will be targeted to participate in the initiative.
3.3.2.5 Australia Example
The Smart Grid R&D Roadmap (SGA 2010), from the Smart Grid Australia industry alliance, points out the importance of contributions to system operational efficiency from smart grid capabilities. The roadmap notes important issues faced by Australia’s situation including long distance energy supply issues along with the ability to more effectively manage electricity in the urban centers. This roadmap discusses the need to maximize the efficiency of a long distance transmission system using smart grid technologies for more effective control, grid security, and stability, as well as efficiencies from fault
3.26
detection and prediction, demand management, and the self-healing aspects for outage management that are needed in the urban areas of the system.
3.3.2.6 Insights from Examples: Barriers and Facilitators
A weakness in the transmission grid or a power system where generation is geographically far from the load centers focuses attention on smart grid initiatives that have to do with transmission automation and monitoring and control of the transmission network, as seen in China and Australia. In these situations, engaging distributed energy resources, including demand response, may not get the visibility it deserves for contributing to operational efficiency. However, the roadmaps put in place for these two member economies also include attention to end-use aspects to engage buildings, distributed generation, and storage to enhance asset utilization and address the delivery and reliability of electricity more efficiently.
The need for higher system operational efficiencies in established industrial economies drives available generation capacity to tighter margins, and can become a driver for interest in smart grid capabilities in the demand response area as seen in the U.S. example.
A universal motivator for smart grids is greater operational efficiency for carbon reduction and the flexibility needed to integrate variable renewable generation. There is also a common focus on smart meters for maintenance and administration efficiencies and as an enabler of other smart grid functions (such as demand response) across APEC. In reviewing the activity in APEC, smart meter deployment is one of the initial steps in the smart grid roadmaps for most member economies.
3.3.3 Strategies for Smart Grid Operations Efficiencies
Though system operation efficiencies are of interest to all APEC members, each economy faces different situations that affect their approach to smart grid deployment. Looking at capital investments efficiencies, established industrialized economies emphasize getting the most out of installed resources. New efficiencies are incremental and involve retiring old, less-efficient technology and engaging new resources, such as distributed generation and demand response, in more efficiently addressing reserve margins, and one day, contributing to frequency regulation. Similarly, making the most out of the existing transmission and distribution infrastructure to accommodate growth and the integration of renewable generation also leads to benefits from smart grid functions in the areas of substation automation and demand response.
In rapidly growing economies, capital investments in new construction projects tend to take a large share of the investments because incremental changes cannot keep up with the growth. Centralized approaches to policy making can have significant influence over the ability of an economy to institute comprehensive programs. In the rapid growth situation, smart grid technology in the transmission and distribution automation area may be emphasized more strongly compared with established economies, as it can be more cost effectively deployed in new construction, as compared with retrofitting existing systems. Right-of-way issues for new construction also may not be as significant an issue when much of population is waiting for electrification or demanding significantly more energy.
In regions of member economies with little or no electrification and slim financial resources, incremental investments may be the only affordable option. Micro-grid concepts can be applied at a
3.27
village level to balance limited generation resources or variable resources, such a solar and wind, with storage technology and basic, but smart, control technology to balance supply and demand in a prioritized manner. Incremental steps such as this also can lend themselves to the development of a weakly-connected transmission network that may interconnect multiple micro-grids so that they can share energy during some portions of the day, but then should the overall system become unstable, each micro-grid can disconnect and service its own territory in the best way possible. In this way, such economic regions can gain from smart grid micro-grid enhanced real-time operations efficiencies.
Smart grid real-time operations capabilities for diagnostics and smoother, anticipatory operation to reduce wear and tear on equipment can be important contributions to a smart grid roadmap for established industrial economies; however, in rural and less reliable regions, emphasis may be given to monitoring to detect electricity theft or fault detection and isolation as more efficient ways to improve service to customers, and to improving power system reliability in general.
Similarly, some member economies may be more amenable to implementing smart grid technology that enables energy markets at the wholesale and retail levels to optimize electricity allocation in real-time as well as send longer-term financial signals for investments in generation, storage, and end-use efficiency. By incorporating environmental factors, such as valuing water and carbon reduction, these market-based approaches may drive operation efficiency to align with social policies. Other member economies may be comfortable with a more centralized approach with hierarchical steps to control electricity with smart grid technology. An attractive aspect to market-based approaches is the distributed nature of the control paradigm and its ability to scale to very large numbers and adapt to changing conditions.
Operational efficiencies in billing and accounting systems linked with remote meter reading from smart meters may be more easily justified in member economies where labor rates are high and where the financial system is already highly digitally integrated with business processes including links to the customer. Nevertheless, in situations where an economy is growing rapidly, and significant level of digital business integration is not far off, the incremental cost between installing an advanced metering system instead of a traditional integral power meter, may be cost effective, particularly if the traditional meter may need to be replaced within 5 or 10 years. As with all decisions with smart meters, the risk is selecting the right requirements that fit a longer term plan. Specifying capabilities that are never used drives up the cost of equipment that can have a multiplier in the millions. Similarly, by not planning for future needs, equipment replacement costs can be a great burden and create situations of lost opportunity.
3.4 Efficiency and Carbon Reduction Verification
For all APEC economies, electricity generation is currently highly dependent on fossil fuels, which is responsible for a relatively large percentage of GHG emissions (APERC 2009). Using smart grid approaches can potentially lead to significant reductions in GHG from the power sector, through both increased energy efficiency and increased penetration of non-carbon-based, renewable-energy resources.
Energy efficiency and carbon reduction are achieved through a combination of smart grid mechanisms. Optimization of operations efficiency leads to less wasted energy (as described in Section 3.3). Better and increased integration of renewable resources can reduce the need for more power plants that use fossil fuels and can contribute to distribution efficiencies, thus increasing choices and optimizing
3.28
Verifying expected reductions in energy and load (from generation, transmission, distribution, to consumption) increases certainty and reduces operational, financial, and regulatory risk.
resources (as described in Section 3.1). Enabling increased penetration of PEVs can result in direct reductions of carbon emissions if the electric power associated with charging the PEV fleet is less carbon-intensive than traditional vehicle emissions (as described in Section 3.2). In addition to these mechanisms, which are primarily linked to electricity generation, storage, transmission, and distribution, smart grid also can significantly enable end-use energy efficiency through mechanisms such as demand response, dynamic pricing, and a multitude of energy-efficiency programs.
3.4.1 Measurement and Verification with Smart Grid
One of the key advantages provided by a smart grid is that in enables a wide variety of metrics that are difficult, if not impossible, to gather within a more traditional power grid. Having access to vast amounts and types of data covering every facet of the smart grid enables verification, diagnostics, forecasting, and many other functions which are achieved much more slowly and through rudimentary mechanisms without smart grid.
The combination of a variety of telecommunication channels, advanced software, and widespread measurement and verification enables a multitude of benefits. Directly linked to grid operations, verification and diagnostics improve overall operations efficiency and reliability over both short time frames in minute-to-minute grid operations and over longer, planning time frames. Linked to overarching policy objectives of energy-efficiency programs and carbon reduction, verification and diagnostics are essential to managing and implementing such programs. Coupling efficiency programs and carbon reduction strategies with smart grid enabling technologies allows for accountability, evaluation, reduction of risk, valuation of demand response, and quantification of results obtained from energy-efficiency programs.
The ability to verify reductions in energy consumption (KWh) and load (KW) obtained by energy-efficiency programs to reduce energy and load enables providers to monitor and verify reductions and sustained performance. This is important to ensure that the reductions meet expectations over the life of the measure(s), so that demand reduction can be viewed and paid for as a reliable and consistent resource, like other primary assets in a smart grid system.
Additionally, the ability to verify reductions in energy and load enable evaluation of energy-efficiency program methods and mechanisms. This encourages the employment of the most effective methods for a given target market. The cost and compensation of energy-efficiency actions can be based on the actual load reductions, rather than on assumed or calculated load reductions. The persistence of a measure (the ability to deliver the expected reductions and the life of the measure) also impacts its cost and compensation, as a shorter life or performance implies a higher initial cost.
3.4.1.1 Smart Grid Technologies for Energy Efficiency
Smart grid verification assets consist of the sensors, communications system, and computer hardware and software to monitor, communicate, and analyze the consumption of a resource and compare this with the expected performance of the resource. In a smart grid, measurement and verification assets may be present throughout the grid, at the transmission level, for example, with networks of phasor measurement
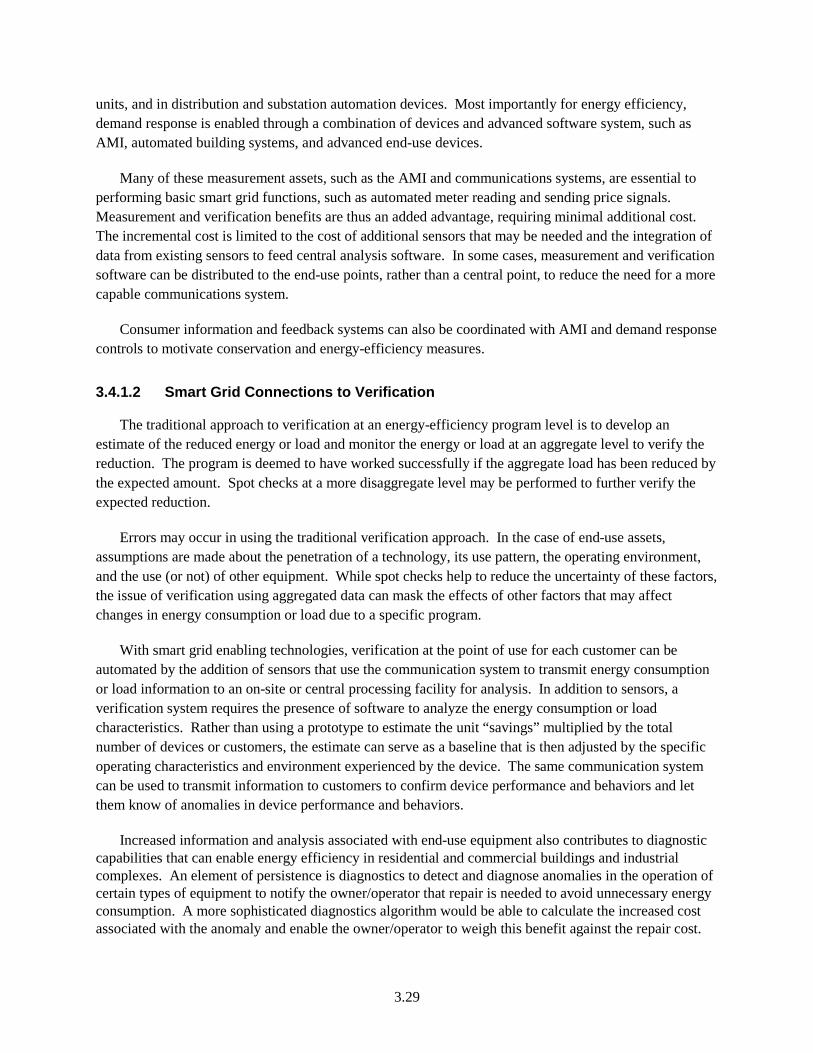
3.29
units, and in distribution and substation automation devices. Most importantly for energy efficiency, demand response is enabled through a combination of devices and advanced software system, such as AMI, automated building systems, and advanced end-use devices.
Many of these measurement assets, such as the AMI and communications systems, are essential to performing basic smart grid functions, such as automated meter reading and sending price signals. Measurement and verification benefits are thus an added advantage, requiring minimal additional cost. The incremental cost is limited to the cost of additional sensors that may be needed and the integration of data from existing sensors to feed central analysis software. In some cases, measurement and verification software can be distributed to the end-use points, rather than a central point, to reduce the need for a more capable communications system.
Consumer information and feedback systems can also be coordinated with AMI and demand response controls to motivate conservation and energy-efficiency measures.
3.4.1.2 Smart Grid Connections to Verification
The traditional approach to verification at an energy-efficiency program level is to develop an estimate of the reduced energy or load and monitor the energy or load at an aggregate level to verify the reduction. The program is deemed to have worked successfully if the aggregate load has been reduced by the expected amount. Spot checks at a more disaggregate level may be performed to further verify the expected reduction.
Errors may occur in using the traditional verification approach. In the case of end-use assets, assumptions are made about the penetration of a technology, its use pattern, the operating environment, and the use (or not) of other equipment. While spot checks help to reduce the uncertainty of these factors, the issue of verification using aggregated data can mask the effects of other factors that may affect changes in energy consumption or load due to a specific program.
With smart grid enabling technologies, verification at the point of use for each customer can be automated by the addition of sensors that use the communication system to transmit energy consumption or load information to an on-site or central processing facility for analysis. In addition to sensors, a verification system requires the presence of software to analyze the energy consumption or load characteristics. Rather than using a prototype to estimate the unit “savings” multiplied by the total number of devices or customers, the estimate can serve as a baseline that is then adjusted by the specific operating characteristics and environment experienced by the device. The same communication system can be used to transmit information to customers to confirm device performance and behaviors and let them know of anomalies in device performance and behaviors.
Increased information and analysis associated with end-use equipment also contributes to diagnostic capabilities that can enable energy efficiency in residential and commercial buildings and industrial complexes. An element of persistence is diagnostics to detect and diagnose anomalies in the operation of certain types of equipment to notify the owner/operator that repair is needed to avoid unnecessary energy consumption. A more sophisticated diagnostics algorithm would be able to calculate the increased cost associated with the anomaly and enable the owner/operator to weigh this benefit against the repair cost.
3.30
The ultimate benefit of smart grid enabled verification is informed customer participation and increased investor confidence.
3.4.1.3 Potential Benefits of Smart Grid Enabled Verification
Smart grid technologies enable the collection and analysis of data at multiple levels and over multiple time-frames. In particular, disaggregated data about end-use loads targeted in energy-efficiency programs can provide several benefits:
• Energy-efficiency program performance data can be correlated with the program’s design to maximize program effectiveness (i.e., maximize energy and load reductions for minimum program costs).
• The certainty of the investment measures designed to reduce energy and load will be increased, thus enabling investors and regulators to more readily approve proceeding with an energy-efficiency program action.
• The automated nature of the verification activity will lower the initial verification cost and enable continual verification to monitor persistence and perform diagnostics at very low cost.
• The capability of deployed smart grid technology can be used to communicate the findings to customers, thereby enabling them to understand their specific behaviors and use patterns on energy cost, and modify these behaviors and use-patterns accordingly.
• Improved power system performance and reduced need for generation, transmission, and distribution assets as discussed in Section 3.3.
Two studies estimated the reductions in energy and CO2 resulting from verification, customer feedback, and diagnostics (PNNL 2010, EPRI 2008). While a direct comparison of the reductions is not possible because of the assumptions used, the two studies were in agreement in that the three components would provide a reduction of at least 4% of total US energy consumption in 2030, with the PNNL 2010 study estimating up to 7%.
An issue may be the need to monitor and analyze all the ‘smart’ devices all the time. In the case of critical generation, transmission, and distribution assets, the need for continual monitoring and verification is evident to reduce outage time and maximize system efficiency. While monitoring and verification at the customer level may not be a technical necessity, it involves low additional cost because the verification system (i.e., sensors, communication, and analysis) is in place and the ability to provide customer feedback is important to maintain persistence.
3.4.2 Examples of Verification with or without Smart Grid
At this early stage of smart grid implementation, the use of automated verification is beginning to be realized in transmission and distribution systems (see Section 3.3). Widespread application of smart grid technology for verification or diagnostics was not found at the time this report was written; however many member economies have pilot programs and R&D programs that apply smart grid concepts to demand response, consumer feedback, and buildings diagnostics. Several surveys reviewed indicate that electricity service providers were in the process of getting communications in place for demand response, which may involve customer feedback (Logica 2010, ORACLE 2010, Microsoft 2010). These surveys and other information do not indicate that verification or diagnostics are being offered at this time.
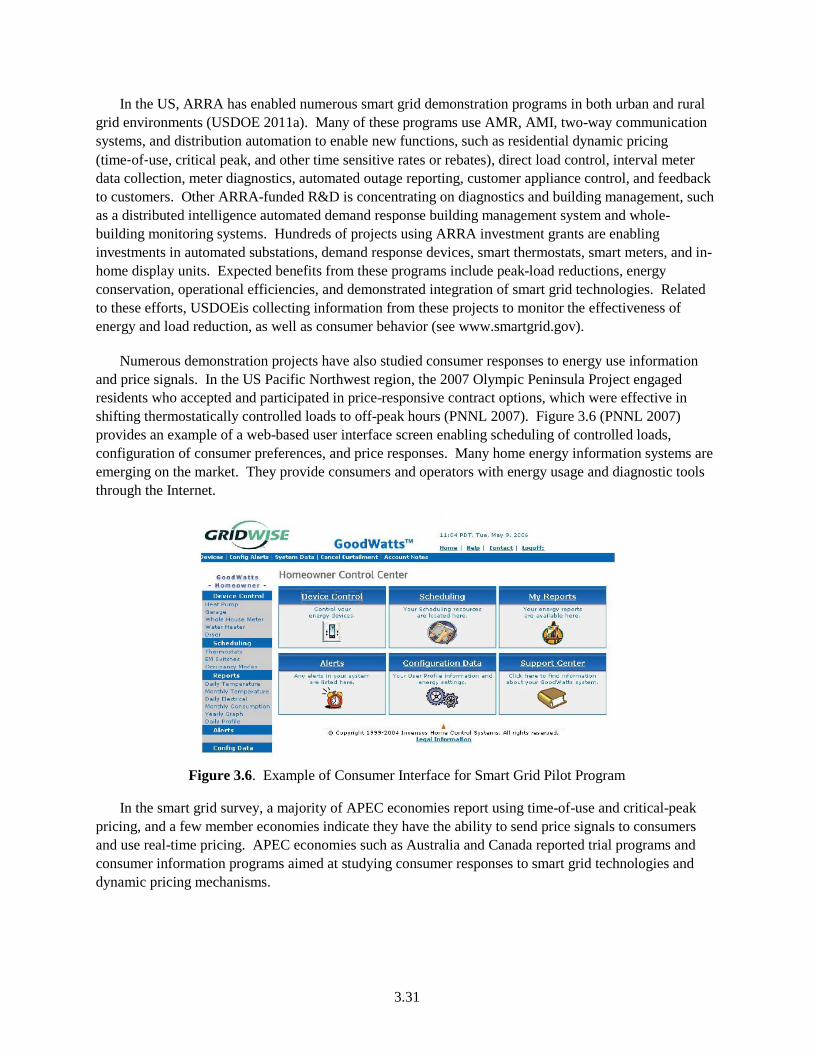
3.31
In the US, ARRA has enabled numerous smart grid demonstration programs in both urban and rural grid environments (USDOE 2011a). Many of these programs use AMR, AMI, two-way communication systems, and distribution automation to enable new functions, such as residential dynamic pricing (time‐of‐use, critical peak, and other time sensitive rates or rebates), direct load control, interval meter data collection, meter diagnostics, automated outage reporting, customer appliance control, and feedback to customers. Other ARRA-funded R&D is concentrating on diagnostics and building management, such as a distributed intelligence automated demand response building management system and whole-building monitoring systems. Hundreds of projects using ARRA investment grants are enabling investments in automated substations, demand response devices, smart thermostats, smart meters, and in-home display units. Expected benefits from these programs include peak-load reductions, energy conservation, operational efficiencies, and demonstrated integration of smart grid technologies. Related to these efforts, USDOEis collecting information from these projects to monitor the effectiveness of energy and load reduction, as well as consumer behavior (see www.smartgrid.gov).
Numerous demonstration projects have also studied consumer responses to energy use information and price signals. In the US Pacific Northwest region, the 2007 Olympic Peninsula Project engaged residents who accepted and participated in price-responsive contract options, which were effective in shifting thermostatically controlled loads to off-peak hours (PNNL 2007). Figure 3.6 (PNNL 2007) provides an example of a web-based user interface screen enabling scheduling of controlled loads, configuration of consumer preferences, and price responses. Many home energy information systems are emerging on the market. They provide consumers and operators with energy usage and diagnostic tools through the Internet.
Figure 3.6. Example of Consumer Interface for Smart Grid Pilot Program
In the smart grid survey, a majority of APEC economies report using time-of-use and critical-peak pricing, and a few member economies indicate they have the ability to send price signals to consumers and use real-time pricing. APEC economies such as Australia and Canada reported trial programs and consumer information programs aimed at studying consumer responses to smart grid technologies and dynamic pricing mechanisms.
3.32
It is reasonable to infer that verification and diagnostics will grow as smart grid capabilities mature. Customer feedback will develop in the nearer term as service providers implement time-of-use and dispatchable demand response programs.
3.4.3 Strategies for Verifying Efficiency and Carbon Reduction
This section provides guidance on the path forward for the use of smart grid assets to provide verification of energy-efficiency programs and measures.
3.4.3.1 Recognizing Opportunities
Smart grid assets are currently used to provide verification for energy efficiency on a limited basis, because AMI and related sensors and communication systems that will enable verification are in early stages of installation and deployment. In the early stages of AMI investments, systems to manage vast amounts of data for billing and basic customer feedback are typically deemed higher priority than measurement and verification systems. However, the potential role that smart grid can have for verification is recognized for demand response, energy efficiency, and GHG emissions (GridWise 2009, DRSG 2008, EPRI 2008, PNNL 2010). While the ultimate objectives like active consumer participation, real-time pricing, direct feedback, and system-wide metrics are not yet possible on a wide-scale basis in APEC economies, some verification, diagnostics, and metrics are already becoming feasible.
Two US studies developed estimates of the contribution that verification can provide. The EPRI study (EPRI 2008) estimated that the additional reduction in energy consumption attributable to the smart grid to be in the range of 5% to 20% for a 0.2 to 0.9 reduction in delivered energy in 2030. The PNNL study (PNNL 2010) estimated the reductions at 0.1% to 0.2% of delivered energy over a narrower range of end-uses. In addition, the PNNL study stated that automated monitoring and verification would reduce the costs currently spent on monitoring and verification, which average 3% of program costs. While these reductions are small, the benefit-cost is very large, as they are achievable with little additional investment.
3.4.3.2 Resources Available for Energy Efficiency and Carbon Reduction
The implications are that automated verification will build upon installed smart grid communication and data management resources to provide increases in energy efficiency and reductions in carbon emissions. The increased certainty in energy and cost reductions attributable to specific efficiency and environmental programs will increase the confidence of investors, regulators, and customers to proceed with actions that improve energy efficiency. In addition, automated monitoring and verification will improve the persistence of programs and measures by identifying failing devices and through automated diagnostics. Detailed analyses of potential benefits and smart grid mechanisms available to utilities are available (PNNL 2010, EPRI 2008).
Incremental advances and extensions of smart grid infrastructures will increasingly enable greater verification and more automated use of verification to more effectively engage end-users and motivate energy efficiency. Achieving the ultimate outcomes awaits the placement of the smart grid’s communication and data management capabilities upon which the automated monitoring and verification software can be implemented. Approaches may vary significantly from one economy to another, depending on the current electricity and communications infrastructures (USAID 2010). In each case, it
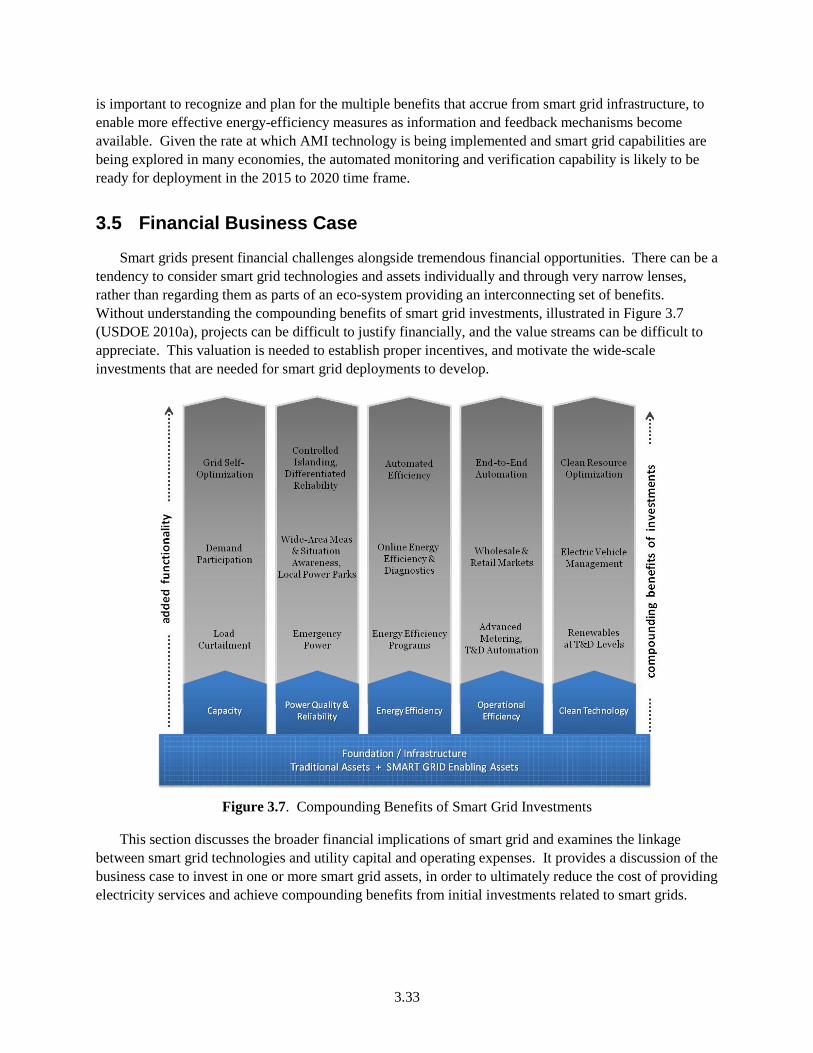
3.33
is important to recognize and plan for the multiple benefits that accrue from smart grid infrastructure, to enable more effective energy-efficiency measures as information and feedback mechanisms become available. Given the rate at which AMI technology is being implemented and smart grid capabilities are being explored in many economies, the automated monitoring and verification capability is likely to be ready for deployment in the 2015 to 2020 time frame.
3.5 Financial Business Case
Smart grids present financial challenges alongside tremendous financial opportunities. There can be a tendency to consider smart grid technologies and assets individually and through very narrow lenses, rather than regarding them as parts of an eco-system providing an interconnecting set of benefits. Without understanding the compounding benefits of smart grid investments, illustrated in Figure 3.7 (USDOE 2010a), projects can be difficult to justify financially, and the value streams can be difficult to appreciate. This valuation is needed to establish proper incentives, and motivate the wide-scale investments that are needed for smart grid deployments to develop.
Figure 3.7. Compounding Benefits of Smart Grid Investments
This section discusses the broader financial implications of smart grid and examines the linkage between smart grid technologies and utility capital and operating expenses. It provides a discussion of the business case to invest in one or more smart grid assets, in order to ultimately reduce the cost of providing electricity services and achieve compounding benefits from initial investments related to smart grids.
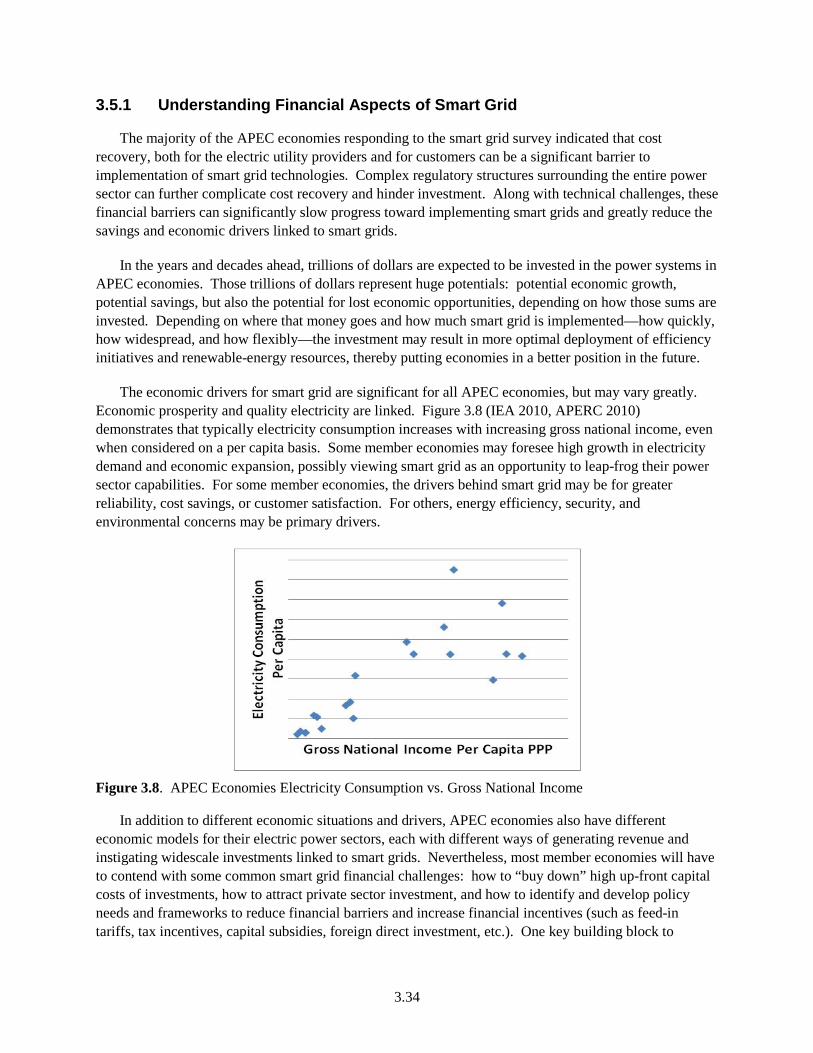
3.34
3.5.1 Understanding Financial Aspects of Smart Grid
The majority of the APEC economies responding to the smart grid survey indicated that cost recovery, both for the electric utility providers and for customers can be a significant barrier to implementation of smart grid technologies. Complex regulatory structures surrounding the entire power sector can further complicate cost recovery and hinder investment. Along with technical challenges, these financial barriers can significantly slow progress toward implementing smart grids and greatly reduce the savings and economic drivers linked to smart grids.
In the years and decades ahead, trillions of dollars are expected to be invested in the power systems in APEC economies. Those trillions of dollars represent huge potentials: potential economic growth, potential savings, but also the potential for lost economic opportunities, depending on how those sums are invested. Depending on where that money goes and how much smart grid is implemented—how quickly, how widespread, and how flexibly—the investment may result in more optimal deployment of efficiency initiatives and renewable-energy resources, thereby putting economies in a better position in the future.
The economic drivers for smart grid are significant for all APEC economies, but may vary greatly. Economic prosperity and quality electricity are linked. Figure 3.8 (IEA 2010, APERC 2010) demonstrates that typically electricity consumption increases with increasing gross national income, even when considered on a per capita basis. Some member economies may foresee high growth in electricity demand and economic expansion, possibly viewing smart grid as an opportunity to leap-frog their power sector capabilities. For some member economies, the drivers behind smart grid may be for greater reliability, cost savings, or customer satisfaction. For others, energy efficiency, security, and environmental concerns may be primary drivers.
Figure 3.8. APEC Economies Electricity Consumption vs. Gross National Income
In addition to different economic situations and drivers, APEC economies also have different economic models for their electric power sectors, each with different ways of generating revenue and instigating widescale investments linked to smart grids. Nevertheless, most member economies will have to contend with some common smart grid financial challenges: how to “buy down” high up-front capital costs of investments, how to attract private sector investment, and how to identify and develop policy needs and frameworks to reduce financial barriers and increase financial incentives (such as feed-in tariffs, tax incentives, capital subsidies, foreign direct investment, etc.). One key building block to
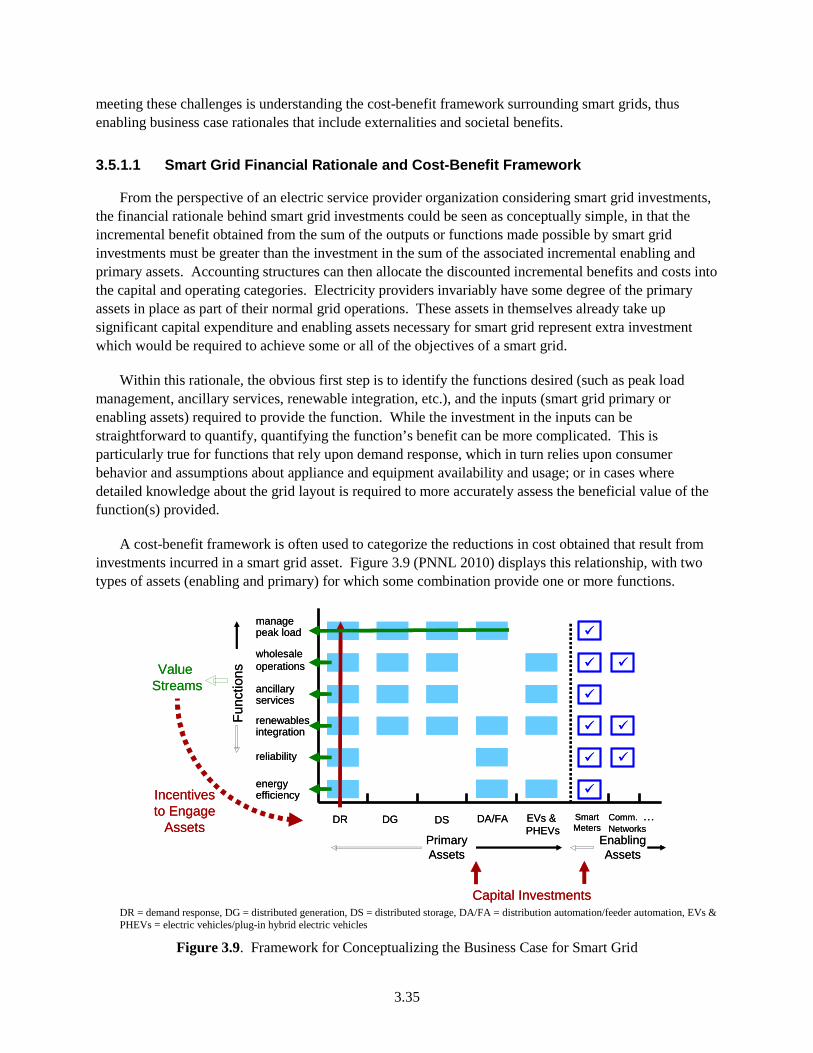
3.35
meeting these challenges is understanding the cost-benefit framework surrounding smart grids, thus enabling business case rationales that include externalities and societal benefits.
3.5.1.1 Smart Grid Financial Rationale and Cost-Benefit Framework
From the perspective of an electric service provider organization considering smart grid investments, the financial rationale behind smart grid investments could be seen as conceptually simple, in that the incremental benefit obtained from the sum of the outputs or functions made possible by smart grid investments must be greater than the investment in the sum of the associated incremental enabling and primary assets. Accounting structures can then allocate the discounted incremental benefits and costs into the capital and operating categories. Electricity providers invariably have some degree of the primary assets in place as part of their normal grid operations. These assets in themselves already take up significant capital expenditure and enabling assets necessary for smart grid represent extra investment which would be required to achieve some or all of the objectives of a smart grid.
Within this rationale, the obvious first step is to identify the functions desired (such as peak load management, ancillary services, renewable integration, etc.), and the inputs (smart grid primary or enabling assets) required to provide the function. While the investment in the inputs can be straightforward to quantify, quantifying the function’s benefit can be more complicated. This is particularly true for functions that rely upon demand response, which in turn relies upon consumer behavior and assumptions about appliance and equipment availability and usage; or in cases where detailed knowledge about the grid layout is required to more accurately assess the beneficial value of the function(s) provided.
A cost-benefit framework is often used to categorize the reductions in cost obtained that result from investments incurred in a smart grid asset. Figure 3.9 (PNNL 2010) displays this relationship, with two types of assets (enabling and primary) for which some combination provide one or more functions.
DR = demand response, DG = distributed generation, DS = distributed storage, DA/FA = distribution automation/feeder automation, EVs & PHEVs = electric vehicles/plug-in hybrid electric vehicles
Figure 3.9. Framework for Conceptualizing the Business Case for Smart Grid
DR DG DS DA/FA EVs & PHEVs
Func
tions
Capital Investments
manage peak load
wholesale operations
ancillary services
renewablesintegration
reliability
energyefficiency
Value Streams
Incentives to Engage
AssetsPrimary Assets
Enabling Assets
Comm. …Networks
SmartMeters
DR DG DS DA/FA EVs & PHEVs
Func
tions
Capital Investments
manage peak load
wholesale operations
ancillary services
renewablesintegration
reliability
energyefficiency
Value Streams
Incentives to Engage
AssetsPrimary Assets
Enabling Assets
Comm. …Networks
SmartMeters
3.36
In this framework, the enabling assets (communications networks, sensors and controls, data management systems, utility back office systems to manage and analyze information, cybersecurity, and interoperability) actively control the primary assets (demand response, distributed generation, distributed storage, distribution and feeder automation, wide-area visualization, transmission-control systems, EVs, and PHEVs). The outputs or functions provided by the assets include demand response, the need for ancillary services to integrate renewable generation and provide grid stability, and deploy “active” energy-efficiency measures (PNNL 2010).
The distribution of the benefits and costs can be difficult when dealing with differing electric service provider structures. A vertically integrated utility will realize the entire benefit of the investment; however, allocating the benefits and costs may be more complex in a less integrated environment, where, for example, a distribution or retail provider is responsible for the majority of the investment, while the supplying generation and transmission provider may derive a portion of the benefit.
The complexity of attributing benefits and costs of smart grid is even greater when looking beyond direct cost savings toward broader economic rationales. Longer-term economic benefits must also be considered, such as deferred or avoided capital spending for generation, transmission, and distribution. Higher-level goals such as those tied to energy efficiency, carbon reduction, and energy security are challenging to quantify and integrate in a financial rationale. Incentives to address these types of goals are often addressed through government policy. A wide variety of tools are available to policymakers, including rules and regulations, performance targets, subsidies, and taxes. Such policies can be viewed as contributions to defining the environment for service providers to apply a cost-benefit framework.
3.5.1.2 Potential Benefits of the Financial Aspects of Smart Grid
Financial benefits of smart grid may be observed as direct economic benefits, impacting both the capital and operating costs in the power system, or less directly as service benefits and environmental benefits. Smart grid investments designed to provide functions such as ancillary services, renewable integration, or reliability will initially be capital costs, with benefits realized through reductions in future operating costs. Applications designed for demand response and efficiency will use two-way communications and AMI, and involve customer interactions engendering an initial capital cost offset by reductions in future operating costs. Future capital costs also decrease because of the reduced need for generation and transmission and distribution system capacity, but future operating costs will increase because of the need for operation and maintenance of the demand response system.
As pointed out in Section 3.3, other direct economic benefits of smart grid may be operational savings from peak load reduction, reduced operations and maintenance costs through optimization and automation, reduced transmission and distribution losses and loss reduction (for economies with a fraction of the population not metered). Service benefits may stem from improved reliability and improved power quality, enhanced services for consumers, and system security. Environmental benefits may stem from enabling increased use of renewable-energy sources, CO2 reduction, and reductions in other pollutants.
Broader economic benefits of smart grid may be linked to advancing technologies (leap-frogging), reducing risk and supply shortfalls, and developing smart grid products and services as potential business for world markets. In some cases, smart grid may provide general economic benefits, enabling development of industries, providing jobs, encouraging a well-educated workforce, and increasing trade.

3.37
3.5.2 Examples of Financial Aspects with or without Smart Grid
There has been much discussion regarding the business case for smart grid technologies, with progress on this topic clouded by uncertainties in actual performance of smart grid technologies and cost recovery. This section provides information on this topic, with initial statements of the expected benefits and costs.
3.5.2.1 Degrees of Penetration: Financial Resources Coupled with Smart Grid
The penetration of smart grid technologies at the customer level usually begins with the installation of interval meters and the ability to conduct two-way communication. The APEC responses reflect the more general environment, where the majority (75%) has installed AMI, but that only 2 of the 16 have installed AMI in more than 10% of their customers. In addition, less than 25% of utilities have the communication infrastructure in place to use the AMI capabilities.
3.5.2.2 Survey Finding
One survey question (Table 3.2) pertained to the types of benefits that utilities in the APEC economies expected to receive from using the smart grid technology, with over 80% responding that they would benefit. Comments to this question indicated significant uncertainty about the magnitude of the benefits, cost recovery on the part of utilities and customers, and the distribution of benefits and costs in a disaggregated utility structure.
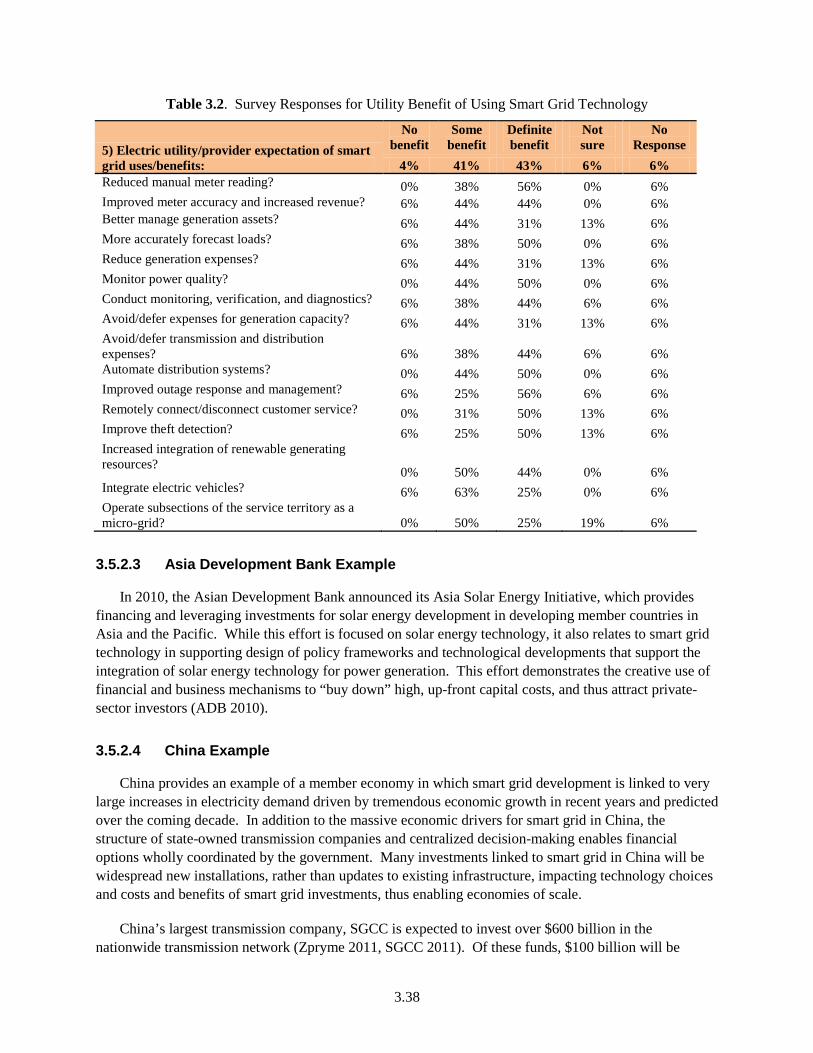
3.38
Table 3.2. Survey Responses for Utility Benefit of Using Smart Grid Technology
5) Electric utility/provider expectation of smart grid uses/benefits:
No benefit
Some benefit
Definite benefit
Not sure
No Response
4% 41% 43% 6% 6% Reduced manual meter reading? 0% 38% 56% 0% 6% Improved meter accuracy and increased revenue? 6% 44% 44% 0% 6% Better manage generation assets? 6% 44% 31% 13% 6% More accurately forecast loads? 6% 38% 50% 0% 6% Reduce generation expenses? 6% 44% 31% 13% 6% Monitor power quality? 0% 44% 50% 0% 6% Conduct monitoring, verification, and diagnostics? 6% 38% 44% 6% 6% Avoid/defer expenses for generation capacity? 6% 44% 31% 13% 6% Avoid/defer transmission and distribution expenses? 6% 38% 44% 6% 6% Automate distribution systems? 0% 44% 50% 0% 6% Improved outage response and management? 6% 25% 56% 6% 6% Remotely connect/disconnect customer service? 0% 31% 50% 13% 6% Improve theft detection? 6% 25% 50% 13% 6% Increased integration of renewable generating resources? 0% 50% 44% 0% 6% Integrate electric vehicles? 6% 63% 25% 0% 6% Operate subsections of the service territory as a micro-grid? 0% 50% 25% 19% 6%
3.5.2.3 Asia Development Bank Example
In 2010, the Asian Development Bank announced its Asia Solar Energy Initiative, which provides financing and leveraging investments for solar energy development in developing member countries in Asia and the Pacific. While this effort is focused on solar energy technology, it also relates to smart grid technology in supporting design of policy frameworks and technological developments that support the integration of solar energy technology for power generation. This effort demonstrates the creative use of financial and business mechanisms to “buy down” high, up-front capital costs, and thus attract private-sector investors (ADB 2010).
3.5.2.4 China Example
China provides an example of a member economy in which smart grid development is linked to very large increases in electricity demand driven by tremendous economic growth in recent years and predicted over the coming decade. In addition to the massive economic drivers for smart grid in China, the structure of state-owned transmission companies and centralized decision-making enables financial options wholly coordinated by the government. Many investments linked to smart grid in China will be widespread new installations, rather than updates to existing infrastructure, impacting technology choices and costs and benefits of smart grid investments, thus enabling economies of scale.
China’s largest transmission company, SGCC is expected to invest over $600 billion in the nationwide transmission network (Zpryme 2011, SGCC 2011). Of these funds, $100 billion will be
3.39
dedicated directly to developing smart grid technology, and investment choices made with the remaining funds also are likely to be tied to smart grid technologies. The direct investments in smart grid infrastructure will include transmission and distribution automation equipment, communication and wireless infrastructures, software and hardware, sensors, and smart meters. This smart grid infrastructure, in combination with investments in the underlying transmission and distribution systems, is expected to enable nation-wide integration of vast wind farms, solar power resources and hydro-electric plants, thus greatly increasing the benefits from the smart grid technology.
The need to support rapid increases in installed capacity in an economy with a relatively sparse existing power system infrastructure can justify financial mechanisms for smart grid implementation without the extent of financial risk and uncertainty observed in economies undergoing less growth, or contending with more developed existing infrastructures and practices.
3.5.2.5 United States Example
In the US, smart grid efforts are supported by national initiatives, but widespread smart grid investments will depend on a vast and diverse array of service providers, transmission and system operators, and state regulatory bodies. A survey of 11 US utilities revealed that operating costs and service were the most important consideration in deploying AMI systems, followed by improved accuracy and theft detection (Levy 2005). The Levy study further reported that utilities often exclude factors that do not contribute to revenue, the broader value of actions to the operation of the utility system, customers, and society are often not recognized.
A number of financial accounting approaches applied to demonstrations provide guidance and models which aid in performing cost-benefit analyses of smart grid. EPRI has proposed a framework to capture the broad spectrum of benefits of a smart grid project to service providers, customers, and society either in monetary or qualitative terms (EPRI 2010b). The benefits, or a subset by type and or perspective, may then be compared to the costs of a smart grid program. The US Federal Smart Grid Task Force is supporting a number of efforts surrounding smart grid investments, including processes and guidance for establishing metrics and reporting benefits of smart grid projects and a methodological approach for estimating the benefits and costs of smart grid demonstration projects. This effort also supports other smart grid tools such as the Smart Grid Maturity Model, which can assist utilities in planning and implementing smart grid projects (USDOE 2011b).
There are numerous smart grid demonstrations programs taking place throughout the US to assess the benefits and costs of alternative approaches and technologies, and develop best practices. In one example, implementation of an AMI system estimated the breakeven point (discounted costs equal discounted benefits) to be in the third year when accounting for reductions in capital and operating expenses, and in the eighth year for only reduced operating expenses (PEPCO 2009). In another example, a regulatory order by the Maryland Public Service Commission for approval an AMI demonstration project (MDPSC 2010) describes the multiple potential benefits from AMI from the utility perspective:
“…. AMI will enhance…outage detection and notification capabilities by remotely verifying when a meter is in or out of service, for example, and that it will help improve service restoration times. ….AMI deployment…will yield operational and maintenance (“O&M”) cost savings by eliminating the need for manual meter

3.40
readings, enabling remote service connections and disconnections, improving billing activities, and enhancing customer complaint management, among other things, and those savings will be passed on to the Companies’ customers.”
Finally, in the recently completed PowerCentsDC demonstration program in Washington D.C. of approximately 900 residential customers, customers experienced an average 2% to 5% reduction in their energy bill and reported increased adoption energy-efficiency measures, with low cost measures adopted first. Over 90% of customers preferred the PowerCentsDC demand response program over the standards flat rate program and nearly 90% would recommend the program to others (DCPSC 2010).
3.5.2.6 Insight from Examples: Barriers and Facilitators
Major barriers to developing the smart grid business case identified from the survey and examples follow:
• Uncertainty about the performance of the technology, particularly for estimating the benefits.
• The type of communication technology best suited to the needs of utilities with respect to cost, institutional or utility control, cybersecurity, and ability to provide near real-time two-way communication.
• Regulatory mechanisms to enable investing organizations to recover costs and allow service providers to implement time-based rates.
• Regulated utility structures and their influences on being able to assign and share benefits and costs.
• Common good goals are difficult to represent in a financial analysis of costs and benefits because things, such as environmental implications and reliable service, are hard to quantify monetarily. If values could be assigned, then trade-offs could be made at all levels of the operation to better achieve common good policy goals.
3.5.3 Strategies for Financial Aspects of Smart Grid
Financial issues and potential gains surrounding smart grid will vary greatly across member economies depending on electric system sector markets and economic outlooks. Typical financial challenges include the following:
• Buying down high up-front capital costs
• Attracting private sector investment
• Identifying and developing policy frameworks to reduce financial barriers and increase financial incentives (service providers that depend on fixed rates may see greater barriers)
• Addressing smart grid technology risk and uncertainties such as accelerated depreciation of assets, stranded assets, integration challenges, scale, and complexity
• Measuring benefits and allocating savings (such as a policy framework to enable reinvestment of cost savings into efficiency, renewable resources, or further smart grid investments). This includes valuing environmental implications and reliability.

3.41
Invariably, the question must be addressed as to whether the investments associated with smart grid development have to be in part borne by a segment of customers that might not necessarily derive the associated benefits of smart grid transformation.
The results of demonstrations taking place in many of the APEC economies need to be focused on identifying and addressing financial barriers to deployment in order to develop solutions that will facilitate the adoption of smart grid technology. Such efforts need to recognize the roles of the many stakeholders and involve the stakeholders in developing the solutions. The results of this involvement can help identify and prioritize gaps that relate to the specific situations in each of the APEC economies. A number of mechanisms can be used to reduce financial barriers:
• Do not limit smart grid demonstrations to technologies and operational processes—remember to demonstrate technical, operational, and business-model feasibility.
• Explicitly include metrics and traceability in all smart grid plans (to facilitate quantification of costs and benefits).
• Address government policy and incentives to allow for return on investments, longer cost-recovery time frames, and the recognition of a broader scope of benefits.
• Leverage value propositions where common hardware and information network resources can address multiple objectives.
• Gain insight into value propositions through field deployments.
• Broaden the scope of cost-benefit studies: identify winners and losers, losses and gains (including avoided losses from increased reliability), life-cycle implications for recuperating investments.
• Consider an array of funding strategies: self-funded projects, public lending from grants or loans, private investors, vendor financing, banking, and private/public partnerships.
Resources to support efforts should include the International Smart Grid Action Network (ISGAN 2010) and the Global Smart Grid Federation (GSGF 2010). As smart grid forums progress, focus should be given to the barriers and solutions that are both general to the adoption of smart grid technologies and are specific to each of the APEC economies. The results from a multitude of smart grid demonstrations taking place worldwide can be used by the international forums to develop approaches to assess related costs and benefits, and develop business cases.
Engineering economics and financial aspects of smart grid are well addressed in the Smart Grid Vision for India whitepaper, including a well-presented overview of cost-benefit analysis as it pertains to smart grid, estimating technology costs and risks associated with smart grid projects (USAID 2010).
Financial implications of smart grid range from high-level economic drivers to focused business cases for particular smart grid technologies and implementations. To understand financial implications, it is essential to appreciate the value of a reliable power grid to an economy, from the cost of power quality and power disturbances, to supporting capacity expansion and driving economic growth. By enabling avoided capital costs (avoiding the addition of new capacity) and offsetting growth in electricity demand, savings made possible by smart grid can be reinvested—representing huge potential financial gain in the decades ahead.

4.1
4.0 Challenges to APEC Smart Grid Deployments
Each APEC economy will face many unique challenges in deploying smart grids, depending on factors such as market structure; degree of industrialization, urbanization, and population density; status of installed electric power system; and environmental and economic drivers. Some challenges must be addressed at the local, regional, or national levels, while others can be addressed in part by global efforts such as the APEC Smart Initiative or the International Smart Grid Action Network being established as an activity of the Clean Energy Ministerial. The nature of the challenges evolve considerably as smart grid deployments progress through different stages of penetration and depth—from the early test-bed stage, to having widespread installation of enabling technologies, to employing integrated, higher-level smart grid functions. Recognizing the potential barriers to smart grid deployment and the variety of challenges ahead comprise a first step needed to develop effective smart grid roadmaps and action plans.
The APEC smart grid survey underscored a fundamental, initial challenge, stemming from the simple question as to whether or not various stakeholders—customers, policy-makers, electric utility providers—are familiar with smart grid concepts and technologies. Customer familiarity with the smart grid concept is low or non-existent in almost all APEC economies. Both policy-maker and electric-utility-provider awareness of smart grid concepts is high in only three APEC economies. This lack of familiarity with smart grid concepts is confirmed by other surveys, in the US and Australia, 75% of consumers polled indicated they were not familiar with smart grid (GE 2010, Accenture 2010a). As an essential starting point, smart grid deployment will require familiarity and understanding from all levels of electric utility providers and active support of policy-makers. As smart grid development progresses, widespread customer acceptance and engagement will become more and more essential as well.
Another general, ongoing challenge comes from the fact that the smart grid landscape is rapidly changing as various smart grid solutions are deployed. The sheer complexity of smart grid, impacting almost all segments of society and every segment of the electric power system, along with the ever-changing business environment raises the challenge of compiling concise, relevant information for different smart grid needs. It is important the APEC economies establish mechanisms to monitor the status of current smart grid demonstrations and implementations so that they can learn from others experiences. One of the best ways to keep track of these changes is to become involved in international smart grid initiatives.
Important technical, business, financial, and societal challenges are discussed below. A similar and more-detailed dichotomy of barriers to smart grid development and deployment was reported by MEF (2009), in which market, public, and technology barriers were examined. A US roadmap for smart grid R&D details standards and best practices, technology development, modeling, analysis, and evaluation and demonstration projects that are needed in coming years (USDOE 2010a). More general smart grid challenges also are discussed in a number of other roadmaps (India: USAID 2010, European Union: EU 2010).
4.1 Technical
Specific smart grid technologies and functions are at different stages of development and raise different, technology-specific challenges, such as R&D into devices or software needed for PEV integration, smart appliances, distribution automation, or integration, and analysis of wide-area

4.2
transmission-level metrics. More broadly, inherent technical challenges reflect the evolving, intertwined nature of smart grid technologies. Overarching technical challenges include:
• Managing and planning for constantly changing technologies. If deployment takes years, it can be difficult to settle on technology up front as it may become antiquated, but deployment of key enabling technologies should not be delayed, because these technologies act as essential building blocks for more advanced smart grid functions.
• Accommodating legacy technology. Heterogeneity and paths toward upgrading existing systems need to be acknowledged. As smart grid deployment progresses, initial smart grid devices may need to be upgraded or interfaced with more advanced systems. Adaptors (both physical and software-based) are a fact of technical life.
• Recognizing a multitude of technical solutions for similar problems. Technology needs to be sensitive to business and financial issues. Higher-quality (more-expensive) technology may be needed if the economy’s electric system is already mature, whereas simpler (less expensive and perhaps long lasting) technical approaches may be what an emerging economy needs for accommodating growth or providing basic service.
• Providing mechanisms and support for technical decision-makers to balance the need for flexibility with the need for specification. Understanding interfaces and bringing stability to interfaces can allow technology to evolve independently on either side of the interface as long as the changes continue to support the interface.
• Developing and adopting standards and practices that enable interoperability. Ensuring interoperability, standards, and alignment at key interfaces, particularly in immature areas with unfamiliar stakeholders (PEV, building, DG), while continuing to encourage innovation. Consider:
– Driving toward openly available, international standards (as opposed to proprietary standards and national standards)
– How to induce stakeholders to engage and apply standards without mandating standards depending on mechanisms and practices in each member economy
– How to form policy that encourages standards while being agnostic to technology, to anticipate and embrace innovation, rather than stymie it.
• Planning for acquisition of smart grid technologies. Many smart grid implementing technologies may not be manufactured locally and may either not be available, may be subject to tariffs, or may require additional fees that impact project viability. As investment in for smart grid technologies grow globally in coming years, responding to the rapid increase in demand may impact component availability and cost.
• Moving forward with technology development and deployment despite imperfect knowledge on the interrelationship of each action. Many smart grid technologies are dependent on each other or depend on a certain level of penetration of communication and networking before they can even be fully explored. For example, consider the following:
– Enabling functions related to smart grid demand response require a certain basis of communication, cybersecurity, and interoperability. In turn, communication and networking technologies, cybersecurity, and interoperability practices may need to be adapted or designed so that they enable demand response.
4.3
– PEV can be used to enable distributed energy storage, thus helping to support greater penetration of variable renewable-energy resources, when coupled with smart grid control approaches. But, to enable PEV, smart grid technologies and processes such as advanced metering, time-based pricing structures, and standards and technologies that support plug-and-play grid interconnection are needed.
4.2 Business and Financial
Most smart grid studies, surveys, and roadmaps highlight the significance of financial challenges which pervade smart grid deployment efforts. Financial and business challenges for smart grid deployment stem in part from the regulatory nature of electric power sectors in general, from the degrees of complexity and risk surrounding smart grid deployments, and from the potential multiple, indirect benefits that are enabled by smart grid, but very difficult to assess as composite value streams. Sixty percent of respondents to the APEC smart grid survey indicated that regulatory inertia may present a barrier to smart grid deployment and investment, yet without regulatory support and action, smart grid planning and investments cannot commence. The APEC survey also indicates that the largest barrier to smart grid adoption is cost recovery by utility organizations or customers.
Making the business case for specific smart grid projects or for including smart grid approaches in other projects (such as capital investments for transmission or distribution infrastructure, or deploying renewable-energy resources) is complicated by the degree of unknowns surrounding cost and benefits. These unknowns are already visible in recent and ongoing projects, and grow as plans consider increasing the scale of smart grid deployment in years ahead. While regulatory and market structures differ considerably across APEC economies, examples from rate case filings and cost-benefit analyses demonstrate the challenges for developing business cases. Overarching financial and business challenges to consider include:
• How does an economy set up the appropriate incentive structure (economic and regulatory policy) to encourage stakeholder organizations to act in ways that develop paths to a smarter grid?
– Regulatory mechanisms to enable cost recovery on investments made by both private and public sector stakeholders.
– Tools and mechanisms to assign and share costs and benefits where they are divided across multiple functions and multiple organizations.
– Free market signals versus regulated rate of return on investment in smart grid technology.
– Mechanisms which enable time-based and dynamic rates.
• How does an economy create an environment that supports smart grid investments, buying down high up-front costs and attracting private-sector investment?
• How do economies understand and manage the long-term and risky nature of smart grid deployment? Creating a smarter grid takes time. For something as complex and all-encompassing as the electricity system, it is a system in continual evolution.
• What is the long-term business path?
• How does that change based on the characteristics of an economy (geographic, weather, political system, maturity of the existing system, economic objectives, etc.)? Enabling demonstrations, pilot
4.4
programs, and a phased approach to smart grid deployment can reduce risks stemming from unknowns and lack of familiarity.
• How can smart grid technology approaches be adapted to fit within business and financial constraints?
• Can economies identify specific regulations to explicitly facilitate introduction of certain smart grid technologies?
• In many APEC economies, social policy artificially controls the price of electricity as a common good. How can socio-political approaches be adapted to enable financing of potentially cost-effective smart grid solutions?
4.3 Societal
Valuing and incorporating societal benefit of new technologies or practices is not an uncommon problem, but for smart grid it is a significant challenge. APEC economies clearly see the importance of renewable resources as demonstrated by the presence of national policies encouraging integration of renewable in a majority of member economies. But, those economies do not yet similarly recognize the value of smart grid and the role that smart grid can play toward supporting renewable-energy integration and penetration. Only a small minority of member economies currently have national policies that explicitly encourage smart grid deployment. Capturing and appreciating societal benefits can be addressed through government policy, through regulation, through assigning value to externalities such as CO2, and through education and communication.
Societal challenges facing smart grid include the following:
• Strategies that account for a variety of policy objects must be developed. The policy objectives for an economy vary. In some situations, providing basic services is needed at an affordable rate. In more industrialized economies, societal objectives may be to enhance reliability, ensure power quality, and address environmental objectives.
• How does an economy set up the appropriate incentive structure (economic and regulatory policy) to encourage stakeholder organizations to act in ways that address the societal issues?
– Environmental incentives that value air, water, noise: taxes, constraints, renewable portfolio standards, etc.
– Provide basic electricity for all
– Meet certain reliability and power quality criteria
– Address cybersecurity and privacy concerns.
• How does an member economy assign value to externalities and overarching policy objectives and assign value to the role that smart grid can play in achieving these objectives?
– Valuing the impact of electricity on economic health (e.g., GDP). Availability and reliability of electricity impacts overall economic capabilities. Smart grid can represent tremendous business and learning opportunities, carrying broad economic potential to economies.
– Valuing environmental concerns.
4.5
– Valuing electricity reliability.
– Valuing energy independence and security.
• Smart grid can be viewed as a mechanism for job creation and development of skills in more advanced fields, potentially leading to technology export.
• Some APEC economies may feel that smart grid is only for developed economies, but the reality is that in complex systems like electricity supply and demand, it is usually most cost effective to construct a system based on best available technology than to retrofit the technologies after the older-generation systems have been put in place. For example, the smart grid survey revealed that rural economies have little to no existing AMI, although they might benefit greatly from AMI and functions enabled by AMI.
• As smart grid progresses, consumers will play an increasing role. Research is needed to understand the role of consumers and to develop and install necessary societal policies that will support consumer education, receptivity, acceptance, and engaged participation in smart grid.
• At every level of smart grid development, information and education play key roles. Language and information availability can be societal barrier to smart grid or can facilitate smart grid deployment if appropriate measures are put in place.

5.1
5.0 Conclusions and Recommendations
This report is the first step in a much longer, broader process toward supporting smart grid deployment in APEC economies. The smart grid survey provided an initial picture of the status of smart grid efforts across APEC and of the range of contexts (electric system development, market structures, and regulatory and political environments) that directly impact strategies for smart grid deployment. The discussion of smart grid technologies provides a broad overview of key smart grid functions, the benefits they can provide, and snapshots of initial implementations in APEC economies. To provide a starting point for addressing smart grid challenges, this section describes impactful, high value smart grid activities, priorities, recommendations for roadmap development, and some areas ripe for further study.
5.1 High-Value Activities Underway
It has been estimated that $200 billion is to be spent on smart grid investments globally through 2015 (Pike 2010b). With such worldwide investment, it is important for APEC to maintain strong international partnerships to ensure that their member economies build on investments being made by others rather than duplicating them. The International Smart Grid Action Network provides an example of coordination in developing international partnerships.
Participating in high-level, joint smart grid initiatives, allows member economies to keep their sights on the bigger picture of smart grid benefits, extending well beyond direct, operational efficiencies provided by smart grid technologies. Taking an active part and planning for participation in information sharing activities is a first step toward supporting smart grid business development, reducing prices, and providing mutual educational benefits. A list of high-value activities follows.
• Developing public policy goals for the environment and energy efficiency sets a context for how smart grid related strategies can make a contribution.
• Several APEC members have drafted or are developing smart grid roadmaps that include support for environmental and energy-efficiency goals (Japan, Korea, Australia, USA, Canada, China, Thailand, etc.).
• Realization is emerging that each roadmap needs to be tailored to each APEC member, but roadmaps can draw inspiration and ideas from each other. Organizing concepts and how they can be applied or fit to different situations can be a valuable contribution from an organized effort within APEC. Roadmap development strategies can consider situations that focus on new construction and on evolutionary changes to update existing equipment and systems.
• Understanding the cost-benefit framework surrounding smart grids is essential to enable development of business-case rationales. Joint efforts can clarify the higher-level perspective of costs and benefits, including externalities (environmental impact, social welfare, etc.) and societal benefits for a variety of economy situations.
• Demonstrations and field deployments are essential, but must lead to:
– Testing the technical, economic, and social feasibility of the smart grid capabilities
– Sharing acquired knowledge, disseminating it, and applying it more broadly
– Revealing barriers and identifying regulatory needs and solutions in different economies
5.2
– Triggering next steps, including regulatory, technical, and financial linkages to additional smart grid functions.
• Developing metrics to measure smart grid deployment progress, the realization of benefits, as well as provide insight into the costs. USDOE provides a biannual report to Congress that describes smart grid deployment progress in the US (USDOE 2009).
• Supporting and enabling phased approaches to smart grid deployment is essential. While many member economies may initially focus smart grid deployment on installing AMI and communication networks, it is essential to incorporate follow-on plans from the outset. Smart grid technologies that are expected to be deployed in secondary stages, but require planning now to include smart appliances and other end-use devices that will ultimately participate in demand response and power quality and measurement and verification functions, which will stimulate increased energy efficiencies and reductions in carbon emissions.
A primary goal of this report is to encourage and to contribute to cooperation across APEC economies on activities such as those outlined above. Many APEC members have officially joined the ISGAN, which was developed at the first Clean Energy Ministerial last year. As mentioned in Section 3.1.3.1, ISGAN is developing an initial series of four smart grid projects in which APEC members could participate. The APEC Smart Grid Initiative (ASGI) will also coordinate its activities with ISGAN so that participation in ASGI will allow APEC members to follow the progress of ISGAN projects.
5.2 Priorities Going Forward for APEC
The following list of activities is presented in arguably priority order, though many activities are expected to move forward in parallel.
• Policy Goals. Understand and articulate public policy goals for the environment and energy efficiency, and the opportunities that smart grid capabilities can enable to achieve these goals . National policy supporting renewable energy and energy efficiency should be considered along with national policy supporting smart grid. APEC could develop a common framework for describing these goals such that each member economy can draw from it or contribute to it as they meet their particular needs.
• Engage Stakeholders. APEC economies should be inclusive about including all electric sector interest groups in the smart grid planning process. However, it is important that an overall lead agency or entity be appointed to coordinate smart grid activities across all aspects of the economy.
• Education. Education is important to effectively engage stakeholders, including the public smart grid concepts and benefits need to be clearly articulated.
– Decision-makers. Overcome regulatory inertia. If key stakeholders—involved with policy and utility operations—are not aware of smart grid, immediate educational and policy efforts should be undertaken to increase awareness and understanding.
– Consumers. Understand wider impacts of smart grid and develop, in particular, a strategy to address consumer perception and engagement.
5.3
• Roadmap. Draft the characteristics desired in a roadmap for smart grid deployment (a framework for roadmap development). This should draw upon existing roadmaps from APEC members and others. Such a framework needs to show the linkage of planned activity to support the policy goals.
– Valuation Framework. For each smart grid enabling technology, identify all potential value streams related to the technology. Incorporate those multiple value streams in plans and benefit analyses for each technology (in longer-term plans, if initial deployment is simplified). For example, AMI is currently not being used for integrating distributed generation and is only used in a very limited degree for demand response. Viewing AMI as an enabling technology for multiple functions and planning to use it as such will further advance smart grid and increase benefits for little additional cost.
– Metrics. Explicitly identify and include metrics in all smart grid plans.
– First Steps. Within the context of the roadmap framework and financial and economic characteristics of each APEC member, describe near-term smart grid deployment decisions that members should consider in support of environmental and energy-efficiency goals, as well as their economic objectives.
– Customize. Identify the smart grid solutions that are most appropriate for a specific economy’s current situation. It is important to realize that each member economy is unique. Careful consideration must be given to matching smart grid opportunities with an economy’s priorities for grid development and its regulatory system.
• Interoperability. An essential step is to participate in interoperability discussions, international standards-making, and cybersecurity development relevant to smart grid. This is to support member technical interests and enhance the choice of smart grid technologies for eventual deployment, as well as the potential for import and export opportunities for local suppliers. Under the APEC Regulatory Cooperation Advancemnet Mechanism for Trade-Related Standards and Technical Regulations (ARCAM), APEC will develop recommendations for cooperation on smart grid interoperability standards.
• Tools. Utilize available smart grid evaluation and analysis resources, such as the Smart Grid Maturity Model, and coordinate to share tools developed within APEC.
• Workshops. Consideration should be given to the organization of a series of workshops on roadmap development for APEC members.
Forecasts in APEC economies for renewable energy’s share of capacity and generation in 2030 are quite limited as compared to what is already demonstrated as possible elsewhere, such as in Denmark. New Zealand leads the APEC economies with forecasts of 16% capacity and 19% of generation for 2030, with many member economies showing less than 1% capacity and generation (APERC 2009b). Other economies need to re-evaluate these forecasts with smart grid technologies and investments in mind. Smart grid can encourage more rapid and greater levels of adoption and should be an integral part of plans and forecasts. APEC should encourage member economies to routinely update and share their renewable-energy forecasts as well as issues encountered in connected their renewable-energy systems to their grids.
5.4
5.3 Considerations for Roadmap Development
Because of the complexity of smart grids—requiring technological, institutional, and sociological change—a variety of roadmaps will be needed at different levels to serve different purposes along the path to smart grid deployment.
5.3.1 The Need for Specialized Roadmaps
A few APEC economies already have smart grid roadmaps or similar guiding documents. The diversity in these roadmaps helps to illustrate the need for a wide variety of high level plans. Some roadmaps focus on establishing a policy vision or regulatory path forward. Korea’s smart grid roadmap outlines high-level visions and goals for five key sectors—1) smart power grid, 2) smart consumer, 3) smart transportation, 4) smart renewable generation, and 5) smart electricity service—and a phased approach to smart grid deployment over the next 20 years. Singapore’s ESC Subcommittee on Ensuring Energy Resilience and Sustainable Growth has established a list of policy recommendations for a smart energy economy, which includes intelligent energy systems as a centerpiece. In addition to smart grid functionality, the United States prioritizes interoperability and cybersecurity at the national level where a multiagency group led by NIST has produced a Framework and Roadmap for Smart Grid Interoperability Standards (NIST 2010a).
Some roadmaps tackle the extensive technical and R&D challenges. Australia has established an initial smart grid R&D roadmap, identifying and prioritizing key R&D topics to serve as a starting point for a more detailed R&D and investment plan. The USDOE Smart Grid Research and Development Multi-Year Program Plan defines an extensive plan detailing technical challenges, objectives, current development, proposed tasks, and milestones for 2010-2014 and beyond for a wide variety of smart grid R & D areas.
Some roadmap development is project-based, either looking at the wider ensemble of projects with plans needed to move incrementally toward smart grid deployment, or providing frameworks on a project-by-project basis. For example, the APEC Renewable Energy Roadmap defined principal steps in project development and implementation, provided examples of specific roadmaps for a number of successful renewable-energy projects in APEC economies, and developed a simplified generic roadmap for renewable-energy project development (APEC 2000). This roadmap development for renewable-energy resource can now be extended to explicitly include smart grid connections to renewable energy and a similar roadmap development exercise for smart grid projects can be established.
High-level roadmaps developed by international efforts also help to identify key stakeholders and actions that they need to take. The IEA sets forth high-level actions for electricity generators, transmission and distribution system operators, technology and solution providers, consumers and consumer advocates, environmental groups, and government and regulators (OECD/IEA 2010). Targeted roadmaps should be established defining detailed plans and actions for each stakeholder group, adapted for the specificities of different types of economies and different regulatory environments.
Specialized smart grid roadmap development can be oriented to types of application, such as off-grid or micro-grid, grid connected rural, and grid connected urban environments. A characterization of economies by types can be used to identify a range of smart grid decision-making and roadmap
5.5
development tools, depending on economy characteristics (e.g., highly developed/agrarian, rural/urban, central/federated, technical level of labor pool, etc...). APEC economies should take advantage of ongoing smart grid roadmaps such as the one recently produced by the IEA. APEC economies could consider the development of APEC specific roadmaps through participation in the ASGI.
All roadmaps need regular evaluation and updating in the light of information, data, experience and knowledge being gained in demonstration projects in the economy and elsewhere, and tracking progress toward smart grid adoption. Roadmaps need to take an active, rather than passive, approach to smart grid planning and consider developing education and preparation of all stakeholder groups so that the opportunities to advance the benefits of smart grid can be seized.
5.3.2 Coordination of Methodology, Issues, and Timing
Smart grid development is a continuous process that will vary by economy depending on the current state of their grid, the level of economic development, and their objectives. The smart grid will never be completely developed because new technologies and information systems will always be on the horizon. The following general recommendations associated with methodology and timing should be considered in moving smart grid forward across APEC economies.
• Create a Smart Grid Working Group to gather interested members and provide information and resources.
• Gather and share existing smart grid roadmaps.
• Develop a common set of metrics for measuring smart grid deployment progress.
• Share experiences on the utilization of service-provider specific smart grid tools such as the Smart Grid Maturity Model in support of economy-level smart grid roadmaps.
• Identify near-term issues and recommendations for members to consider. An example is considerations for smart meter deployments.
• Recognize relationship between electric transportation and smart grid, the potential benefits of electric transportation and CO2 reduction are significantly greater with smart grid.
• Smart grid deployment should be considered in phases that vary by both geography and technology:
– Geographic extension: test-bed regional or area economy wide
– Technological complexity: basic technologies first level of smart grid enabled functions next generation of smart grid enabled capabilities
5.3.3 APEC Smart Grid Initiative
APEC members are encouraged to participate in ASGI, which was recently established by the APEC Energy Working Group (EWG). The Fukui Declaration from the Ninth Energy Ministers Meeting (EMM-9), June 2010, states that “… smart grid technologies, including advanced battery technologies for highly-efficient and cost-effective energy storage, can help to integrate intermittent renewable power sources and building control systems that let businesses and consumers use energy more efficiently, and they can also help to enhance the reliability of electricity supply, extend the useful life of power system components, and reduce system operating costs.” EMM-9 instructed EWG, “… to start an APEC Smart
5.6
Grid Initiative (ASGI) to evaluate the potential of smart grids to support the integration of intermittent renewable energies and energy-management approaches in buildings and industry.” The following four phases of activity are currently being discuss for implementation under ASGI:
• Phase 1 − Survey of Smart Grid Status and Potential
• Phase 2 − Smart Grid Roadmap
• Phase 3 − Smart Grid Test Beds
• Phase 4 − Development of Smart Grid Interoperability Standards.
A draft ASGI concept paper defining initial ASGI activities was distributed at the EWG-40 meeting in November 2010 and a revised concept paper will be tabled at the EWG-41 meeting in May 2011.
5.4 Areas for Further Study
A number of areas of potential further study that were drawn from the APEC smart grid survey responses and other published surveys are identified below.
• More comprehensive survey, or perhaps more detailed in a specific area of concern.
• APEC situation within the global marketplace related to smart grid.
• Regulatory policy considerations related to smart grid for APEC members.
• Further study to quantify and be able to measure smart grid capabilities to improve environment (air, water, land).
• Predict technology maturity gaps, looking at expected phases of smart grid progression.
• Prepare coordination (R & D, marketplaces, regulatory environments, legislation) as needed for different smart grid development scenarios. Plan for scaling-up of smart grid (geographically, functionally, and market-wise).
• Characterization of price impacts and environment impacts of various technologies (e.g., PEV) as a function of economy characteristics.
• Many smart grid advances depend on or result in bi-directional flows of information and electricity at the distribution system level. Recognizing the need to move toward supporting bi-directionality is essential, developing expertise, familiarity and data analysis infrastructure adapted to different economies.
• Study the potential long-term financial avoided capital costs for new capacity. Avoiding growth in electricity demand and reinvesting in smart grid provides significant potential financial gains under different scenarios. What are these scenarios and what are the potential financial gains?
• Smart grid represents a significant change for electricity service providers. Strategies are needed for utilities to manage the disruptive nature of this change (Microsoft 2010). Preparation is needed for information technology to support new business processes and integrate with new smart grid technologies.

5.7
APERC projects that APEC economies will need to invest $6.2 to $8.4 trillion from 2005 to 2030 to to meet electricity and heat demand (APERC 2009). Choices about how these sums are invested can result in very different outcomes. The benefits emerging from current smart grid developments indicate that the inclusion of smart grid best practices into the electricity supply and demand infrastructure will provide both long term economic and environmental benefits for APEC member economies and the APEC region as a whole.

6.1
6.0 References
Accenture 2010a. Understanding Consumer Preferences in Energy Efficiency: Accenture End-Consumer Observatory on Electricity Management. Accessed on 4 January 2011 at http://www.accenture.com/Global/Research_and_Insights/By_Industry/Utilities/Understanding-Consumer-Utilities-Industry.htm.
Accenture 2010b. Consumers Unwilling to Allow Electricity Suppliers to Remotely Limit Energy Use Without Significant Price Discount, Accenture Study Finds. Accessed on 4 January 2011 at http://newsroom.accenture.com/news/consumers+unwilling+to+allow+electricity+suppliers+to+remotely+limit+energy+use+without+significant+price+discount+accenture+study+finds.htm.
ADB 2010. Asian Development Bank. First Asia Solar Energy Forum: Manila, Phillipines. Assessed on 16 March 2011 at: http://www.adb.org/documents/events/2010/first-asia-solar-energy-forum/default.asp.
APEC 2000. Wide-Spread Implementation of Renewable Energy Projects in APEC Member Economies: Road Maps for Success. Prepared by Jerome Weingart and Robert Lee, Alternative Energy Development, Inc. November 2000. Assessed on 24 March 2011 at: http://www.egnret.ewg.apec.org/reports.
APEC 2002. APEC Renewable Energy Infrastructure Assessment. Prepared by International Center for Sustainable Development, Inc. for Expert Group on New and Renewable Energy Technologies. Accessed on 16 December 2010 at http://www.egnret.ewg.apec.org/reports/index.html.
APEC 2006. APEC 21st Century Renewable Energy Development Initiative (Collaborative VI): Adoption of Renewable Energy Standards Phase II. Prepared by Institute for Sustainable Power, Inc. for Expert Group on New and Renewable Energy Technologies. Accessed on 16 December 2010 at http://www.egnret.ewg.apec.org/reports/index.html.
APEC 2007. APEC 21st Century Renewable Energy Development Initiative (Collaborative VI): Evaluation of the Role of Village Power Applications in Response to the Tsunami Recovery. Prepared by Technology Development Partners, Inc. for Expert Group on New and Renewable Energy Technologies. Accessed on 17 December 2010 at http://www.egnret.ewg.apec.org/reports/index.html.
APEC 2010a. APEC Key Indicators Database. Stats APEC. Accessed on 20 August 2010 at http://statistics.apec.org/.
APEC 2010b. Addressing Grid-interconnection Issues in Order to Maximize the Utilization of New and Renewable Energy Sources. Prepared by IT Power (Australia) Pty Ltd for APEC Energy Working Group, APEC #210-RE-01.16, APEC Secretariat, Singapore. Accessed on 16 February 2011 at http://publications.apec.org/publication-detail.php?pub_id=1125.
APEC 2010c. Renewable Energy for Urban Application in the APEC Region. Prepared by The Energy & Security Group, LLC for Expert Group on New and Renewable Energy Technologies. Accessed on 17 December 2010 at http://www.egnret.ewg.apec.org/reports/index.html.
APERC 2009, APEC Energy Demand and Supply Outlook 4th Edition Volume I, Asia Pacific Energy Research Centre, Japan, 2009. Accessed on 18 February 2011 at http://www.ieej.or.jp/aperc/ .
6.2
APERC 2009b, APEC Energy Demand and Supply Outlook 4th Edition Volume II, Asia Pacific Energy Research Centre, Japan, 2009. Accessed on 18 February 2011 at http://www.ieej.or.jp/aperc/.
APERC 2010. Pathways to Energy Sustainability: Measuring APEC Progress in Promoting Economic Growth, Energy Security, and Environmental Protection. ISBN: 978-4-931482-43-2. APEC#210-RE-01.15. 2010.
ARRA-SGP 2010. ARRA Smart Grid Programs. Website www.smartgrid.gov, last updated on 25 October 2010. Accessed on 24 February 2011 at http://www.smartgrid.gov/projects.
Auto CRC (Cooperative Research Centre for Advanced Automotive Technology). 2010. “Automotive Australia 2020 Vision.” Melbourne, Australia.
Bae 2010. Bae, A. “The First Round Results from the Jeju Smart Grid Project in Korea.” Prepared for Pike Research. Boulder, CO.
Becker 2009. Becker T. and I. Sidhu. “Electric Vehicles in the United States: A New Model with Forecasts to 2030.” Prepared for the Center for Entrepreneurship and Technology, University of California, Berkeley. Berkeley, CA.
BCG 2009. Boston Consulting Group “The Comeback of the Electric Car: How Real, How Soon, and What Happens Next.” Boston, MA.
BNA 2010. CFE Preparing Smart Grid Pilot Tender – Minister. Prepared by Business News Americas. November 17, 2010. Accessed on 22 December 2010at http://www.elp.com/index/from-the-wires/wire_news_display/1305101286.html.
CCoCHK 2010. Panel on Environmental Affairs Special Meeting on 26 November 2010. Prepared by Canadian Chamber of Commerce, Hong Kong. Accessed on 21 December 2010 at http://gp.search.gov.hk/search?output=xml_no_dtd&client=depts&proxystylesheet=ogcio_home_adv_frontend&1292966927397=sessionid&site=default_collection&q=smart+grid&ui_lang=en&oe=utf8&filter=0.
CE 2009. Smart Grid: to Enable the Integration of Renewable Energy. CanmetENERGY, Natural Resources Canada. Accessed on 20 December 2010 at http://canmetenergy-canmetenergie.nrcan-rncan.gc.ca/eng/renewables/integration_der.html.
CE 2010. Smart Grid – Activities in Canada. Prepared by CanmetENERGY, Natural Resources Canada. Accessed on 20 December 2010 at http://canmetenergy-canmetenergie.nrcan-rncan.gc.ca/eng/renewables/integration_der/publications.html?2010-087.
CEA 2010. The Smart Grid: A Pragmatic Approach. Prepared by the Canadian Electricity Association. Accessed on 20 December 2010 at http://www.electricity.ca/.
Close 2010. Josie Close. Questions to Legco on the Government's Climate-change Strategies and Action Plan. 19 November 2010. Accessed on March 4, 2011 at http://www.legco.gov.hk/yr10-11/english/panels/ea/papers/ea1126cb1-538-10-e.pdf .
CLP 2010. CLP Hong Kong: Smart Grid. Accessed on December 21, 2010 at https://www.clp.com.hk/ourcompany/electricityjourney/powergrid/smartgrid/pages/smartgrid.aspx?lang=en.
6.3
CRA 2005. Applications of Dynamic Pricing in Developing and Emerging Economies. Prepared for The World Bank by Charles River and Associates. Accessed on 4 January 2011 at http://siteresources.worldbank.org/INTENERGY/Resources/ApplicationsofDynamicPricing.pdf.
CRIEPI 2010. Environmental Energy Technology website. Prepared by Central Research Institute of Electric Power Industry. Accessed on 21 December 2010 at http://criepi.denken.or.jp/en/activities/project/environmental.html.
Day 2010. Day, R. and P. Davies. “Accelerating the Uptake of Low Emission Vehicles in South Australia.” Presentation at the Electric Vehicle Seminar in Adelaide.” Adelaide, Australia. 2010.
DCPSC 2010. PowerCentsDCTM Program Final Report. Accessed on 13 January 2011 at http://www.dcpsc.org/pdf_files/hottopics/PowerCentsDC_Final_Report.pdf.
DRSG 2008. Demand Response and Smart Grid Coalition. 2008. Accelerating the Use of Demand Response and Smart Grid Technologies is an Essential Part of the Solution to America’s Energy, Economic and Environmental Problems. Accessed on 10 January 2011 at http://www.drsgcoalition.org/policy/index.html.
DEWHA 2009. Smart Grid, Smart City A New Direction for a New Energy Era. Prepared by Department of Environment, Water, Heritage and The Arts. 2009. Accessed on 14 December 2010 at www.ret.gov.au/energy/Documents/smart-grid/smartgrid-newdirection.pdf.
Eco-Business 2010. ADB President urges developing Asia to improve energy security, invest it solar. Accessed 10 January 2011 at http://www.eco-business.com/news/2010/dec/01/adb-president-urges-developing-asia-improve-energy/.
EISA 2007. Energy Independence and Security Act of 2007. Accessed on 23 December 2010 at http://frwebgate.access.gpo.gov/cgi-bin/getdoc.cgi?dbname=110_cong_bills&docid=f:h6enr.txt.pdf.
EMA 2010a. Intelligent Energy System Pilot Project kicks off in Singapore by the Energy Market Authority. 29 September 2010. Accessed on 23 December 2010at http://www.ema.gov.sg/news/view/212.
EMA 2010b. Intelligent Energy System Pilot Project kicks off in Singapore. Accessed on 16 March 2011 at: http://www.ema.gov.sg/news/view/212.
ENA 2010. National Strategy for Smart Electricity Networks. Prepared by Energy Networks Association. August 2010. Accessed on 17 December 2010 at http://share.aemo.com.au/smartmetering/Document%20library/Forms/AllItems.aspx?FolderCTID=&RootFolder=%2fsmartmetering%2fDocument%20library%2fSmart%20meter%20background%20info&SortField=Date%5fx0020%5fof%5fx0020%5fpublication&SortDir=Desc&View=%7b96731730%2d4358%2d4F11%2d8B5D%2d4E4CCDD0EA6D%7d.
EPRI 2008. The Green Grid: Energy Savings and Carbon Emissions Reductions Enabled by a Smart Grid. Prepared by Electric Power Research Institute. EPRI-1016905, EPRI, Palo Alto, California. Accessed on 23 March 2011 at http://my.epri.com/.
EPRI 2010a. IntelligridSM. Accessed on 23 December 2010 at http://intelligrid.epri.com/.
EPRI 2010b. Methodological Approach for Estimating the Benefits and Costs of Smart Grid Demonstration Projects. EPRI-1020342. Accessed on 13 January 2011 at http://my.epri.com/.
6.4
EPRI-NRDC 2007. “Environmental Assessment of Plug-In Hybrid Electric Vehicles – Volume 1: Nationwide Greenhouse Gas Emissions.” Prepared by Electric Power Research Institute and Natural Resources Defense Council. Palo Alto, California.
EU 2007. European Technology Platform SmartGrids: Strategic Research Agenda for Europe’s Electricity Networks of the Future. Directorate-General for Research: Energy. Accessed on 4 January 2011 at http://bookshop.europa.eu/is-bin/INTERSHOP.enfinity/WFS/EU-Bookshop-Site/en_GB/-/EUR/ViewPublication-Start?PublicationKey=KINA22580.
EU 2010, Smart Grid Roadmap. Accessed on March 16, 2011 at: www.iea.org/Papers/2010/SmartGrids_Roadmap_Foldout.pdf.
EWEA 2005. European Wind Energy Association, “Large Scale Integration of Wind Energy in the European Power Supply: analysis, issues and recommendation.” December 2005. Accessed 28 January 2011 at http://ewec2006.info/index.php?id=178.
FERC 2009. Smart Grid Policy. Docket No. PL09-4-000, Issued July 16, 2009. Accessed on 23 December 2010 at http://www.ferc.gov/whats-new/comm-meet/2009/071609/E-3.pdf.
FERC 2010. News Release: FERC approves transmission incentives for battery storage devices. United States Federal Energy Regulatory Commission. January 21, 2010, Docket No. EL10-19-000. Accessed 28 January 2010 at: www.ferc.gov/media/news-releases/2010/2010-1/01-21-10-E-6.pdf.
FERC 2011, “2010 Assessment of Demand Response and Advanced Metering Staff Report,” United States Federal Energy Regulatory Commission. February, 2011.
GE 2010. Smart Grid Survey: Majority Down Under Still Wonder. Accessed 23 March 2011 at http://www.gereports.com/smart-grid-survey-majority-down-under-still-wonder/.
GSGF 2010. Global Smart Grid Federation. Accessed 23 March 2011 at http://www.globalsmartgridfederation.org/.
Gish 2010. Gish BR and DM Adamson. FERC Grants Transmission Rate Incentives for Battery Storage Facilities. Davis Wright Tremaine, LLP. 25 January 2010. Accessed 28 January 2010 at http://www.dwt.com/LearningCenter/Advisories?find=187204.
Green Car Congress 2010. “Bloomberg New Energy Finance forecasts plug-in electric vehicles could account for up to 9% of US auto sales in 2020 and 22% in 2030.” Green Car Congress website last accessed on 14 January 2011 at http://www.greencarcongress.com/2010/11/bnef-20101102.html.
GridWise 2009. GridWise Alliance. Handbook for Assessing Smart Grid Projects. Accessed on 10 January 2011 at http://www.gridwise.org/resources_gwaresources.asp.
GWAC 2009a. Environmental Benefits of Interoperability: The Road to Maximizing Smart Grid’s Environmental Benefit, September 2009. Prepared for The GridWise® Architecture Council by E Source. Accessed 6 April 2011 at http://www.gridwiseac.org/pdfs/environmental_interoperability.pdf.
GWAC 2009b. Financial Benefits of Interoperability: How Interoperability in the Electric Power Industry Will Benefit Stakeholders Financially, September 2009. Prepared for The GridWise® Architecture Council by Harbor Research, Inc. Accessed 6 April 2011 at http://www.gridwiseac.org/pdfs/financial_interoperability.pdf.
6.5
GWAC 2009c. Reliability Benefits of Interoperability, September 2009. Prepared for The GridWise® Architecture Council by Alison Silverstein Consulting. Accessed 6 April 2011 at http://www.gridwiseac.org/pdfs/reliability_interoperability.pdf.
Hadley 2008. Hadley, S. and A. Tsvetkova. “Potential Impacts of Plug-In Hybrid Electric Vehicles on Regional Power Generation.” Prepared by the Oak Ridge National Laboratory for the US Department of Transportation, ORNL/TM-2007/150. Oak Ridge, TN.
Hemery 2008. Hemery E. and B. Smith. “Impact of Plug-In Hybrid Vehicles on the New Zealand Electric Grid.” Report Prepared for the New Zealand Electricity Commission.” Wellington, NZ.
Hodge 2010. Hodge, B-M. S. Huang, A. Shukla, J. Pekny and G. Reklaitis. “The Effects of Vehicle-To-Grid Systems on Wind Power Integration in California.” 20th European Symposium on Computer Aided Process Engineering- ESCAPE20. Accessed 14 January 2011 at: http://www.aidic.it/escape20/webpapers/122Hodge.pdf .
Huo 2010. Huo, H., Q. Zhang, M. Wang, D. Streets, and K. He. “Environmental Implications of Electric Vehicles in China.” Environment Science & Technology. Volume 44, pp. 4856-4861. Washington, D.C.
IEA 2010. International Energy Agency Statistics. Accessed on 29 June 2010 at http://www.iea.org/stats/index.asp.
IEE 2011, Faruqui, Ahmad, Lisa Wood, “The Benefits of Smart Meters,” Edison Foundation’s Institute for Electric Efficiency (IEE) report prepared by The Brattle Group, February, 2011. Accessed on 24 March 2011 at www.brattle.com.
ISGAN 2010, Clean Energy Ministerial, Fact Sheet: Internal Smart Grid Action Network. Accessed on 17 February 2011 at: http://www.cleanenergyministerial.org/ISGAN/.
JSCA 2010. “What’s JSCA” (Japan Smart Community Alliance). Prepared by New Energy and Industrial Technology Development Organization of Japan. Accessed on 17 December 2010 at http://www.smart-japan.org/english/tabid/103/Default.aspx.
Karplus 2009. Karplus, V., S. Paltsev, and J. Reilly. 2009. “Prospects for Plug-In Hybrid Electric Vehicles in the United States and Japan: A General Equilibrium Analysis.” Prepared for the Massachusetts Institute of Technology (MIT) Joint Program on the Science and Policy of Global Change. Cambridge, Massachusetts.
KEPCO 2008: Korean Electric Power Corporation (KEPCO). www.kepco.co.kr .
KSGI 2010a. Korea Smart Grid Institute. “Korea’s Smart Grid Roadmap: Roadmap Implementation in Five Sectors.” Seoul, South Korea. Accessed last on 22 January 2011 at http://www.smartgrid.or.kr/10eng4-1.php.
KSGI 2010b. Korea Smart Grid Institute. Investment Plan for Roadmap Implementation. Accessed 19 January 2011 http://www.smartgrid.or.kr/10eng4-2.php.
KSGI 2011. Korea Smart Grid Institute and Ministry of Knowledge Economy. “For the World’s Green Growth: Jeju Smart Grid Test-bed in Korea.” Seoul, South Korea. Accessed 4 March 2011 at http://www.smartgrid.or.kr/10eng3-1.php
6.6
LBNL 2001. Eto, J., et al, “Scoping Study on Trends in the Economic Value of Electricity Reliability to the US Economy,” Lawrence Berkeley National Laboratory, LBNL-47911, June, 2001.
Levy 2005. Establishing the AMI Business Case Framework. Presentation prepared by Levy Associates. 2005. Accessed on 13 January 2010 at http://sites.energetics.com/MADRI/pdfs/levy_050405.pdf.
Lin 2010. Lin, Z. and D. Greene. “A Plug-in Hybrid Consumer Choice Model with Detailed Market Segmentation.” 2010. Prepared for the 2010 Transportation Research Board Winter Meeting. Oak Ridge, TN.
Logica 2010. 2010 Australian Smart Grid Study. Prepared by Logica. Accessed on 5 January 2011 at http://www.logica.com.au/we-are-logica/media-centre/case-studies/logica-smart-grid-study/.
Masiello 2010. Masiello, R., D. Hackett, J. Harrison, E. Ungar, H. Mueller, C. Meadows et al. Assessment of Plug-In Electric Vehicle Integration with ISO/RTO Systems. Prepared for the RSO/ITO Council by KEMA Inc. and Taratec Corporation. March 2010. Accessed on 14 January 2011 at http://www.isorto.org/site/c.jhKQIZPBImE/b.2604461/k.F287/Documents.htm.
MDPSC 2010. Order No. 83571 for Case No. 9207. Accessed on 13 January 2010 at http://webapp.psc.state.md.us.
MEC 2010a. Energy News. Prepared by Malaysia Energy Commission (Suruhanjaya Tenaga). Accessed on 23 December 2010 at http://www.st.gov.my/index.php?option=com_content&view=category&id=794&Itemid=4244&lang=en&limitstart=50.
MEC 2010b. Energy News: No Target For Malaysia To Be In Smart Grid Era For Now Says, Cired. Prepared by Malaysia Energy Commission (Suruhanjaya Tenaga). Accessed on 23 December 2010 at http://www.st.gov.my/index.php?option=com_content&view=article&id=5366%3Ano-target-for-malaysia-to-be-in-smart-grid-era-for-now-says-cired&catid=794%3Aenergy-news&Itemid=1201&lang=en.
MEF 2009. Major Economies Forum on Energy and Climate. December 2009. Technology Action Plan: Smart Grids. Prepared by Italy and Korea in consultation with MEF Partners. Accessed 23 December 2010 at http://www.majoreconomiesforum.org/.
METI 2010a. The Strategic Energy Plan of Japan. Prepared by the Japan Ministry of Economy, Trade and Industry. Accessed on 21 December 2010 at http://www.meti.go.jp/english/press/data/20100618_08.html.
METI 2010b. Announcement of Master Plans for the Demonstration of Next-Generation Energy and Social Systems. Prepared by the Japan Ministry of Economy, Trade, and Industry: Smart Community. Accessed on 21 December 2010 at http://www.meti.go.jp/english/press/data/20100811_01.html.
METI 2010c. Smart Community (Image). Prepared by the Japan Ministry of Economy, Trade, and Industry: Smart Community. Accessed on 21 December 2010 at http://www.meti.go.jp/english/policy/energy_environment/smart_community/index.html.
Microsoft 2010.Worldwide Utilities Industry Survey 2010. Prepared by Microsoft Utilities Industry Group. Accessed on 4 January 2011 at http://www.microsoft.com/presspass/presskits/industries/manufacturing/docs/WorldwideSurvey2010.pdf.
6.7
MOF-ESC 2010. Ensuring Energy Resilience and Sustainable Growth. Prepared by the Economic Strategies Subcommittee. Accessed on 23 December 2010at http://app.mof.gov.sg/esc.aspx.
NARUC 2010. Smart Grid Resources. Accessed on 23 December 2010at http://www.naruc.org/SmartGrid/.
NAW 2010. Pilot Project Seeks to Expand Use of Wind Energy. North American Windpower, Source: Iberdrola Renewables Inc. September 23, 2010. Accessed 17 January 2011 at http://www.nawindpower.com/e107_plugins/content/content_lt.php?content.6589.
NETL 2009. A Vision for the Smart Grid. Prepared by the National Energy Technology Laboratory for the US Department of Energy. Accessed on 23 December 2010 at http://www.netl.doe.gov/smartgrid/referenceshelf/whitepapers/Whitepaper_The%20Modern%20Grid%20Vision_APPROVED_2009_06_18.pdf.
NIST 2010. NIST & the Smart Grid. Accessed on 23 December 2010 at http://www.nist.gov/smartgrid/nistandsmartgrid.cfm.
NIST 2010a. NIST Framework and Roadmap for Smart Grid Interoperability Standards, Release 1.0. Accessed on 25 March 2011 at: http://www.nist.gov/smartgrid/.
NSMP 2010. AMI Pilot Project: Phase 1 - AMI Data and Systems Integration for Market Settlement and Billing Report. Prepared by Energy Australia. March 2010. Accessed on 17 December 2010 at http://share.aemo.com.au/smartmetering/Document%20library/Forms/AllItems.aspx?RootFolder=%2fsmartmetering%2fDocument%20library%2fPilots%20and%20Trials%20Status%20Reports&FolderCTID=&View=%7b96731730%2d4358%2d4F11%2d8B5D%2d4E4CCDD0EA6D%7d.
NZEC 2009. Advanced Metering Infrastructure in New Zealand: Roll-out and Requirements. Prepared by the New Zealand Electricity Commission. December 2009. Accessed on 29 April 2011 at http://www.ea.govt.nz/document/8914/download/industry/market/metering/advanced-metering/
NZMED 2010. Developing Our Energy Potential: Draft New Zealand Energy Strategy and the Draft New Zealand Energy Efficiency and Conservation Strategy. Published by the New Zealand Ministry of Economic Development. July 2010. ISBN 978-0-478-35862-9. Accessed on 29 April 2011 at http://www.med.govt.nz/upload/73919/Developing Our Energy Potential July 2010.pdf
OECD/IEA 2010. http://www.iea.org/Papers/2010/SmartGrids_Roadmap_Foldout.pdf .
ORACLE 2010. Smart Grid Challenges & Choices: Utility Executives' Vision for the New Decade. Accessed on 4 January 2011 at http://landingpad.oracle.com/webapps/dialogue/ns/dlgwelcome.jsp?p_ext=Y&p_dlg_id=8610558&src=6778341&Act=70.
PEA 2011. The Smart Grid Roadmap for PEA, Accessed on 28 March 2011 at http://www.pea.co.th/th/annoucment/annouce_indetail.php?NID=2852.
PEPCO 2009. Proposal for Advanced Metering Infrastructure. Accessed on 13 January 2011 at http://webapp.psc.state.md.us/Intranet/CaseNum/NewIndex3_VOpenFile.cfm?filepath=%5C%5CColdfusion%5CEWorkingGroups%5CDRDG%5C%5CPHI%20AMI-DR-Conservation%5CAMI%5CMD%20Working%20Group%207-28-09%20AMI%20Deck.ppt.
6.8
PHDOE 2009. Philippines to receive 250M USD from the Clean Technology Fund. Accessed on 23 March 2011 at: http://www.doe.gov.ph/news/2009-12-04-CTF.htm.
Pike 2010a. Electric Vehicle Charging Equipment. Pike Research, Boulder, Colorado.
Pike 2010b. “Smart Grid Technologies”, Pike Research report, December, 2010. Accessed on 24 March 2011 at: http://www.pikeresearch.com/research/smart-grid-technologiesPike 2011. “Smart Meters in Asia Pacific,” Pike Research report, February, 2011. Accessed on 24 March at http://www.pikeresearch.com/research/smart-meters-in-asia-pacific.
Potter 2009. Potter, CW, A Archambault, and K Westrick. Building a Smarter Smart Grid Through Better Renewable Energy Information. IEEE Power Systems Conference and Exposition 2009, Seattle, Washington. March 2009.
PNNL 2007. Hammerstrom, DJ, et al. Pacific Northwest GridWise Testbed Demonstration Projects. PNNL-17167. Prepared by PNNL for USDOE. 2007.
PNNL 2008. Balducci, P. “Plug-In Hybrid Electric Vehicle Market Penetration Scenarios.” Pacific Northwest National Laboratory, PNNL-17441. Richland, WA.
PNNL. 2010. Pratt, RG, PJ Balducci, C Gerkensmeyer, S Katipamula, MCW Kintner-Meyer, TF Sanquist, KP Schneider, TJ Secrest. The Smart Grid: An Estimation of the Energy and CO2 Benefits. Pacific Northwest National Laboratory, Richland, Washington. January 2010. Accessed on 24 March 2011 at http://www.pnl.gov/main/publications/external/technical_reports/PNNL-19112.pdf.
PRP 2010. Smart Grid Overview. Prepared by Viet Nam Power Resource Partners Corporation. Accessed on 23 December 2010 at http://vietnamprp.com/prp/en/news-and-events/smart-grid.html.
REA 2010. Smart Grid & Innovation Development of the Russian Energy Sector, Alexey Konev, Director, Innovations, Russian Energy Agency. Presented at the Russian/American Smart Grid Partnership Initiative: Smart Grid Workshop, Washington DC, Accessed 23 December 2010 at http://www.usea.org/programs/russian-american-smart-grid-workshop.html.
Renewables 2010. Renewables 2010 Global Status Report, REN21 Secretariat, Paris. Accessed on 14 March 2011 at http://www.ren21.net/Portals/97/documents/GSR/REN21_GSR_2010_full_revised%20Sept2010.pdf.
RET 2010. Smart Grid, Smart City. Australian Government Department of Resources, Energy and Tourism. Accessed on 14 December 2011 at http://www.ret.gov.au/energy/energy%20programs/smartgrid/pages/default.aspx.
Rohmund 2008. Ingrid Rohmund, Greg Wikler, Ahmand Faruqui, Omar Siddiqui, and Rick Tempchin “Assessment of Achievable Potential for Energy Efficiency and Demand Response in the US (2010-2030)”. 2008 ACEEE Summer Study on Energy Efficiency in Buildings. Accessed on 23 March 2011 at http://www.edisonfoundation.net/IEE/reports/Rohmund.pdf.
Scott 2007. Scott M., M. Kintner-Meyer, D. Elliott, and W. Warwick. 2007. “Economic Assessment and Impacts Assessment of Plug-In Hybrid Vehicles on Electric Utilities and Regional US Power Grids.” Online Journal of EUEC 1: Paper #05.
6.9
SENER 2010. Intelligent Networks Are A Tool To Move To An Economy Of Low Carbon: G. Kessel. Prepared by the Mexican Secretary of Energy (SENER). Accessed on 22 December 2010 at http://www.energia.gob.mx/portal/Default.aspx?id=1787.
SEON 2010. To Make Electricity Smart. Prepared by Smart Energy Observation Net. Accessed on 21 December 2010 at http://www.chinaero.com.cn/english/specialist_viewpoints/index.shtml.
SGA2010. Smart Grid R&D Roadmap for Australia. Prepared by Smart Grid Australia (SGA) Research Working Group. November 2010. Accessed on 24 February 2011 at http://www.smartgridaustralia.com.au/.
SGCC 2009. State Grid Corporation of China, “Strengthened Smart Grid Plan,” May 21, 2009. Accessed 22 March 2011 at: www.sgcc.com.cn.
SGCC 2010. State Grid Corporation of China. Liu Zhenya, President of SGCC Gives Keynote Speech at World Energy Congress. Strong and Smart Grid: the Driving Force to Energy Reform in the 21st Century. October 12, 2010. Accessed on 21 December 2010 at http://www.sgcc.com.cn/ywlm/mediacenter/corporatenews/index.shtml.
SGCC 2011. State Grid Corporation of China website. Accessed on 8 February 2011 at http://www.sgcc.com.cn/ywlm/index.shtml.
SGN 2010a. Smart Grid Newsletter. "Smart Grid Technology" and "Knowledge of Smart Grid" published in Beijing. Accessed on 21 December 2010 at http://www.sgcc.com.cn/ywlm/mediacenter/corporatenews/index.shtml.
SGN 2010b. Smart Grid Newsletter. First Smart Community Demonstration Project by North China Power Grid Company Completed. Prepared by State Grid News. Accessed on 21 December 2010at http://www.sgcc.com.cn/ywlm/mediacenter/corporatenews/.
Simpson 2009. Simpson, A. “Environmental Attributes of Electric Vehicles in Australia.” 2009. Prepared for the Curtin University Sustainability Policy Institute. Perth, Australia.
SGMM 2010, Smart Grid Maturity Model Update, October 2010, Software engineering Institute, Carnegie Mellon University. Assessed on 16 March 2011 at www.sei.cmu.edu/library/assets/brochures/SGMM-1010.pdf.
Star 2010. ERC drafts rules on smart grid technology. Philippine Star. Accessed from Philippine Star website on 23 March 2011 at http://www.philstar.com/Article.aspx?articleid=635537.
Sullivan 2009. Sullivan, J., I. Salmeen, and C. Simon. PHEV Marketplace Penetration An Agent Based Simulation. Prepared by the University of Michigan Transportation Research Institute for the US Department of Energy, UMTRI-2009-32. Ann Arbor, MI.
Sustainable Business 2008. Duke, Progress Energy Jin PHEV Trail, Assessed on 22 March 2011 at: http://www.sustainablebusiness.com/index.cfm/go/news.display/id/17066.
Taipower 2010. Taiwan Power Company Sustainability Report 2010: Corporate Governance and Economy. Prepared by Taiwan Power Company. Accessed on 23 March 2011 at: www.taipower.com.tw/TaipowerWeb//upload/files/4/991005-08.pdf.
6.10
TSGSU 2010. Smart Grid Smart Utility Forum 2010. Accessed on 23 December 2010 at http://www.thailandsmartgrid.com/index.php.
USAID 2010. The Smart Grid Vision for India's Power Sector, A White Paper. Accessed on 4 February 2011 at http://www.sari-energy.org/PageFiles/What_We_Do/activities/smart_grid_vision_for_india_power_sector_june_2010/White_paper-Th_%20Smart_Grid_Vision_for_India/White_Paper_on_the_Smart_Grid_Vision_for_India_-_final.pdf.
USDOE 2003. “GRID 2030 A National Vision for Electricity’s Second 100 Years.” Accessed on 23 December 2010 at http://www.oe.energy.gov/information_center/documents.htm.
USDOE 2009. Smart Grid System Report, a report to Congress from the US Secretary of Energy. June 2009, Accessed 6 April 2011 at http://www.oe.energy.gov/DocumentsandMedia/SGSRMain_090707_lowres.pdf.
USDOE 2010a. Smart Grid Research & Development Multi-Year Program Plan. Accessed on 23 December 2010 at http://www.oe.energy.gov/DocumentsandMedia/SG_MYPP.pdf.
USDOE 2010b. Modernizing the Electric Grid. Accessed on 23 December 2010 at http://www.energy.gov/recovery/smartgrid.htm.
USDOE 2010c. “Annual Energy Outlook 2010. Supplemental Tables 57 and 58. US Department of Energy, Washington, D.C.
USDOE 2010d. The Recovery Act: Transforming America’s Transportation Sector – Batteries and Electric Vehicles. US Department of Energy, Washington, D.C. Accessed 22 October 2010 at http://www.whitehouse.gov/files/documents/Battery-and-Electric-Vehicle-Report-FINAL.pdf.
USDOE 2011a. US Department of Energy Office of Electricity Delivery and Energy Reliability. Accessed on 4 February 2011 at http://www.oe.energy.gov/american_recovery_reinvestment_act.htm.
USDOE 2011b. US Department of Energy Federal Smart Grid Task Force. Accessed on 07 February 2011 at http://www.smartgrid.gov/teams.
Wald 2010. Wald, ML. “Breaking Out of the Wind Ghetto.” The New York Times, New York, New York. September 23, 2010. Accessed on 17 January 2011 at http://green.blogs.nytimes.com/2010/09/23/breaking-out-of-a-wind-ghetto/.
WEF 2009. Accelerating Smart Grid Investments. Prepared by the World Economic Forum and Accenture. Accessed on 4 January 2011 at http://www.weforum.org/reports/accelerating-smart-grid-investments.
ZPRYME 2011. China: Rise of the Smart Grid, Special Report by Zpryme’s Smart Grid Insights. Accessed on 8 February 2011 at http://www.zpryme.com/SmartGridInsights/China_Rise_of_the_Smart_Grid_January_2011_Zpryme_Research.pdf.
Appendix A
APEC Smart Grid Survey Form


A.1

A.2
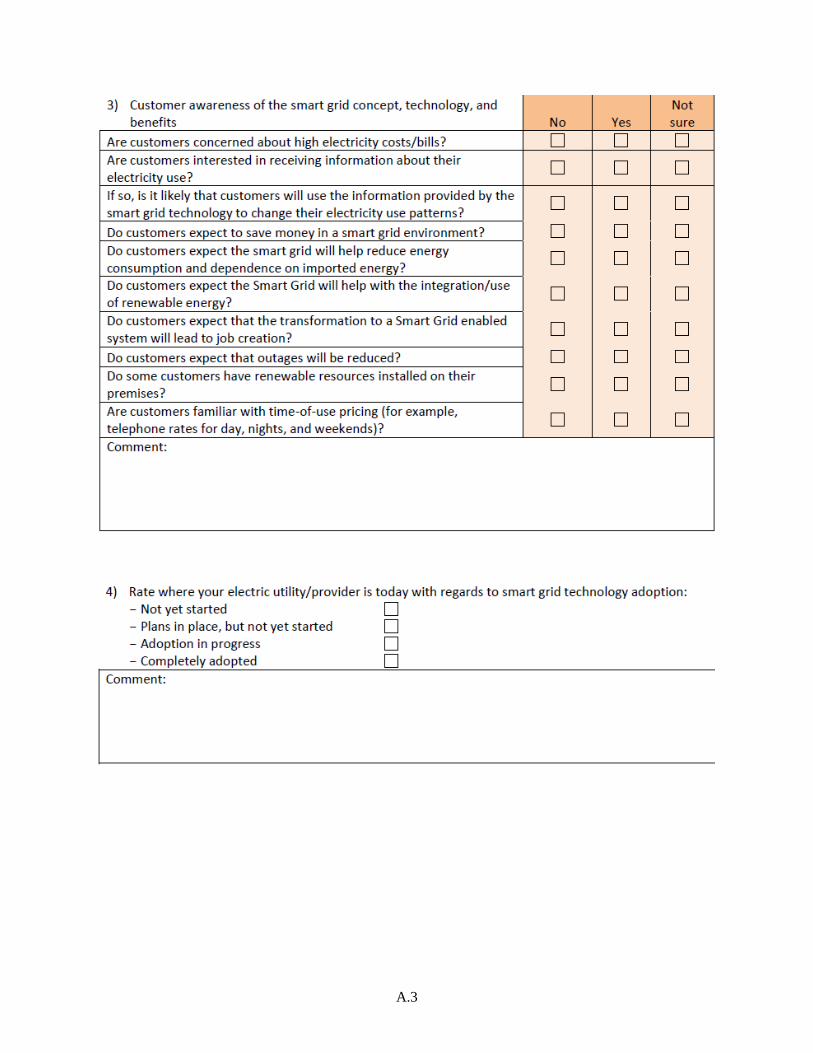
A.3
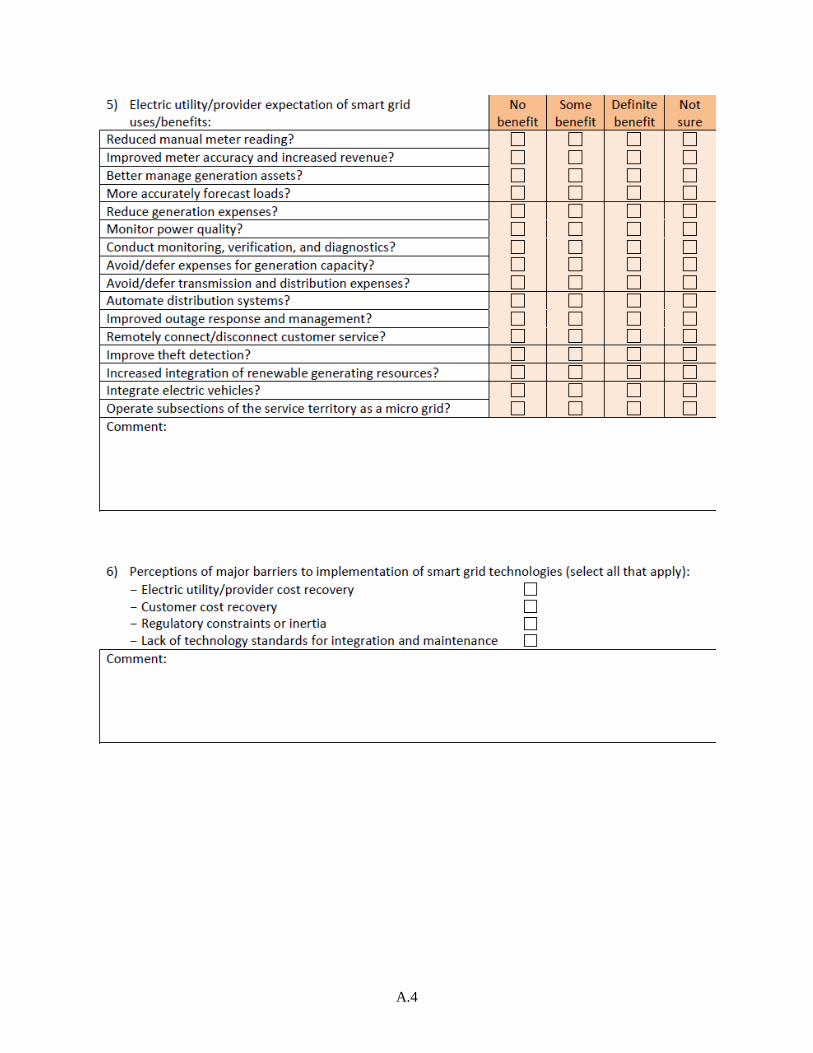
A.4
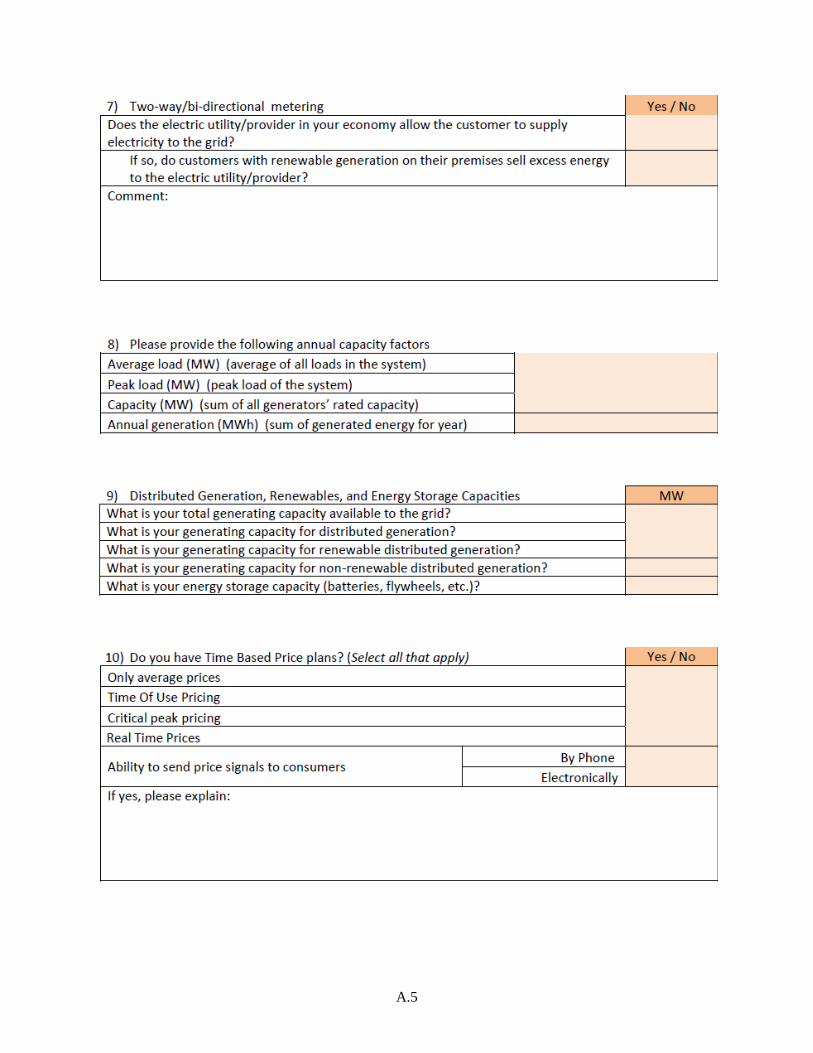
A.5
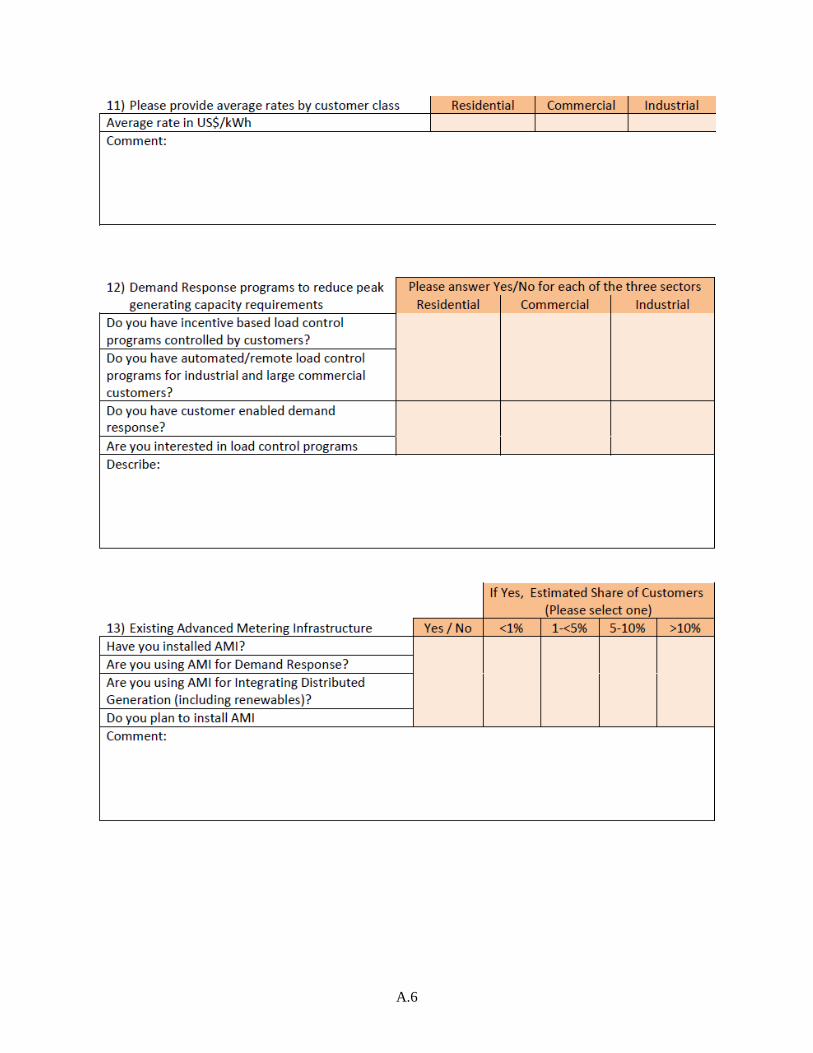
A.6
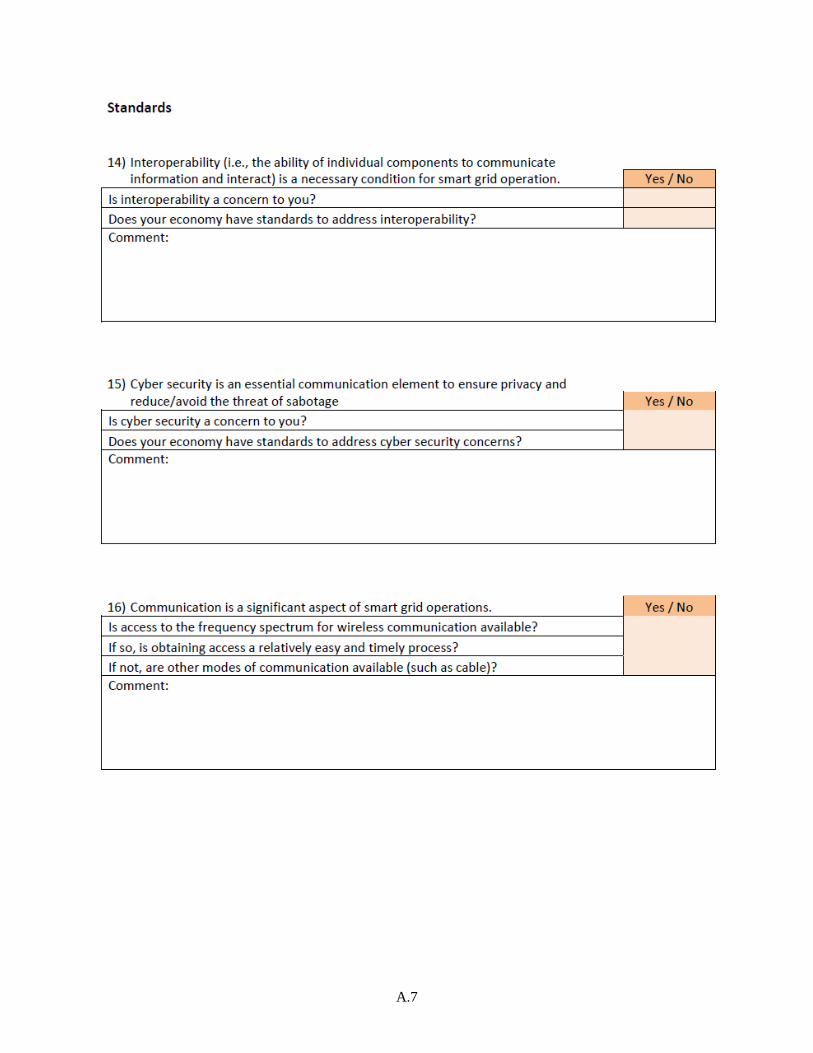
A.7

A.8
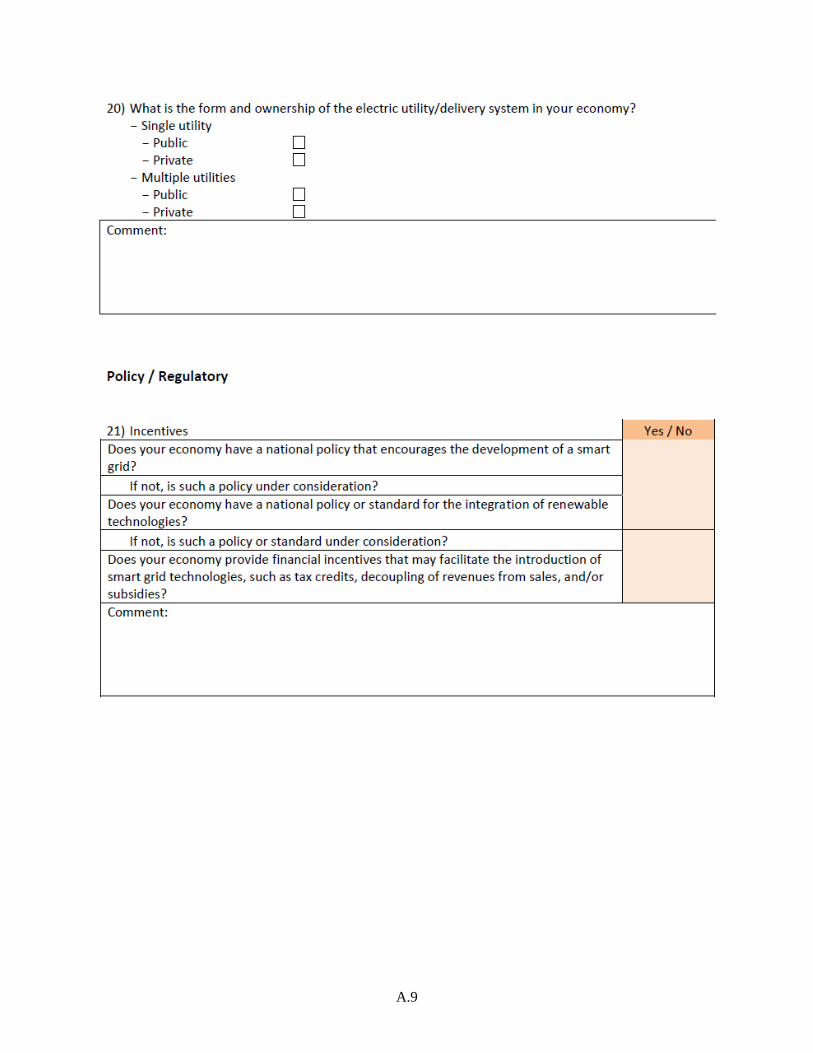
A.9

A.10
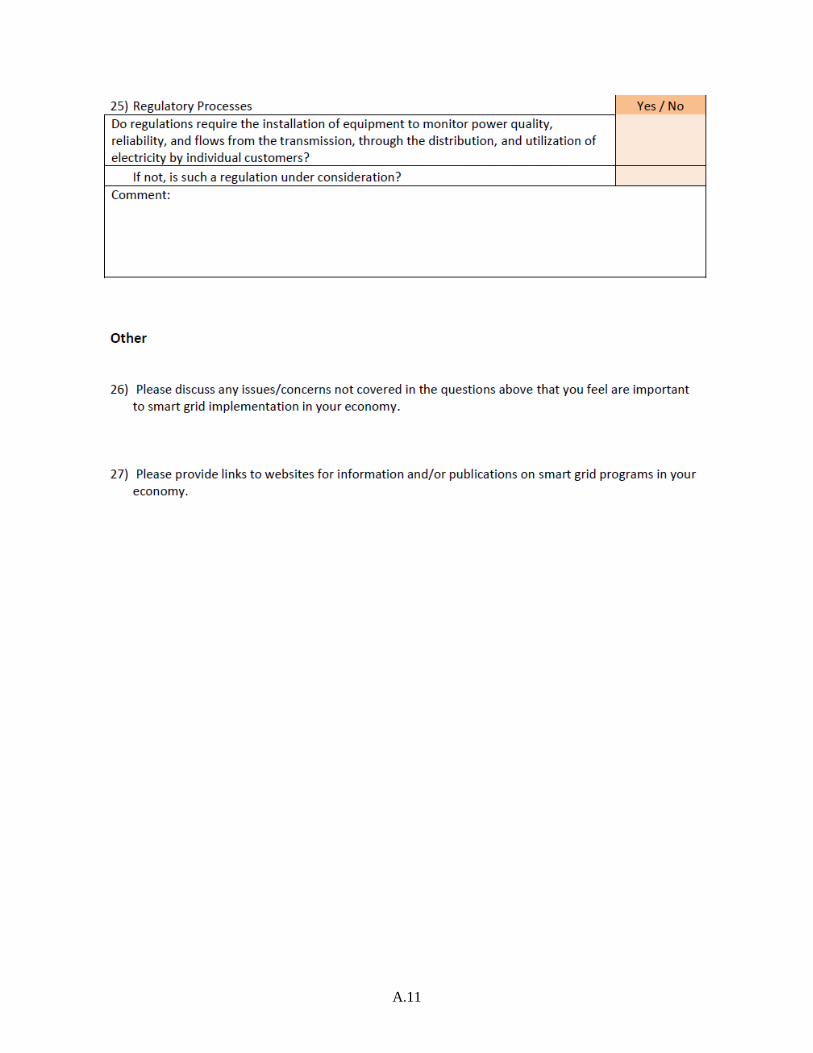
A.11
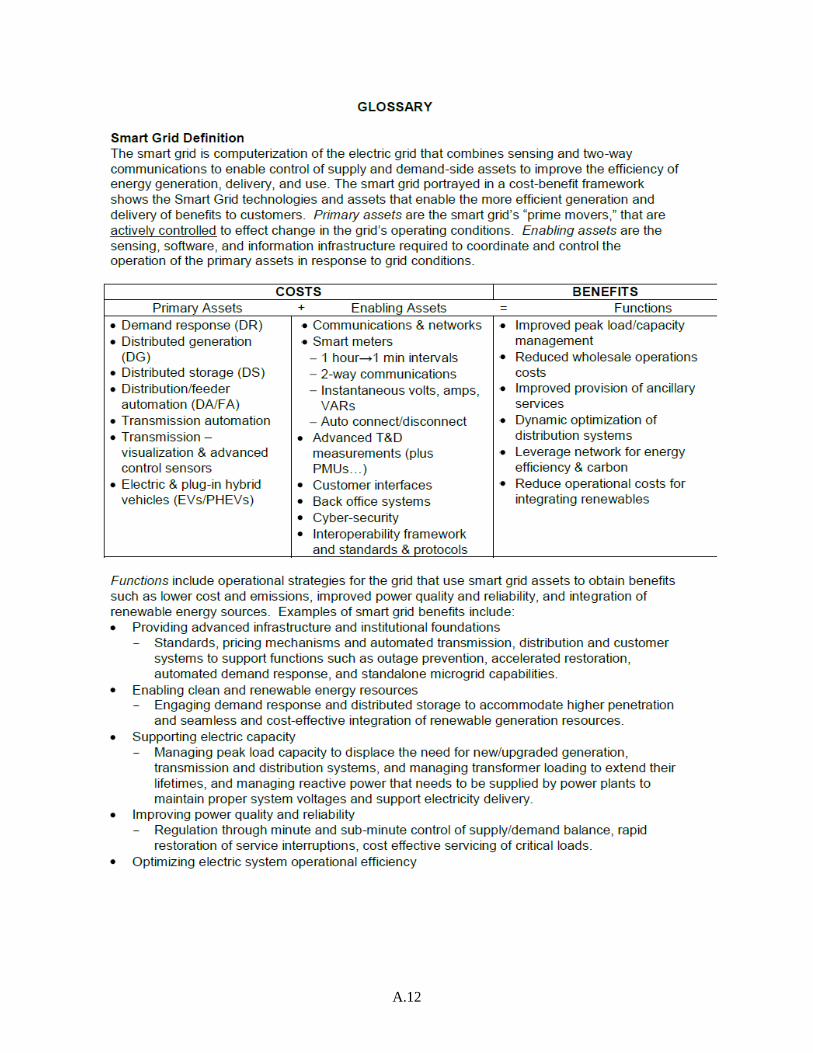
A.12

A.13
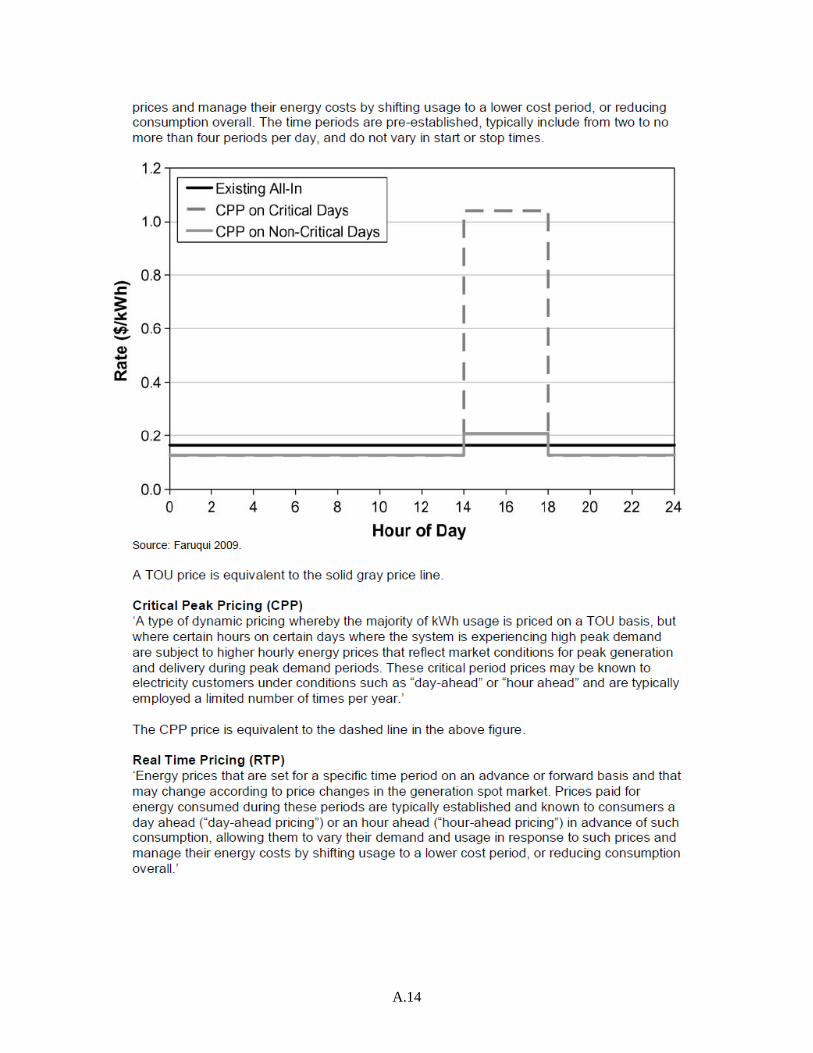
A.14
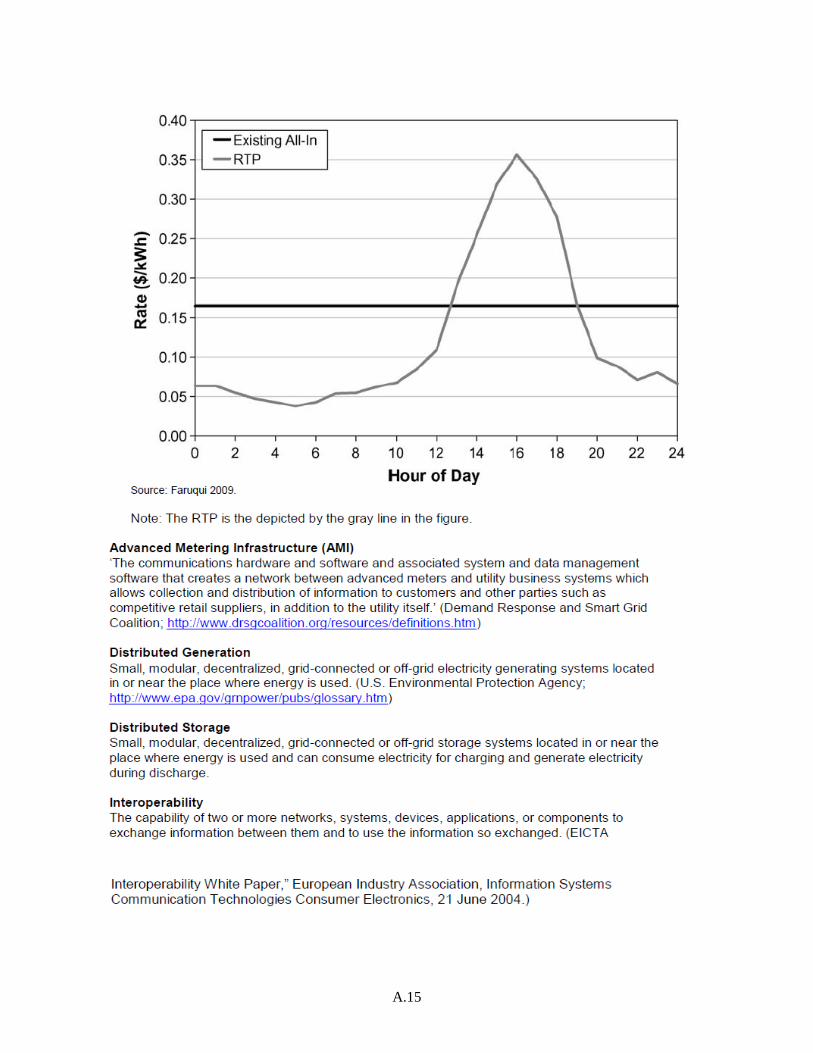
A.15


Appendix B
Summary Survey Results

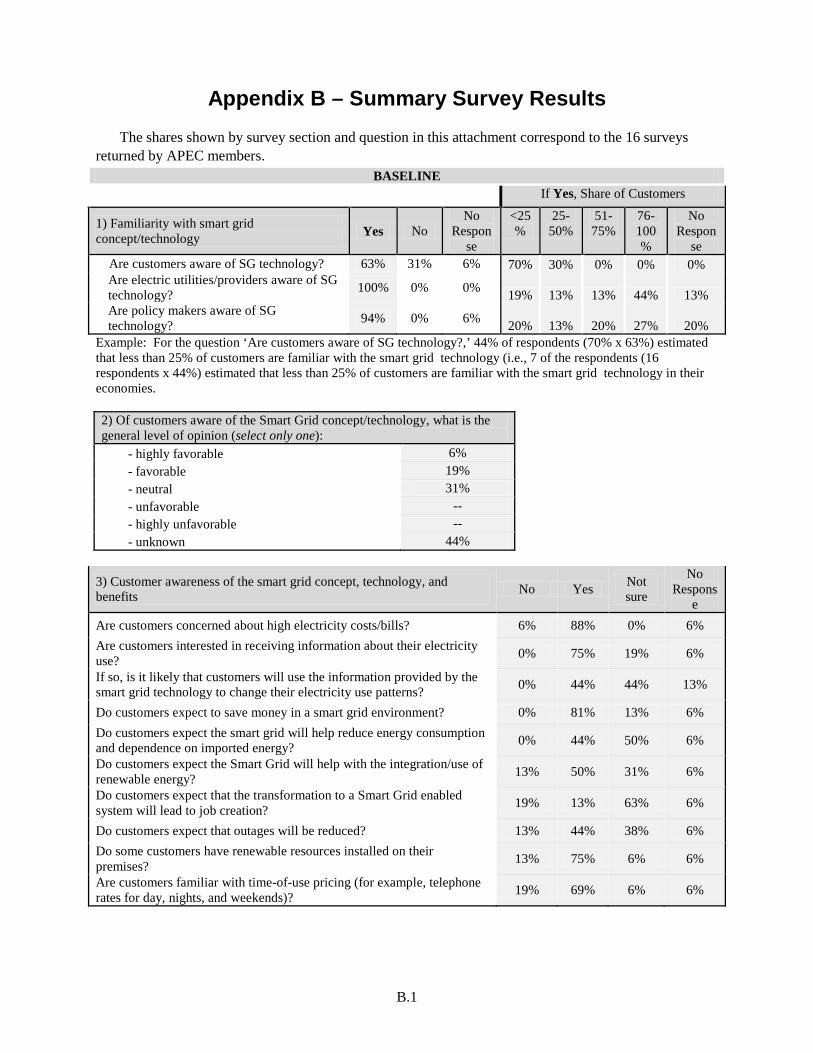
B.1
Appendix B – Summary Survey Results The shares shown by survey section and question in this attachment correspond to the 16 surveys
returned by APEC members. BASELINE
If Yes, Share of Customers
1) Familiarity with smart grid concept/technology Yes No
No Respon
se
<25%
25-50%
51-75%
76-100%
No Respon
se Are customers aware of SG technology? 63% 31% 6% 70% 30% 0% 0% 0% Are electric utilities/providers aware of SG technology? 100% 0% 0% 19% 13% 13% 44% 13% Are policy makers aware of SG technology? 94% 0% 6% 20% 13% 20% 27% 20%
Example: For the question ‘Are customers aware of SG technology?,’ 44% of respondents (70% x 63%) estimated that less than 25% of customers are familiar with the smart grid technology (i.e., 7 of the respondents (16 respondents x 44%) estimated that less than 25% of customers are familiar with the smart grid technology in their economies. 2) Of customers aware of the Smart Grid concept/technology, what is the general level of opinion (select only one):
- highly favorable 6% - favorable 19% - neutral 31% - unfavorable -- - highly unfavorable -- - unknown 44%
3) Customer awareness of the smart grid concept, technology, and benefits No Yes Not
sure
No Respons
e Are customers concerned about high electricity costs/bills? 6% 88% 0% 6% Are customers interested in receiving information about their electricity use? 0% 75% 19% 6%
If so, is it likely that customers will use the information provided by the smart grid technology to change their electricity use patterns? 0% 44% 44% 13%
Do customers expect to save money in a smart grid environment? 0% 81% 13% 6% Do customers expect the smart grid will help reduce energy consumption and dependence on imported energy? 0% 44% 50% 6%
Do customers expect the Smart Grid will help with the integration/use of renewable energy? 13% 50% 31% 6%
Do customers expect that the transformation to a Smart Grid enabled system will lead to job creation? 19% 13% 63% 6%
Do customers expect that outages will be reduced? 13% 44% 38% 6% Do some customers have renewable resources installed on their premises? 13% 75% 6% 6%
Are customers familiar with time-of-use pricing (for example, telephone rates for day, nights, and weekends)? 19% 69% 6% 6%
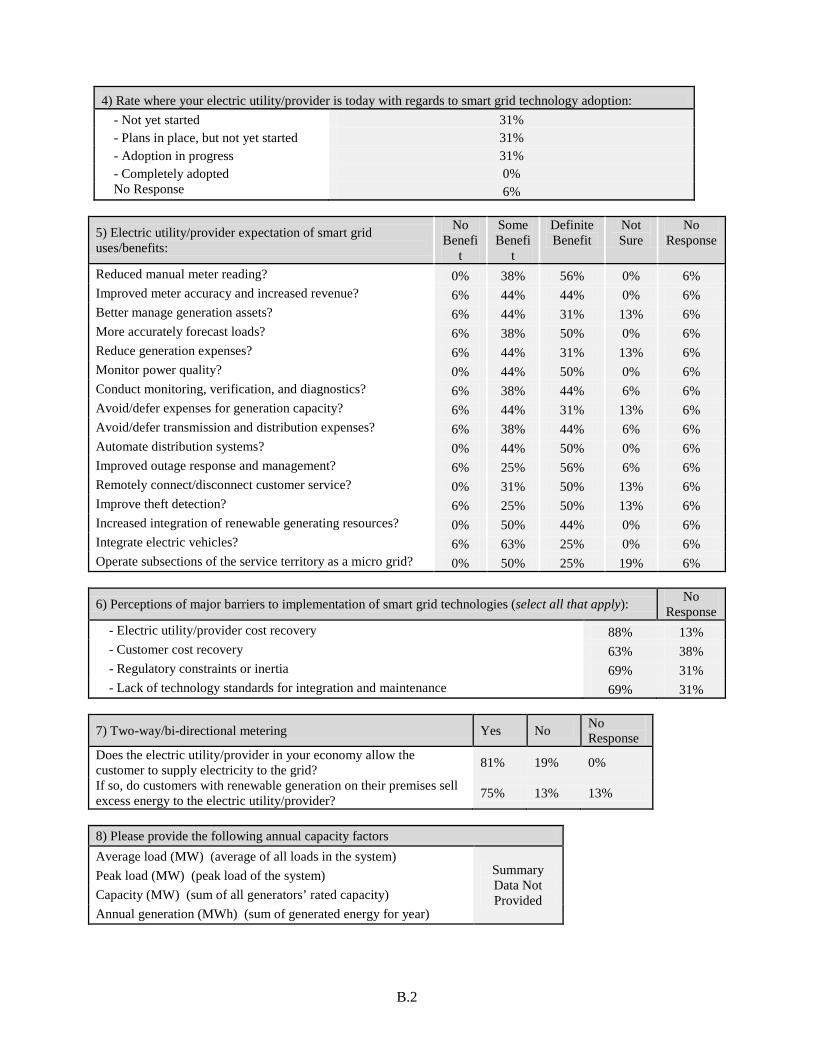
B.2
4) Rate where your electric utility/provider is today with regards to smart grid technology adoption: - Not yet started 31% - Plans in place, but not yet started 31% - Adoption in progress 31% - Completely adopted 0% No Response 6%
5) Electric utility/provider expectation of smart grid uses/benefits:
No Benefi
t
Some Benefi
t
Definite Benefit
Not Sure
No Response
Reduced manual meter reading? 0% 38% 56% 0% 6% Improved meter accuracy and increased revenue? 6% 44% 44% 0% 6% Better manage generation assets? 6% 44% 31% 13% 6% More accurately forecast loads? 6% 38% 50% 0% 6% Reduce generation expenses? 6% 44% 31% 13% 6% Monitor power quality? 0% 44% 50% 0% 6% Conduct monitoring, verification, and diagnostics? 6% 38% 44% 6% 6% Avoid/defer expenses for generation capacity? 6% 44% 31% 13% 6% Avoid/defer transmission and distribution expenses? 6% 38% 44% 6% 6% Automate distribution systems? 0% 44% 50% 0% 6% Improved outage response and management? 6% 25% 56% 6% 6% Remotely connect/disconnect customer service? 0% 31% 50% 13% 6% Improve theft detection? 6% 25% 50% 13% 6% Increased integration of renewable generating resources? 0% 50% 44% 0% 6% Integrate electric vehicles? 6% 63% 25% 0% 6% Operate subsections of the service territory as a micro grid? 0% 50% 25% 19% 6%
6) Perceptions of major barriers to implementation of smart grid technologies (select all that apply): No Response
- Electric utility/provider cost recovery 88% 13% - Customer cost recovery 63% 38% - Regulatory constraints or inertia 69% 31% - Lack of technology standards for integration and maintenance 69% 31%
7) Two-way/bi-directional metering Yes No No Response
Does the electric utility/provider in your economy allow the customer to supply electricity to the grid? 81% 19% 0%
If so, do customers with renewable generation on their premises sell excess energy to the electric utility/provider? 75% 13% 13%
8) Please provide the following annual capacity factors Average load (MW) (average of all loads in the system)
Summary Data Not Provided
Peak load (MW) (peak load of the system) Capacity (MW) (sum of all generators’ rated capacity) Annual generation (MWh) (sum of generated energy for year)
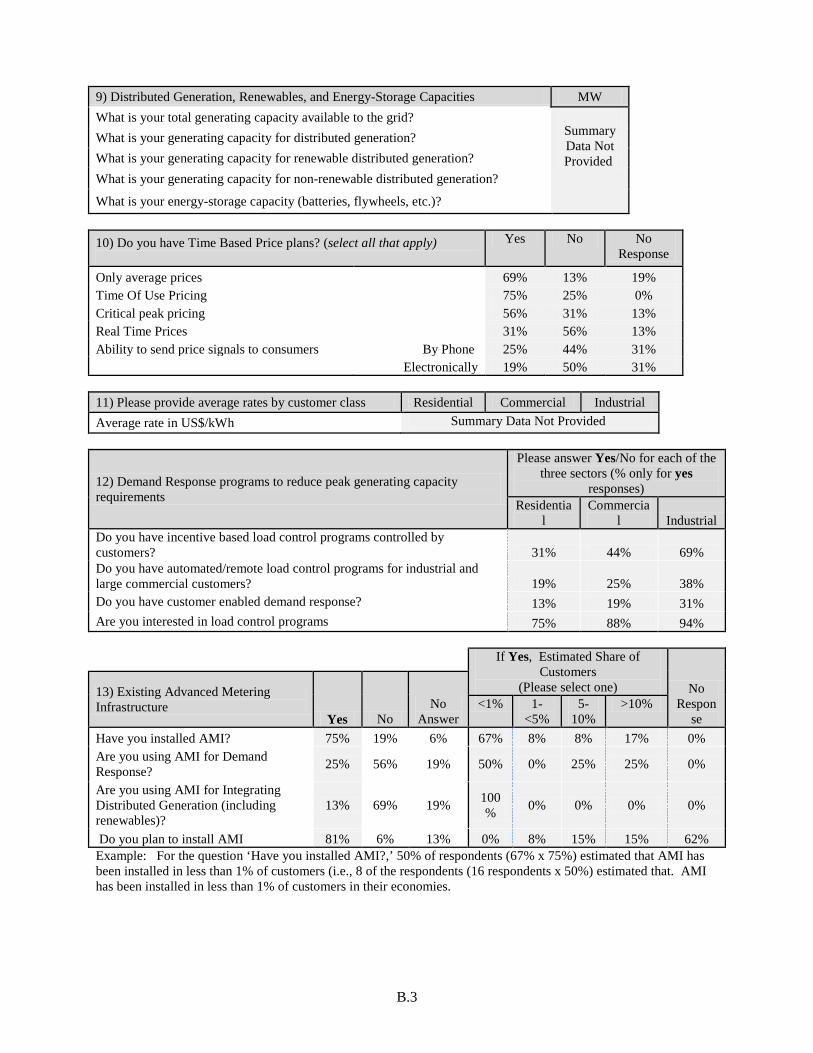
B.3
9) Distributed Generation, Renewables, and Energy-Storage Capacities MW What is your total generating capacity available to the grid?
Summary Data Not Provided
What is your generating capacity for distributed generation? What is your generating capacity for renewable distributed generation? What is your generating capacity for non-renewable distributed generation?
What is your energy-storage capacity (batteries, flywheels, etc.)? 10) Do you have Time Based Price plans? (select all that apply)
Yes No No Response
Only average prices 69% 13% 19% Time Of Use Pricing 75% 25% 0% Critical peak pricing 56% 31% 13% Real Time Prices 31% 56% 13% Ability to send price signals to consumers By Phone 25% 44% 31% Electronically 19% 50% 31% 11) Please provide average rates by customer class Residential Commercial Industrial Average rate in US$/kWh Summary Data Not Provided
12) Demand Response programs to reduce peak generating capacity requirements
Please answer Yes/No for each of the three sectors (% only for yes
responses) Residentia
l Commercia
l Industrial Do you have incentive based load control programs controlled by customers? 31% 44% 69% Do you have automated/remote load control programs for industrial and large commercial customers? 19% 25% 38% Do you have customer enabled demand response? 13% 19% 31% Are you interested in load control programs 75% 88% 94%
If Yes, Estimated Share of Customers
(Please select one) No Respon
se
13) Existing Advanced Metering Infrastructure
Yes No No
Answer <1% 1-
<5% 5-
10% >10%
Have you installed AMI? 75% 19% 6% 67% 8% 8% 17% 0% Are you using AMI for Demand Response? 25% 56% 19% 50% 0% 25% 25% 0%
Are you using AMI for Integrating Distributed Generation (including renewables)?
13% 69% 19% 100% 0% 0% 0% 0%
Do you plan to install AMI 81% 6% 13% 0% 8% 15% 15% 62% Example: For the question ‘Have you installed AMI?,’ 50% of respondents (67% x 75%) estimated that AMI has been installed in less than 1% of customers (i.e., 8 of the respondents (16 respondents x 50%) estimated that. AMI has been installed in less than 1% of customers in their economies.
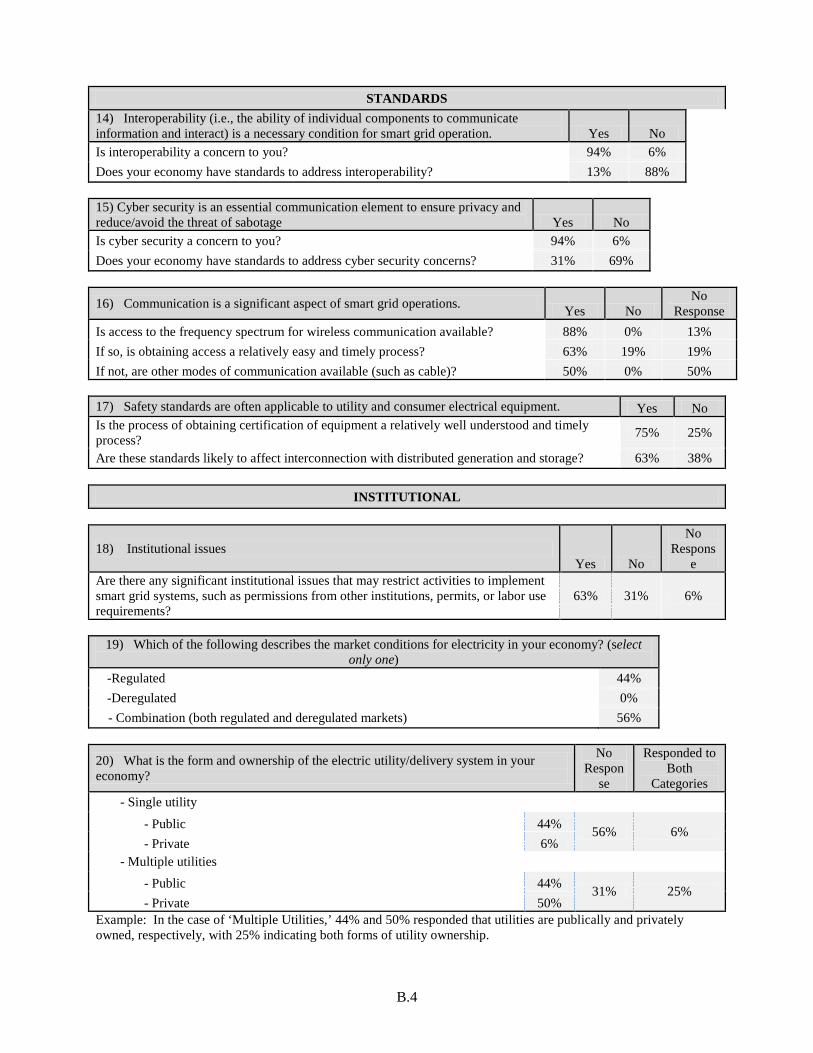
B.4
STANDARDS 14) Interoperability (i.e., the ability of individual components to communicate information and interact) is a necessary condition for smart grid operation. Yes No Is interoperability a concern to you? 94% 6% Does your economy have standards to address interoperability? 13% 88% 15) Cyber security is an essential communication element to ensure privacy and reduce/avoid the threat of sabotage Yes No Is cyber security a concern to you? 94% 6% Does your economy have standards to address cyber security concerns? 31% 69%
16) Communication is a significant aspect of smart grid operations. Yes No No
Response Is access to the frequency spectrum for wireless communication available? 88% 0% 13% If so, is obtaining access a relatively easy and timely process? 63% 19% 19% If not, are other modes of communication available (such as cable)? 50% 0% 50% 17) Safety standards are often applicable to utility and consumer electrical equipment. Yes No Is the process of obtaining certification of equipment a relatively well understood and timely process? 75% 25%
Are these standards likely to affect interconnection with distributed generation and storage? 63% 38%
INSTITUTIONAL
18) Institutional issues Yes No
No Respons
e Are there any significant institutional issues that may restrict activities to implement smart grid systems, such as permissions from other institutions, permits, or labor use requirements?
63% 31% 6%
19) Which of the following describes the market conditions for electricity in your economy? (select
only one) -Regulated 44% -Deregulated 0% - Combination (both regulated and deregulated markets) 56%
20) What is the form and ownership of the electric utility/delivery system in your economy?
No Respon
se
Responded to Both
Categories - Single utility
- Public 44% 56% 6% - Private 6%
- Multiple utilities - Public 44% 31% 25% - Private 50%
Example: In the case of ‘Multiple Utilities,’ 44% and 50% responded that utilities are publically and privately owned, respectively, with 25% indicating both forms of utility ownership.
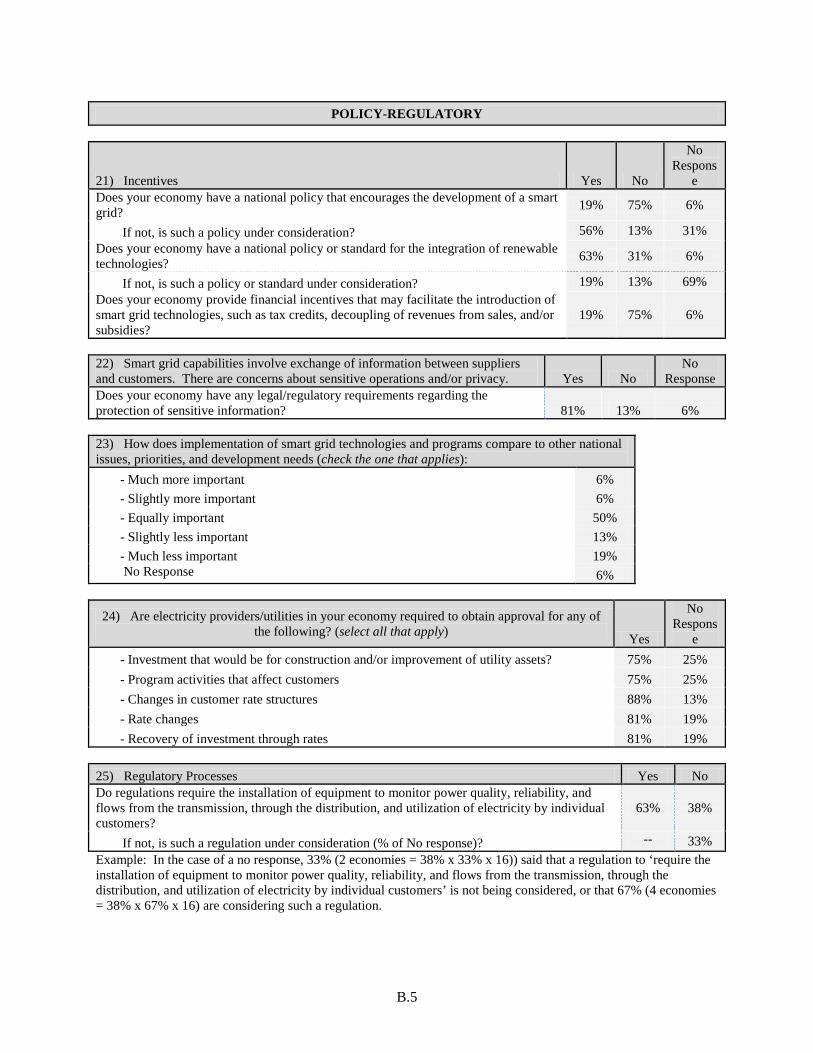
B.5
POLICY-REGULATORY
21) Incentives Yes No
No Respons
e Does your economy have a national policy that encourages the development of a smart grid? 19% 75% 6%
If not, is such a policy under consideration? 56% 13% 31% Does your economy have a national policy or standard for the integration of renewable technologies? 63% 31% 6%
If not, is such a policy or standard under consideration? 19% 13% 69% Does your economy provide financial incentives that may facilitate the introduction of smart grid technologies, such as tax credits, decoupling of revenues from sales, and/or subsidies?
19% 75% 6%
22) Smart grid capabilities involve exchange of information between suppliers and customers. There are concerns about sensitive operations and/or privacy. Yes No
No Response
Does your economy have any legal/regulatory requirements regarding the protection of sensitive information? 81% 13% 6% 23) How does implementation of smart grid technologies and programs compare to other national issues, priorities, and development needs (check the one that applies):
- Much more important 6% - Slightly more important 6% - Equally important 50% - Slightly less important 13% - Much less important 19% No Response 6%
24) Are electricity providers/utilities in your economy required to obtain approval for any of the following? (select all that apply) Yes
No Respons
e - Investment that would be for construction and/or improvement of utility assets? 75% 25% - Program activities that affect customers 75% 25% - Changes in customer rate structures 88% 13% - Rate changes 81% 19% - Recovery of investment through rates 81% 19%
25) Regulatory Processes Yes No Do regulations require the installation of equipment to monitor power quality, reliability, and flows from the transmission, through the distribution, and utilization of electricity by individual customers?
63% 38%
If not, is such a regulation under consideration (% of No response)? -- 33% Example: In the case of a no response, 33% (2 economies = 38% x 33% x 16)) said that a regulation to ‘require the installation of equipment to monitor power quality, reliability, and flows from the transmission, through the distribution, and utilization of electricity by individual customers’ is not being considered, or that 67% (4 economies = 38% x 67% x 16) are considering such a regulation.


Produced for: APEC Secretariat 35 Heng Mui Keng Terrace Singapore 119616 Tel: (65) 68919-600 Fax: (65) 68919-690 E-mail: [email protected] Website: www.apec.org © 2011 APEC Secretariat APEC# 211-RE-01.2 PNNL-20389