using ‘‘statement of intermediate balances’’ · pdf fileof...
TRANSCRIPT
USING ‘‘STATEMENT OF
INTERMEDIATE BALANCES’’ AS
TOOL FOR INTERNATIONAL
FINANCIAL STATEMENT
ANALYSIS IN AIRLINE INDUSTRY
C. Richard Baker, Yuan Ding and Herve Stolowy
ABSTRACT
Since September 11, 2001 and during the ensuing economic slowdown, a
number of airline companies have experienced significant financial dif-
ficulties, including bankruptcies and near bankruptcies. In an economic
setting where many airlines are struggling to achieve or maintain prof-
itability, it is important for accountants, auditors, and financial analysts
to be able to analyze the relative performance of such companies. In this
industry, income statements are normally prepared ‘‘by nature’’ rather
than ‘‘by function.’’ This differs from the usual presentation found in the
income statements of many companies around the world, in particular
most American companies. This paper demonstrates how to perform a
comparative financial statement analysis when an income statement is
prepared ‘‘by nature,’’ through application of a tool called the ‘‘Statement
Advances in International Accounting
Advances in International Accounting, Volume 18, 169–198
Copyright r 2005 by Elsevier Ltd.
All rights of reproduction in any form reserved
ISSN: 0897-3660/doi:10.1016/S0897-3660(05)18009-X
169
C. RICHARD BAKER ET AL.170
of Intermediate Balances.’’ This tool is illustrated using three companies
chosen from different continents: Southwest Airlines, a low cost U.S. air
carrier, Air France, the leader in Europe, and China Eastern Airlines, one
of the biggest Chinese air carriers.
INTRODUCTION
Income statements (also known as ‘‘statements of operations’’ or ‘‘profitand loss accounts’’) can be presented in a manner that reflects two possibleclassifications of expenses, that is: ‘‘by nature’’ or ‘‘by function.’’ In the firstcase, expenses are organized into categories like purchases, salaries, depre-ciation, rent, etc. In the second case, expenses are divided into ‘‘functions’’like: selling and marketing, administration and general, research and de-velopment, etc. By tradition, or following local regulations, different coun-tries may be more comfortable or more familiar with one of these twomethods. For example, the ‘‘by function’’ form of presentation is wellknown in North America, while the ‘‘by nature’’ presentation is practicedin several European countries such as Italy, Spain, and France. In a par-ticular country where one format is more practiced, the ‘‘alternative’’ formatmay not be familiar to the ‘‘financial community’’ (not only to financialanalysts and investors, but also to academics and students). The mainobjective of this paper is to present a tool, called the ‘‘Statement of Inter-mediate Balances’’ (SIB), which is especially tailored to analyze an incomestatement presented ‘‘by nature.’’ Despite a common belief that there isessentially one format for the income statement, an analysis of financialstatements and annual reports on an international basis indicates thatincome statements presented ‘‘by nature’’ are widespread and are found,even in countries where the format ‘‘by function’’ is the general rule (orpractice).
The airline industry provides particular evidence of the usefulness of theSIB because, in this sector, income statements are normally prepared ‘‘bynature’’ rather than ‘‘by function.’’ In this paper, we will illustrate the use ofthe SIB by studying three companies chosen from different continents:Southwest Airlines Co. (‘‘Southwest’’ in the rest of the chapter), a low costU.S. air carrier, Air France, the leader in Europe (and now in the world,after completion of the merger with KLM), and China Eastern Airlines(‘‘China Eastern’’), one of the biggest Chinese air carriers.
Using ‘‘Statement of Intermediate Balances’’ 171
INCOME STATEMENTS ‘‘BY NATURE’’ AND
‘‘BY FUNCTION’’
Presentation
An income statement is intended to report how a company’s financial andoperating performance was achieved during a particular period. Such state-ments reflect the revenues and expenses of an enterprise during a period anddisplay the net income for the period. Net income is typically the remainderafter all expenses have been deducted from revenues and is a measure of thewealth generated by an economic entity (i.e. the net increase to stockholders’equity) during an accounting period.
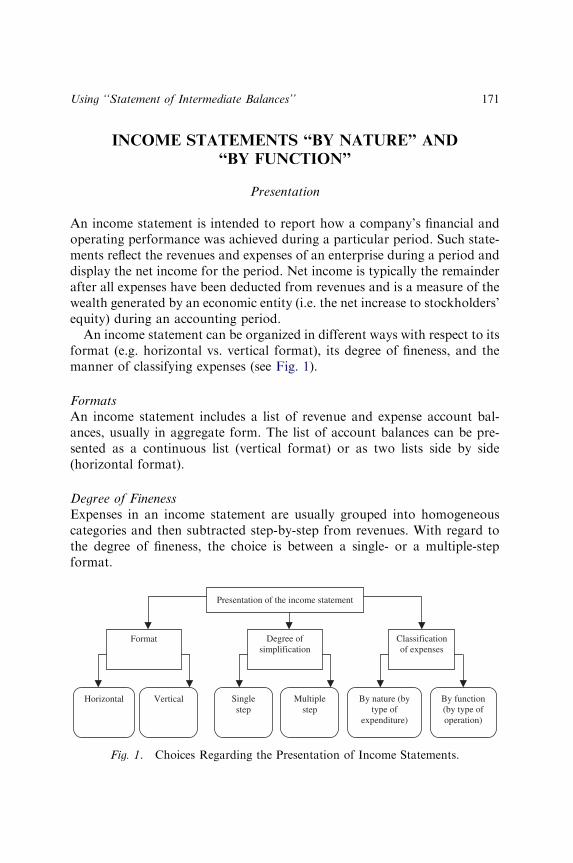
An income statement can be organized in different ways with respect to itsformat (e.g. horizontal vs. vertical format), its degree of fineness, and themanner of classifying expenses (see Fig. 1).
Formats
An income statement includes a list of revenue and expense account bal-ances, usually in aggregate form. The list of account balances can be pre-sented as a continuous list (vertical format) or as two lists side by side(horizontal format).
Degree of Fineness
Expenses in an income statement are usually grouped into homogeneouscategories and then subtracted step-by-step from revenues. With regard tothe degree of fineness, the choice is between a single- or a multiple-stepformat.
Presentation of the income statement
Degree of simplification
Single step
Multiple step
By nature (bytype of
expenditure)
Classification of expenses
Format
Horizontal Vertical By function (by type of operation)
Fig. 1. Choices Regarding the Presentation of Income Statements.
C. RICHARD BAKER ET AL.172
Single step. This is the simplest version for an income statement. All rev-enues are grouped into one category and all expenses are grouped intoanother category. Expenses are then subtracted from revenues. A variationof this format can be seen, whereby all operating revenues are followed byall operating expenses. This permits the determination of operating income.Afterward, several sub levels of earnings may be presented (e.g. incomebefore income tax, net income). This type of format is still considered to be asingle-step format because the essential elements of the income statement(i.e. operating revenues and operating expenses) are presented separately.
Multiple step. In a multiple-step format, the revenue and expense categoriesare paired in a manner that highlights various sub components of net in-come (e.g. gross profit, operating income, income from continuing opera-tions). The multiple-step format is the most common format used inbusiness reporting because it is considered to be more informative than thesingle-step approach (see for more details, Kieso, Weygandt, & Warfield,2001, p. 132).
Classification of Expenses
The distinction between classifying expenses ‘‘by nature’’ or ‘‘by function’’ isnot addressed in U.S. GAAP (Generally Accepted Accounting Principles),even though U.S. government regulations do address this distinction. TheInternational Accounting Standards Board (IASB) has specifically ad-dressed the distinction between ‘‘by nature’’ and ‘‘by function’’ expenseclassification, by stating that:
Expenses are subclassified to highlight components of financial performance that may
differ in terms of frequency, potential for gain or loss and predictability. This analysis is
provided in one of two forms [‘‘by nature’’ or ‘‘by function’’] (IASB, 2003, par. 90).
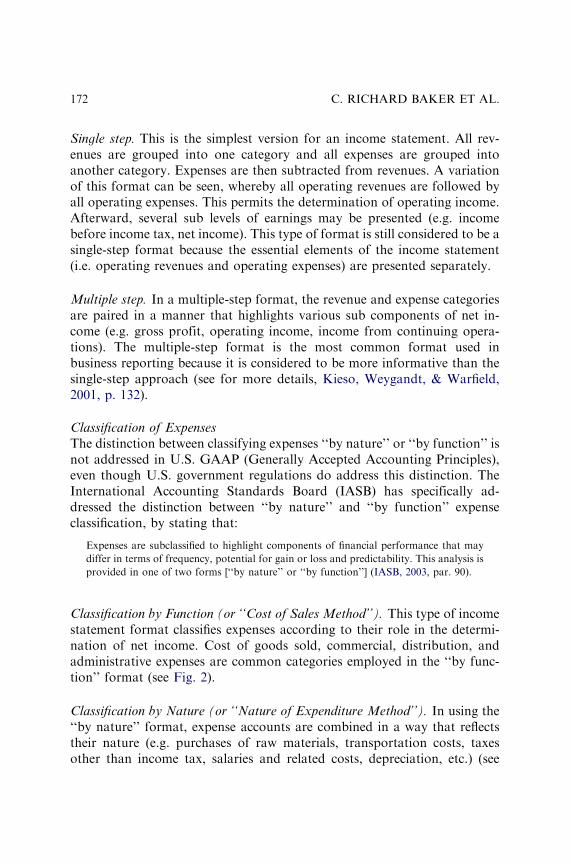
Classification by Function (or ‘‘Cost of Sales Method’’). This type of incomestatement format classifies expenses according to their role in the determi-nation of net income. Cost of goods sold, commercial, distribution, andadministrative expenses are common categories employed in the ‘‘by func-tion’’ format (see Fig. 2).
Classification by Nature (or ‘‘Nature of Expenditure Method’’). In using the‘‘by nature’’ format, expense accounts are combined in a way that reflectstheir nature (e.g. purchases of raw materials, transportation costs, taxesother than income tax, salaries and related costs, depreciation, etc.) (see
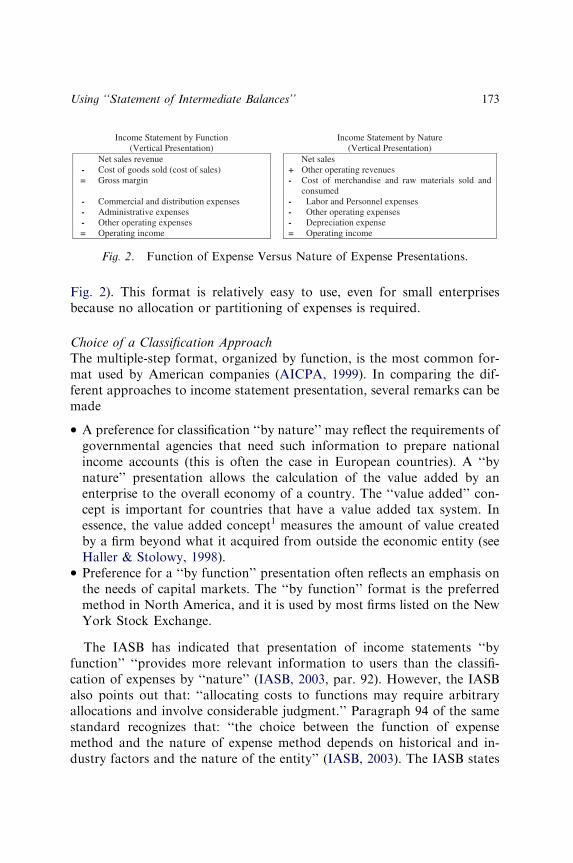
Income Statement by Function (Vertical Presentation)
Income Statement by Nature (Vertical Presentation)
Net sales revenue Net sales - Cost of goods sold (cost of sales) + Other operating revenues = Gross margin - Cost of merchandise and raw materials sold and
consumed - Commercial and distribution expenses - Labor and Personnel expenses - Administrative expenses - Other operating expenses - Other operating expenses - Depreciation expense = Operating income = Operating income
Fig. 2. Function of Expense Versus Nature of Expense Presentations.
Using ‘‘Statement of Intermediate Balances’’ 173
Fig. 2). This format is relatively easy to use, even for small enterprisesbecause no allocation or partitioning of expenses is required.
Choice of a Classification Approach
The multiple-step format, organized by function, is the most common for-mat used by American companies (AICPA, 1999). In comparing the dif-ferent approaches to income statement presentation, several remarks can bemade
�
A preference for classification ‘‘by nature’’ may reflect the requirements ofgovernmental agencies that need such information to prepare nationalincome accounts (this is often the case in European countries). A ‘‘bynature’’ presentation allows the calculation of the value added by anenterprise to the overall economy of a country. The ‘‘value added’’ con-cept is important for countries that have a value added tax system. Inessence, the value added concept1 measures the amount of value createdby a firm beyond what it acquired from outside the economic entity (seeHaller & Stolowy, 1998).�
Preference for a ‘‘by function’’ presentation often reflects an emphasis onthe needs of capital markets. The ‘‘by function’’ format is the preferredmethod in North America, and it is used by most firms listed on the NewYork Stock Exchange.The IASB has indicated that presentation of income statements ‘‘byfunction’’ ‘‘provides more relevant information to users than the classifi-cation of expenses by ‘‘nature’’ (IASB, 2003, par. 92). However, the IASBalso points out that: ‘‘allocating costs to functions may require arbitraryallocations and involve considerable judgment.’’ Paragraph 94 of the samestandard recognizes that: ‘‘the choice between the function of expensemethod and the nature of expense method depends on historical and in-dustry factors and the nature of the entity’’ (IASB, 2003). The IASB states

C. RICHARD BAKER ET AL.174
that ‘‘each method of presentation has merit for different types of entities’’(IASB, 2003, par. 94).
Compared to the classification ‘‘by function,’’ the format ‘‘by nature’’ is adisaggregated format, with more items disclosed, and the related risk ofrevealing potential inside information to competitors. The trade-offs be-tween positive and negative aspects of disaggregation are an issue. However,as the format of the income statement is highly standardized in the airlineindustry (see below), competitors are on a more even playing field.
Reasons for Adoption of ‘‘By Nature’’ Format in Airline Industry
The search for explanations concerning the prevalence of the ‘‘by nature’’format in the U.S. airline industry is difficult because the origin of thisformat is not stated explicitly in companies’ annual reports. Some expla-nations for the ‘‘by nature’’ format have been obtained by contacting theinvestor relations departments at several U.S. airline companies and byperforming a search of regulations issued by the U.S. Department ofTransportation (DOT).
Airline accounting in the U.S. is determined in part by the UniformSystem of Accounts and Reports (USAR) issued by the U.S. DOT (DOT,2002). Pursuant to DOT regulations: ‘‘all profit and loss elements are ac-counted for within specific objective accounts, which are descriptive of bothbasic areas of financial activity, or functional operation, and objectiveserved’’ (DOT, 2002, USAR, part 241, sections 1–3). The USAR envisionstwo types of classification; one by function (or financial activity) and one bynature (or objective). Section 7 of the USAR includes a ‘‘chart of profit andloss accounts’’ employing an ‘‘objective classification of profit and losselements,’’ including:
�
Transport revenues (passenger, mail, property, charter, other), � Transport-related revenues and expenses (in-flight sales, restaurant andfood service (ground), rents, limousine servicey),�
Transport expenses (pilots and copilots, other flight personnel, mainte-nance labory, traffic commissions, general services purchased, landingfees, maintenance materials, passenger food expense, provisions for ob-solescence and deteriorationy).The USAR states that: ‘‘The profit and loss accounts are designed toreflect, through natural groupings, the elements entering into the derivationof income or loss’’ (our emphasis) (USAR, part 141, section 8). This
Using ‘‘Statement of Intermediate Balances’’ 175
regulation provides some explanation of why U.S. airlines report their in-come statement ‘‘by nature.’’ However, we have been unable to locate anofficial explanation concerning why the ‘‘by nature’’ format has arisen inthe U.S. in the airline industry. We hypothesize that this choice was madebecause the ‘‘by nature’’ format provides a higher degree of detail bydisclosing more expense items and is therefore more useful for decisionmaking.
In France, regulations relating to consolidated financial statements(Anonymous, 1999, par. 410) allow companies to choose between the‘‘by nature’’ and ‘‘by function’’ models. However, for non-consolidated fi-nancial statements (all legal entities in France are required to prepare sep-arate financial statements prepared in accordance with the GeneralAccounting Plan – ‘‘Plan Comptable General’’), the presentation ‘‘by na-ture’’ is required, given the influence of the national income accounting inFrance. The requirement of the ‘‘by nature’’ format for non-consolidatedfinancial statements may explain why this format is the most commonlyused in France for consolidated financial statements. In the case of AirFrance, despite the choice mentioned above regarding consolidated financialstatements, the income statement is presented ‘‘by nature.’’ This might beexplained by the tradition in favor of this format and also by a sort ofmimetic behavior, given the fact that virtually all airline companies in theworld have adopted the ‘‘by nature’’ format for their income statements (seebelow).
In China, after the accounting reforms of 1992, the income statementformat for all Chinese companies (whether listed or not) is very close to theU.S. one, i.e. a multiple-step format organized ‘‘by function.’’ However,companies with listed shares on exchanges outside of China are required toprepare their financial statements in accordance with IASB, which, as men-tioned above, authorize both formats. In the case of China Eastern Airlines,the choice of ‘‘by nature’’ presentation for their expenses could also be amimetic practice in order to follow foreign competitors in the airline in-dustry.
While our analysis of the financial statements of airline companies is notcomprehensive, if we exclude the three studied companies, we did find thatin the U.S., American Airlines, Continental Airlines, Delta Air Lines,Northwest Airlines, and United Airlines have adopted the ‘‘by nature’’ for-mat. In other countries, Air Canada, Japan Airlines, and LanChile, tomention a few examples, also prepare their income statements ‘‘by nature.’’This format is therefore the dominant practice in the air transport industryon a worldwide basis.
C. RICHARD BAKER ET AL.176
PRESENTATION OF STATEMENT OF
INTERMEDIATE BALANCES
Principles
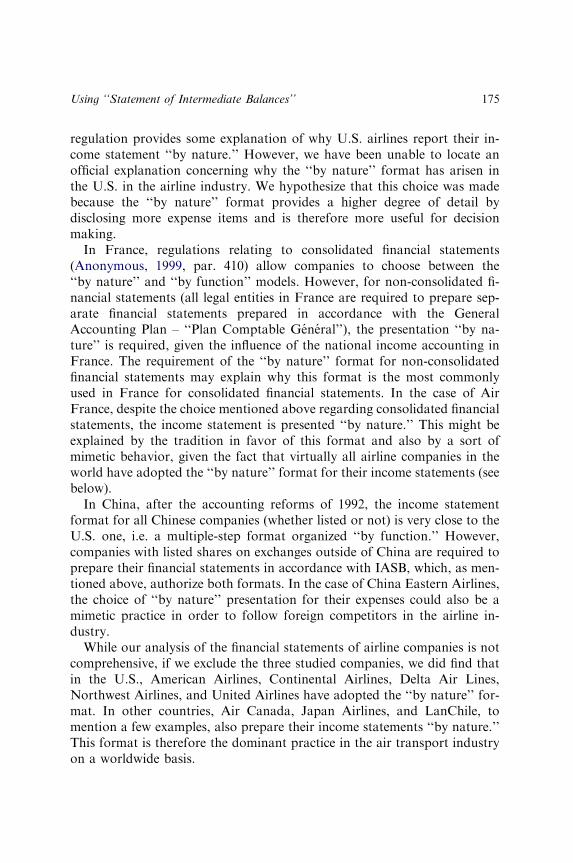
When an income statement is presented ‘‘by nature,’’ it is often useful toadjust the statement to highlight the key intermediate balances that deter-mine the value creation process of the enterprise. In preparing a SIB,the following balances can be highlighted: ‘‘commercial margin,’’ ‘‘valueadded,’’ ‘‘gross operating income,’’ and Earnings from Operations BeforeInterest, Taxes, Depreciation and Amortization ‘‘EBITDA.’’ Fig. 3 dem-onstrates the structure of a SIB.
Essentially, the SIB dissects the income statement into meaningful blocksof data to help the user understand and interpret the firm’s economic ac-tivity. The intermediate balances can be presented in monetary terms, or aspercentage variations from one period to the next (trend analysis), or aspercentages of some relevant basis (common-size analysis). The SIB can beparticularly useful if a company has manufacturing operations combinedwith merchandising (i.e. wholesale or retail) activities.
Definition of Terms
Commercial Margin
The commercial margin expresses the difference between the sales of mer-chandise and the cost of merchandise sold.
Current Period Production
The company’s industrial output during the period is the total of productionsold plus the cost of self-produced fixed assets.
Value Added
The term ‘‘value added’’ is a concept used in National Income accounting. Itrefers to the amount contributed by a particular enterprise to the nationalwealth. Value added is defined as the increase in value resulting from theenterprise’s activities over and above that of goods and services provided bythird parties and consumed by the firm. The concept is used in a number ofcountries; especially Australia, France, Germany, South Africa, and theUnited Kingdom (see Haller & Stolowy, 1998). Value added represents the

Sale of merchandise (goods purchased for resale)- Cost of merchandise sold= Commercial margin (margin on sale of
merchandise)
Sale of goods and/or services produced by thebusiness + Production capitalized (tangible and intangibleassets constructed for the firm itself) = Total “production” for the period
- Cost of raw materials and other supplies consumed - Other purchases and external expenses - Other operating expenses = Value added
Consumption of goods andservices from third parties
+ Operating subsidies - Taxes and similar expenses (excluding income taxes) - Wages and salaries - Social security and other welfare allowances = EBITDA or Gross operating income
- Depreciation and amortization expense + Other operating revenues (not included in sales) - Other operating expenses (not included above) = Operating income
+ Financial income- Financial expense = Operating net income/loss before taxes
± Gain/loss from sale of fixedassets - Asset writedowns- Other unusual expenses = Unusual income/loss
- Income taxes - Cumulative effect of changes in accounting principles - Preferred stock dividends - Others = Net income/loss after tax available to common
shareholders
Fig. 3. Structure of the Statement of Intermediate Balances.
Using ‘‘Statement of Intermediate Balances’’ 177
wealth created by the enterprise that will be distributed to various stake-holders including employees, lenders, governments, and shareholders.
EBITDA or Gross Operating Income
The EBITDA or Gross Operating Income measures the wealth created bythe enterprise from its operations, independent of its financial income and
C. RICHARD BAKER ET AL.178
expenses, and charges for depreciation and amortization. This indicatorhelps in evaluating the firm’s short-term ability to create wealth since it isnot affected by long-term strategic decisions regarding financing (i.e. capitalstructure) and capital investment policies. The ratio of EBITDA to sales (oraccounting ‘‘production’’) is often considered to be a measure of the ‘‘busi-ness profitability’’ of the firm, thereby allowing inter-company comparisons.EBITDA is also considered to be a proxy for cash flow generated by op-erations.
Operating Income
Operating income or profit represents the results of the firm’s normal andcurrent activity without taking into account financial and unusual elements.
Net Operating Income before Income Taxes
Operating net income before taxes indicates economic and financial per-formance before consideration of unusual items and taxes.
Unusual Income (Loss)
Unusual income (loss) is the profit or loss from activities that are not relatedto the firm’s usual operations. This ‘‘income’’ is shown as a separate item onthe SIB.
Net Income (Loss)
The last line of the SIB is the Net Income (Loss), which is self-explanatory.This figure serves as a check on the equality between the adjusted SIB andthe original income statement.
Income Statement ‘‘By Nature’’ Versus ‘‘By Function’’
One of the features of income statements prepared ‘‘by nature’’ is that theyallow the calculation of intermediate balances before the net income figure. Thecalculation of intermediate balances is a useful tool for financial statementanalysis, particularly for comparative analyses of company performance. Whenan income statement is organized ‘‘by function,’’ the calculation of intermediatebalances such as commercial margin, value added, gross operating profit, andoperating income are often difficult to perform. However, in the ‘‘by function’’income statement, some other useful intermediate balances may be reported,such as: gross margin, operating income, etc. Consequently, neither format isnecessarily superior to the other, and nor the format provides a complete
Using ‘‘Statement of Intermediate Balances’’ 179
understanding of the firm. One practical difficulty that arises in comparingincome statements ‘‘by nature’’ with income statements ‘‘by function’’ is thatthe transformation of an income statement ‘‘by nature’’ to an income statement‘‘by function’’ (and vice-versa) is a very difficult exercise because it requiresknowledge of information (concerning inventory, detail of personnel expenses,etc.) that is typically not available to the financial analyst. In this context, oneof the primary purposes of this paper is to argue that, when an income state-ment is presented ‘‘by nature,’’ users of financial statements need to be trainedto analyze this type of format because they will generally have less familiaritywith it and there may be no way to convert the ‘‘by nature’’ format to the morefamiliar ‘‘by function’’ format. The preparation of a SIB can help analysts tounderstand the utility of the income statement prepared ‘‘by nature.’’
APPLICATION OF THE STATEMENT OF
INTERMEDIATE BALANCES TO SOUTHWEST, AIR
FRANCE, AND CHINA EASTERN
In an economic setting where a number of airline companies have experi-enced serious financial difficulties (e.g. in the U.S., Chapter 11 bankruptcyfor U.S. Airways on August 11, 2002; financial restructuring of ContinentalAirlines in summer of 2002; Chapter 11 bankruptcy for United Airlines onDecember 9, 2002), it is important to be able to analyze and measure therelative performance of such companies. The following sections demonstratehow to perform, in an international setting, a comparative financial state-ment analysis when an income statement is prepared ‘‘by nature.’’ The threecompanies studied in this case (Southwest, Air France, and China Eastern)were chosen for the following reasons. First, they are based in three differentcontinents: North America, Europe, and Asia. Southwest is a U.S. based,‘‘low-cost’’ carrier. Southwest experienced some financial difficulties afterSeptember 11th, but generally remained profitable. Air France is currentlythe largest airline in Continental Europe, and has become the largest airlinein the world after completion of its merger with the Dutch company KLM.China Eastern is one of the largest Chinese air carriers.
Presentation of the Companies
The Management’s Discussion and Analysis of Financial Position andResults of Operations (MD&A) in the annual report of United Airlines for

C. RICHARD BAKER ET AL.180
the year 2001 summarized the state of the U.S. airline industry in particular,and the situation of world airline industry, as follows:
Beginning in 2001, the weakening U.S. economy had a significant impact on the airline
industry as corporations reduced their business travel budgets and changed their travel
behavior. During the first six months of 2001, the industry began experiencing significant
revenue declines as a result of the decrease in business traffic (y), particularly in the
domestic markets. (y) United’s revenues (y) were significantly impacted by the events
of September 11 and the resulting reduction in the Company’s operations.’’
In light of the continuing problems in the airline industry, and to betterunderstand how the industry operates, we present financial statements pre-pared by nature for Southwest, Air France, and China Eastern.
Southwest is a major U.S. domestic airline that primarily provides short-haul, high frequency, point-to-point, low-fare service. Southwest carried65.7 million passengers in 2003. Its fleet includes 388 aircraft at the end of2003 (Southwest Air Lines Annual Report). By contrast, Air France is thirdworldwide in terms of transportation of international passengers and first inEurope in terms of traffic (before the merger with KLM). Air France carried43.7 million passengers during fiscal 2003–2004. Its fleet included 372 air-craft as of March 31, 2004 (Air France Annual Report). China Eastern wasestablished in the People’s Republic of China in 1995. It is headquartered inShanghai. Its shares are listed in Shanghai, Hong Kong, and New York. In2003, China Eastern carried 12 million passengers. As at May 31, 2004, theGroup operated a fleet of 102 aircraft (China Eastern Airlines Annual Re-port).
Appendix A contain the following:
�
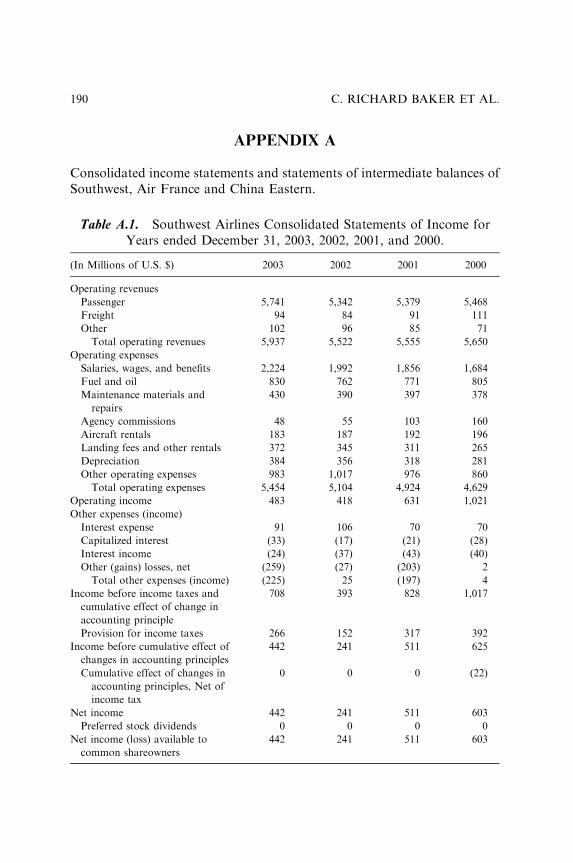
Consolidated Statements and statements of Income for the fiscal yearsended December 31, 2000 through December 31, 2003 for Southwest(source: Annual Reports 2001, 2002, and 2003) (see Table A.1).�
Consolidated Income Statement for the fiscal years ended March 31, 2001through March 31, 2004 for Air France (source: Annual Reports2001–2002, 2002–2003, and 2003–2004) (see Table A.2).�
Consolidated Statements of Income for the fiscal years ended December31, 2000 through December 31, 2003 for China Eastern (source: AnnualReports 2001, 2002, and 2003) (see Table A.3).These consolidated financial statements have been respectively preparedin accordance with accounting principles generally accepted in the UnitedStates (Southwest), in France (Air France) and with International FinancialReporting Standards and the disclosure requirements of the Hong KongCompanies Ordinance (China Eastern). For simplification purposes, the
Using ‘‘Statement of Intermediate Balances’’ 181
term ‘‘income statement’’ is used to refer to the ‘‘consolidated statements ofincome’’ or ‘‘consolidated income statements’’ of the three companies stud-ied.
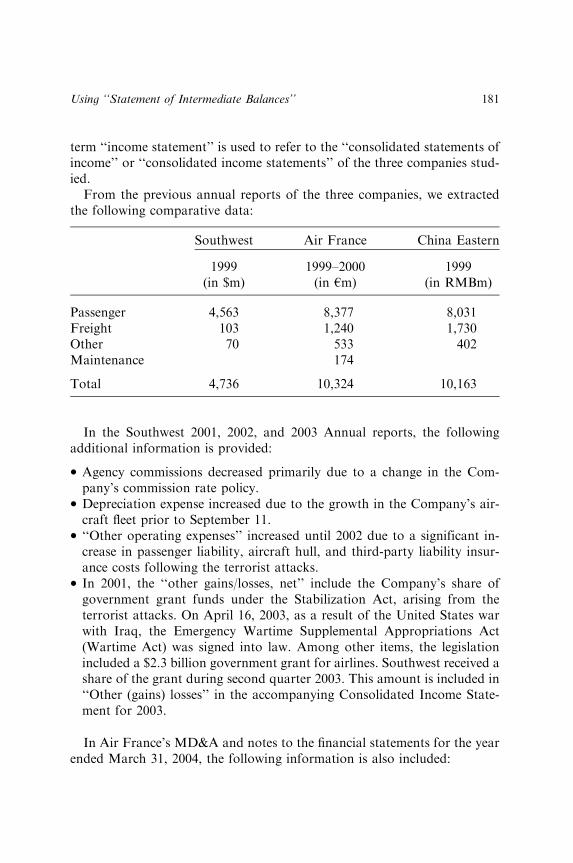
From the previous annual reports of the three companies, we extractedthe following comparative data:
Southwest
Air France China Eastern1999
1999–2000 1999 (in $m) (in hm) (in RMBm)Passenger
4,563 8,377 8,031 Freight 103 1,240 1,730 Other 70 533 402 Maintenance 174Total
4,736 10,324 10,163In the Southwest 2001, 2002, and 2003 Annual reports, the followingadditional information is provided:
�
Agency commissions decreased primarily due to a change in the Com-pany’s commission rate policy.�
Depreciation expense increased due to the growth in the Company’s air-craft fleet prior to September 11.�
‘‘Other operating expenses’’ increased until 2002 due to a significant in-crease in passenger liability, aircraft hull, and third-party liability insur-ance costs following the terrorist attacks.�
In 2001, the ‘‘other gains/losses, net’’ include the Company’s share ofgovernment grant funds under the Stabilization Act, arising from theterrorist attacks. On April 16, 2003, as a result of the United States warwith Iraq, the Emergency Wartime Supplemental Appropriations Act(Wartime Act) was signed into law. Among other items, the legislationincluded a $2.3 billion government grant for airlines. Southwest received ashare of the grant during second quarter 2003. This amount is included in‘‘Other (gains) losses’’ in the accompanying Consolidated Income State-ment for 2003.In Air France’s MD&A and notes to the financial statements for the yearended March 31, 2004, the following information is also included:

C. RICHARD BAKER ET AL.182
�
Other operating revenues consist of the catering activities. � Other external expenses include namely insurance premiums, professionalfees, and aircraft engine rental costs.�
In 2003–2004, other operating income and charges, net mainly representsincome linked to financial compensation on slot swaps at Heathrow air-port.From the China Eastern annual reports 2001, 2002, and 2003, we noticesome changes in the presentation of the ‘‘Other income, net’’ and ‘‘Otheroperating income’’. The data disclosed in Table A.4 will allow restatingsome elements of the income statement in order to ensure comparabilitythroughout the period (see Table A.4).
Additionally, the items ‘‘Aircraft depreciation and operating leases’’ and‘‘Other depreciation and operating leases’’ mix depreciation and leases. Inorder to separate these two expenses, we found the amount of operatingleases in the notes (see Table A.4).
Office and administration expenses mainly include training expenses, andexpenses relating to overseas sales. Other operating expenses include main-tenance expenses of other fixed assets, computer and telecommunicationsexpenses, and other (unspecified) expenses. On December 31, 2002, theGroup’s fixed assets were revalued. The impact was charged to the incomestatement under the caption ‘‘Revaluation deficit of fixed assets.’’
Analysis of Format of Income Statements
Southwest, Air France, and China Eastern all use the vertical format fortheir income statements. Additionally, the first part of the income statement(up to the point ‘‘operating income’’ for Southwest and Air France, and‘‘operating profit’’ for China Eastern), follows the single-step format,whereby operating expenses are subtracted from operating revenues. Fol-lowing operating income, several sub-level earnings numbers are presented.This format corresponds to the variation of the single-step format discussedpreviously above.
More important, the three companies have clearly adopted the ‘‘by na-ture’’ format. Interestingly, China Eastern had a real choice because it fol-lows the International Financial Reporting Standards which allow bothformats. It appears likely that China Eastern adopted the format ‘‘by na-ture’’ in order to be consistent with international reporting practices in theairline industry.
Using ‘‘Statement of Intermediate Balances’’ 183
Preparation of Statements of Intermediate Balances
Preliminary Indications
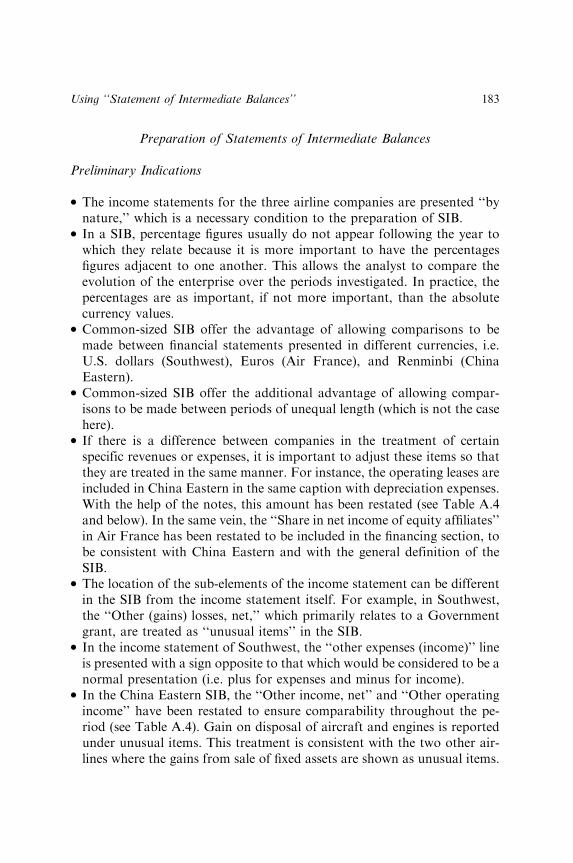
�
The income statements for the three airline companies are presented ‘‘bynature,’’ which is a necessary condition to the preparation of SIB.�
In a SIB, percentage figures usually do not appear following the year towhich they relate because it is more important to have the percentagesfigures adjacent to one another. This allows the analyst to compare theevolution of the enterprise over the periods investigated. In practice, thepercentages are as important, if not more important, than the absolutecurrency values.�
Common-sized SIB offer the advantage of allowing comparisons to bemade between financial statements presented in different currencies, i.e.U.S. dollars (Southwest), Euros (Air France), and Renminbi (ChinaEastern).�
Common-sized SIB offer the additional advantage of allowing compar-isons to be made between periods of unequal length (which is not the casehere).�
If there is a difference between companies in the treatment of certainspecific revenues or expenses, it is important to adjust these items so thatthey are treated in the same manner. For instance, the operating leases areincluded in China Eastern in the same caption with depreciation expenses.With the help of the notes, this amount has been restated (see Table A.4and below). In the same vein, the ‘‘Share in net income of equity affiliates’’in Air France has been restated to be included in the financing section, tobe consistent with China Eastern and with the general definition of theSIB.�
The location of the sub-elements of the income statement can be differentin the SIB from the income statement itself. For example, in Southwest,the ‘‘Other (gains) losses, net,’’ which primarily relates to a Governmentgrant, are treated as ‘‘unusual items’’ in the SIB.�
In the income statement of Southwest, the ‘‘other expenses (income)’’ lineis presented with a sign opposite to that which would be considered to be anormal presentation (i.e. plus for expenses and minus for income).�
In the China Eastern SIB, the ‘‘Other income, net’’ and ‘‘Other operatingincome’’ have been restated to ensure comparability throughout the pe-riod (see Table A.4). Gain on disposal of aircraft and engines is reportedunder unusual items. This treatment is consistent with the two other air-lines where the gains from sale of fixed assets are shown as unusual items.
C. RICHARD BAKER ET AL.184
�
In the China Eastern SIB, the operating leases included in the items‘‘Aircraft depreciation and operating leases’’ and ‘‘Other depreciation andoperating leases’’ (see Table A.4) have been separated and reported in theconsumption from third parties.�
In the China Eastern SIB, because office and administration expensesmainly include training expenses, and expenses relating to overseas sales,they have been included in the ‘‘Consumption from third parties.’’�
In the China Eastern SIB, other operating expenses include maintenanceexpenses of other fixed assets, computer and telecommunications expens-es, and other (unspecified) expenses. They fit well in the ‘‘Consumptionfrom third parties.’’�
In the China Eastern SIB, the ‘‘Revaluation deficit of fixed assets’’ hasbeen considered as an unusual item.Statement of Intermediate Balances
SIBs for Southwest (see Tables A.5 and A.6), Air France (see Tables A.7and A.8), and China Eastern (see Tables A.9 and A.10), are presentedboth in absolute currency terms and in percentage terms (i.e. common-sized).
Comparative Analysis of Statements of Intermediate Balances
Revenues/Production2
Even though the common-sized SIBs are based on the principle of dividingall other figures in the statement by the total production for the year, wehave added to the statement a line showing the change in revenues for eachyear as compared with the previous year. It can be seen that before theevents of September 11, 2001, Southwest had the greatest growth in rev-enues (+19.3% in 2000), ahead of Air France (+18.9%), and China East-ern (+10.4%). After September 11th, the decrease in revenues was thegreatest for Southwest (�1.7%). In contrast, Air France realized an increase(+2.0%) and China Eastern an even higher rise of 8.3%. In 2003, South-west and China Eastern experienced an increase (7.5 and 9.2%, respectively)while the other company suffered a decrease (�2.8% for Air France).
The activities of the three companies are relatively different: China East-ern’s revenues are more diversified (less passenger oriented) than Air Franceand significantly more diversified than Southwest. Seventy-two percent(71.9%) of China Eastern’s revenues were derived from passengers versus83.2% for Air France and 96.7% for Southwest in 2003.

Using ‘‘Statement of Intermediate Balances’’ 185
Consumption from Third Parties
The ratio of Consumption from Third Parties to Total Production is lower forSouthwest (47.9% in 2003) than for Air France (54.7% in 2003) and inparticular as compared with China Eastern (72.5% in 2003). This ratio de-creased for Air France and for Southwest in comparison with 2002 and 2001,indicating an ability to pass on increased costs to airline passengers. Lookingat the breakdown of Consumption from Third Parties, we see that Fuel Costrepresents the greatest expense for each of the companies (except for ‘‘OtherOperating Expenses’’ for Southwest), especially for China Eastern. Fuel Costas a percent of Total Production decreased for Air France over the period butincreased for China Eastern from 2002 to 2003. This development can beexplained by a decrease in consumption of fuel and a decrease in the averagecost per gallon. For Southwest, the weight of fuel cost remained stable overthe period (�14%).
Southwest was able to reduce the impact from Consumption from ThirdParties because of a reduction in the amount of Commissions (i.e. fees paidto travel agents) (from 2.8% in 2000 to 0.8% in 2003). (The Companymodified its system of paying commissions in 2001, which reduced this cost.)China Eastern experienced an even greater reduction in Commissions (from5.7% in 2000 to 3.3% in 2003). For Air France, commissions decreasedfrom 9.8% in 2000 to 8.5% in 2003. While Southwest was able to decreaseits Aircraft Rental cost (at 3.1% in 2003), China Eastern increased its cost(from 6.9% in 2000 to 7.3% in 2003), and Air France faced a similar in-crease (from 3.3% in 2000 to 3.7% in 2003).
China Eastern reports the highest take off and landing charges (15.8% in2003, versus 14.0% in 2000), compared to Air France (7.4% in 2003) andSouthwest (6.3% in 2003).
We can also easily compare the maintenance costs expensed by the threecompanies. China Eastern comes first with 9.3% in 2003 (increasing from7.3% in 2000), before Southwest (7.2% in 2003, 6.7% in 2000) and AirFrance (3.1% in 2003, 4.9% in 2000).
The composition of the category ‘‘Other operating expenses’’ or ‘‘Other’’or ‘‘Other external expenses’’ may not be entirely comparable between thecompanies. The annual report of Southwest provides little specific infor-mation concerning the make up of Other Operating Expenses. The onlyinformation provided is that the category includes insurance premiumsand advertising expenses. We learn that ‘‘Other operating expenses’’ in-creased due to a significant increase in passenger liability, aircraft hull, andthird-party liability insurance costs following the terrorist attacks. ForAir France, ‘‘Other external expenses’’ include insurance premiums,

C. RICHARD BAKER ET AL.186
professional fees, and aircraft engine rental costs. As regards China Eastern,‘‘Other operating expenses’’ include maintenance expenses of other fixedassets, computer and telecommunications expenses, and other (unspecified)expenses. These fit well in the ‘‘Consumption from third parties’’.
In general, it can be seen that Southwest generally has a lower coststructure than Air France and even lower than China Eastern. However, thisrelationship deteriorated throughout the period until 2002, with an increasein these costs for Southwest; while the other two companies were decreasingtheir consumption from third parties (this is especially true for Air France).The situation improved again for Southwest in 2003.
Value Added
While not widely used in North America, the Value Added figure shows theextent to which an enterprise contributes to the national wealth of thecountry (see Haller & Stolowy, 1998). The Value Added figure for South-west declined sharply from 2000 to 2001 following the events of September11th. This was because the cost of consumption from third parties increasedin relation to total production. This trend shows that Southwest has beenunable to pass along the increased cost to its customers. However, the sit-uation improved for Southwest in 2003 and for Air France.
Gross Operating Income
The ratio of Salaries, Wages, and Benefits to Total Production for South-west is generally much higher than for Air France and especially for ChinaEastern (37.5% in 2003 versus 33.1% for Air France and 10.1% for ChinaEastern). The increase recorded by Southwest was due in part to increasedsecurity requirements following the events of September 11th. Consequent-ly, this increase explains why Southwest recorded a decrease in its GrossOperating Profit from 2000 (23%) to 2003 (14.6%). However, the GrossOperating Profit of Southwest is still higher than that of Air France (10.7%in 2003). China Eastern has by far the highest gross operating profit (17.3%in 2003), due to its low level of salaries.
As discussed previously, Gross Operating Income reflects the return de-rived from the core activities of the enterprise. The different Gross Oper-ating Income figures indicate the relative performances of China Easternand Southwest. A negative gross operating income (i.e. a Gross OperatingLoss), which is not the case for any of our studied companies, is a sign offinancial distress.

Using ‘‘Statement of Intermediate Balances’’ 187
Operating Income
For Air France and Southwest, Depreciation and Amortization expenserose in 2003 in comparison with 2002, 2001, and 2000 because of the ac-quisition of additional aircraft and ground equipment. The ratio of Depre-ciation and Amortization to Total Production differs between thecompanies: 6.5% for Southwest in 2003, 9.6% for Air France in 2003,and 12.6% for China Eastern in 2003. The difference in the ratio of De-preciation and Amortization expense to Total Production slightly magnifiesthe gap between the Operating Income (Loss) of Southwest and ChinaEastern versus Air France. Air France has a very low operating income(‘‘Earnings from operations’’) (1.1% in 2003, compared to 2.9% in 2000).Southwest posted very high but decreasing Operating income (8.1% in 2003,18.1% in 2000). China Eastern has a decreasing operating income (1.8% in2003).
Operating Net Income before Taxes
China Eastern’s ratio of Interest Expense (Net) to Total Production is thehighest in our sample (5% in 2003), but it decreased from 2000 (7.3%),which is a good sign. China Eastern must have a high level (although de-creasing) of outstanding debt. Southwest recorded an increase in the InterestExpense ratio (from 1.2% in 2000 to 1.5% in 2003). Air France reports avery low level of interest expense (net) (0.5% in 2003). However, the com-parison between the three studied companies should be made with cautionas Southwest reports a gross interest expense when Air France and ChinaEastern disclose a net amount.
After adjustments for Interest Expense and other items, the OperatingNet Income of Southwest remained positive in 2003 (7.6%) but decreasing(as compared with 18% in 2000). Air France a low ratio (1% in 2003) andChina Eastern has a negative operating net income before taxes (�3.9% in2003).
Unusual Income (Loss)
A special charge was recorded by Southwest in 2001 in relation to theSeptember 11 terrorist attacks and the resulting impact on the companies’schedules and operations. However, the Company also received compen-sation under the Airline Stabilization Act, which partially offset their losses.The impact from unusual items was positive for Southwest (3.7% in 2001and 4.4% in 2003). Air France also recorded a positive unusual item fromgains on the disposal of fixed assets. China Eastern, conversely, recorded aloss on such items (�0.2% in 2003).
C. RICHARD BAKER ET AL.188
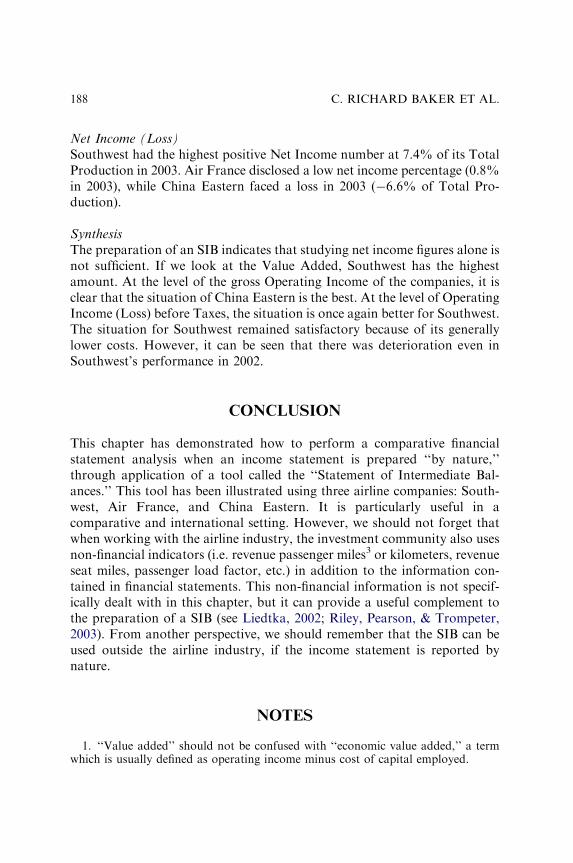
Net Income (Loss)
Southwest had the highest positive Net Income number at 7.4% of its TotalProduction in 2003. Air France disclosed a low net income percentage (0.8%in 2003), while China Eastern faced a loss in 2003 (�6.6% of Total Pro-duction).
Synthesis
The preparation of an SIB indicates that studying net income figures alone isnot sufficient. If we look at the Value Added, Southwest has the highestamount. At the level of the gross Operating Income of the companies, it isclear that the situation of China Eastern is the best. At the level of OperatingIncome (Loss) before Taxes, the situation is once again better for Southwest.The situation for Southwest remained satisfactory because of its generallylower costs. However, it can be seen that there was deterioration even inSouthwest’s performance in 2002.
CONCLUSION
This chapter has demonstrated how to perform a comparative financialstatement analysis when an income statement is prepared ‘‘by nature,’’through application of a tool called the ‘‘Statement of Intermediate Bal-ances.’’ This tool has been illustrated using three airline companies: South-west, Air France, and China Eastern. It is particularly useful in acomparative and international setting. However, we should not forget thatwhen working with the airline industry, the investment community also usesnon-financial indicators (i.e. revenue passenger miles3 or kilometers, revenueseat miles, passenger load factor, etc.) in addition to the information con-tained in financial statements. This non-financial information is not specif-ically dealt with in this chapter, but it can provide a useful complement tothe preparation of a SIB (see Liedtka, 2002; Riley, Pearson, & Trompeter,2003). From another perspective, we should remember that the SIB can beused outside the airline industry, if the income statement is reported bynature.
NOTES
1. ‘‘Value added’’ should not be confused with ‘‘economic value added,’’ a termwhich is usually defined as operating income minus cost of capital employed.

Using ‘‘Statement of Intermediate Balances’’ 189
2. All companies have no reselling activity. Consequently, there is no commercialmargin to compute.3. The term ‘‘revenue passenger mile’’ is defined as a mile flown on each flight
stage multiplied by the number of ‘‘revenue passengers’’ on that stage. A ‘‘revenuepassenger’’ is a person receiving air transportation from the air carrier for whichremuneration is received by the air carrier.
ACKNOWLEDGMENT
Yuan Ding would like to acknowledge the financial support of the ResearchCenter at the HEC School of Management (project A0306). Yuan Ding andHerve Stolowy acknowledge the financial support of the Research Center inFinancial Information (HEC Foundation). Both are Members of theGREGHEC, unite CNRS, FRE-2810.
REFERENCES
AICPA (1999). Accounting trends and techniques – 1999. New York: American Institute of
Certified Public Accountants.
Air France Annual Report. http://www.airfrance-finance.com.
China Eastern Airlines Annual Report. http://www.ce-air.com/cea/en_U.S./investor/report
DOT (2002). Uniform system of accounts and reports for large certificated air carriers. Wash-
ington, DC: Department of Transportation, http://www.bts.gov/lawlib/docs/Part241-
cy2000.pdf.
Haller, A., & Stolowy, H. (1998). Value added in financial accounting: A comparative study of
Germany and France. Advances in International Accounting, 11, 23–51.
IASB (2003). International accounting standard (IAS) No. 1: Presentation of financial statements
(revised). London: International Accounting Standards Board.
Kieso, D., Weygandt, J., & Warfield, T. (2001). Intermediate accounting (10th ed.). NY: Wiley.
Liedtka, S. L. (2002). The information content of nonfinancial performance measures in the
airline industry. Journal of Business Finance and Accounting, 29(7–8), 1105–1121.
Riley, R. A., Pearson, T. A., & Trompeter, G. (2003). The value relevance of non-financial
performance variables and accounting information: The case of the airline industry.
Journal of Accounting and Public Policy, 22(3), 231–254.
Southwest Air Lines Annual Report. http://www.southwest.com
Anonymous (1999). Regles et methodes relatives aux comptes consolides, arrete du 22 juin 1999
portant homologation du reglement 99-02 du 29 avril 1999 du comite de la reglementation
comptable (rules and methods relating to consolidated accounts – arrete of june 22, 1999,
approving the regulation No. 99-02 of april 29, 1999, of the accounting regulation com-
mittee). Paris: Accounting Regulation Committee.
C. RICHARD BAKER ET AL.190
APPENDIX A
Consolidated income statements and statements of intermediate balances ofSouthwest, Air France and China Eastern.
Table A.1. Southwest Airlines Consolidated Statements of Income forYears ended December 31, 2003, 2002, 2001, and 2000.
(In Millions of U.S. $) 2003 2002 2001 2000
Operating revenues
Passenger 5,741 5,342 5,379 5,468
Freight 94 84 91 111
Other 102 96 85 71
Total operating revenues 5,937 5,522 5,555 5,650
Operating expenses
Salaries, wages, and benefits 2,224 1,992 1,856 1,684
Fuel and oil 830 762 771 805
Maintenance materials and
repairs
430 390 397 378
Agency commissions 48 55 103 160
Aircraft rentals 183 187 192 196
Landing fees and other rentals 372 345 311 265
Depreciation 384 356 318 281
Other operating expenses 983 1,017 976 860
Total operating expenses 5,454 5,104 4,924 4,629
Operating income 483 418 631 1,021
Other expenses (income)
Interest expense 91 106 70 70
Capitalized interest (33) (17) (21) (28)
Interest income (24) (37) (43) (40)
Other (gains) losses, net (259) (27) (203) 2
Total other expenses (income) (225) 25 (197) 4
Income before income taxes and
cumulative effect of change in
accounting principle
708 393 828 1,017
Provision for income taxes 266 152 317 392
Income before cumulative effect of
changes in accounting principles
442 241 511 625
Cumulative effect of changes in
accounting principles, Net of
income tax
0 0 0 (22)
Net income 442 241 511 603
Preferred stock dividends 0 0 0 0
Net income (loss) available to
common shareowners
442 241 511 603
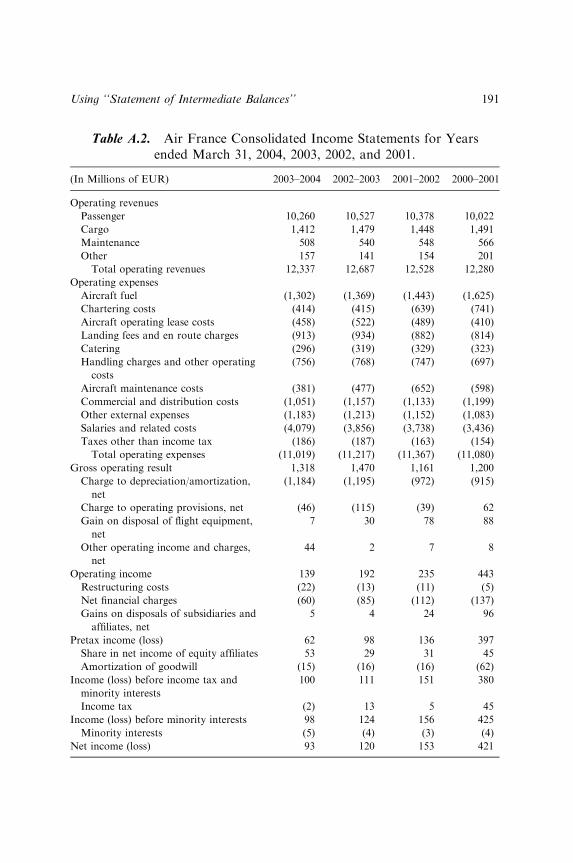
Table A.2. Air France Consolidated Income Statements for Yearsended March 31, 2004, 2003, 2002, and 2001.
(In Millions of EUR) 2003–2004 2002–2003 2001–2002 2000–2001
Operating revenues
Passenger 10,260 10,527 10,378 10,022
Cargo 1,412 1,479 1,448 1,491
Maintenance 508 540 548 566
Other 157 141 154 201
Total operating revenues 12,337 12,687 12,528 12,280
Operating expenses
Aircraft fuel (1,302) (1,369) (1,443) (1,625)
Chartering costs (414) (415) (639) (741)
Aircraft operating lease costs (458) (522) (489) (410)
Landing fees and en route charges (913) (934) (882) (814)
Catering (296) (319) (329) (323)
Handling charges and other operating
costs
(756) (768) (747) (697)
Aircraft maintenance costs (381) (477) (652) (598)
Commercial and distribution costs (1,051) (1,157) (1,133) (1,199)
Other external expenses (1,183) (1,213) (1,152) (1,083)
Salaries and related costs (4,079) (3,856) (3,738) (3,436)
Taxes other than income tax (186) (187) (163) (154)
Total operating expenses (11,019) (11,217) (11,367) (11,080)
Gross operating result 1,318 1,470 1,161 1,200
Charge to depreciation/amortization,
net
(1,184) (1,195) (972) (915)
Charge to operating provisions, net (46) (115) (39) 62
Gain on disposal of flight equipment,
net
7 30 78 88
Other operating income and charges,
net
44 2 7 8
Operating income 139 192 235 443
Restructuring costs (22) (13) (11) (5)
Net financial charges (60) (85) (112) (137)
Gains on disposals of subsidiaries and
affiliates, net
5 4 24 96
Pretax income (loss) 62 98 136 397
Share in net income of equity affiliates 53 29 31 45
Amortization of goodwill (15) (16) (16) (62)
Income (loss) before income tax and
minority interests
100 111 151 380
Income tax (2) 13 5 45
Income (loss) before minority interests 98 124 156 425
Minority interests (5) (4) (3) (4)
Net income (loss) 93 120 153 421
Using ‘‘Statement of Intermediate Balances’’ 191
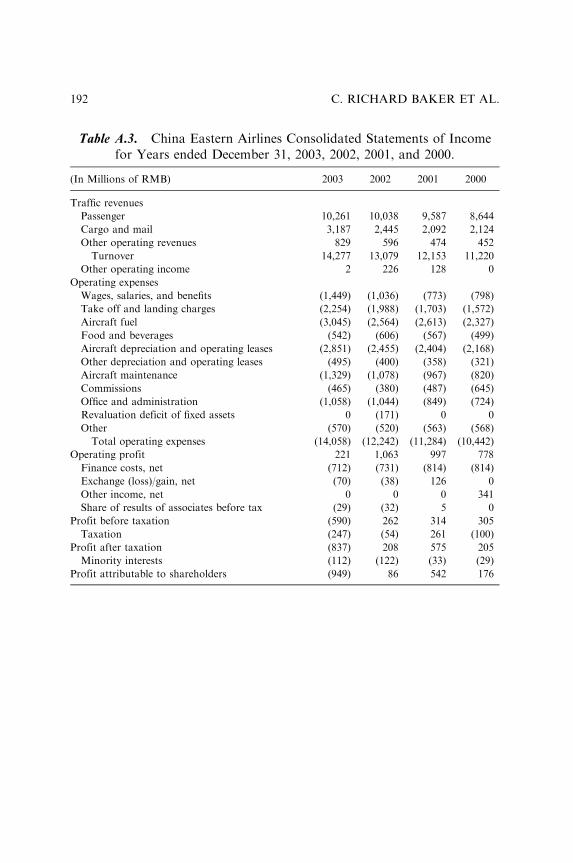
Table A.3. China Eastern Airlines Consolidated Statements of Incomefor Years ended December 31, 2003, 2002, 2001, and 2000.
(In Millions of RMB) 2003 2002 2001 2000
Traffic revenues
Passenger 10,261 10,038 9,587 8,644
Cargo and mail 3,187 2,445 2,092 2,124
Other operating revenues 829 596 474 452
Turnover 14,277 13,079 12,153 11,220
Other operating income 2 226 128 0
Operating expenses
Wages, salaries, and benefits (1,449) (1,036) (773) (798)
Take off and landing charges (2,254) (1,988) (1,703) (1,572)
Aircraft fuel (3,045) (2,564) (2,613) (2,327)
Food and beverages (542) (606) (567) (499)
Aircraft depreciation and operating leases (2,851) (2,455) (2,404) (2,168)
Other depreciation and operating leases (495) (400) (358) (321)
Aircraft maintenance (1,329) (1,078) (967) (820)
Commissions (465) (380) (487) (645)
Office and administration (1,058) (1,044) (849) (724)
Revaluation deficit of fixed assets 0 (171) 0 0
Other (570) (520) (563) (568)
Total operating expenses (14,058) (12,242) (11,284) (10,442)
Operating profit 221 1,063 997 778
Finance costs, net (712) (731) (814) (814)
Exchange (loss)/gain, net (70) (38) 126 0
Other income, net 0 0 0 341
Share of results of associates before tax (29) (32) 5 0
Profit before taxation (590) 262 314 305
Taxation (247) (54) 261 (100)
Profit after taxation (837) 208 575 205
Minority interests (112) (122) (33) (29)
Profit attributable to shareholders (949) 86 542 176
C. RICHARD BAKER ET AL.192

Table A.4. China Eastern Airlines Additional Information for Yearsended December 31, 2003, 2002, 2001, and 2000.
2003 2002 2001 2000
Net exchange gain/(loss) 126 120
Gain on disposal of aircraft and engines 2 112
Rental income from operating subleases of aircraft 126 111
Other, net (5) (2)
Other income, net 249 341
Gain on disposal of aircraft and engines (29) 116 2
Rental income from operating subleases of aircraft 31 110 126
Other operating income 2 226 128
Operating lease rentals (aircraft) 1,048 1,026 925 769
Operating lease rentals (land and buildings) 46 99 90 83
Table A.5. Southwest Airlines Statement of Intermediate Balances(in $ Millions).
For the Years Ended December 31 2003 2002 2001 2000
Passenger 5,741 5,342 5,379 5,468
Freight 94 84 91 111
Other 102 96 85 71
Total production for the period 5,937 5,522 5,555 5,650
Fuel and oil (830) (762) (771) (805)
Agency commissions (48) (55) (103) (160)
Landing fees and other rentals (372) (345) (311) (265)
Aircraft rentals (183) (187) (192) (196)
Maintenance materials and repairs (430) (390) (397) (378)
Other operating expenses (983) (1,017) (976) (860)
Consumption from third parties (2,846) (2,756) (2,750) (2,664)
Value added 3,091 2,766 2,805 2,986
Salaries, wages, and benefits (2,224) (1,992) (1,856) (1,684)
Gross operating income 867 774 949 1,302
Depreciation (384) (356) (318) (281)
Operating income 483 418 631 1,021
Interest expense (91) (106) (70) (70)
Capitalized interest 33 17 21 28
Interest income 24 37 43 40
Operating net income before taxes 449 366 625 1,019
Other (gains) losses, net 259 27 203 (2)
Unusual income 259 27 203 (2)
Provision for income taxes 266 152 317 392
Cumulative effect of changes in accounting
principles, net of income tax
0 0 0 (22)
Preferred stock dividends 0 0 0 0
Net income (loss) available to common shareowners 442 241 511 603
Using ‘‘Statement of Intermediate Balances’’ 193

Table A.6. Southwest Airlines Statement of Intermediate Balances(in Percentage Terms).
For the Years Ended December 31 2003 2002 2001 2000
Passenger 96.7 96.7 96.8 96.8
Freight 1.6 1.5 1.6 2.0
Other 1.7 1.7 1.5 1.3
Total production for the period 100.0 100.0 100.0 100.0
Change in production 7.5 (0.6) (1.7) 19.3
Change in passenger revenues 7.5 (0.7) (1.6) 19.8
Change in cargo revenues 11.9 (7.7) (18.0) 7.8
Fuel and oil (14.0) (13.8) (13.9) (14.2)
Agency commissions (0.8) (1.0) (1.9) (2.8)
Landing fees and other rentals (6.3) (6.2) (5.6) (4.7)
Aircraft rentals (3.1) (3.4) (3.5) (3.5)
Maintenance materials and repairs (7.2) (7.1) (7.1) (6.7)
Other operating expenses (16.6) (18.4) (17.6) (15.2)
Consumption from third parties (47.9) (49.9) (49.5) (47.2)
Value added 52.1 50.1 50.5 52.8
Salaries, wages, and benefits (37.5) (36.1) (33.4) (29.8)
Gross operating income 14.6 14.0 17.1 23.0
Depreciation (6.5) (6.4) (5.7) (5.0)
Operating income 8.1 7.6 11.4 18.1
Interest expense (1.5) (1.9) (1.3) (1.2)
Capitalized interest 0.6 0.3 0.4 0.5
Interest income 0.4 0.7 0.8 0.7
Operating net income before taxes 7.6 6.6 11.3 18.0
Other (gains) losses, net 4.4 0.5 3.7 (0.0)
Unusual income 4.4 0.5 3.7 (0.0)
Provision for income taxes 4.5 2.8 5.7 6.9
Cumulative effect of changes in accounting
principles, Net of income tax
0.0 0.0 0.0 (0.4)
Preferred stock dividends 0.0 0.0 0.0 0.0
Net income (loss) available to common
shareowners
7.4 4.4 9.2 10.7
C. RICHARD BAKER ET AL.194
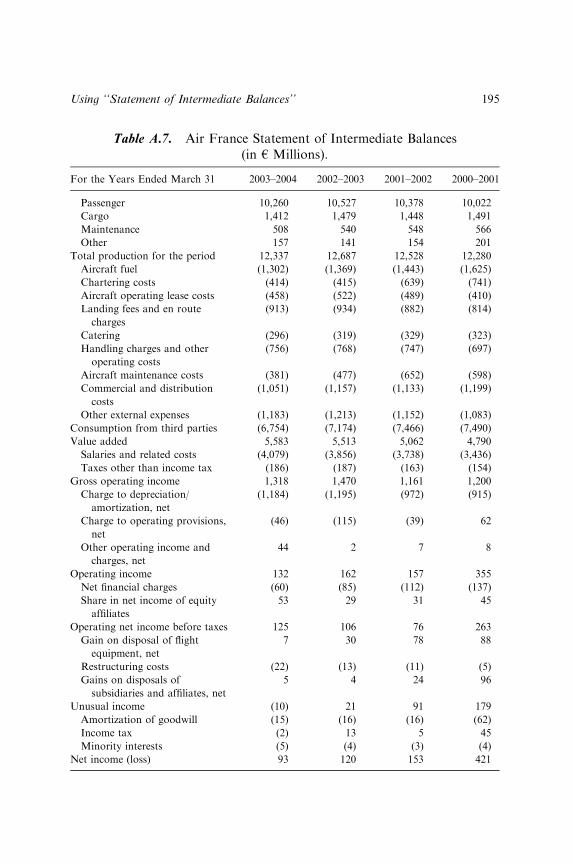
Table A.7. Air France Statement of Intermediate Balances(in h Millions).
For the Years Ended March 31 2003–2004 2002–2003 2001–2002 2000–2001
Passenger 10,260 10,527 10,378 10,022
Cargo 1,412 1,479 1,448 1,491
Maintenance 508 540 548 566
Other 157 141 154 201
Total production for the period 12,337 12,687 12,528 12,280
Aircraft fuel (1,302) (1,369) (1,443) (1,625)
Chartering costs (414) (415) (639) (741)
Aircraft operating lease costs (458) (522) (489) (410)
Landing fees and en route
charges
(913) (934) (882) (814)
Catering (296) (319) (329) (323)
Handling charges and other
operating costs
(756) (768) (747) (697)
Aircraft maintenance costs (381) (477) (652) (598)
Commercial and distribution
costs
(1,051) (1,157) (1,133) (1,199)
Other external expenses (1,183) (1,213) (1,152) (1,083)
Consumption from third parties (6,754) (7,174) (7,466) (7,490)
Value added 5,583 5,513 5,062 4,790
Salaries and related costs (4,079) (3,856) (3,738) (3,436)
Taxes other than income tax (186) (187) (163) (154)
Gross operating income 1,318 1,470 1,161 1,200
Charge to depreciation/
amortization, net
(1,184) (1,195) (972) (915)
Charge to operating provisions,
net
(46) (115) (39) 62
Other operating income and
charges, net
44 2 7 8
Operating income 132 162 157 355
Net financial charges (60) (85) (112) (137)
Share in net income of equity
affiliates
53 29 31 45
Operating net income before taxes 125 106 76 263
Gain on disposal of flight
equipment, net
7 30 78 88
Restructuring costs (22) (13) (11) (5)
Gains on disposals of
subsidiaries and affiliates, net
5 4 24 96
Unusual income (10) 21 91 179
Amortization of goodwill (15) (16) (16) (62)
Income tax (2) 13 5 45
Minority interests (5) (4) (3) (4)
Net income (loss) 93 120 153 421
Using ‘‘Statement of Intermediate Balances’’ 195

Table A.8. Air France Statement of Intermediate Balances(in Percentage Terms).
For the Years Ended March 31 2003–2004 2002–2003 2001–2002 2000–2001
Passenger 83.2 83.0 82.8 81.6
Cargo 11.4 11.7 11.6 12.1
Maintenance 4.1 4.3 4.4 4.6
Other 1.3 1.1 1.2 1.6
Total production for the period 100.0 100.0 100.0 100.0
Change in production (2.8) 1.3 2.0 18.9
Change in passenger revenues (2.5) 1.4 3.6 19.6
Change in cargo revenues (4.5) 2.1 (2.9) 20.2
Aircraft fuel (10.6) (10.8) (11.5) (13.2)
Chartering costs (3.4) (3.3) (5.1) (6.0)
Aircraft operating lease costs (3.7) (4.1) (3.9) (3.3)
Landing fees and en route charges (7.4) (7.4) (7.0) (6.6)
Catering (2.4) (2.5) (2.6) (2.6)
Handling charges and other
operating costs
(6.1) (6.1) (6.0) (5.7)
Aircraft maintenance costs (3.1) (3.8) (5.2) (4.9)
Commercial and distribution costs (8.5) (9.1) (9.0) (9.8)
Other external expenses (9.6) (9.6) (9.2) (8.8)
Consumption from third parties (54.7) (56.5) (59.6) (61.0)
Value added 45.3 43.5 40.4 39.0
Salaries and related costs (33.1) (30.4) (29.8) (28.0)
Taxes other than income tax (1.5) (1.5) (1.3) (1.3)
Gross operating income 10.7 11.6 9.3 9.8
Charge to depreciation/amortization,
net
(9.6) (9.4) (7.8) (7.5)
Charge to operating provisions, net (0.4) (0.9) (0.3) 0.5
Other operating income and charges,
net
0.4 0.0 0.1 0.1
Operating income 1.1 1.3 1.3 2.9
Net financial charges (0.5) (0.7) (0.9) (1.1)
Share in net income of equity affiliates 0.4 0.2 0.2 0.4
Operating net income before taxes 1.0 0.8 0.6 2.1
Gain on disposal of flight equipment,
net
0.1 0.2 0.6 0.7
Restructuring costs (0.2) (0.1) (0.1) (0.0)
Gains on disposals of subsidiaries and
affiliates, net
0.0 0.0 0.2 0.8
Unusual income (0.1) 0.2 0.7 1.5
Amortization of goodwill (0.1) (0.1) (0.1) (0.5)
Income tax (0.0) 0.1 0.0 0.4
Minority interests (0.0) (0.0) (0.0) (0.0)
Net income (loss) 0.8 0.9 1.2 3.4
C. RICHARD BAKER ET AL.196
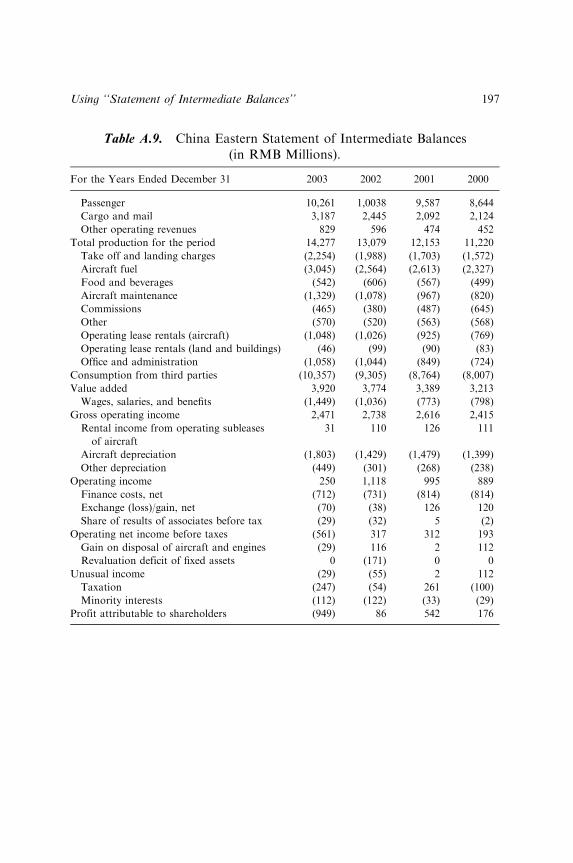
Table A.9. China Eastern Statement of Intermediate Balances(in RMB Millions).
For the Years Ended December 31 2003 2002 2001 2000
Passenger 10,261 1,0038 9,587 8,644
Cargo and mail 3,187 2,445 2,092 2,124
Other operating revenues 829 596 474 452
Total production for the period 14,277 13,079 12,153 11,220
Take off and landing charges (2,254) (1,988) (1,703) (1,572)
Aircraft fuel (3,045) (2,564) (2,613) (2,327)
Food and beverages (542) (606) (567) (499)
Aircraft maintenance (1,329) (1,078) (967) (820)
Commissions (465) (380) (487) (645)
Other (570) (520) (563) (568)
Operating lease rentals (aircraft) (1,048) (1,026) (925) (769)
Operating lease rentals (land and buildings) (46) (99) (90) (83)
Office and administration (1,058) (1,044) (849) (724)
Consumption from third parties (10,357) (9,305) (8,764) (8,007)
Value added 3,920 3,774 3,389 3,213
Wages, salaries, and benefits (1,449) (1,036) (773) (798)
Gross operating income 2,471 2,738 2,616 2,415
Rental income from operating subleases
of aircraft
31 110 126 111
Aircraft depreciation (1,803) (1,429) (1,479) (1,399)
Other depreciation (449) (301) (268) (238)
Operating income 250 1,118 995 889
Finance costs, net (712) (731) (814) (814)
Exchange (loss)/gain, net (70) (38) 126 120
Share of results of associates before tax (29) (32) 5 (2)
Operating net income before taxes (561) 317 312 193
Gain on disposal of aircraft and engines (29) 116 2 112
Revaluation deficit of fixed assets 0 (171) 0 0
Unusual income (29) (55) 2 112
Taxation (247) (54) 261 (100)
Minority interests (112) (122) (33) (29)
Profit attributable to shareholders (949) 86 542 176
Using ‘‘Statement of Intermediate Balances’’ 197

Table A.10. China Eastern Statement of Intermediate Balances(in Percentage Terms).
For the Years Ended December 31 2003 2002 2001 2000
Passenger 71.9 76.7 78.9 77.0
Cargo and mail 22.3 18.7 17.2 18.9
Other operating revenues 5.8 4.6 3.9 4.0
Total production for the period 100.0 100.0 100.0 100.0
Change in production 9.2 7.6 8.3 10.4
Change in passenger revenues 2.2 4.7 10.9 7.6
Change in cargo revenues 30.3 16.9 (1.5) 22.8
Take off and landing charges (15.8) (15.2) (14.0) (14.0)
Aircraft fuel (21.3) (19.6) (21.5) (20.7)
Food and beverages (3.8) (4.6) (4.7) (4.4)
Aircraft maintenance (9.3) (8.2) (8.0) (7.3)
Commissions (3.3) (2.9) (4.0) (5.7)
Other (4.0) (4.0) (4.6) (5.1)
Operating lease rentals (aircraft) (7.3) (7.8) (7.6) (6.9)
Operating lease rentals (land and buildings) (0.3) (0.8) (0.7) (0.7)
Office and administration (7.4) (8.0) (7.0) (6.5)
Consumption from third parties (72.5) (71.1) (72.1) (71.4)
Value added 27.5 28.9 27.9 28.6
Wages, salaries, and benefits (10.1) (7.9) (6.4) (7.1)
Gross operating income 17.3 20.9 21.5 21.5
Rental income from operating subleases
of aircraft
0.2 0.8 1.0 1.0
Aircraft depreciation (12.6) (10.9) (12.2) (12.5)
Other depreciation (3.1) (2.3) (2.2) (2.1)
Operating income 1.8 8.5 8.2 7.9
Finance costs, net (5.0) (5.6) (6.7) (7.3)
Exchange (loss)/gain, net (0.5) (0.3) 1.0 1.1
Share of results of associates before tax (0.2) (0.2) 0.0 (0.0)
Operating net income before taxes (3.9) 2.4 2.6 1.7
Gain on disposal of aircraft and engines (0.2) 0.9 0.0 1.0
Revaluation deficit of fixed assets 0.0 (1.3) 0.0 0.0
Unusual income (0.2) (0.4) 0.0 1.0
Taxation (1.7) (0.4) 2.1 (0.9)
Minority interests (0.8) (0.9) (0.3) (0.3)
Profit attributable to shareholders (6.6) 0.7 4.5 1.6
C. RICHARD BAKER ET AL.198