using the greenhouse gas reporting program data to improve...
TRANSCRIPT
EPA’s International Emission Inventory Conference 14-17 August 2017, Baltimore, Maryland
Using the Greenhouse Gas Reporting Program Data to Improve the National
Greenhouse Gas Emissions Inventory for Petroleum and Natural Gas Systems
Karin Ritter
American Petroleum Institute, 1220 L Street, NW, Washington DC 20005
Miriam Lev-On
The LEVON Group, LLC, 236 Marjorie Ave., Thousand Oaks, California, 91320
Terri Lauderdale
AECOM, 9400 Amberglen Blvd., Austin, Texas, 78729
ABSTRACT
The American Petroleum Institute (API) has been engaged for close to two decades in
improving methodologies for estimating greenhouse gas (GHG) emissions from petroleum and
natural gas industry operations. In 2010 the U.S. Environmental Protection Agency (EPA)
promulgated a nationwide mandatory Greenhouse Gas Reporting Program (GHGRP) with
detailed guidance for measurements and calculations of GHG emissions from 41 industry
sectors. Petroleum and natural gas facilities emitting over 25,000 metric tons of CO2-
equivalent/year have reported their GHG emissions since 2011 under the provisions of Subpart
W of the GHGRP. API has collaborated with the EPA by providing feedback throughout the
years on both the reporting program and the national GHG emissions inventory (GHGI).
This paper describes the wide ranging efforts undertaken by the API to ensure the
incorporation of robust GHGRP data into the GHGI. This paper will focus on improved
assessment of the dynamic scope of activities - and corresponding emissions - from petroleum
and natural gas production and natural gas processing operations. The approach to refine the
GHGI will be addressed by comparing various sources, to properly document the scope of
industry activities, as reflected by the national count of operating wellheads and natural gas
processing plants. As a case in point, this paper will demonstrate how the GHGRP measurement
data could be used to derive updated methane emission factors for compressors in the natural gas
processing segment of the industry
INTRODUCTION
EPA publishes an annual U.S. national GHGI as part of the multilateral obligations
specified by the United Nations Framework Convention on Climate Change. For the petroleum
and natural gas sectors, much of the initial data in the GHGI came from studies conducted in the
early to mid-1990’s.1 However, with mandatory GHG reporting for large facilities beginning in

EPA’s International Emission Inventory Conference 14-17 August 2017, Baltimore, Maryland
2010, a significant amount of information is now available for GHG emission sources through
the GHGRP. Petroleum and Natural Gas Systems facilities began reporting GHG emissions in
2011 using the calculation methodologies specified in 40 CFR 98.233 and the reporting
requirements of 40 CFR 98.236.2 API has analyzed the GHGRP data which is reported
publically each year and used the results of the analysis to provide recommendations to EPA for
updating the GHGI methodology.
The paper provides details for two areas in which API provided EPA with
recommendations for improved methods for the national GHG Inventory:
Comparison of different sources to refine the assessment of petroleum and natural gas
well counts that are subsequently used for estimating industry activities;
Demonstration of how the GHGRP measurement data could be used to derive updated
methane emission factors for compressors in the natural gas processing segment of the
industry.
These two examples are provided as an illustration of the extent of API’s analysis of GHGRP
reported activities and emissions data from other key industry sources, with primary emphasis on
the petroleum and natural gas production and natural gas processing segments of the industry.
WELL COUNTS IN THE GHG INVENTORY
A number of Petroleum and Natural Gas emission sources in the GHGI rely on counts of
producing wells as a key data input for emission calculations. For some sources well counts data
are used directly as the activity data input (e.g., calculations for fugitive emissions from wells);
for other sources well counts are used to estimate the population of related equipment in a given
year (e.g., calculations for pneumatic devices which use the number of pneumatic devices per
well and well counts); and still for others well counts are used to calculate other inputs (e.g.,
dehydrator vent calculations use well counts, number of dehydrators per well, and the amount of
throughput per dehydrator).
Starting in 2013, EPA began using the U.S. well data provided by DrillingInfo to
establish the national well count. However, API had noted significant differences in the well
counts used by EPA compared to other data sources of national oil and gas well counts. Table 1
compares API’s estimate of U.S. oil and gas wells using DrillingInfo to EPA’s and other sources
of national well counts for calendar year 2014.
Table 1. Comparison of 2014 and 2015 U.S. oil and gas well counts.
EPA
(HPDI,
2014
API
(HPDI,
2014)
IPAA3
(IHS,
2014)
World Oil4
(States,
2015)
EIA5
(HPDI,
2015)
DrillingInfo
(HPDI,
2014)*
Non-Associated Gas Wells 456,140 436,846 514,782 502,987 578,000 426,658
Total Producing Oil Wells 898,268 550,994 600,679 594,436 470,000 601,963
Associated Gas Wells
(subset of oil wells)
503,873 331,580
TOTAL 1,354,408 987,840 1,115,461 1,097,423 1,048,000 1,028,621
Differential from EPA
Total -366,568 -238,947 -256,985 -306,408 -325,787
* These data represent a run of 2014 well counts that was performed by DrillingInfo for API

EPA’s International Emission Inventory Conference 14-17 August 2017, Baltimore, Maryland
All of the sources reviewed have lower total well count estimates than EPA. API and
EPA’s estimate of non-associated gas well counts are comparable. The significant difference is
in the oil well count. While we expect some differences due to how EPA and API are each able
to access the DrillingInfo data, it is unlikely that this is the cause of the entire difference in well
counts.
API presented this information and discussed well counts with EPA on several occasions.
For the GHGI released in March 2017 for RY20156, EPA updated their approach to incorporate a
recent revision to the DrillingInfo dataset that clarified information for certain well records. In
the previous DrillingInfo datasets, records for certain wells in Texas had been assigned multiple
well identification numbers over time resulting in double counting of specific wells. The
resulting well counts used in the GHGI are more comparable to those from other data sources.
GHGRP COMPRESSOR DATA FOR GAS PROCESSING FACILITIES
Natural gas processing facilities with total GHG emissions greater than 25,000 metric
tons of CO2 equivalent emissions have been reporting GHG emissions to EPA since 2011. A
total of 467 gas processing facilities reported GHG emissions data through the GHGRP for
reporting year 2015. The GHGRP provides substantial information, including compressor
counts and measured compressor component emissions that can be used to update data for EPA’s
national GHGI.
Compressor Activity Data Updates
Compressor activity data from the GHGRP for RY2013 through RY2015 compared to
the 2016 GHGI (RY2014)7 activity data are presented in Tables 2 and 3 for centrifugal and
reciprocating compressors, respectively. Weighted average counts of compressors per gas plant
are shown in the shaded cells.
Table 2. Comparison of centrifugal compressors activity data: 2016 GHGI (RY2014) and
RY2013-RY2015 GHGRP.
2016 GHGI
RY2014
RY2015
GHGRP Data
RY2014
GHGRP Data
RY2013
GHGRP Data
# Gas plants nationally 668
# Gas plants reporting to the GHGRP 467 464 437
# Dry Seal Centrifugal Compressors 306 214 186 183
# Dry seal compressors per gas plant 0.46 0.46 0.40 0.42
0.43
# Wet Seal Centrifugal Compressors 665 264 271 267
# Wet seal compressors per gas plant 1.0 0.57 0.58 0.61
0.59

EPA’s International Emission Inventory Conference 14-17 August 2017, Baltimore, Maryland
Table 3. Comparison of reciprocating compressors activity data: 2016 GHGI (RY2014)
and RY2013-RY2015 GHGRP.
2016 GHGI
RY2014
RY2015
GHGRP Data
RY2014
GHGRP Data
RY2013
GHGRP Data
# Gas plants nationally 668
# Gas plants reporting to the GHGRP 467 464 437
Reciprocating Compressors 6,020 2,662 2,603 2,382
# Reciprocating compressors per gas plant 9.01 5.70 5.61 5.45
5.59
GHGRP data show that the number of dry seal centrifugal compressors and reciprocating
compressors per gas plant have increased over the three years that they were reported, while wet
seal centrifugal compressors per gas plant show a slight decreasing trend. For all years and
compressor types, the GHGRP ratios of compressors to gas plant counts are lower than the
GHGI ratios. EPA has revised the compressor counts in the most recent 2017 GHGI (RY2015)6
to utilize the counts of compressors per gas plant from the RY2015 GHGRP data.
GHGRP Data for Compressor Emission Factor Updates
The GHGRP mandates that specific compressor components should be measured for gas
processing facilities. Measurements are conducted in the “as found mode”, meaning that the
reporter does not have to measure all of the operating modes in a given year. Instead,
components are measured based on the operational conditions of the compressor at the time of
measurement. The components requiring measurement and the corresponding modes of
operation are summarized in Table 4.
Table 4. GHGRP compressor component measurements for gas processing facilities.
Compressor Type Compressor Component Compressor Operating Mode
Wet Seal Centrifugal Compressors Blowdown valve Operating
Wet seal oil degassing vents Operating
Isolation valve Non-operating, depressurized
Dry Seal Centrifugal Compressors Blowdown valve Operating
Isolation valve Non-operating, depressurized
Reciprocating Compressors Blowdown valve Operating
Rod packing Operating
Blowdown valve Stand-by pressurized
Isolation valve Non-operating, depressurized
A significant amount of compressor information is reported to the GHGRP. Care must
be taken in utilizing this information for emission factor development. While both measured and
unmeasured CH4 emissions data are reported separately for isolation valves, the measured data
should be considered to be the most appropriate for developing a national emission factor.
Regulatory revisions, which included additional reporting elements for the measured flow rate
and measurement methods, as well as revised Envirofacts data tables prompted different data
analysis approaches for RY2015 GHGRP data than for earlier reporting years. Some of the
revisions to the RY2015 GHGRP data included:
EPA’s International Emission Inventory Conference 14-17 August 2017, Baltimore, Maryland
Calculating and reporting emissions from compressors that are routed to an operational
flare with other flare stack emissions.
Combining emissions from wet seal and dry seal centrifugal compressors. (Activity data
for wet and dry seal compressors are reported separately).
Combining emissions from reciprocating compressor blowdown valves in operating and
standby mode.
Separating the reporting elements for the compressor source (wet seal degassing, rod
packing, isolation valve, or blowdown valve) from the emissions. For RY2015, the
reported leak identifiers were assigned to these categories by manually combining data
from multiple Envirofacts tables.
Separating the reporting elements for time in operating and not-operating modes from the
reported emissions and emission measurements.
Revising the reporting requirements for compressor venting sources to only yes/no
indicators for the sources routed to flare, combustion, or vapor recovery. Previous years
reported flared emissions and the fraction of gas recovered by different methods as
separate compressor data elements.
The addition of the measured flow rate and measurement method in the GHGRP RY2015
data enabled evaluation of reported measurements of zero emissions. The GHGRP RY2015 data
were filtered to exclude acoustic flow measurements due to the uncertainty associated with that
measurement method. The data were also filtered to retain all data sets where both methane
emissions and corresponding measured flow rates were reported.
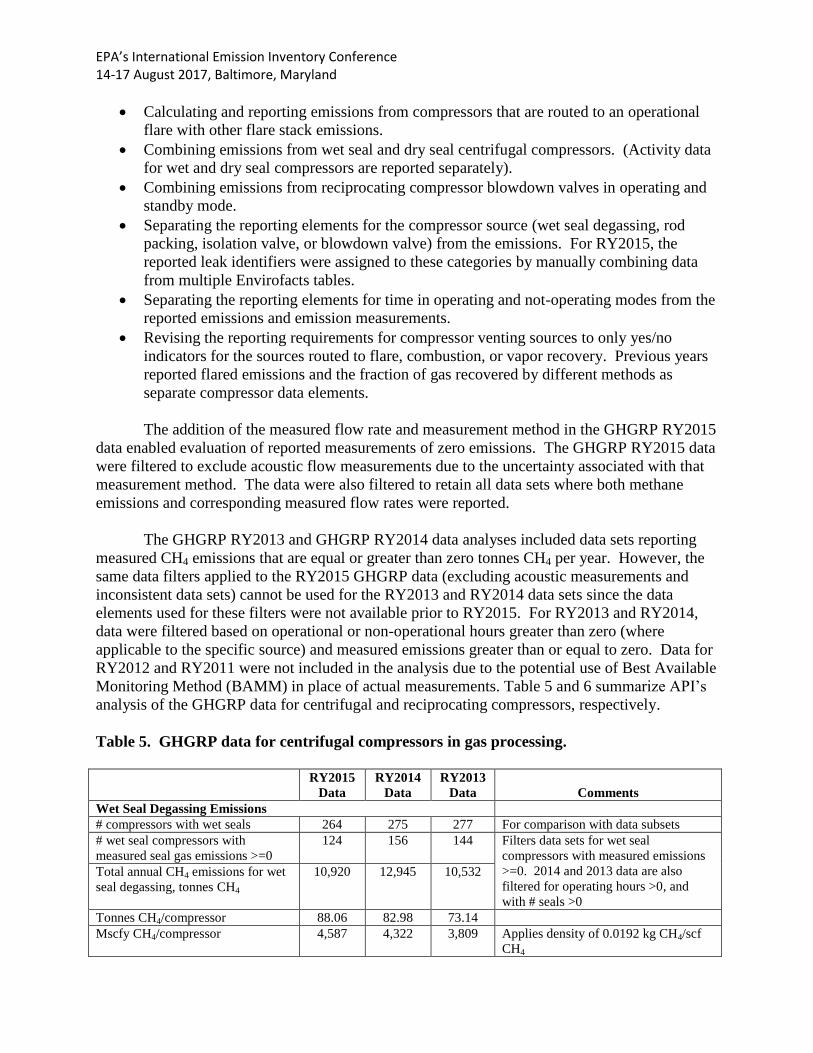
The GHGRP RY2013 and GHGRP RY2014 data analyses included data sets reporting
measured CH4 emissions that are equal or greater than zero tonnes CH4 per year. However, the
same data filters applied to the RY2015 GHGRP data (excluding acoustic measurements and
inconsistent data sets) cannot be used for the RY2013 and RY2014 data sets since the data
elements used for these filters were not available prior to RY2015. For RY2013 and RY2014,
data were filtered based on operational or non-operational hours greater than zero (where
applicable to the specific source) and measured emissions greater than or equal to zero. Data for
RY2012 and RY2011 were not included in the analysis due to the potential use of Best Available
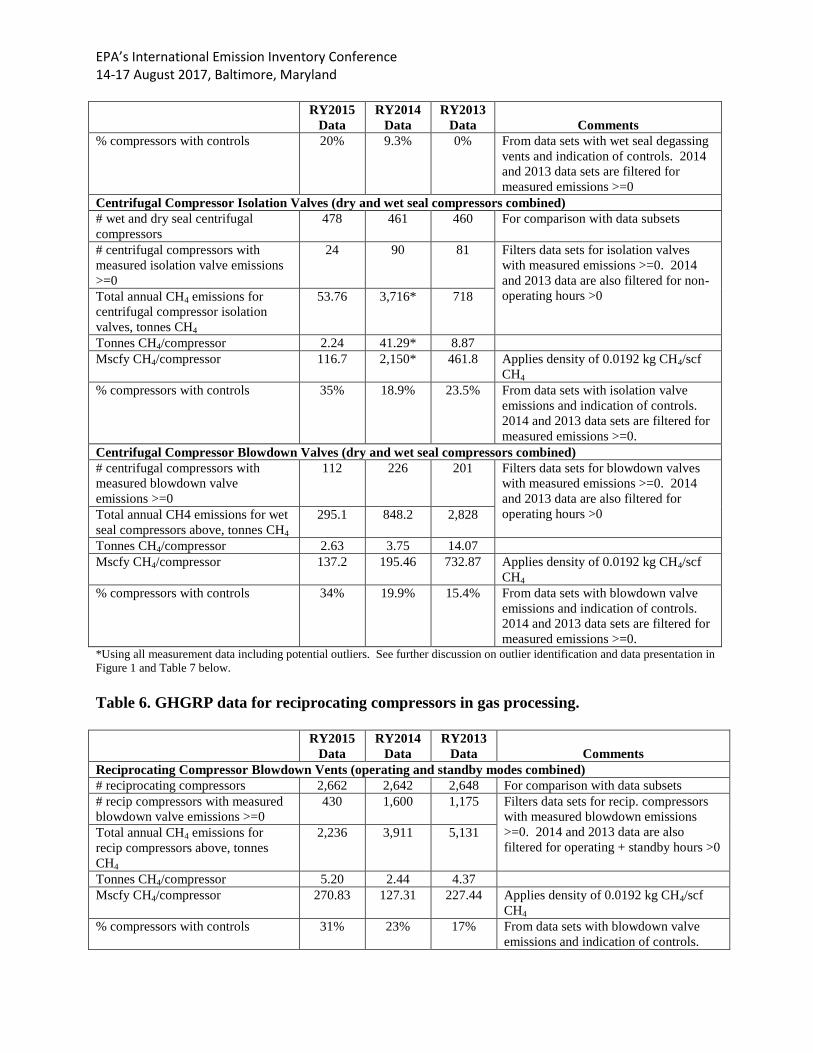
Monitoring Method (BAMM) in place of actual measurements. Table 5 and 6 summarize API’s
analysis of the GHGRP data for centrifugal and reciprocating compressors, respectively.
Table 5. GHGRP data for centrifugal compressors in gas processing.
RY2015
Data
RY2014
Data
RY2013
Data Comments
Wet Seal Degassing Emissions
# compressors with wet seals 264 275 277 For comparison with data subsets
# wet seal compressors with
measured seal gas emissions >=0
124 156 144 Filters data sets for wet seal
compressors with measured emissions
>=0. 2014 and 2013 data are also
filtered for operating hours >0, and
with # seals >0
Total annual CH4 emissions for wet
seal degassing, tonnes CH4
10,920 12,945 10,532
Tonnes CH4/compressor 88.06 82.98 73.14
Mscfy CH4/compressor 4,587 4,322 3,809 Applies density of 0.0192 kg CH4/scf
CH4
EPA’s International Emission Inventory Conference 14-17 August 2017, Baltimore, Maryland
RY2015
Data
RY2014
Data
RY2013
Data Comments
% compressors with controls 20% 9.3% 0% From data sets with wet seal degassing
vents and indication of controls. 2014
and 2013 data sets are filtered for
measured emissions >=0
Centrifugal Compressor Isolation Valves (dry and wet seal compressors combined)
# wet and dry seal centrifugal
compressors
478 461 460 For comparison with data subsets
# centrifugal compressors with
measured isolation valve emissions
>=0
24 90 81 Filters data sets for isolation valves
with measured emissions >=0. 2014
and 2013 data are also filtered for non-
operating hours >0 Total annual CH4 emissions for
centrifugal compressor isolation
valves, tonnes CH4
53.76 3,716* 718
Tonnes CH4/compressor 2.24 41.29* 8.87
Mscfy CH4/compressor 116.7 2,150* 461.8 Applies density of 0.0192 kg CH4/scf
CH4
% compressors with controls 35% 18.9% 23.5% From data sets with isolation valve
emissions and indication of controls.
2014 and 2013 data sets are filtered for
measured emissions >=0.
Centrifugal Compressor Blowdown Valves (dry and wet seal compressors combined)
# centrifugal compressors with
measured blowdown valve
emissions >=0
112 226 201 Filters data sets for blowdown valves
with measured emissions >=0. 2014
and 2013 data are also filtered for
operating hours >0 Total annual CH4 emissions for wet
seal compressors above, tonnes CH4
295.1 848.2 2,828
Tonnes CH4/compressor 2.63 3.75 14.07
Mscfy CH4/compressor 137.2 195.46 732.87 Applies density of 0.0192 kg CH4/scf
CH4
% compressors with controls 34% 19.9% 15.4% From data sets with blowdown valve
emissions and indication of controls.
2014 and 2013 data sets are filtered for
measured emissions >=0. *Using all measurement data including potential outliers. See further discussion on outlier identification and data presentation in
Figure 1 and Table 7 below.
Table 6. GHGRP data for reciprocating compressors in gas processing.
RY2015
Data
RY2014
Data
RY2013
Data Comments
Reciprocating Compressor Blowdown Vents (operating and standby modes combined)
# reciprocating compressors 2,662 2,642 2,648 For comparison with data subsets
# recip compressors with measured
blowdown valve emissions >=0
430 1,600 1,175 Filters data sets for recip. compressors
with measured blowdown emissions
>=0. 2014 and 2013 data are also
filtered for operating + standby hours >0 Total annual CH4 emissions for
recip compressors above, tonnes
CH4
2,236 3,911 5,131
Tonnes CH4/compressor 5.20 2.44 4.37
Mscfy CH4/compressor 270.83 127.31 227.44 Applies density of 0.0192 kg CH4/scf
CH4
% compressors with controls 31% 23% 17% From data sets with blowdown valve
emissions and indication of controls.
EPA’s International Emission Inventory Conference 14-17 August 2017, Baltimore, Maryland
0
5000
10000
15000
20000
25000
30000
35000
0 20 40 60 80 100 120
Me
than
e E
mis
sio
ns,
to
nn
es
CO
2e
Data Points
RY2015
Data
RY2014
Data
RY2013
Data Comments
2014 and 2013 data sets are filtered for
measured emissions >=0.
Reciprocating Compressor Isolation Valves
# recip compressors with measured
isolation valve emissions >=0
165 498 447 Filters data sets for recip compressors
with measured isolation valve emissions
>=0. 2014 and 2013 are also filtered for
non-operating hours >0 Total annual CH4 emissions for recip
compressors above, tonnes CH4
284.78 1,818 1,476
Tonnes CH4/compressor 1.73 3.65 3.30
Mscfy CH4/compressor 89.89 190.14 172.02 Applies density of 0.0192 kg CH4/scf
CH4
% compressors with controls 30% 20% 17% From data sets with isolation valve
emissions and indication of controls.
2014 and 2013 data sets are filtered for
measured emissions >=0.
Reciprocating Compressor Rod Packing
# recip compressors with measured
rod packing emissions >=0
1,239 1,405 1,140 Filters data sets for recip compressors
with measured rod packing emissions
>0. 2014 and 2013 are also filtered for
operating hours >0. Total annual CH4 emissions for
recip compressors above, tonnes
CH4
23,505 27,586 31,575
Tonnes CH4/compressor 18.97 19.63 27.70
Mscfy CH4/compressor 988 1,023 1,443 Applies density of 0.0192 kg CH4/scf
CH4
% compressors with controls 13% 23% 20% From data sets with rod packing
emissions and indication of controls.
2014 and 2013 data sets are filtered for
measured emissions >=0.
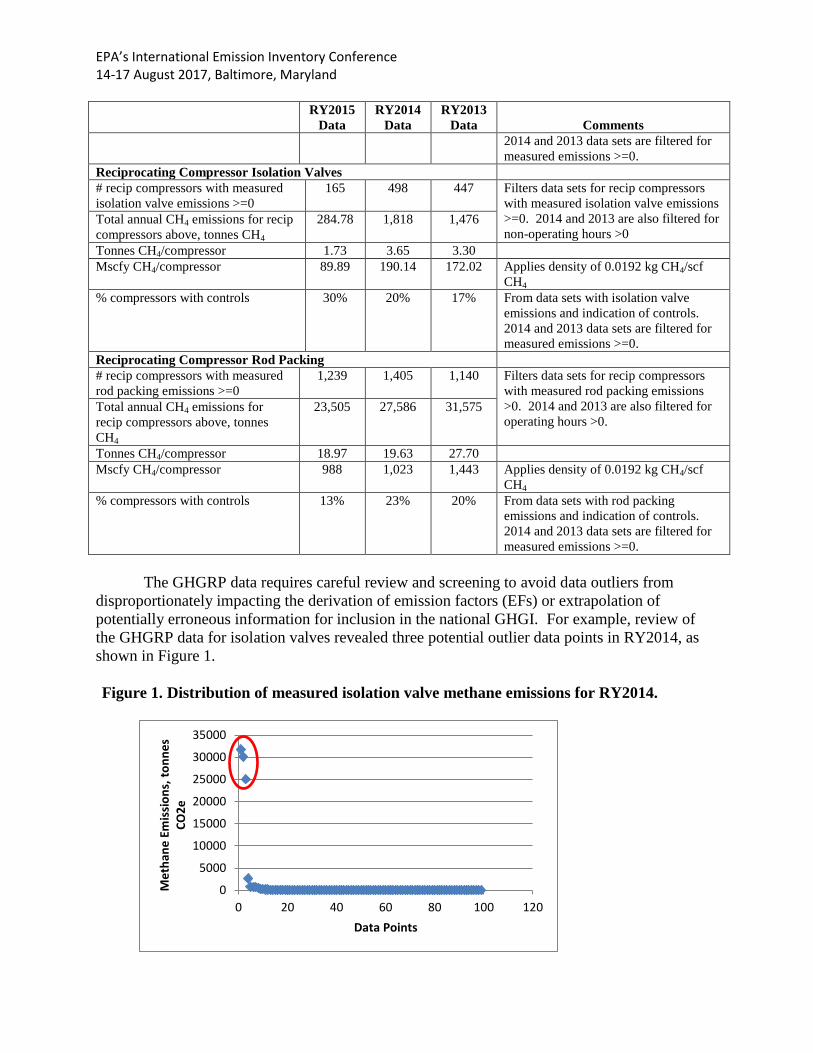
The GHGRP data requires careful review and screening to avoid data outliers from
disproportionately impacting the derivation of emission factors (EFs) or extrapolation of
potentially erroneous information for inclusion in the national GHGI. For example, review of
the GHGRP data for isolation valves revealed three potential outlier data points in RY2014, as
shown in Figure 1.
Figure 1. Distribution of measured isolation valve methane emissions for RY2014.

EPA’s International Emission Inventory Conference 14-17 August 2017, Baltimore, Maryland
Removing these three data points, which are shown to be extremely inconsistent with
over 99% of the other data points, significantly impacts the analysis results and changes the
RY2014 GHGRP results for Isolation Valves. The data presented in Table 7 offer an insight to
the importance of properly screening data prior to deriving emission factors and the impact it has
on the results of the analysis for Isolation Valves.
Table 7. Comparison of RY2014 GHGRP data for centrifugal compressors: isolation valves
(dry and wet seal compressors combined).
Including
Outliers
With Outliers
Removed
# Centrifugal Compressors with measured isolation valve
emissions >=0
90 87
Total annual CH4 emissions for centrifugal compressor isolation
valves, tonnes CH4
3,716 247
Tonnes CH4/compressor 41.29 2.84
Mscfy CH4/compressor 2,150 147.8
REVISED GAS PROCESSING COMPRESSOR EMISSION FACTORS FOR THE GHGI
The fugitive emission factor used in the GHGI for gas processing compressors is a
composite of average fugitive emissions for specific components associated with each
compressor type. The initial basis for the compressor emission factors was from data collected
in the early 1990’s.6 The emission factors considered all leaking components on the compressor
itself or immediately adjacent to it. The components included for each compressor type are
shown in Table 8.
Table 8. Summary of components included in the GHGI compressor fugitive emission
factors.
Wet Seal
Centrifugal
Compressor
Components
Dry Seal
Centrifugal
Compressor
Components
Reciprocating
Compressor
Components
Notes
Miscellaneous Miscellaneous Miscellaneous Includes other components such as
cylinder valve covers and fuel valves
Compressor Starter
Open Ended Line
Compressor Starter
Open Ended Line
Compressor Starter
Open Ended Line
Included as part of general fugitive
emissions under the GHGRP, not as part
of the compressor fugitive emissions.
Compressor
Blowdown Open
Ended Line
Compressor
Blowdown Open
Ended Line
Compressor Blowdown
Open Ended Line
Measured in the “as-found” mode as part
of the GHGRP
Isolation Valve Isolation Valve Isolation Valve Measured in the “as-found” mode or once
every 3 years as part of the GHGRP
Compressor Wet Seal
Degassing
Compressor Dry
Seal
Rod Packing Wet seals and reciprocating rod packing
emissions are measured as part of the
GHGRP. Centrifugal compressor dry
seals are not included in the GHGRP.

EPA’s International Emission Inventory Conference 14-17 August 2017, Baltimore, Maryland
Tables 9a, 9b, and 10 compare the emission factors previously used in the GHGI to
measured component emissions reported through the GHGRP. Outlier data points from the
GHGRP data identified above have been removed for this analysis.
Tables 9a and 9b present the compressor source data used to derive emission factors for
wet and dry seal centrifugal compressors, respectively. The GHGRP data are presented
separately for RY2013, RY2014, and RY2015. A weighted average of the GHGRP data for all
three years is then used to derive an updated emission factor. For those compressor sources with
controls, a 98% control efficiency was assumed to account for both the operational time of the
control device (the majority were reported as 100% operational) and the combustion efficiency
of the control device. The previous 2016GHGI (RY2014) data7 are presented for comparison.
Table 10 presents the emission factor data in the same format for reciprocating compressors.
Table 9a. GHGI and GHGRP Data for wet seal centrifugal compressor emission factor.
Component
Mscfy CH4/component
(not controlled)
GHGRP
Weighted
Average %
Controlled
Mscfy
CH4/compressor
2016
GHGI
Data
RY2014
RY2013
GHGRP
Data
RY2014
GHGRP
Data
RY2015
GHGRP
Data
GHGRP Weighted
Average EF
(includes controls)
Compressor Starter Open-
ended Line
1,341 (Included with
fugitive emissions)
Miscellaneous 31 31
Isolation Valve (dry and
wet seal compressors)
Not
included
462 148 117 31% 192
Blowdown Vent (dry and
wet seal compressors)
6,447 733 195 137 26% 286
Compressor Seal (Wet
seal degassing)
10,930 3,809 4,322 4,587 12% 3,739
Annual Compressor EF,
Mscfy CH4/compressor
18,749 4,248
Daily Compressor EF,
scfd CH4/compressor 51,369 11,638
Table 9b. GHGI and GHGRP data for dry seal centrifugal compressor emission factor.
Component
Mscfy CH4/component
(not controlled)
Weighted
Average %
Controlled
Mscfy
CH4/compressor
2016
GHGI
Data
RY2014
RY2013
GHGRP
Data
RY2014
GHGRP
Data
RY2015
GHGRP
Data
GHGRP Weighted
Average EF
(includes controls)
Compressor Starter Open-
ended Line
1,341 (Included with
fugitive emissions)
Compressor Seal (Dry) 1,374 1,374
Miscellaneous 31 31
Isolation Valve Not
Included
462 148 117 31% 192
Blowdown Vent 6,447 733 195 137 26% 286
EPA’s International Emission Inventory Conference 14-17 August 2017, Baltimore, Maryland
Annual Compressor EF,
Mscfy CH4/compressor
9,193 1,883
Daily Compressor EF,
scfd CH4/compressor 25,186 5,158
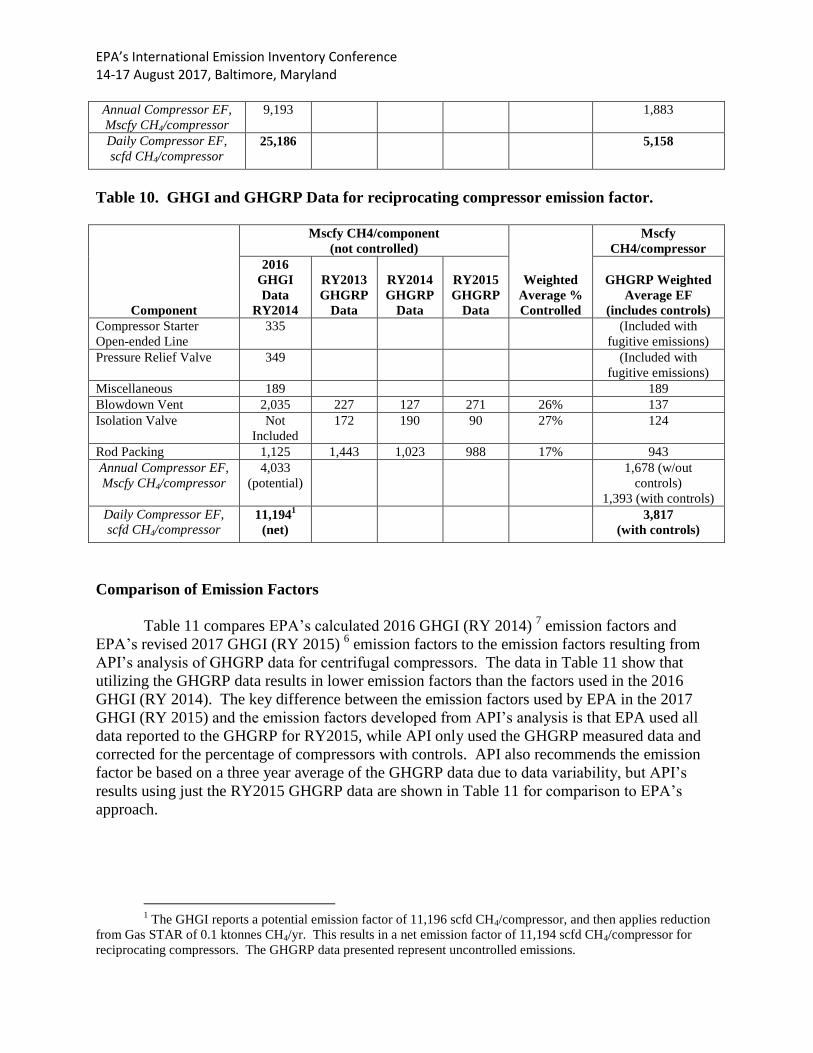
Table 10. GHGI and GHGRP Data for reciprocating compressor emission factor.
Component
Mscfy CH4/component
(not controlled)
Weighted
Average %
Controlled
Mscfy
CH4/compressor
2016
GHGI
Data
RY2014
RY2013
GHGRP
Data
RY2014
GHGRP
Data
RY2015
GHGRP
Data
GHGRP Weighted
Average EF
(includes controls)
Compressor Starter
Open-ended Line
335 (Included with
fugitive emissions)
Pressure Relief Valve 349 (Included with
fugitive emissions)
Miscellaneous 189 189
Blowdown Vent 2,035 227 127 271 26% 137
Isolation Valve Not
Included
172 190 90 27% 124
Rod Packing 1,125 1,443 1,023 988 17% 943
Annual Compressor EF,
Mscfy CH4/compressor
4,033
(potential)
1,678 (w/out
controls)
1,393 (with controls)
Daily Compressor EF,
scfd CH4/compressor 11,194
1
(net)
3,817
(with controls)
Comparison of Emission Factors
Table 11 compares EPA’s calculated 2016 GHGI (RY 2014) 7 emission factors and
EPA’s revised 2017 GHGI (RY 2015) 6 emission factors to the emission factors resulting from
API’s analysis of GHGRP data for centrifugal compressors. The data in Table 11 show that
utilizing the GHGRP data results in lower emission factors than the factors used in the 2016
GHGI (RY 2014). The key difference between the emission factors used by EPA in the 2017
GHGI (RY 2015) and the emission factors developed from API’s analysis is that EPA used all
data reported to the GHGRP for RY2015, while API only used the GHGRP measured data and
corrected for the percentage of compressors with controls. API also recommends the emission
factor be based on a three year average of the GHGRP data due to data variability, but API’s
results using just the RY2015 GHGRP data are shown in Table 11 for comparison to EPA’s
approach.
1 The GHGI reports a potential emission factor of 11,196 scfd CH4/compressor, and then applies reduction
from Gas STAR of 0.1 ktonnes CH4/yr. This results in a net emission factor of 11,194 scfd CH4/compressor for
reciprocating compressors. The GHGRP data presented represent uncontrolled emissions.

EPA’s International Emission Inventory Conference 14-17 August 2017, Baltimore, Maryland
Table 11. Comparison of Centrifugal Compressor Emission Factors, tonnes
CH4/compressor.
Average annual CH4 emissions
per compressor (tonnes
CH4/compressor)
2016
GHGI
RY2014
2017
GHGI
RY2015
API’s Analysis of
GHGRP Data
(average 2013-2015)
API’s Analysis using
RY2015 GHGRP
Data Only
Wet Seal Compressors 361 57 82 75
Dry Seal Compressors 177 30 36 30
Table 12 compares the 2016 GHGI (RY2014)7 emission factor, revised 2017 GHGI
(RY2015)6 emission factor, and emission factor resulting from API’s analysis of GHGRP data
for reciprocating compressors. The 2017 GHGI (RY2015) emission factor is lower than the
approach recommended by API because EPA analysis used all the GHGRP data, not just the
measured values, and EPA’s emission factor reflects only GHGRP RY2015 data (there is a
general downward trend in the GHGRP data for reciprocating compressor emissions).
Table 12. Comparison of Reciprocating Compressor Emission Factors, tonnes
CH4/compressor.
2016
GHGI
RY2014
2017
GHGI
RY2015
API’s Analysis of
GHGRP Data
(average 2013-2015)
API’s Analysis using
RY2015 GHGRP
Data Only
Average annual CH4 emissions per
compressor (tonnes CH4/compressor) 79 19 27 25
CONCLUSIONS
EPA’s revisions to well counts used in the national GHG inventory is a significant
improvement for the characterization of emissions from petroleum and natural gas production
operations, API continues to encourage EPA to be transparent in the process that the agency
uses to develop their national well counts and to share their underlying data.
For gas processing facilities in the GHGI, API recommends using the GHGRP ratio of
centrifugal and reciprocating compressors per gas plant to extrapolate the number of compressors
nationally, based on the national gas plant count provided by the EIA survey. Due to regulations
controlling emissions from compressors, which may lead to changes in the types of compressors
used in the future, we expect to see the counts of compressors by type to vary year to year.
Therefore, it would be appropriate to update the ratio of compressors to gas plants each year
based on the GHGRP data.
The emission factors presented in this paper include the new GHGRP data available for
RY2015, as well as any updates reported for RY2013 and RY2014. Data reported for RY2015
included revised reporting elements which changed the approach for analyzing the data
compared to previous years. However, for all reporting years, the emissions data reflected in this
memo only include measured emissions and excluded data inconsistencies.

EPA’s International Emission Inventory Conference 14-17 August 2017, Baltimore, Maryland
The emission factors presented in Tables 9a, 9b, and 10 exclude emissions from starter
open ended lines, which are reported under equipment leaks in the GHGRP. For centrifugal
compressors, three outlier isolation valve data points were excluded for RY2014. The emission
factors presented in Tables 9a, 9b, and 10 also include corrections to account for controls
(flaring, vapor recovery, or captured for combustion) and GHGRP data sets reporting zero
methane emissions. The data in Tables 9a, 9b and 10 reflect current operating practices, as well
as leak repair practices implemented by the reporting companies as a result of monitoring the
compressors. Since controls are included in the emission factors derived from the GHGRP data,
use of these factors in the GHGI should be on a net emission basis and should not separately
account for reductions reported through Gas STAR.
ACKNOWLEDGEMENT
The authors would like to recognize the contribution of API member companies in the
review of the GHGRP data. API would also like to acknowledge the collaboration with EPA’s
Climate Change Division and on-going efforts to develop the characterization of industry
emissions in the annual national GHG inventory
REFERENCES
1. GRI/EPA (1996), “Methane Emissions from the Natural Gas Industry”, Volume 2: Technical
Report, EPA-600R-96-080b, June 1996
2. Code of Federal Regulations, Title 40 EPA, Part 98 Mandatory Greenhouse Gas Reporting,
Subpart W: Petroleum and Natural Gas Systems.
3. Independent Petroleum Association of America (IPAA), “United State Petroleum Statistics”,
2014 Data, June 2015.
4. World Oil, Producing Gas Wells Hold Up Amid Commodities Rout and Producing Oil Wells
Tick Down as Price Begins to Hit, February 2016.
5. (a) Energy Information Administration, Stripper wells accounted for 11% of U.S. natural gas
production in 2015, “Today in Energy”, July 28, 2016; gas wells:
https://www.eia.gov/todayinenergy/detail.php?id=27272
(b) Energy Information Administration, Stripper wells accounted for 10% of U.S. oil
production in 2015, “Today in Energy”, June 29, 2016; oil wells:
https://www.eia.gov/todayinenergy/detail.php?id=26872
6. U.S. EPA, “Inventory of U.S. Greenhouse Gas Emissions and Sinks 1990-2015, (April
2017); https://www.epa.gov/ghgemissions/inventory-us-greenhouse-gas-emissions-and-
sinks-1990-2015
EPA’s International Emission Inventory Conference 14-17 August 2017, Baltimore, Maryland
7. U.S. EPA, “Inventory of U.S. Greenhouse Gas Emissions and Sinks 1990-2014, (April
2016); https://www.epa.gov/ghgemissions/inventory-us-greenhouse-gas-emissions-and-
sinks-1990-2014
8. GRI/EPA (1996), “Methane Emissions from the Natural Gas Industry”, Volume 8: Fugitive
Emissions, EPA-600R-96-080b, June 1996
KEY WORDS
Greenhouse gases
Emission inventories
Emission factors
Petroleum and Natural Gas
Production wells
Compressors