using the interactions of designed sirna
TRANSCRIPT

ldquoUsing the interactions of designed siRNA
and DNA drug carrier systems with human
blood plasma and its components for
controlled drug deliveryrdquo
Dissertation zur Erlangung des Grades ldquoDoktor der Naturwissenschaftenrdquo im
Promotionsfach Chemie
am Fachbereich Chemie Pharmazie und Geowissenschaften der
Johannes Gutenberg-Universitaumlt Mainz
(D77)
Laura Muumlller
geb in Mainz Deutschland
Mainz 2016
Dekan
1 Berichterstatter
2 Berichterstatter
Tag der muumlndlichen Pruumlfung
Contents I 1 ABSTRACT 1
2 INTRODUCTION 3
21 BLOOD 3
22 NANOMATERIALS AS DRUG DELIVERY SYSTEMS 5
221 Liposomes for SIRNA DELIVERY 6
23 PROTEIN CORONA 11
231 THE STEALTH EFFECT 14
24 PROTEIN CORONA ANALYSIS 15
241 IN SITU ANALYSIS 16
242 HARD CORONA ANALYSIS 21
25 AIM OF THIS WORK 25
3 RESULTS AND DISCUSSION 27
31 FRACTIONATION OF HUMAN BLOOD PLASMA 27
32 FRACTIONS OF PROTEIN MIXTURES DIFFERENTIALLY AGGREGATE NANOPARTICLES AND INFLUENCE THE
CELLULAR UPTAKE 36
321 THE PARTICLES UNDER INVESTIGATION 37
322 SOFT PROTEIN CORONA ANALYSIS 38
323 HARD PROTEIN CORONA ANALYSIS 46
324 TAILORING THE HARD CORONA 48
325 THE IMPACT OF PROTEIN CONCENTRATION ON PARTICLE AGGREGATION AND STABILIZATION
VIA PRE-COATING 59
326 USING PROTEIN MIXTURES AS SURFACTANTS FOR PARTICLE STABILIZATION 67
327 Summary 72
33 HUMAN BLOOD PLASMA VERSUS SERUM 74
34 EVALUATION OF NANOPARTICLE STABILITY IN HUMAN BLOOD SERUM BY DYNAMIC LIGHT SCATTERING
THE IMPACT OF PERSONALIZED HUMAN BLOOD SERUM COMPOSITION 79
341 ANALYSIS OF INDIVIDUAL AND POOLED HUMAN BLOOD SERUM 80
342 STABILITY EVALUATION OF NANOPARTICLES IN HUMAN BLOOD SERUM BY DYNAMIC LIGHT
SCATTERING 83
343 TAKING ADVANTAGE OF THE INFLUENCE OF PERSONALIZED SERUM ON PARTICLES STABILITY
85
344 HEAT INACTIVATION OF HUMAN BLOOD SERUM 90
345 DILUTION AS A TOOL FOR PRE-COATING OF NANOPARTICLES 97
346 Summary 100
35 THE TRANSFER OF A PROTEIN CORONA 101
351 THE STEALTH NANOCARRIER 101
II
352 CORONA TRANSFER 106
36 EVALUATION OF DIFFERENT IN VIVO MODELS FOR BIOMEDICAL APPLICATION 111
361 CHARACTERIZATION OF DIFFERENT BLOOD PLASMA SOURCES 111
362 INVESTIGATION OF PROTEIN-PARTICLE INTERACTIONS 116
37 FROM THE MODEL SYSTEM TOWARDS LIPOSOMES FOR BIOMEDICAL APPLICATION 124
371 EVALUATION OF MULTIFUNCTIONAL LIPOSOMES IN HUMAN BLOOD SERUM BY DYNAMIC
LIGHT SCATTERING 124
372 MULTICOMPONENT LIPOSOMES FOR SIRNA DELIVERY TO THE LIVER 131
4 SUMMARY AND OUTLOOK 147
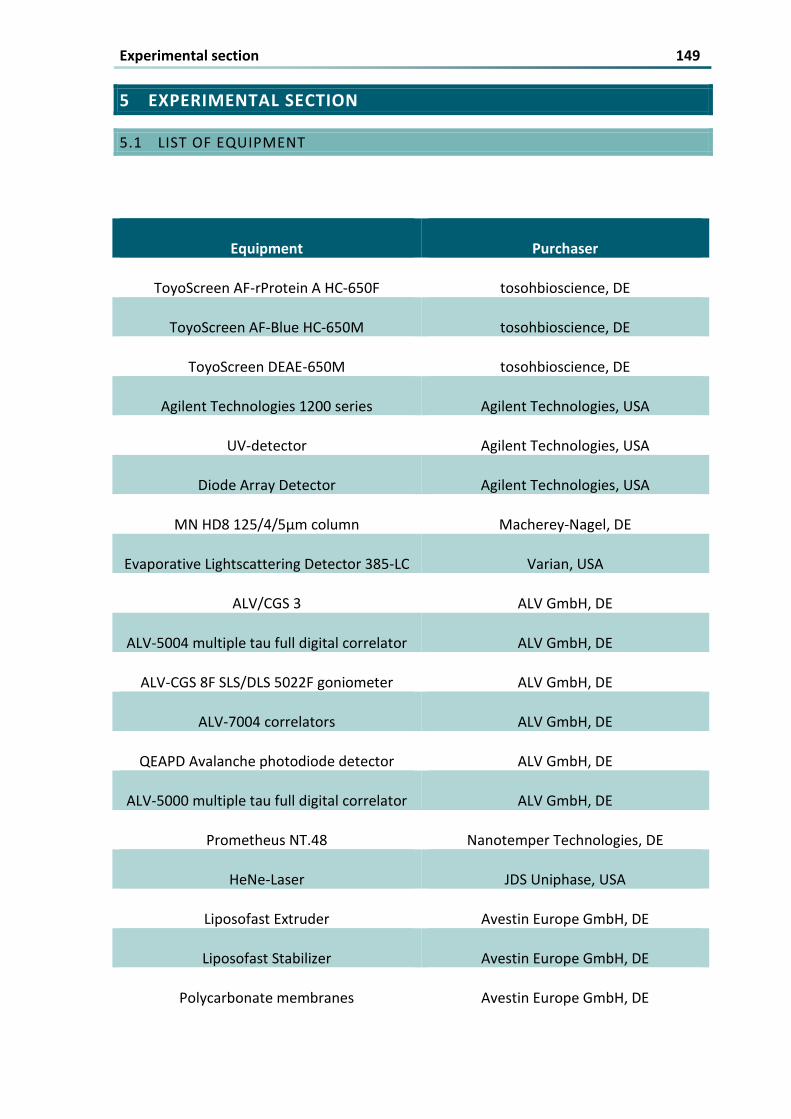
5 EXPERIMENTAL SECTION 149
51 LIST OF EQUIPMENT 149
52 METHODS 151
521 Fractionation of human blood plasma 151
522 Fractions of protein mixture differentially aggregate nanoparticles and influence the cellular
uptake 154
523 Human Blood Plasma versus Serum 159
524 Evaluation of NP stability in human blood serum 159
525 The transfer of a protein corona 161
526 Evaluation of different in vivo models 162
527 Evaluation of multifunctional liposomes in human blood serum by dynamic light scattering 163
528 Multicomponent liposomes for siRNA delivery to the liver 163
6 REFERENCES 173
7 APPENDIX 183
71 ABBREVIATIONS 183
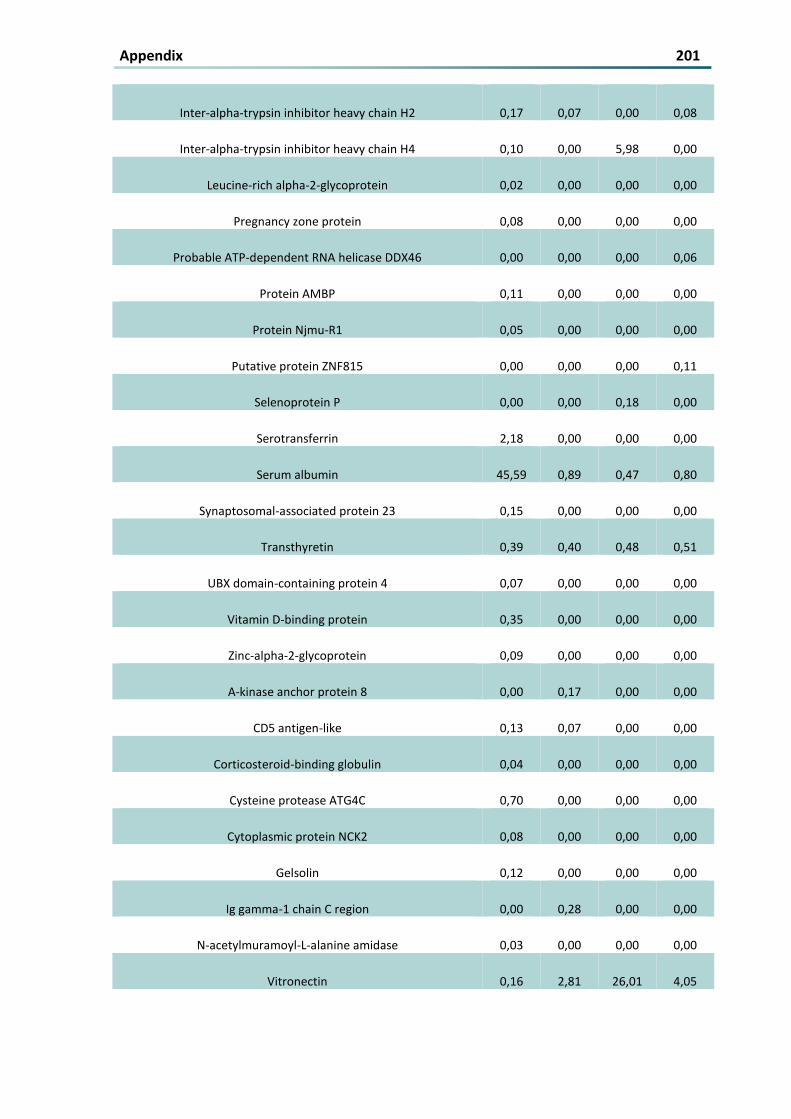
72 SUPPLEMENTARY INFORMATION 185
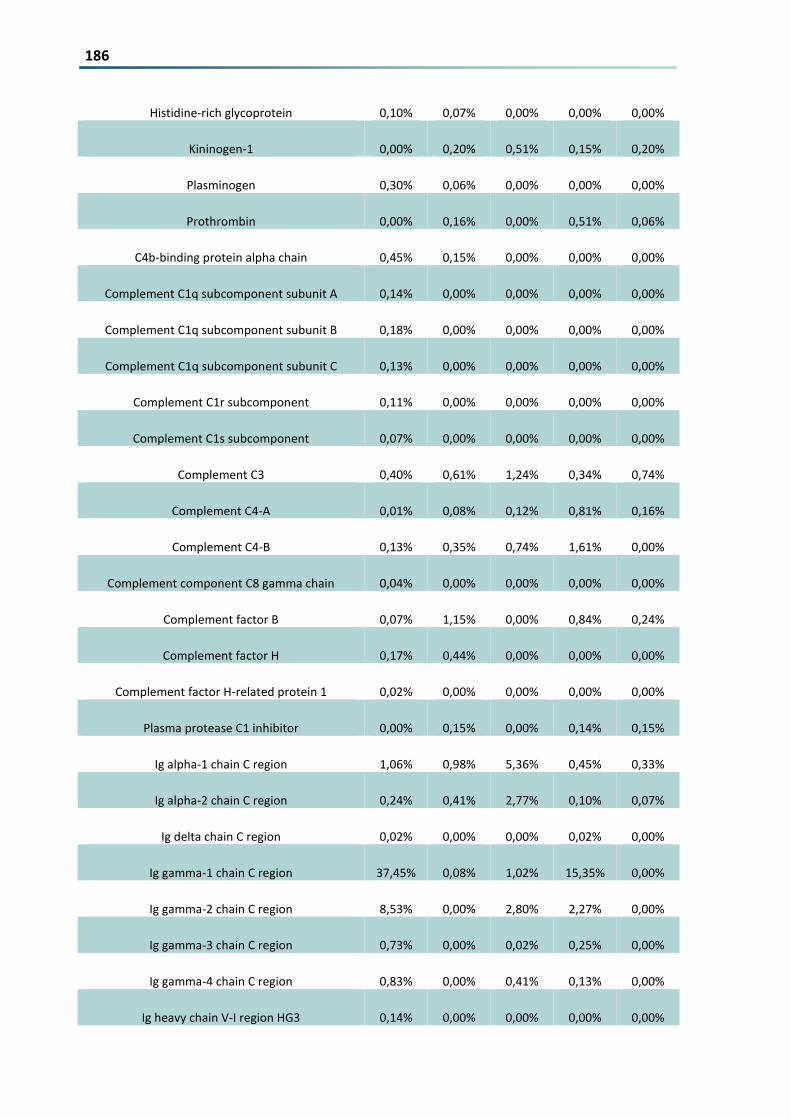
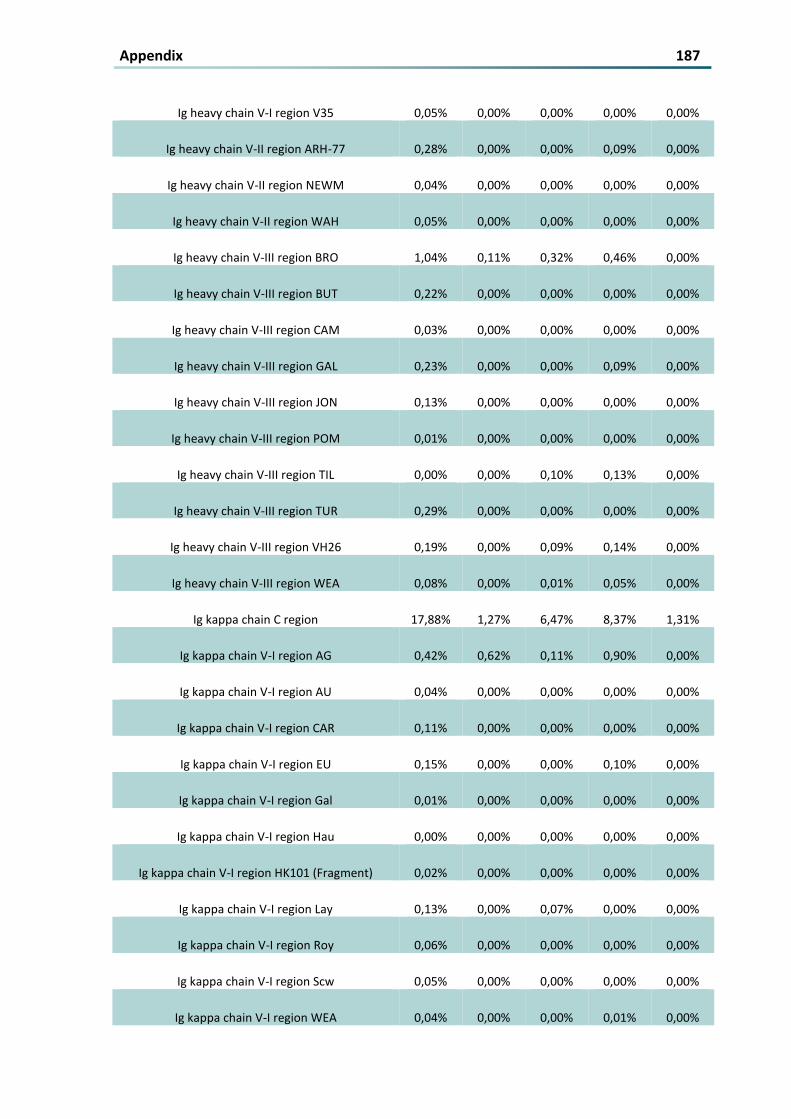
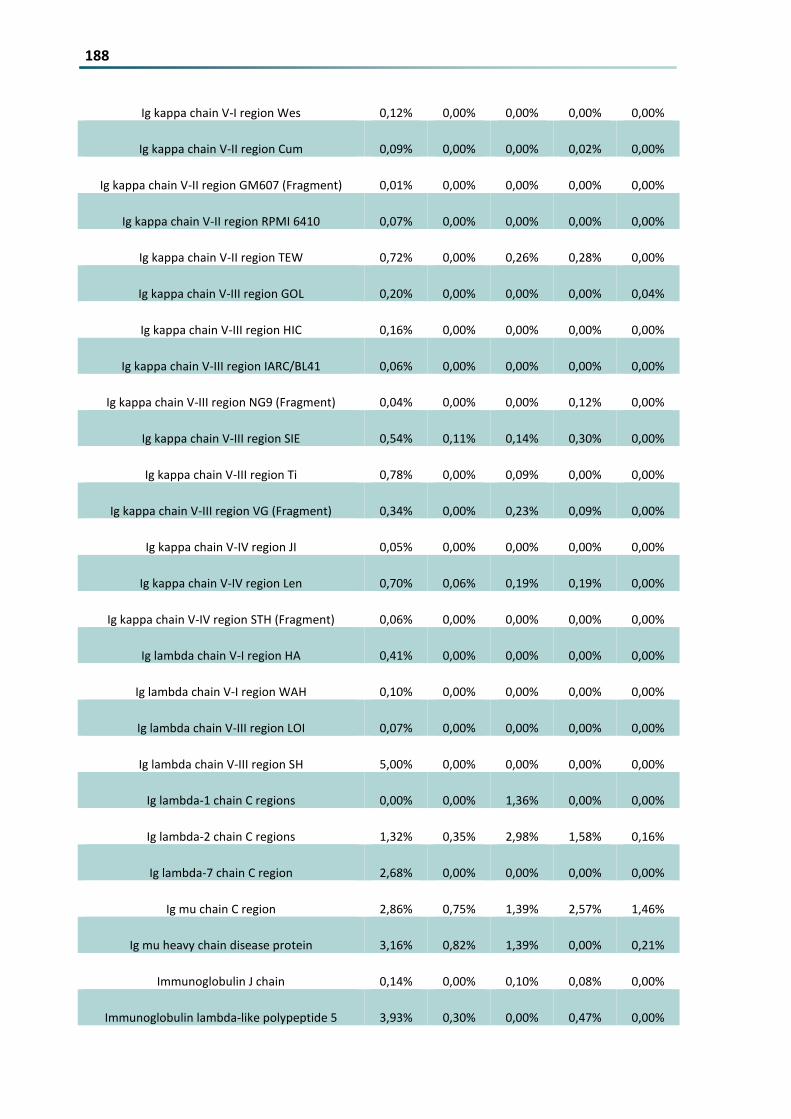
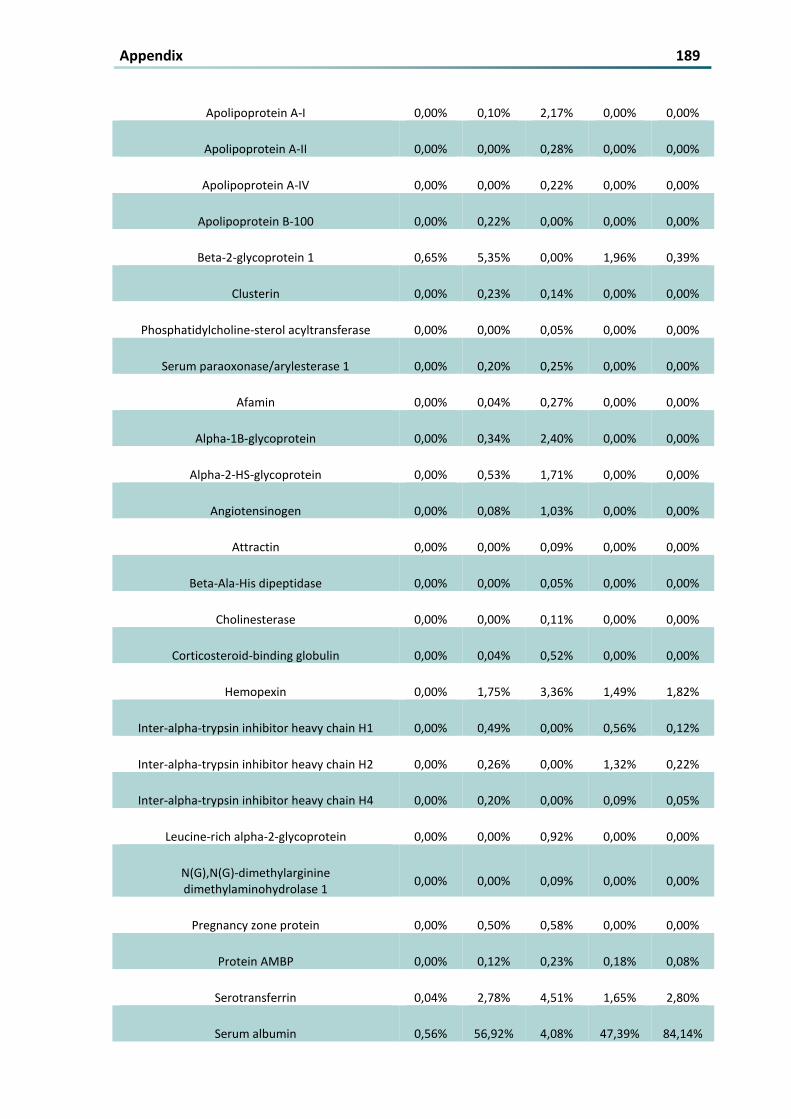
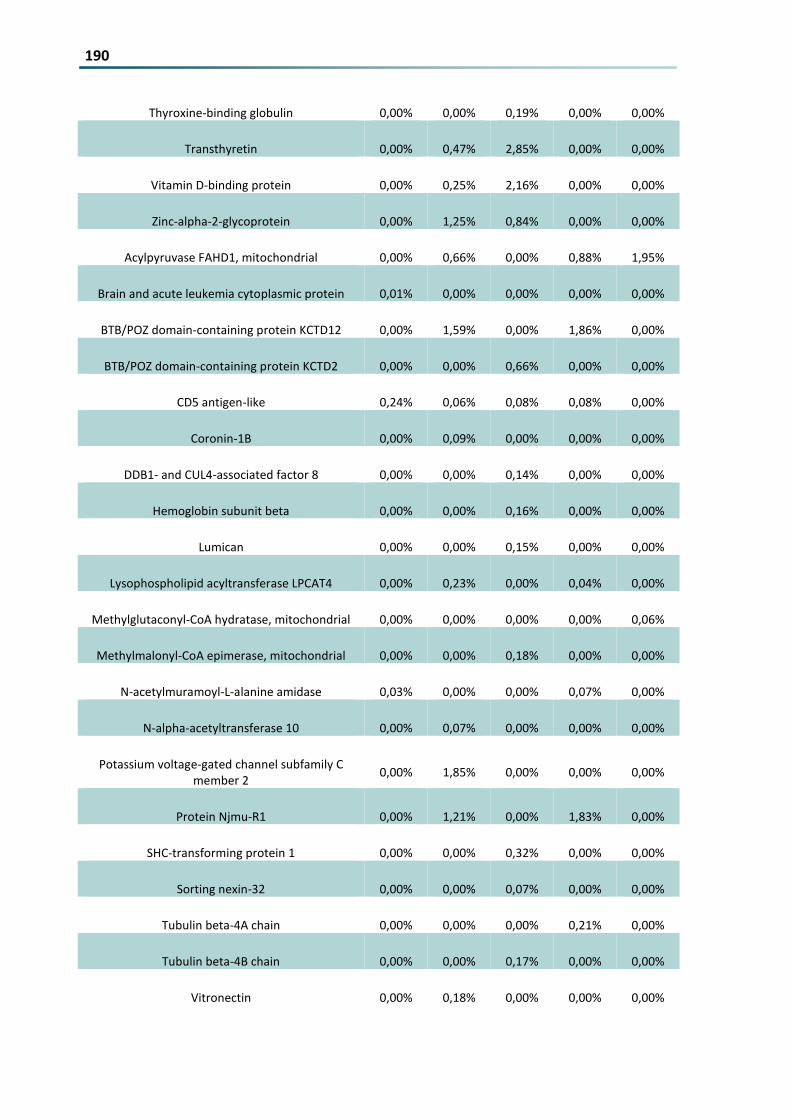
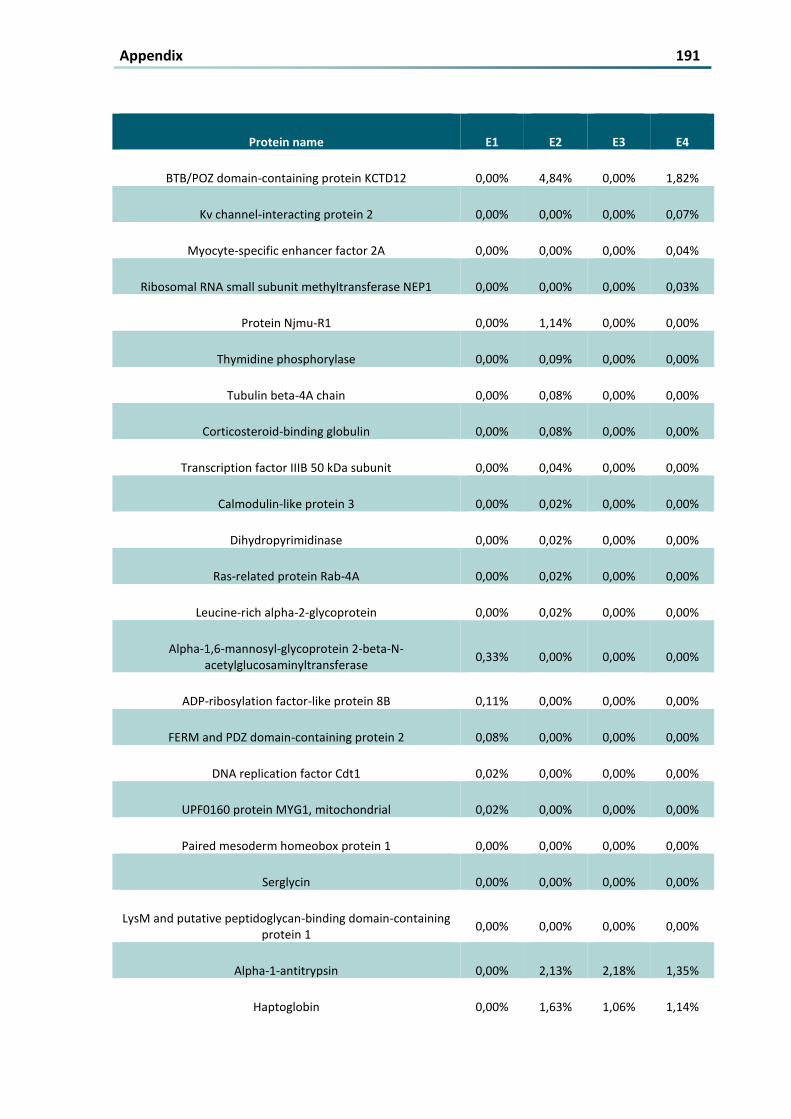
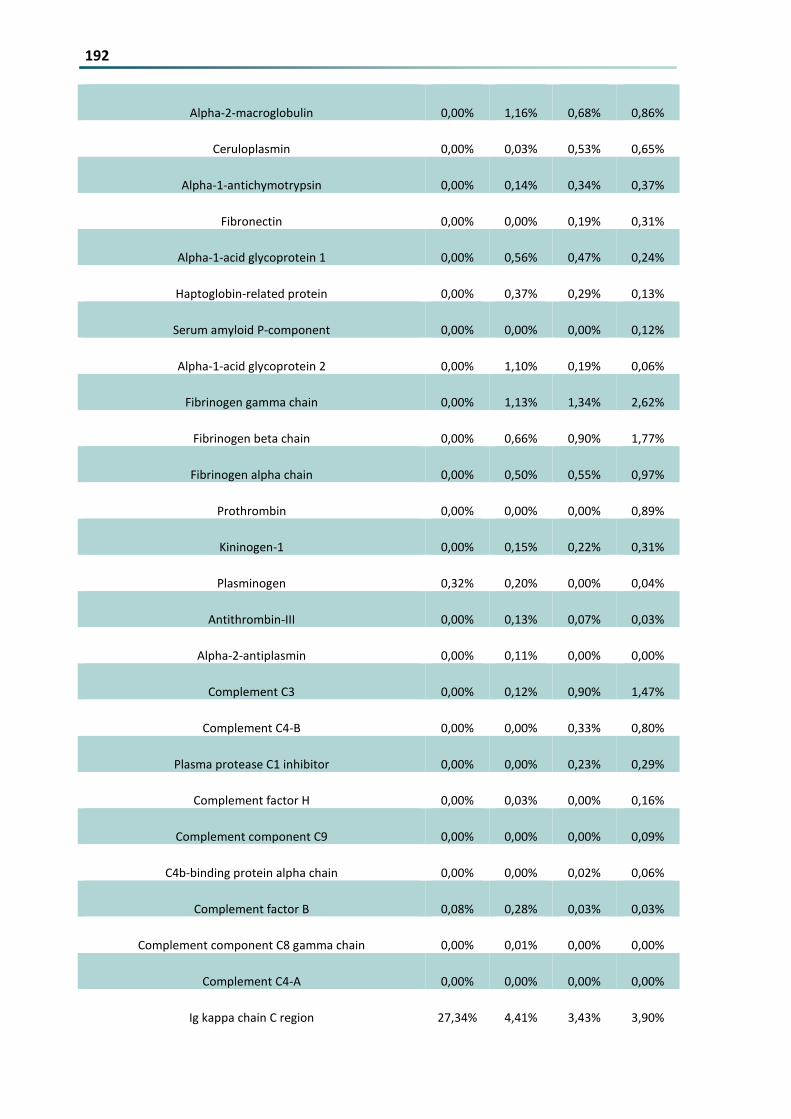
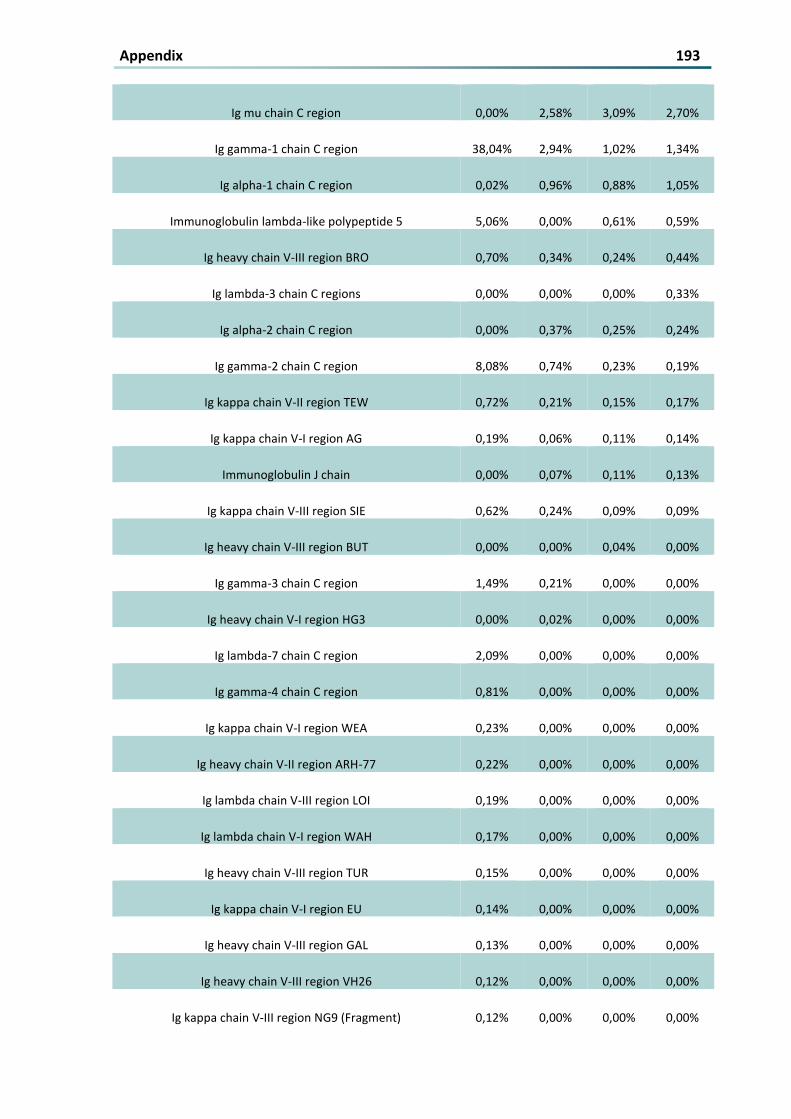
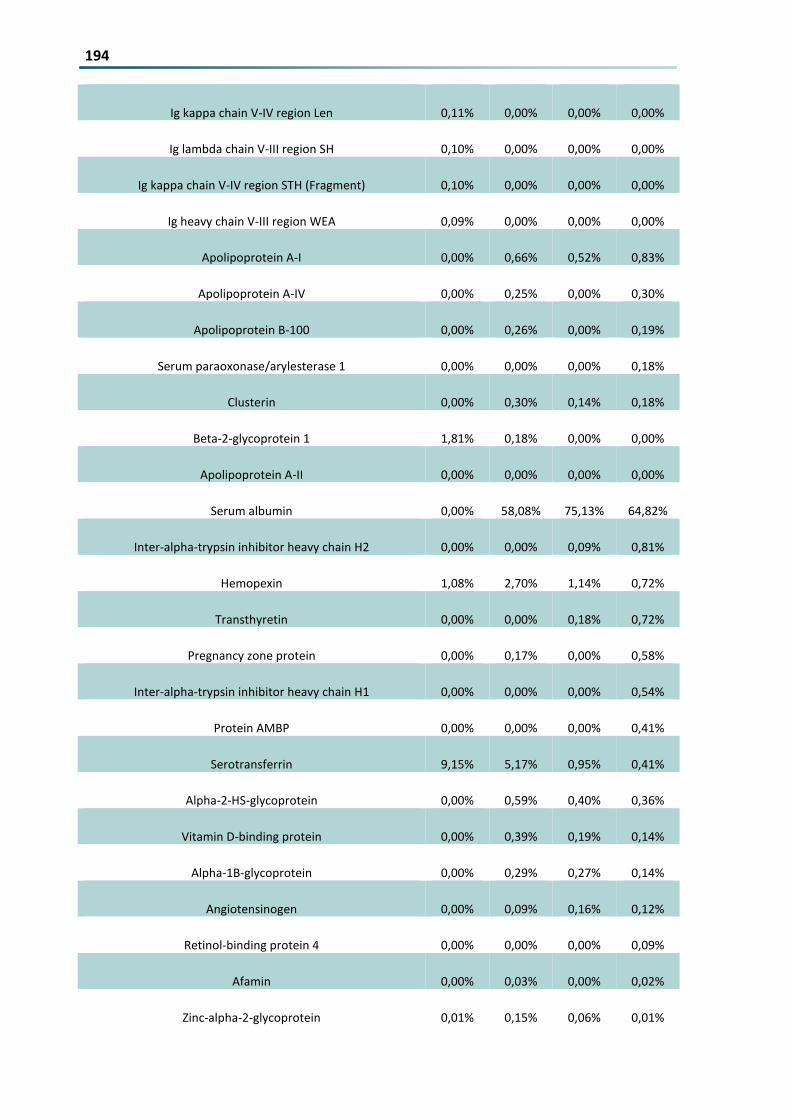
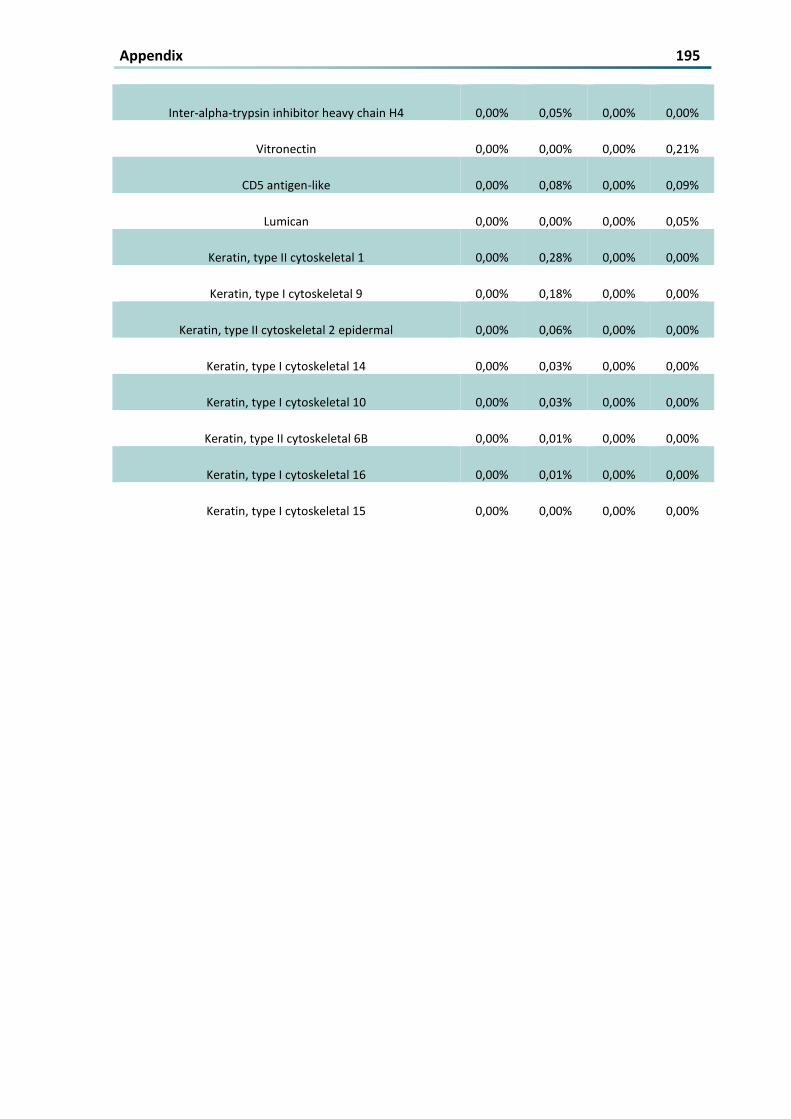
721 LC-MS DATA FOR BLOOD PLASMA FRACTIONATION 185
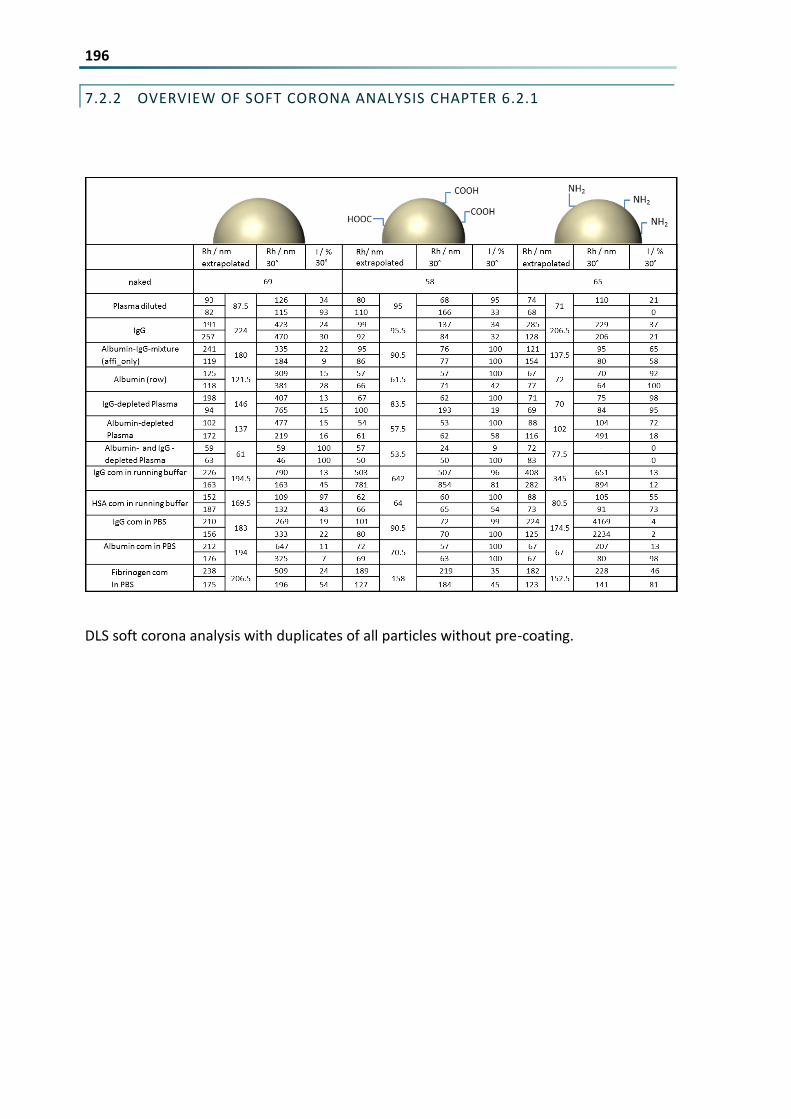
722 OVERVIEW OF SOFT CORONA ANALYSIS CHAPTER 621 196
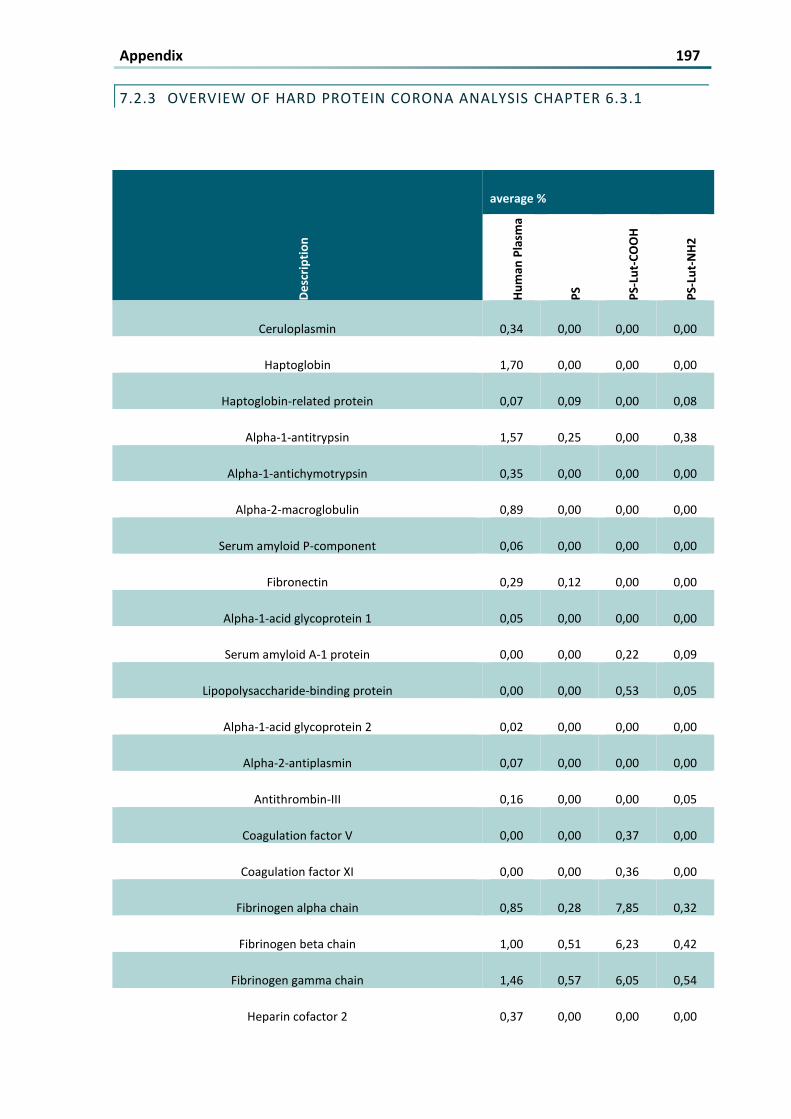
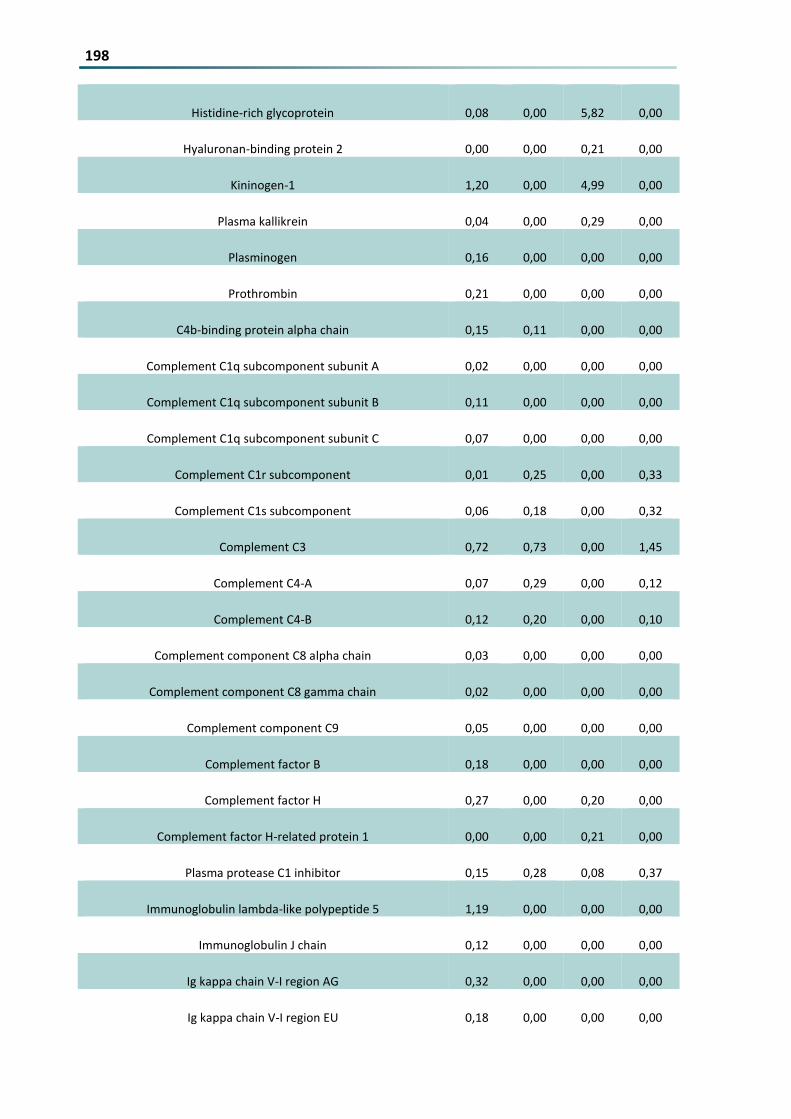
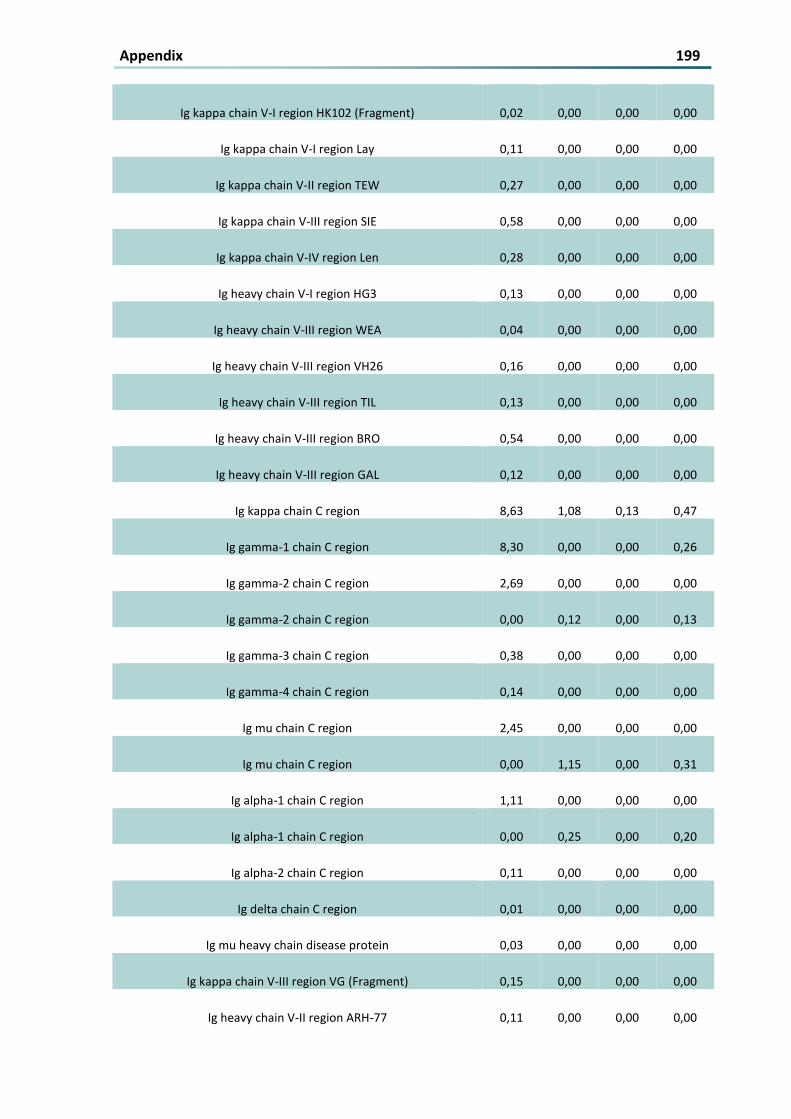
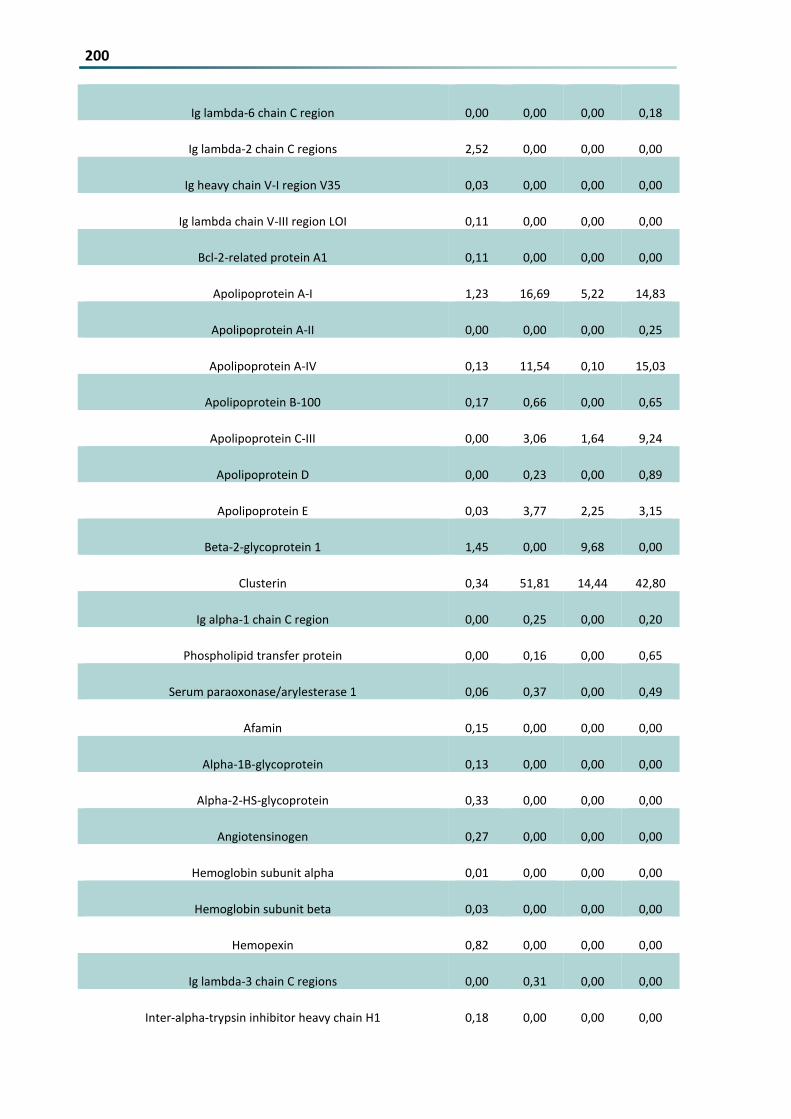
723 OVERVIEW OF HARD PROTEIN CORONA ANALYSIS CHAPTER 631 197
724 CHARACTERIZATION OF INDIVIDUAL AND POOLED HUMAN SERUM 202
8 ZUSAMMENFASSUNG 203
Contents III LIST OF FIGURES
Figure 1 The human plasma proteome8 4
Figure 2 Passive18
(1) versus active (2) targeting The defect architecture of tumor tissue allows the
penetration with nutrients and macromolecules By conjugating antibodies to macromolecules the
accumulation can be increased by specific antibody-receptor interactions on the surface of tumor
cells Figure 2 (1) Reprinted from Advanced Drug Delivery Reviews Volume 65 Issue 1 Hirashi Maeda
Hideaki Nakamura Jun Fang ldquoThe EPR effect for macromolecular drug delivery to solid tumors
Improvement of tumor uptake lowering of systemic toxicity and distinct tumor imaging in vivordquo
Pages 71-79 Copyright copy (2012) with permission from Elsevier Elsevier 6
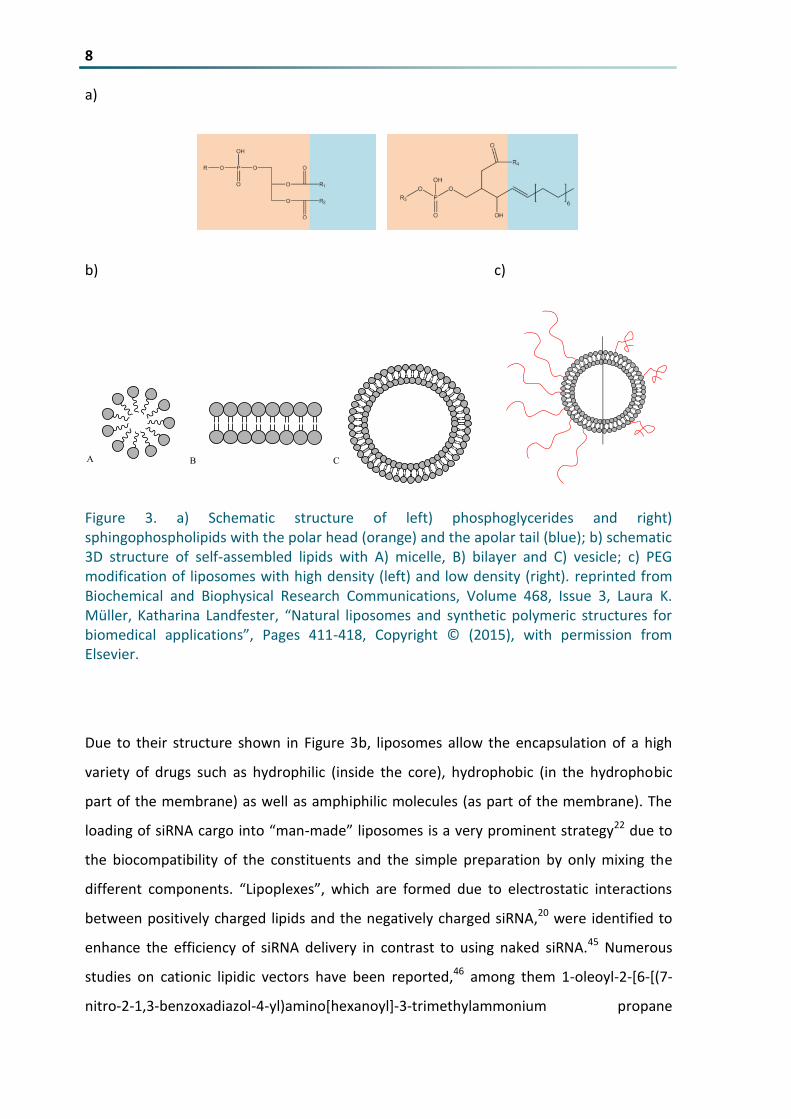
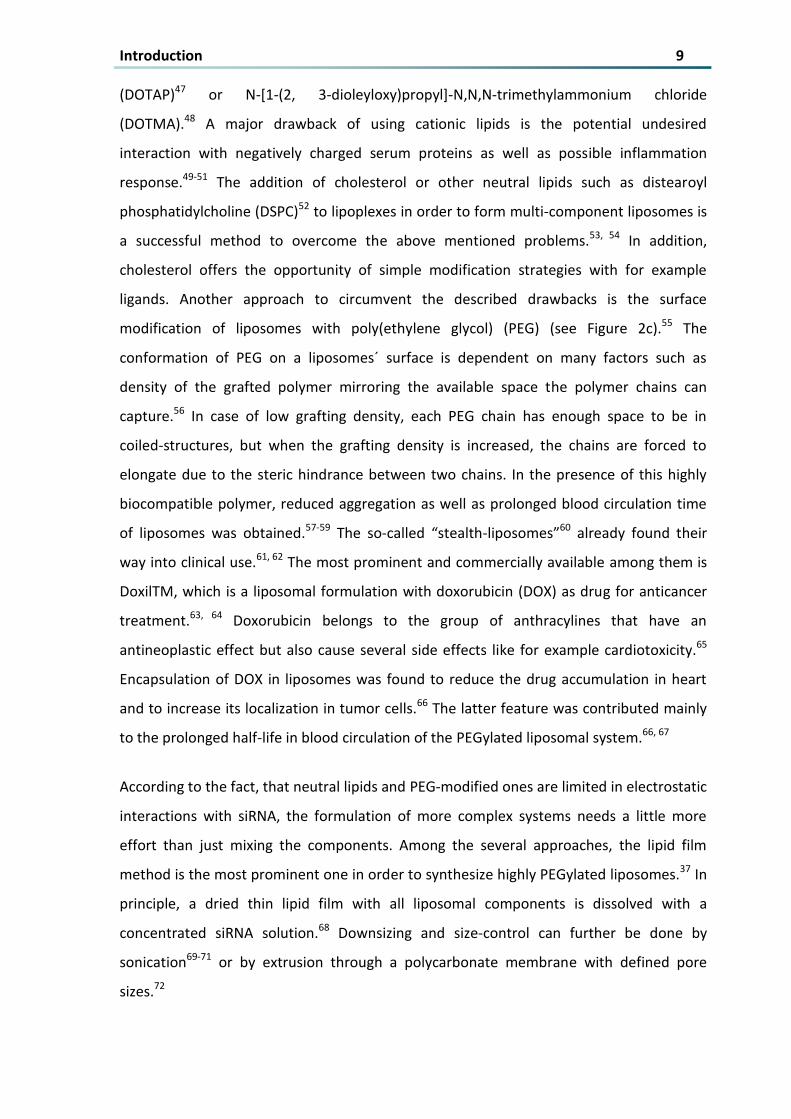
Figure 3 a) Schematic structure of left) phosphoglycerides and right) sphingophospholipids with the polar
head (orange) and the apolar tail (blue) b) schematic 3D structure of self-assembled lipids with A)
micelle B) bilayer and C) vesicle c) PEG modification of liposomes with high density (left) and low
density (right) reprinted from Biochemical and Biophysical Research Communications Volume 468
Issue 3 Laura K Muumlller Katharina Landfester ldquoNatural liposomes and synthetic polymeric structures
for biomedical applicationsrdquo Pages 411-418 Copyright copy (2015) with permission from Elsevier 8
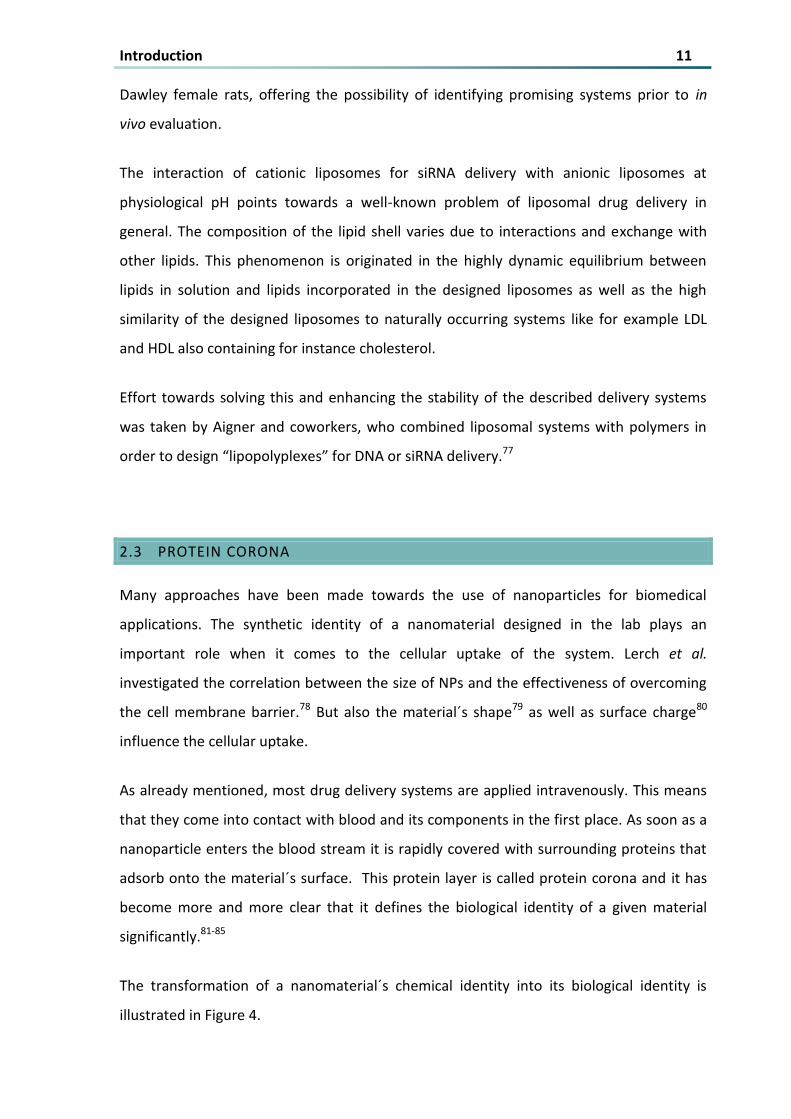
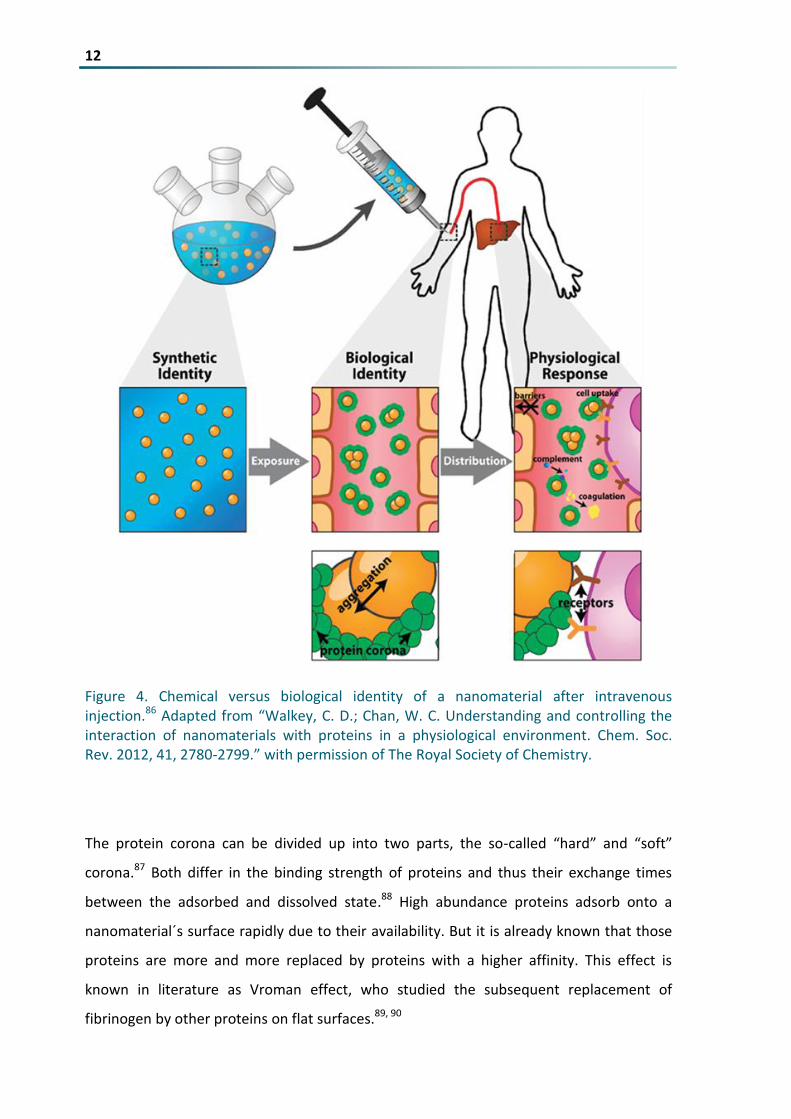
Figure 4 Chemical versus biological identity of a nanomaterial after intravenous injection86
Adapted from
ldquoWalkey C D Chan W C Understanding and controlling the interaction of nanomaterials with
proteins in a physiological environment Chem Soc Rev 2012 41 2780-2799rdquo with permission of The
Royal Society of Chemistry 12
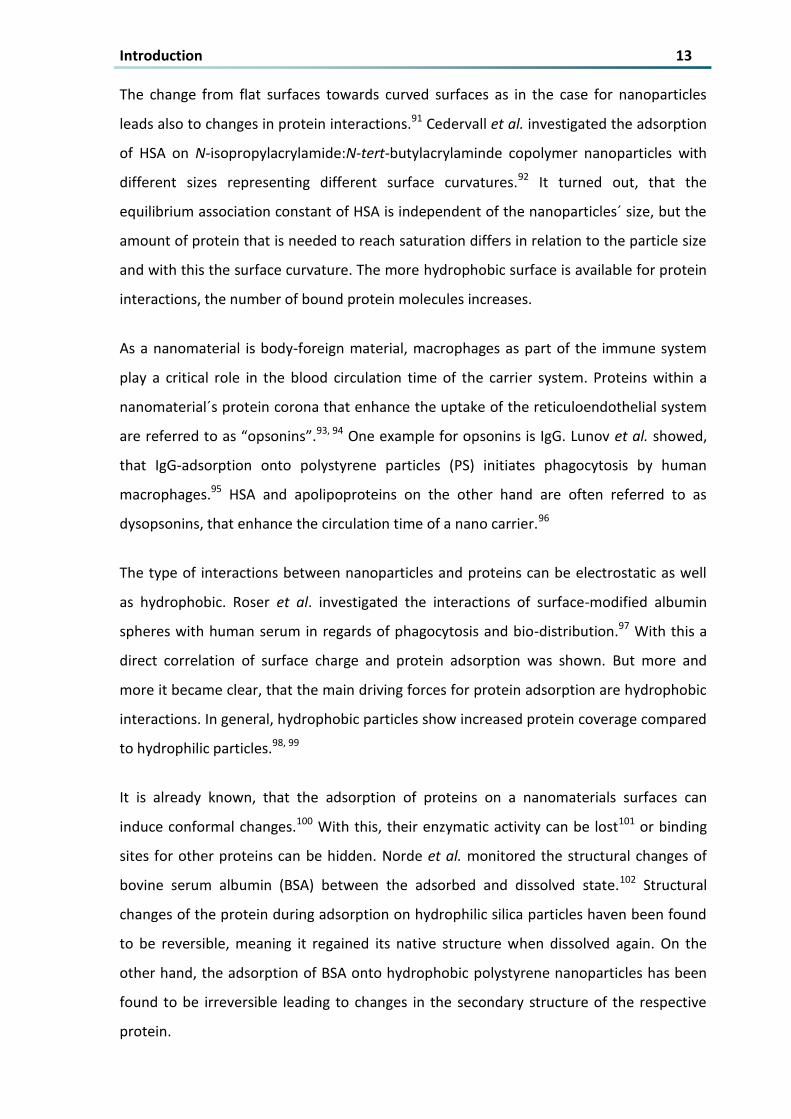
Figure 5 Protein adsorption on stealth-materials (right) is reduced in comparison to non-modified NPs (left)
15
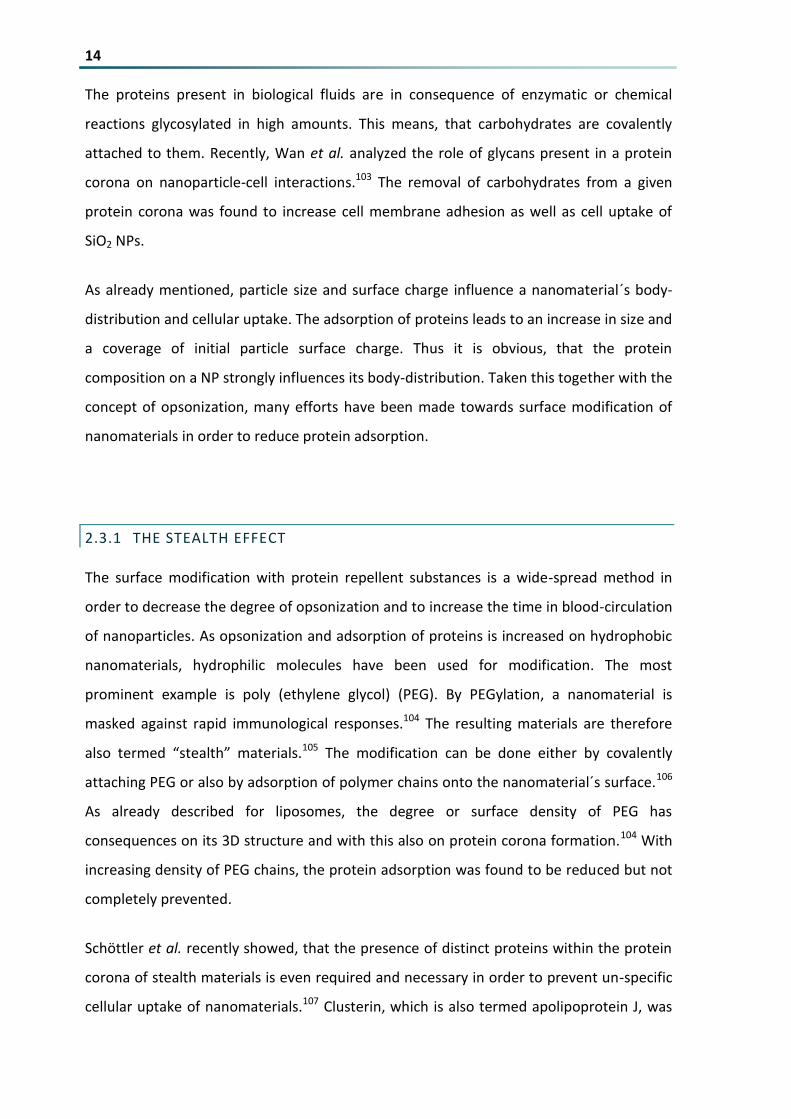
Figure 6 Soft vs hard corona obtained by the removal of free proteins using for instance centrifugation or
magnetic separation 16
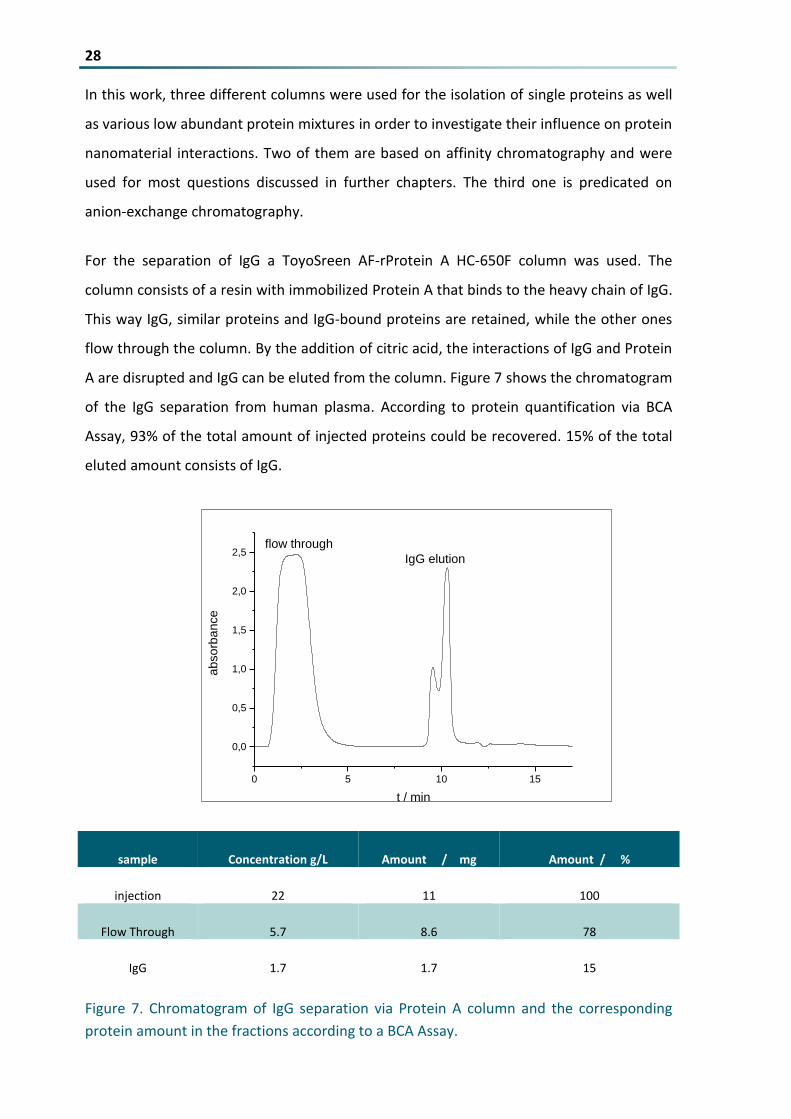
Figure 7 Chromatogram of IgG separation via Protein A column and the corresponding protein amount in
the fractions according to a BCA Assay 28
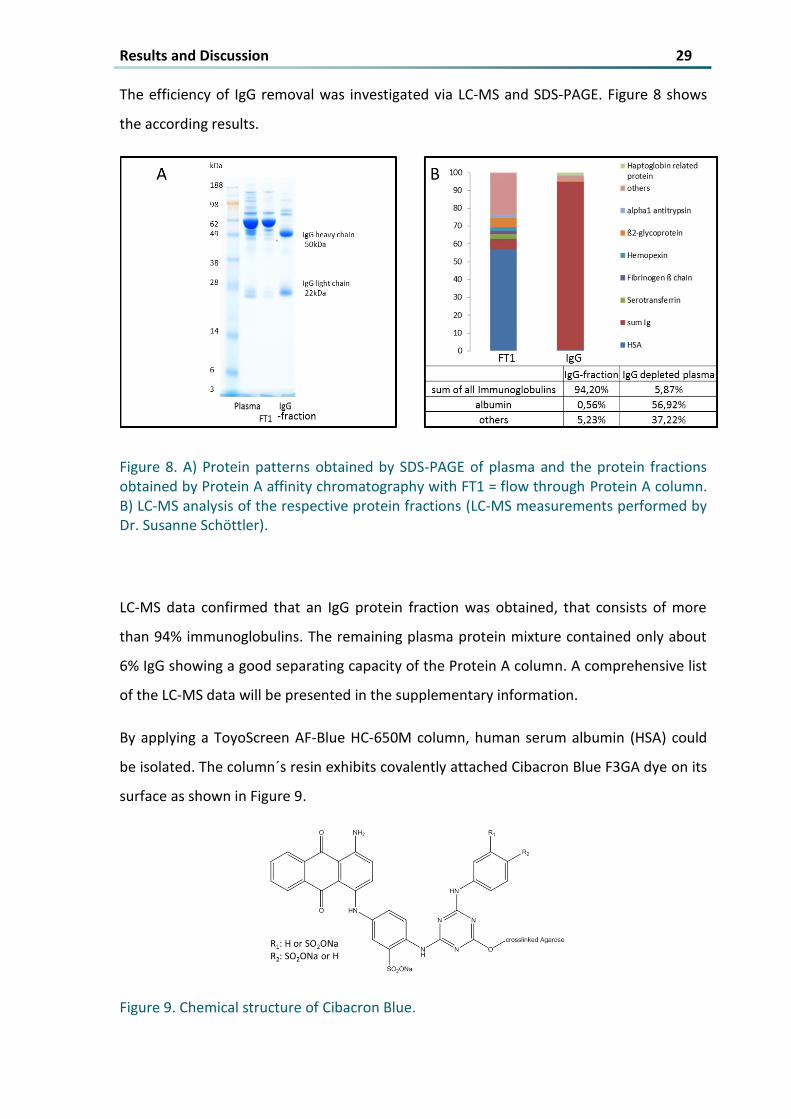
Figure 8 A) Protein patterns obtained by SDS-PAGE of plasma and the protein fractions obtained by Protein
A affinity chromatography with FT1 = flow through Protein A column B) LC-MS analysis of the
respective protein fractions (LC-MS measurements performed by Dr Susanne Schoumlttler) 29
Figure 9 Chemical structure of Cibacron Blue 29
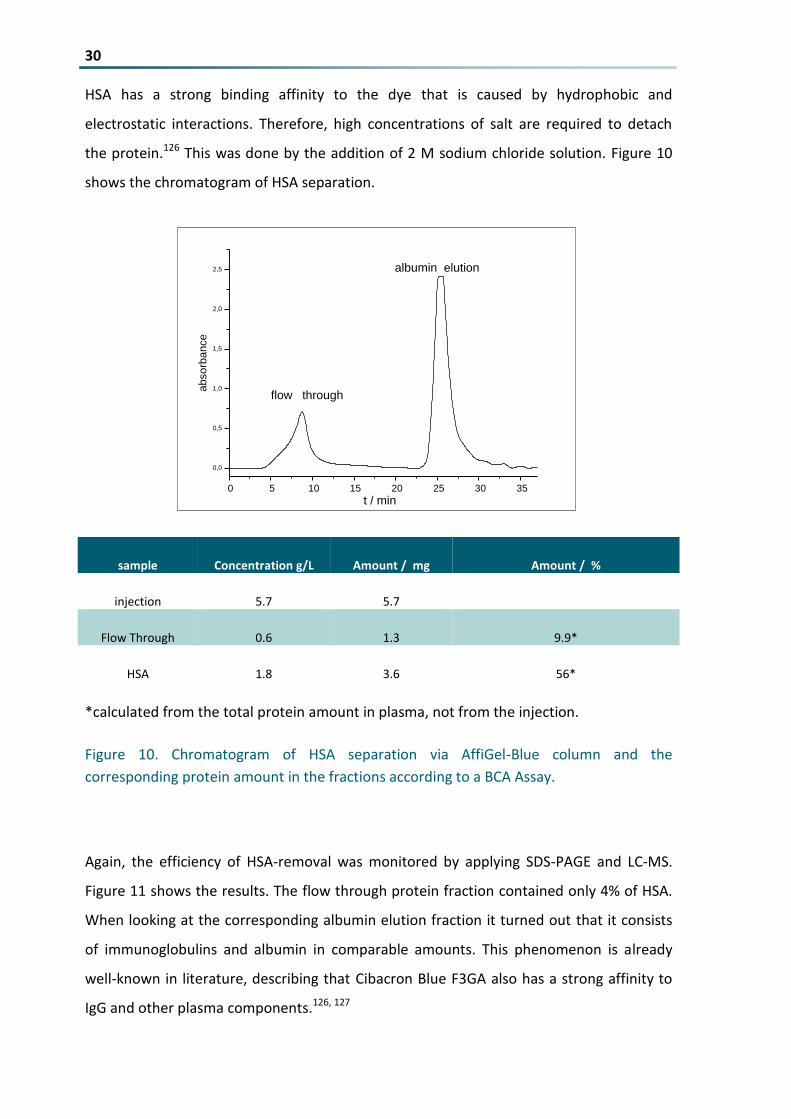
Figure 10 Chromatogram of HSA separation via AffiGel-Blue column and the corresponding protein amount
in the fractions according to a BCA Assay 30
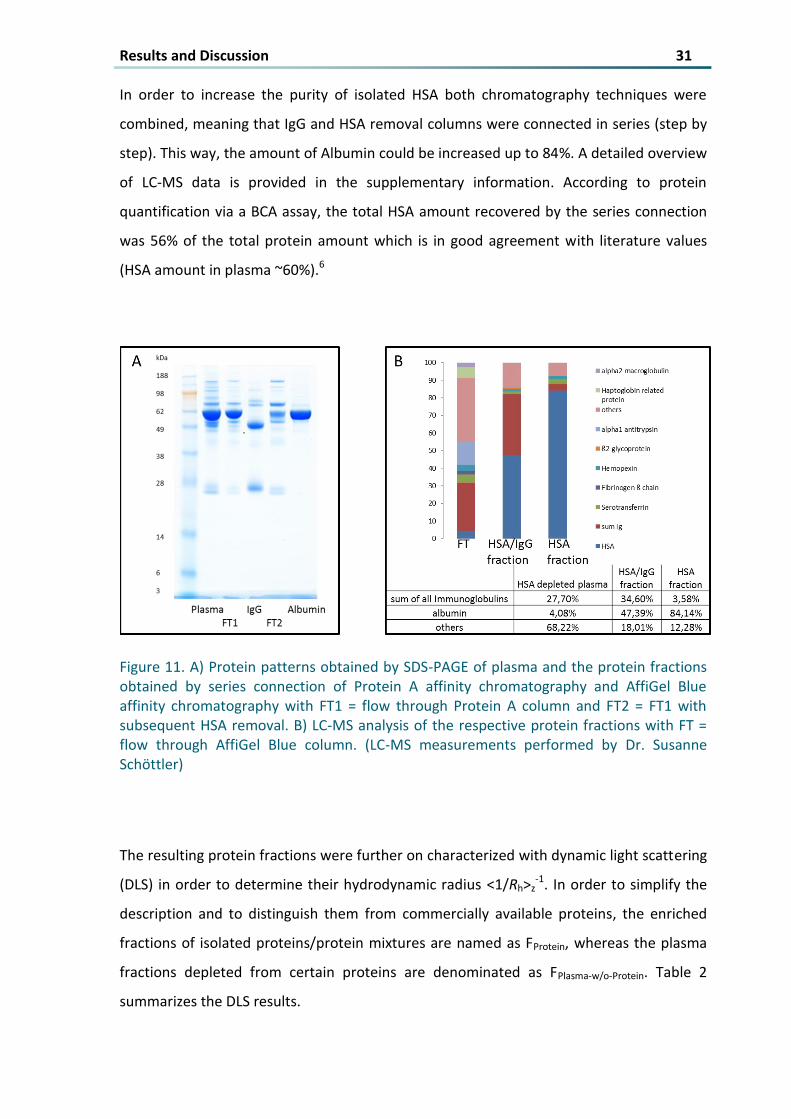
Figure 11 A) Protein patterns obtained by SDS-PAGE of plasma and the protein fractions obtained by series
connection of Protein A affinity chromatography and AffiGel Blue affinity chromatography with FT1 =
flow through Protein A column and FT2 = FT1 with subsequent HSA removal B) LC-MS analysis of the
respective protein fractions with FT = flow through AffiGel Blue column (LC-MS measurements
performed by Dr Susanne Schoumlttler) 31
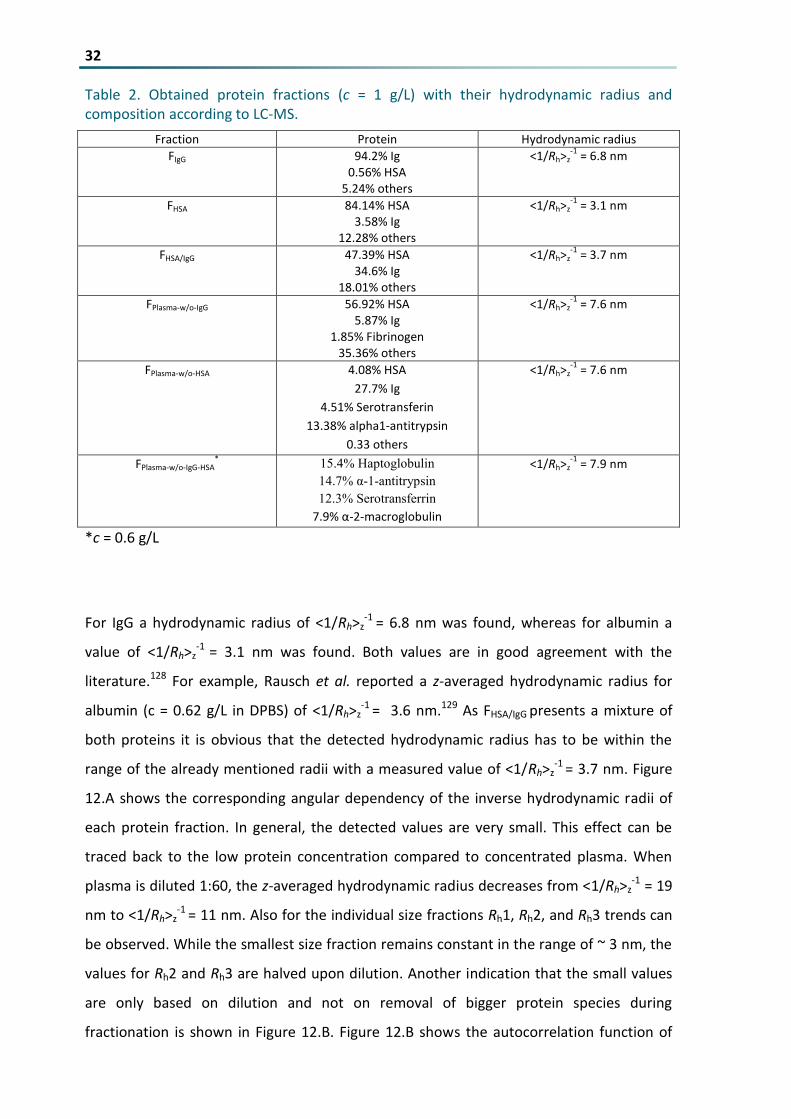
Figure 12 A) Angular dependency of the inverse hydrodynamic radii of the different protein fractions B)
ACF of FPlasma-wo-HSA-IgG with the distribution of the 3 different size fractions at Θ = 30deg 33
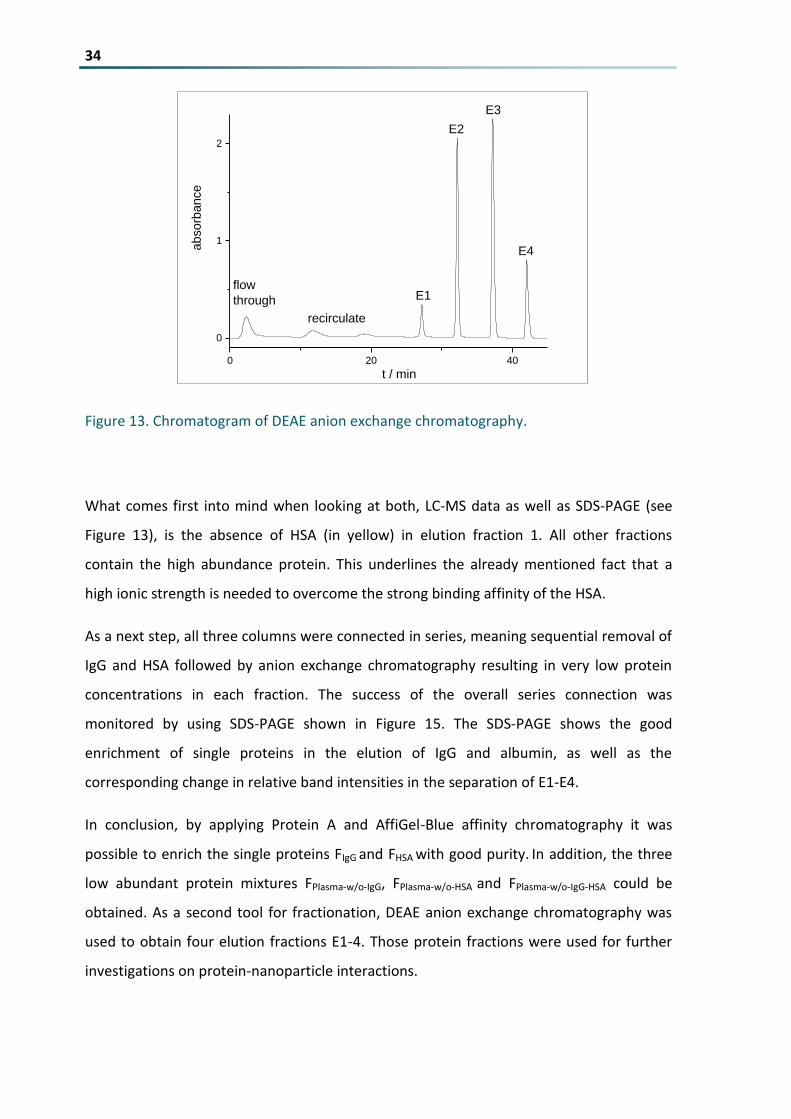
Figure 13 Chromatogram of DEAE anion exchange chromatography 34
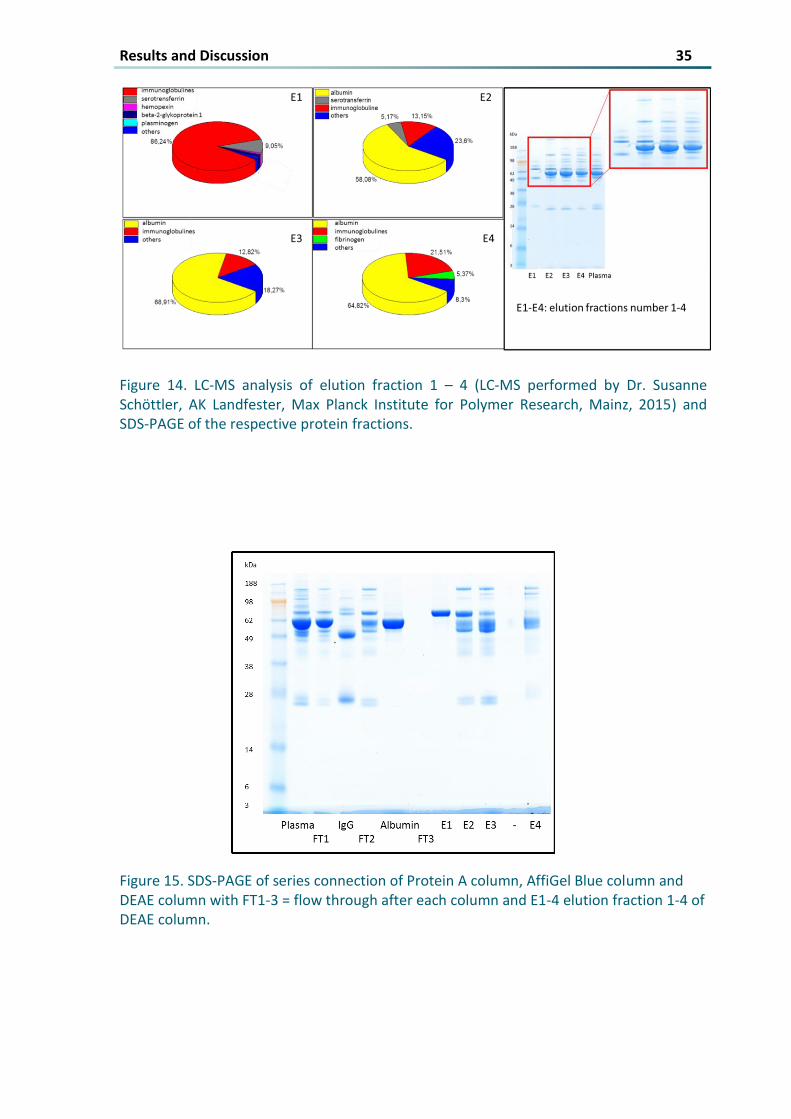
IV Figure 14 LC-MS analysis of elution fraction 1 ndash 4 (LC-MS performed by Dr Susanne Schoumlttler AK
Landfester Max Planck Institute for Polymer Research Mainz 2015) and SDS-PAGE of the respective
protein fractions 35
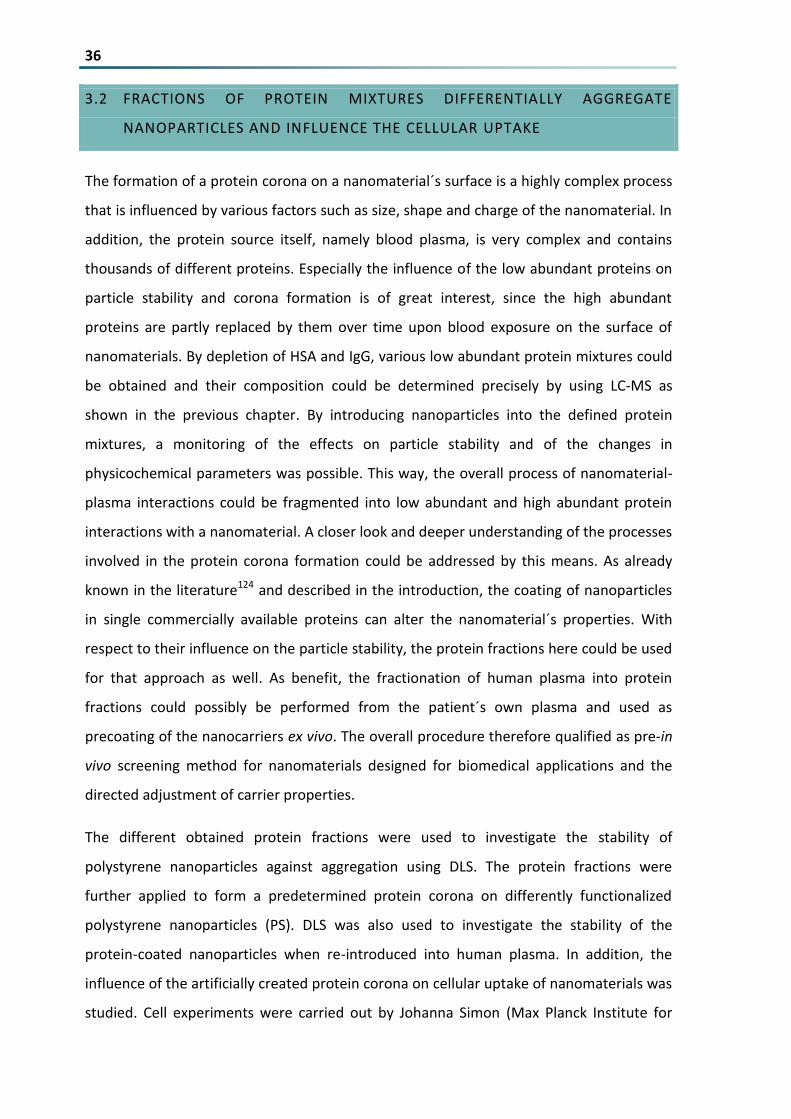
Figure 15 SDS-PAGE of series connection of Protein A column AffiGel Blue column and DEAE column with
FT1-3 = flow through after each column and E1-4 elution fraction 1-4 of DEAE column 35
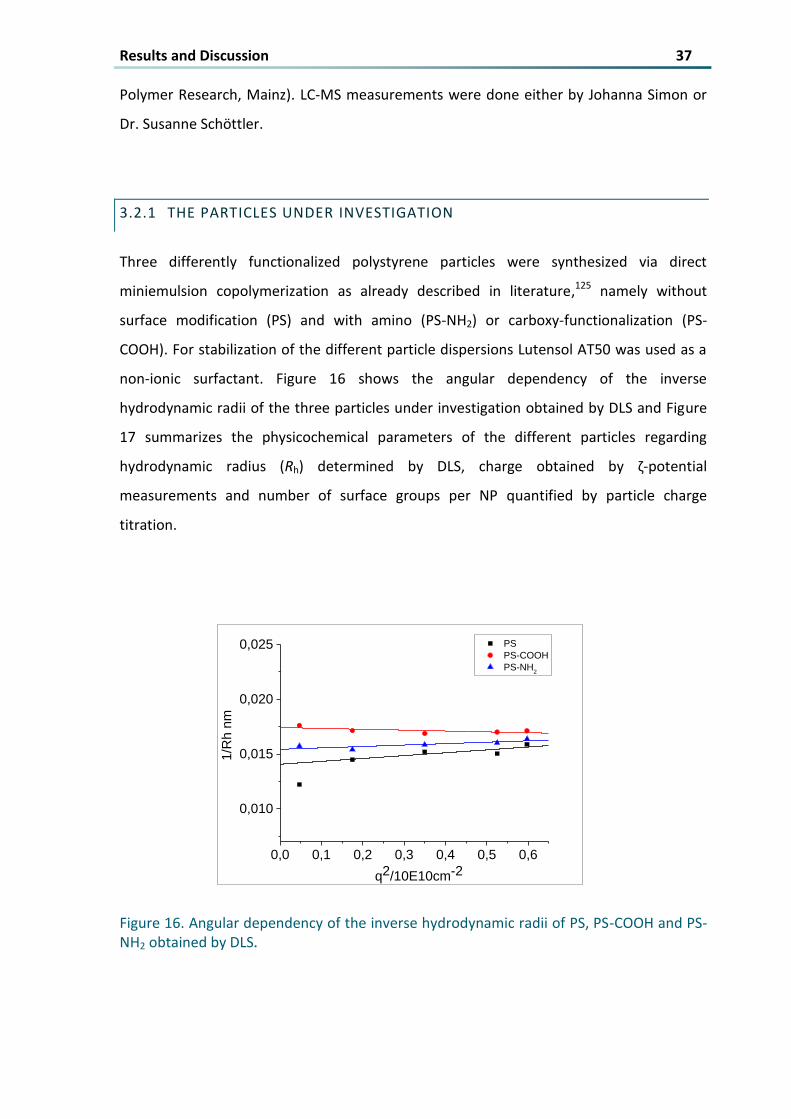
Figure 16 Angular dependency of the inverse hydrodynamic radii of PS PS-COOH and PS-NH2 obtained by
DLS 37
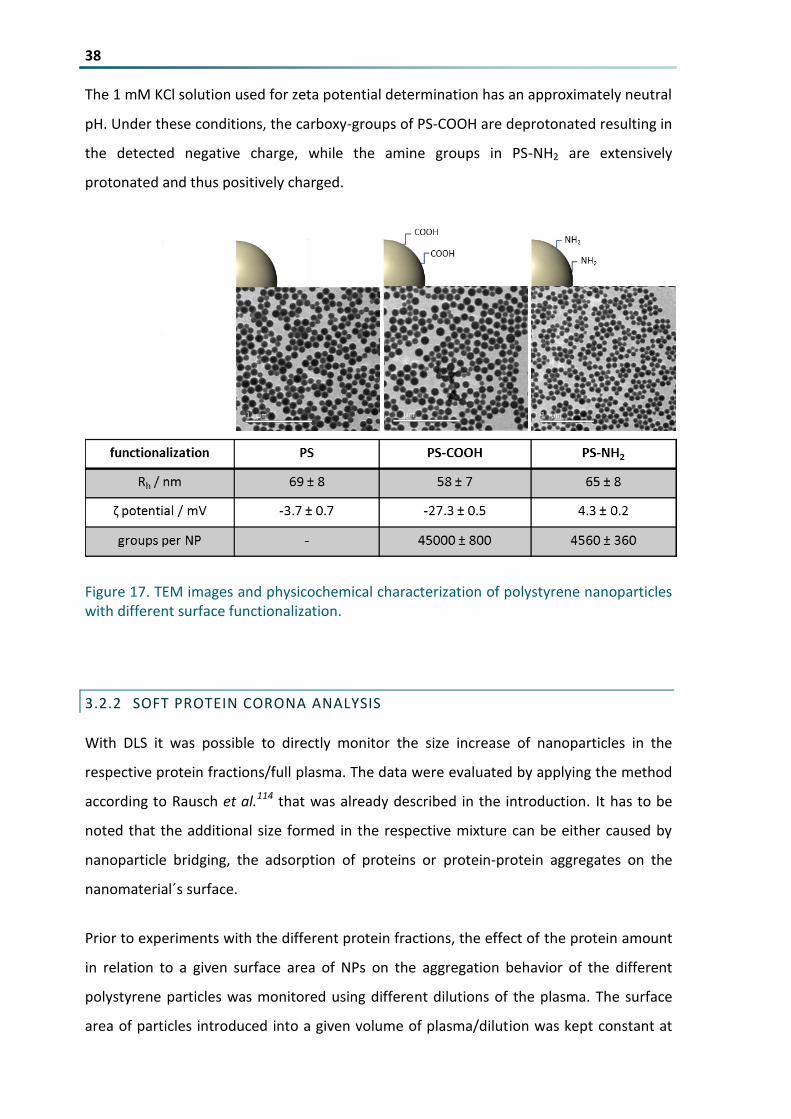
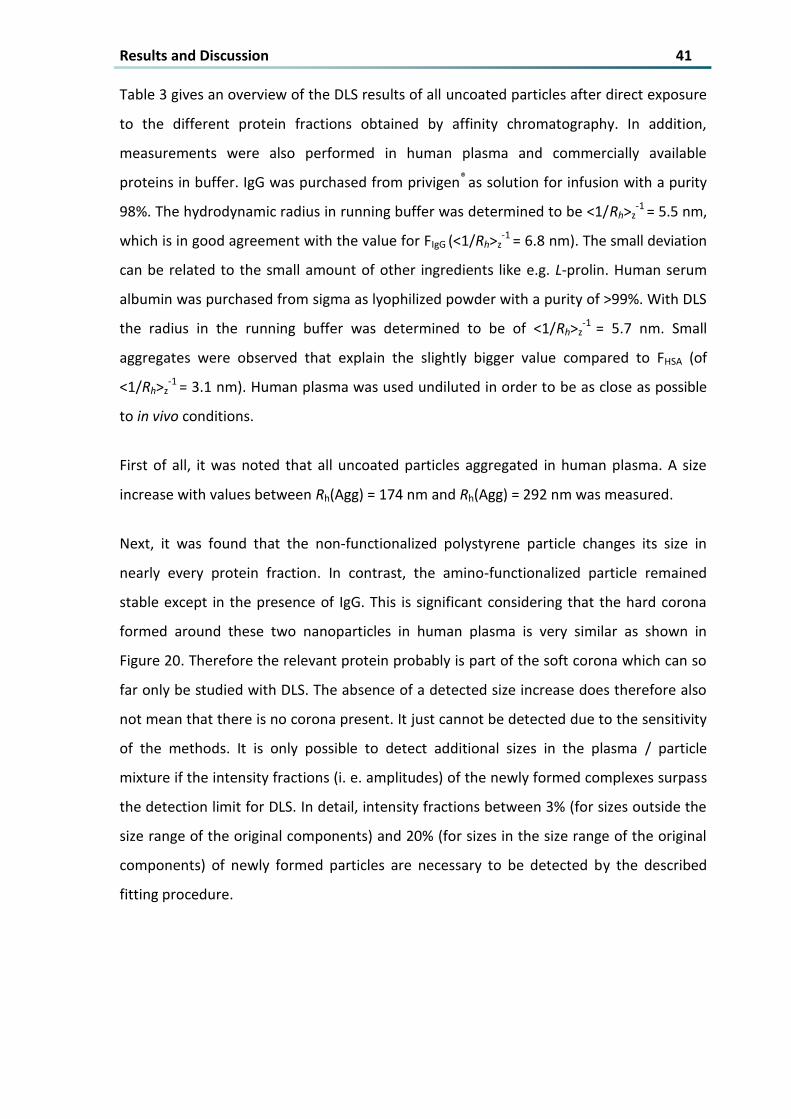
Figure 17 TEM images and physicochemical characterization of polystyrene nanoparticles with different
surface functionalization 38
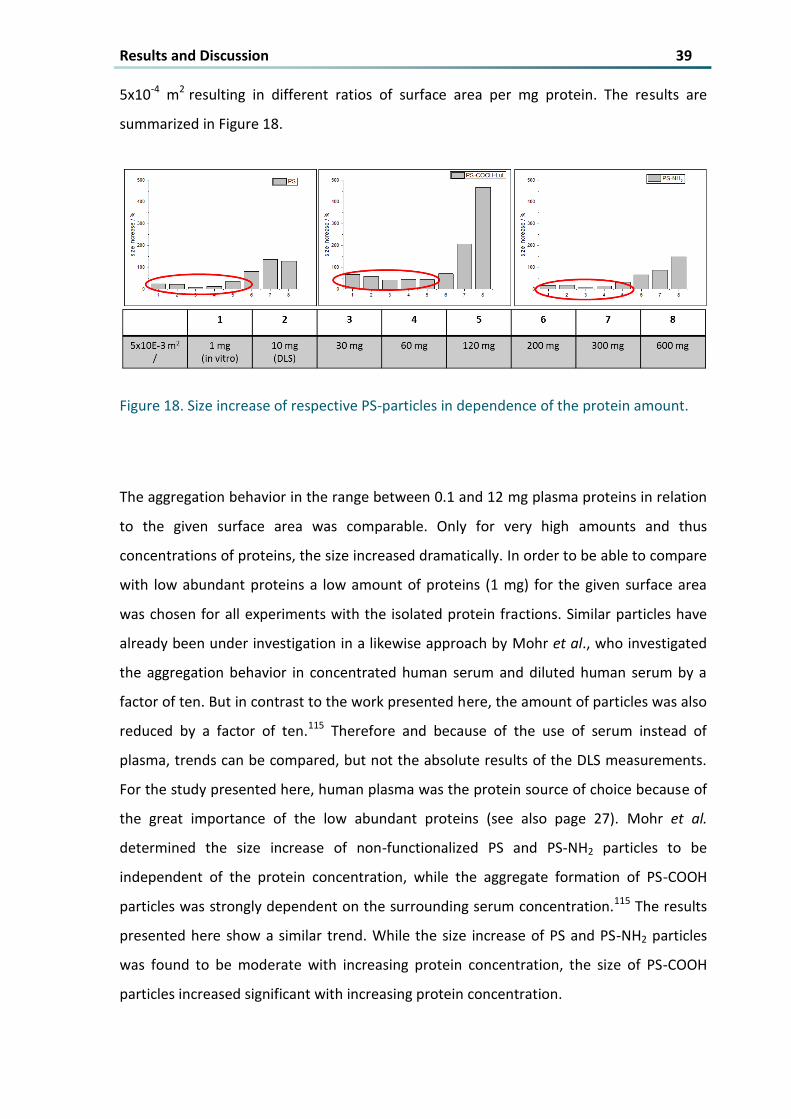
Figure 18 Size increase of respective PS-particles in dependence of the protein amount 39
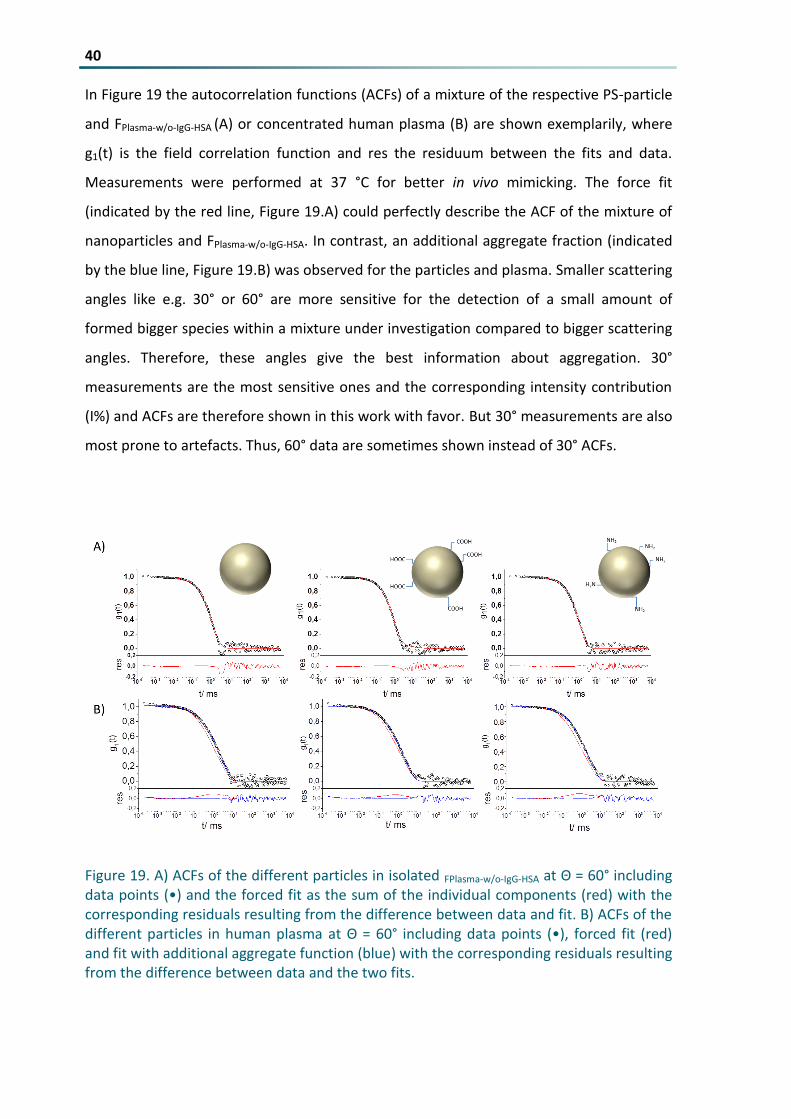
Figure 19 A) ACFs of the different particles in isolated FPlasma-wo-IgG-HSA at Θ = 60deg including data points (bull) and
the forced fit as the sum of the individual components (red) with the corresponding residuals resulting
from the difference between data and fit B) ACFs of the different particles in human plasma at Θ = 60deg
including data points (bull) forced fit (red) and fit with additional aggregate function (blue) with the
corresponding residuals resulting from the difference between data and the two fits 40
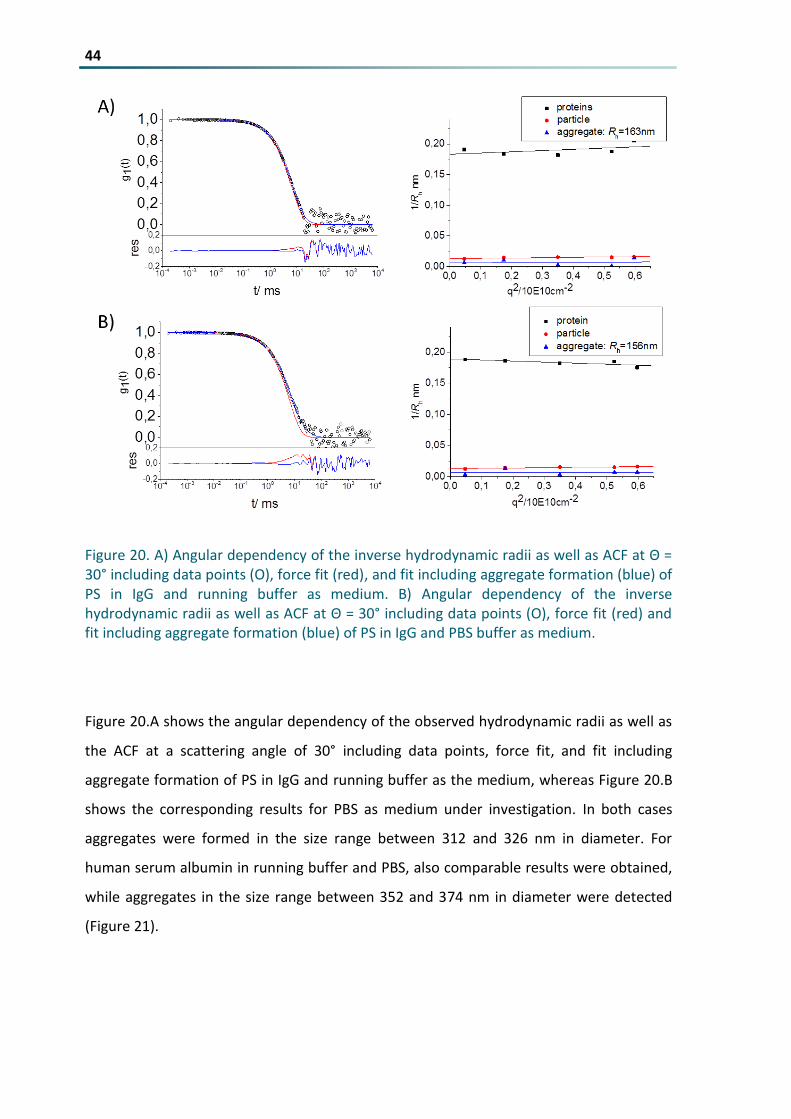
Figure 20 A) Angular dependency of the inverse hydrodynamic radii as well as ACF at Θ = 30deg including data
points (O) force fit (red) and fit including aggregate formation (blue) of PS in IgG and running buffer
as medium B) Angular dependency of the inverse hydrodynamic radii as well as ACF at Θ = 30deg
including data points (O) force fit (red) and fit including aggregate formation (blue) of PS in IgG and
PBS buffer as medium 44
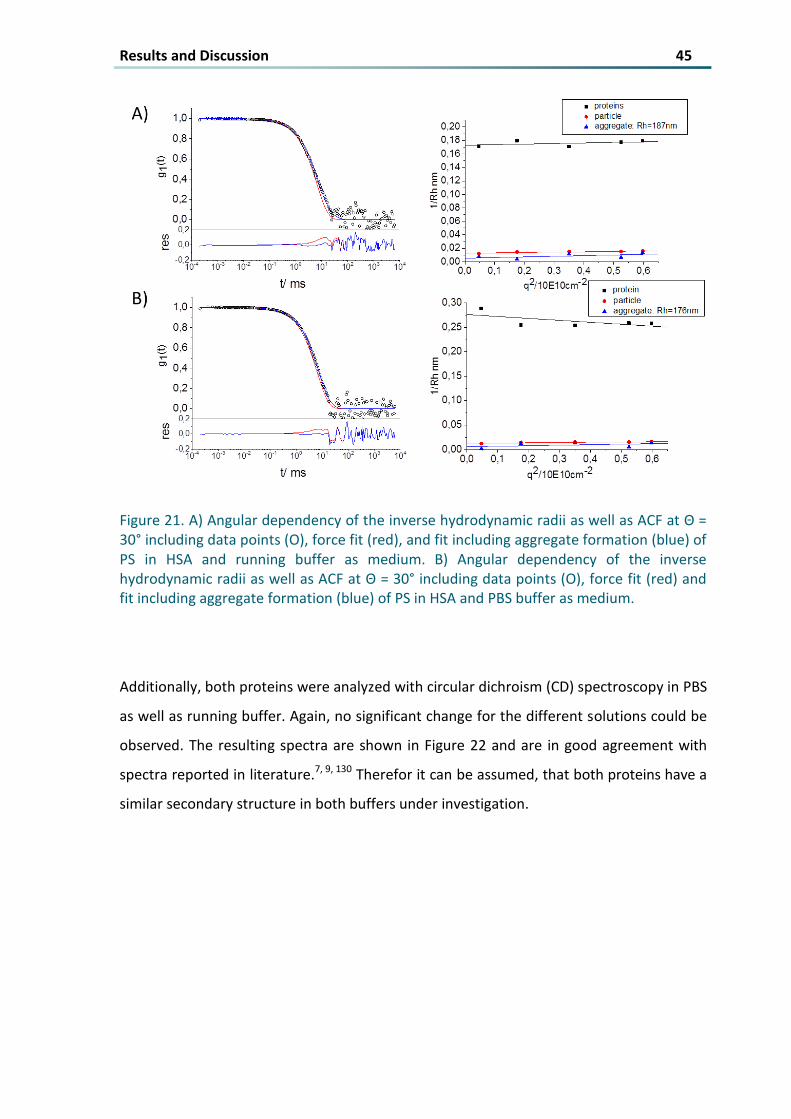
Figure 21 A) Angular dependency of the inverse hydrodynamic radii as well as ACF at Θ = 30deg including data
points (O) force fit (red) and fit including aggregate formation (blue) of PS in HSA and running buffer
as medium B) Angular dependency of the inverse hydrodynamic radii as well as ACF at Θ = 30deg
including data points (O) force fit (red) and fit including aggregate formation (blue) of PS in HSA and
PBS buffer as medium 45
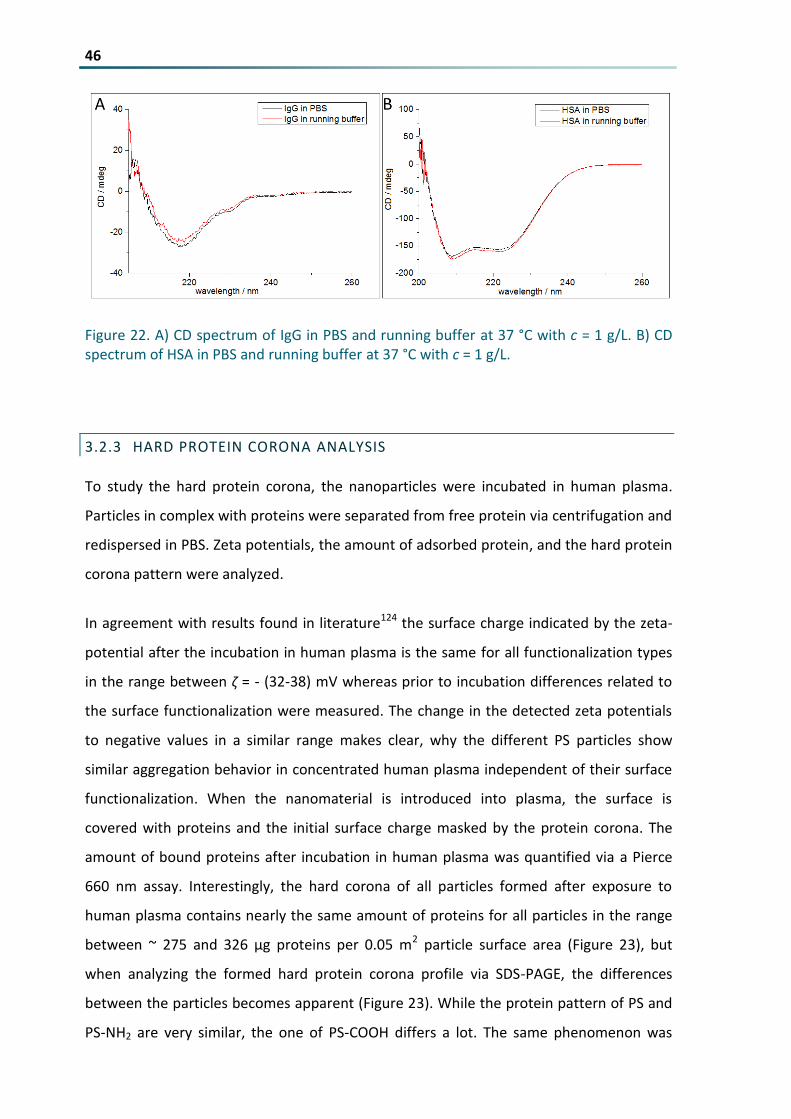
Figure 22 A) CD spectrum of IgG in PBS and running buffer at 37 degC with c = 1 gL B) CD spectrum of HSA in
PBS and running buffer at 37 degC with c = 1 gL 46
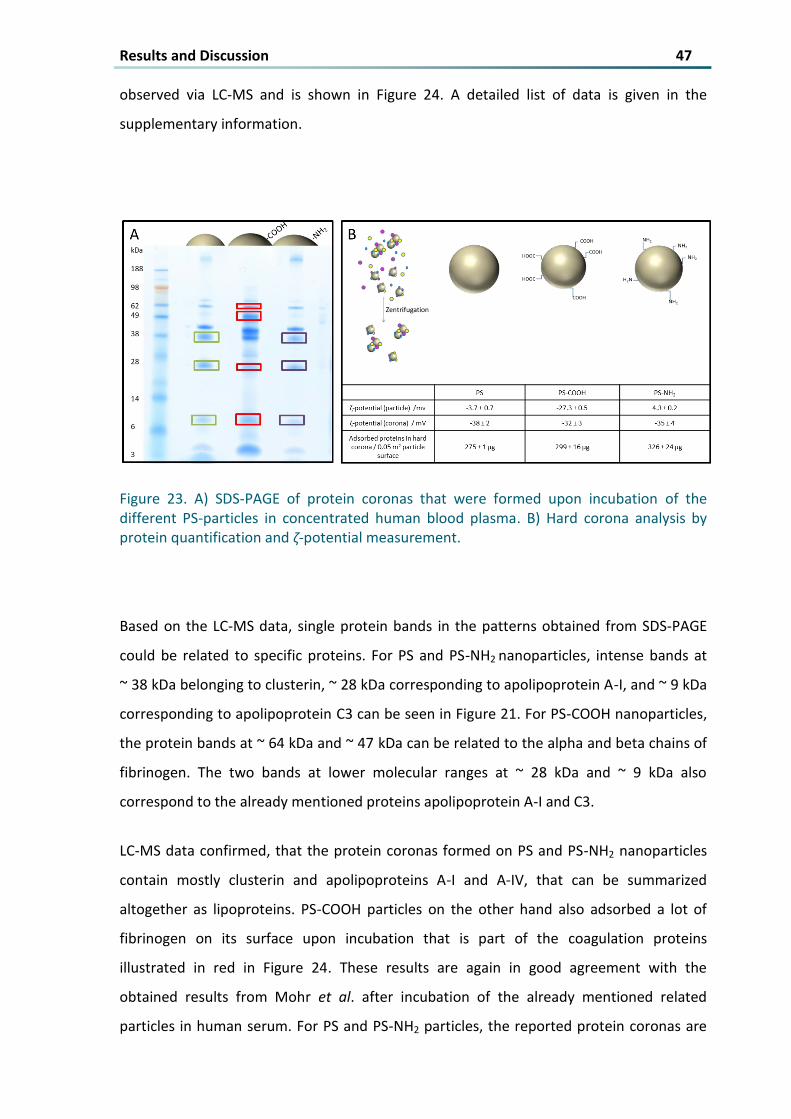
Figure 23 A) SDS-PAGE of protein coronas that were formed upon incubation of the different PS-particles in
concentrated human blood plasma B) Hard corona analysis by protein quantification and ζ-potential
measurement 47
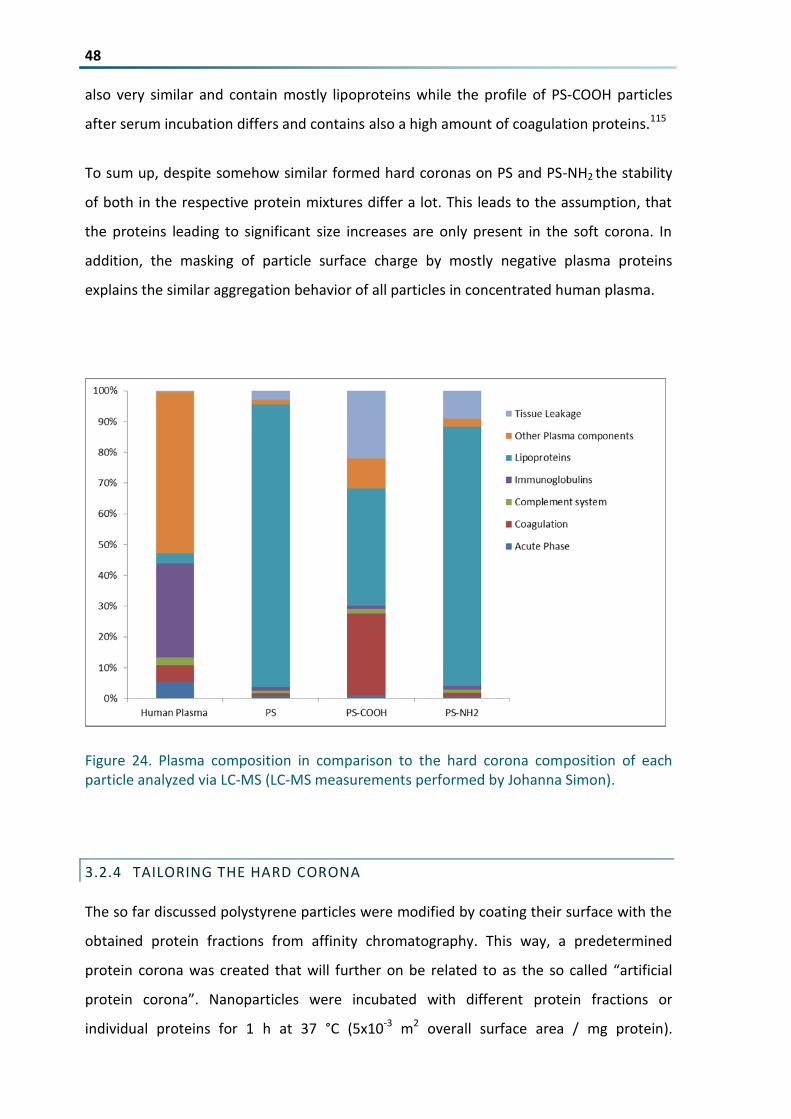
Figure 24 Plasma composition in comparison to the hard corona composition of each particle analyzed via
LC-MS (LC-MS measurements performed by Johanna Simon) 48
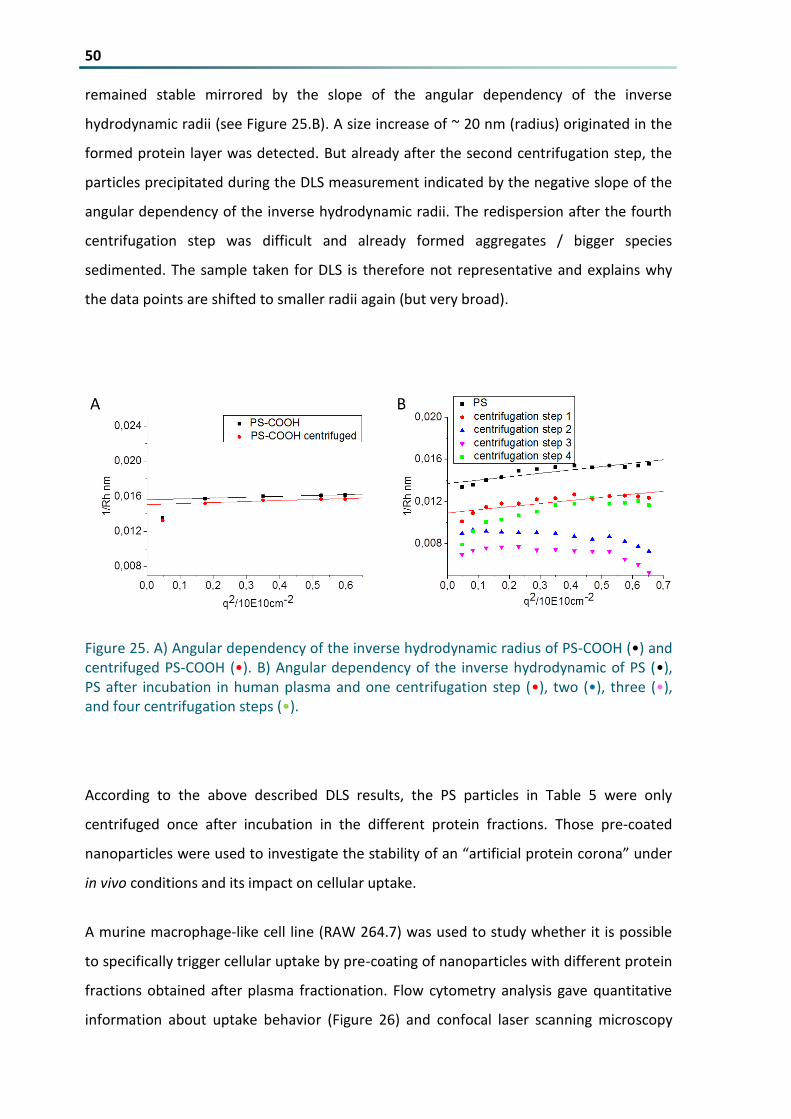
Figure 25 A) Angular dependency of the inverse hydrodynamic radius of PS-COOH (bull) and centrifuged PS-
COOH (bull) B) Angular dependency of the inverse hydrodynamic of PS (bull) PS after incubation in human
plasma and one centrifugation step (bull) two (bull) three (bull) and four centrifugation steps (bull) 50
Figure 26 Flow cytometry analysis of RAW 2647 cells incubated with uncoated or pre-coated nanoparticles
for 2 h in DMEM without additional proteins Nanoparticles were pre-incubated with individual
proteins (A) or different protein fractions (B) separated from unbound proteins via centrifugation and
added to the cells with a nanoparticle concentration of 75 microgmL Relative median fluorescence
Contents V
intensity (rMFI) values are shown as mean plusmn SD of triplicates The red line serves as a reference for
cellular uptake of uncoated nanoparticles (rMFI = 1) A studentacutes t-test was performed to demonstrate
the difference in uptake behavior of uncoated and pre-coated nanoparticles (indicated by p values lt
001 or p lt 0001) (all cell experiments were performed by Johanna Simon) 51
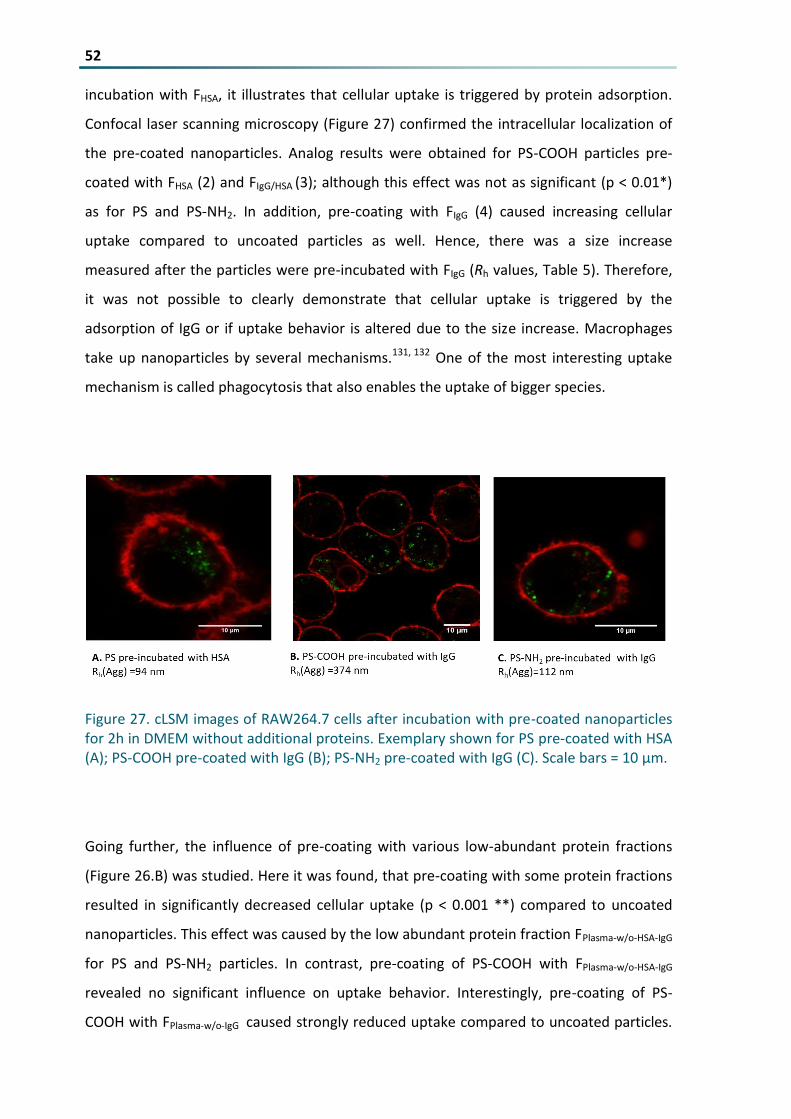
Figure 27 cLSM images of RAW2647 cells after incubation with pre-coated nanoparticles for 2h in DMEM
without additional proteins Exemplary shown for PS pre-coated with HSA (A) PS-COOH pre-coated
with IgG (B) PS-NH2 pre-coated with IgG (C) Scale bars = 10 microm 52
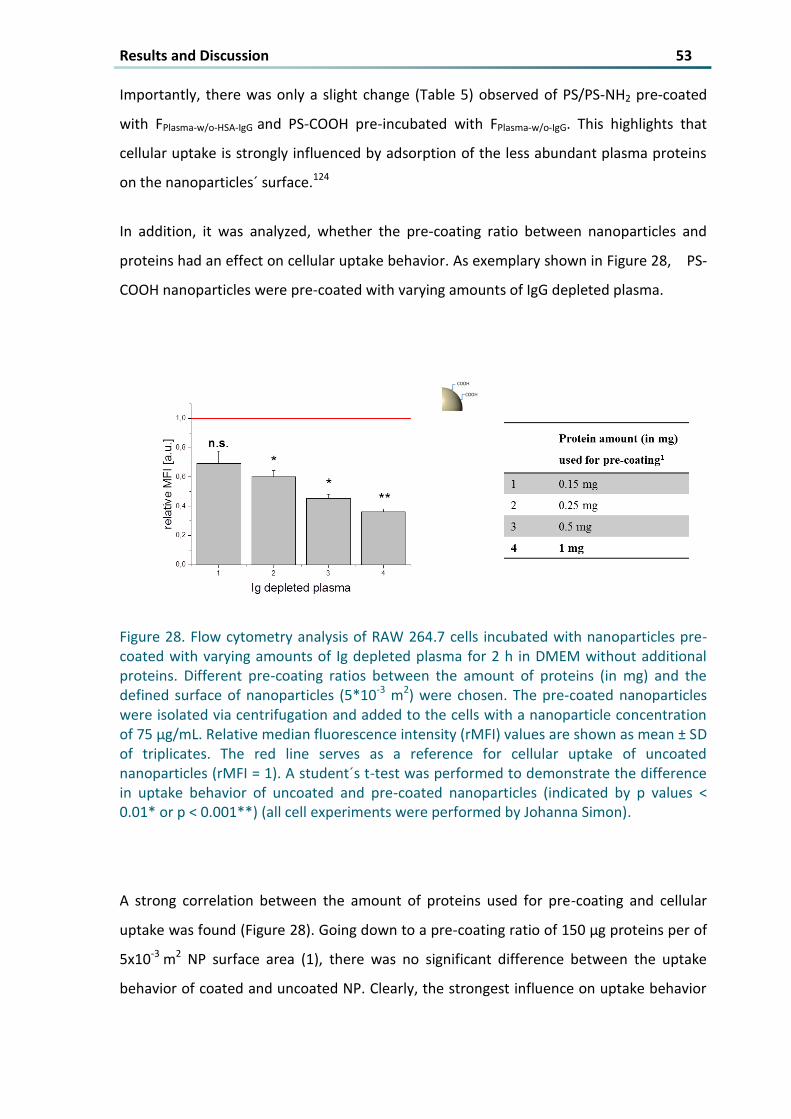
Figure 28 Flow cytometry analysis of RAW 2647 cells incubated with nanoparticles pre-coated with varying
amounts of Ig depleted plasma for 2 h in DMEM without additional proteins Different pre-coating
ratios between the amount of proteins (in mg) and the defined surface of nanoparticles (510-3
m2)
were chosen The pre-coated nanoparticles were isolated via centrifugation and added to the cells
with a nanoparticle concentration of 75 microgmL Relative median fluorescence intensity (rMFI) values
are shown as mean plusmn SD of triplicates The red line serves as a reference for cellular uptake of
uncoated nanoparticles (rMFI = 1) A studentacutes t-test was performed to demonstrate the difference in
uptake behavior of uncoated and pre-coated nanoparticles (indicated by p values lt 001 or p lt
0001) (all cell experiments were performed by Johanna Simon) 53
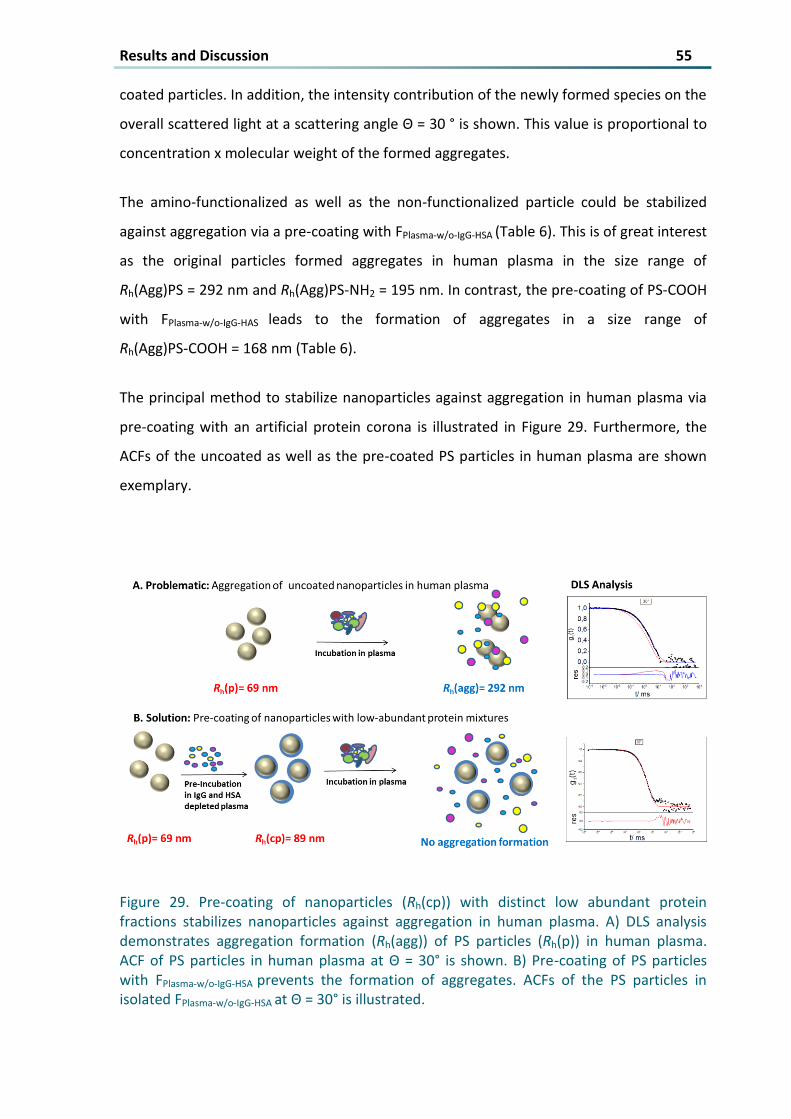
Figure 29 Pre-coating of nanoparticles (Rh(cp)) with distinct low abundant protein fractions stabilizes
nanoparticles against aggregation in human plasma A) DLS analysis demonstrates aggregation
formation (Rh(agg)) of PS particles (Rh(p)) in human plasma ACF of PS particles in human plasma at Θ =
30deg is shown B) Pre-coating of PS particles with FPlasma-wo-IgG-HSA prevents the formation of aggregates
ACFs of the PS particles in isolated FPlasma-wo-IgG-HSA at Θ = 30deg is illustrated 55
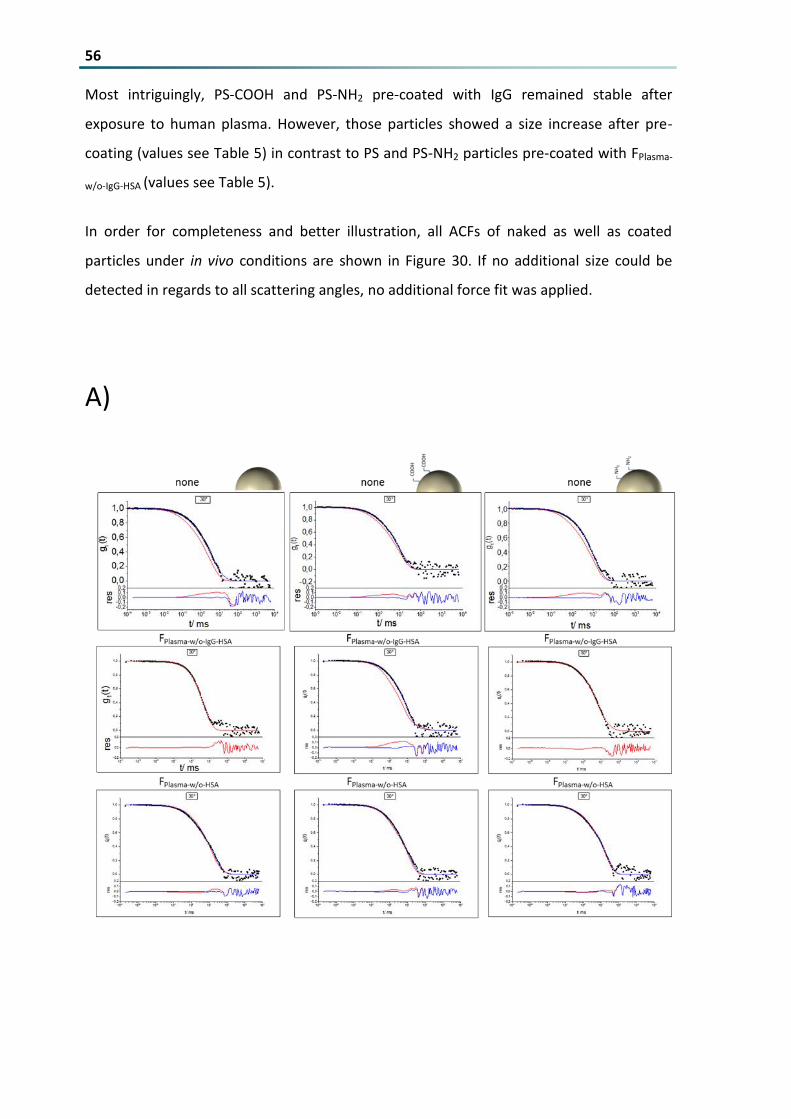
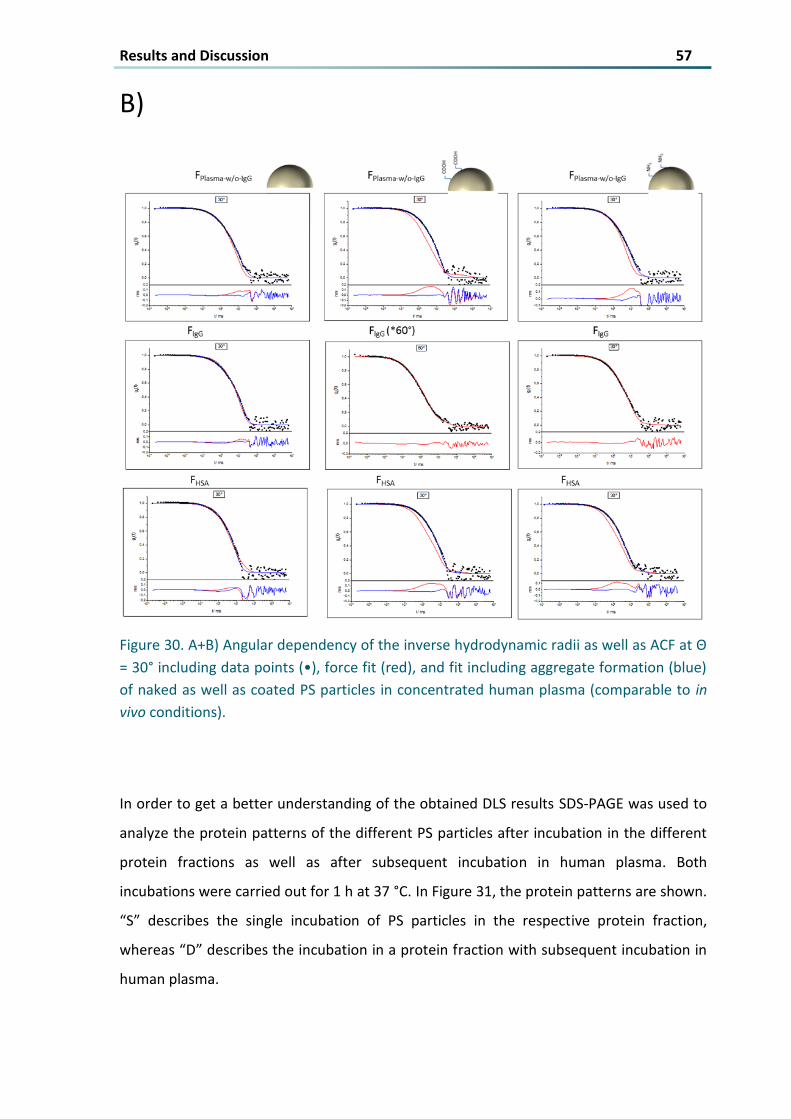
Figure 30 A+B) Angular dependency of the inverse hydrodynamic radii as well as ACF at Θ = 30deg including
data points (bull) force fit (red) and fit including aggregate formation (blue) of naked as well as coated
PS particles in concentrated human plasma (comparable to in vivo conditions) 57
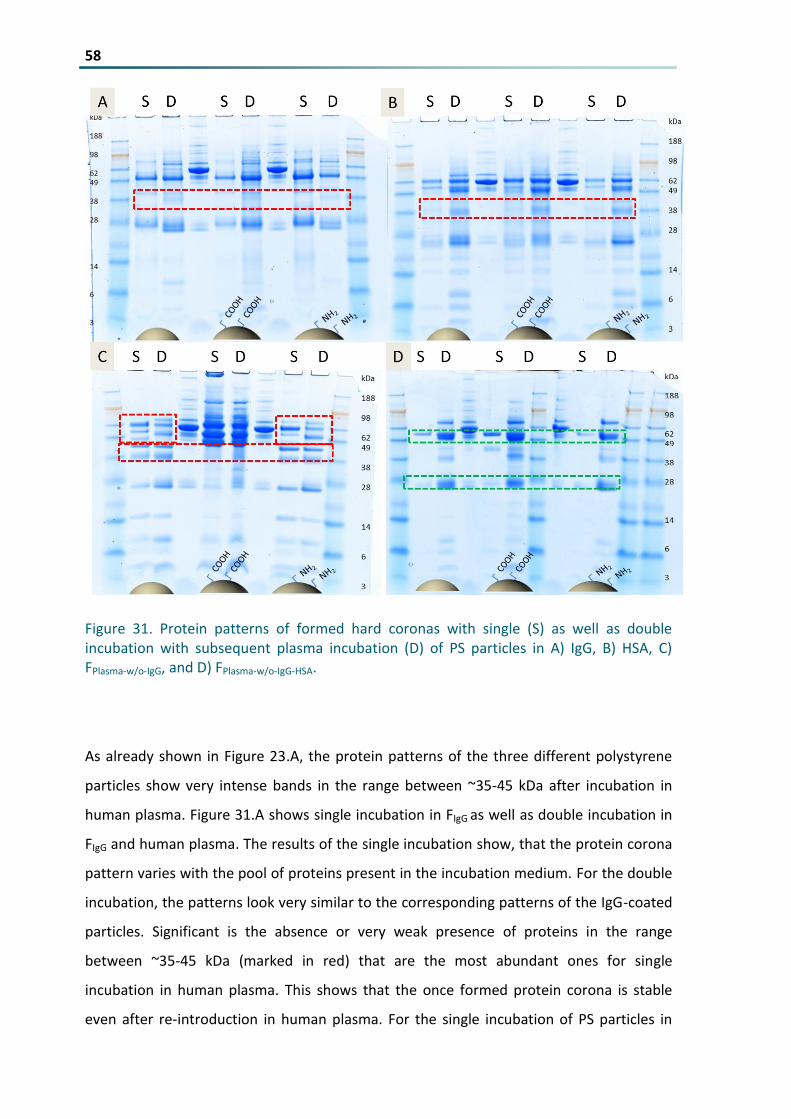
Figure 31 Protein patterns of formed hard coronas with single (S) as well as double incubation with
subsequent plasma incubation (D) of PS particles in A) IgG B) HSA C) FPlasma-wo-IgG and D) FPlasma-wo-IgG-
HSA 58
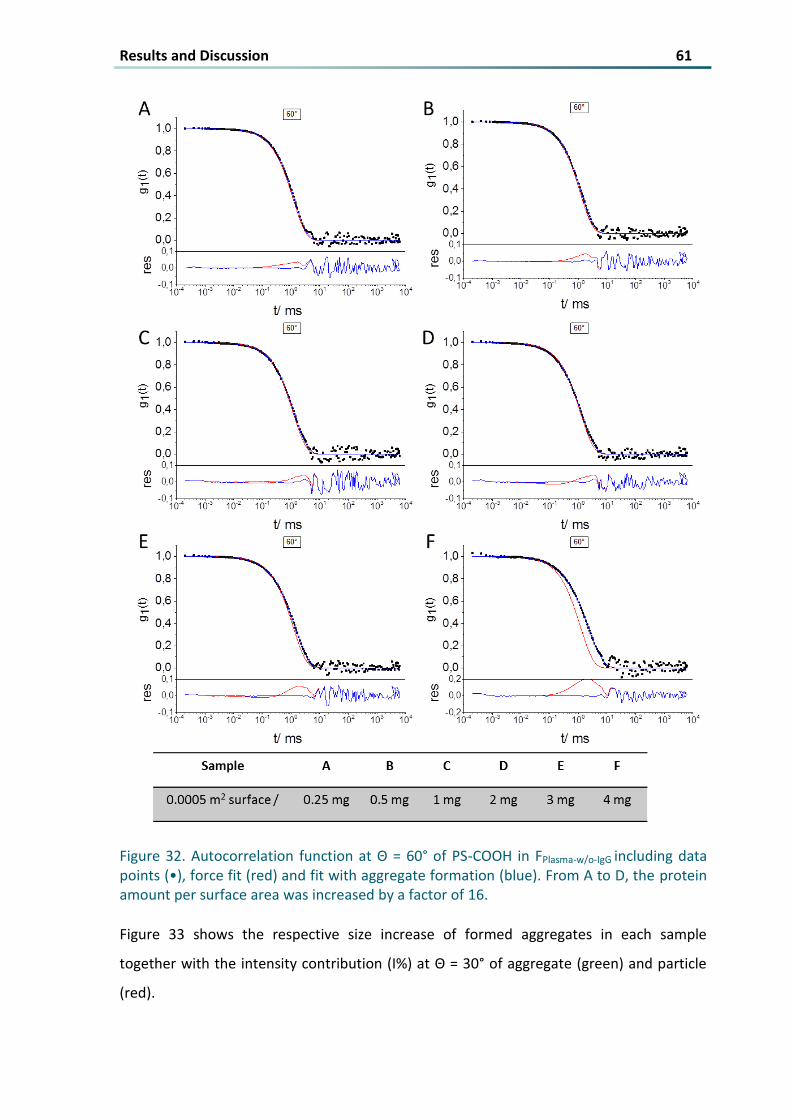
Figure 32 Autocorrelation function at Θ = 60deg of PS-COOH in FPlasma-wo-IgG including data points (bull) force fit
(red) and fit with aggregate formation (blue) From A to D the protein amount per surface area was
increased by a factor of 16 61
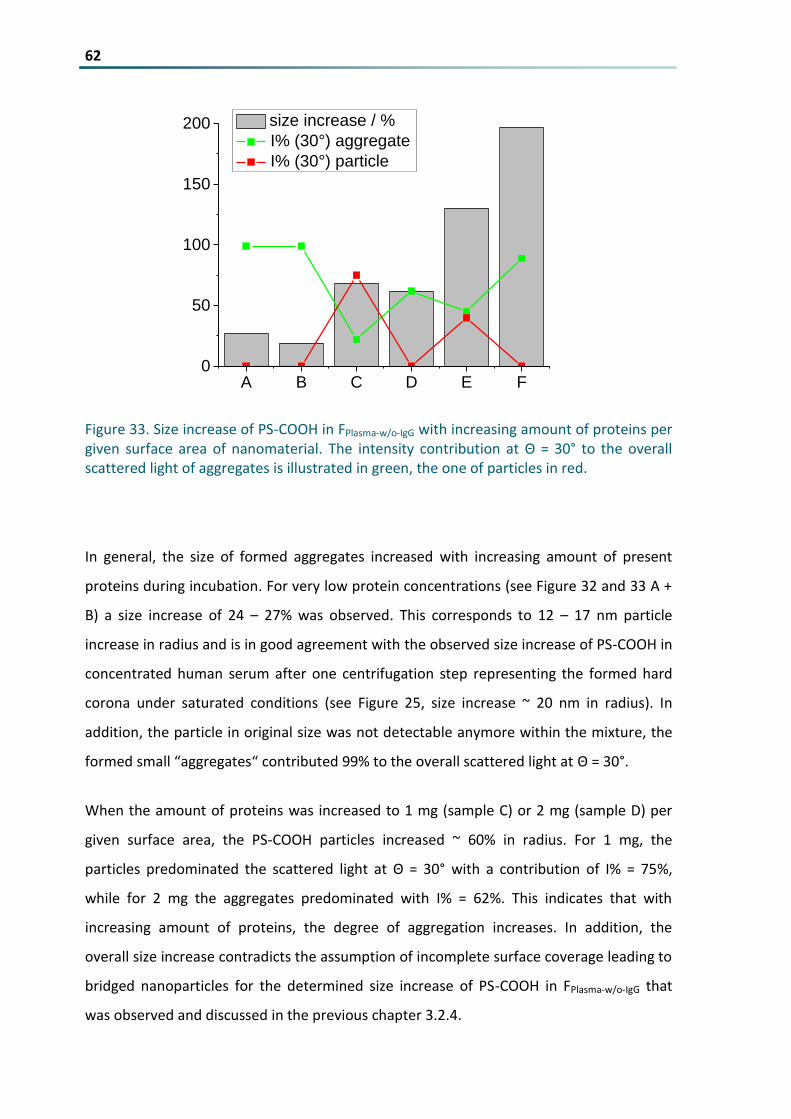
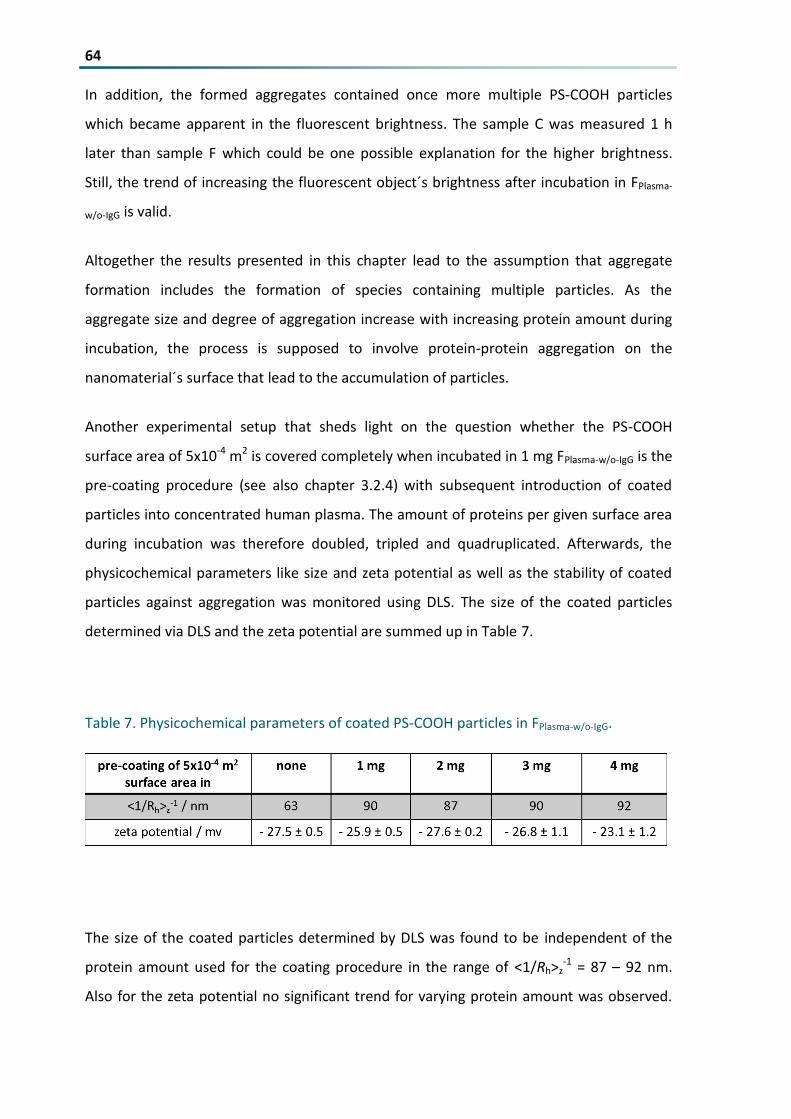
Figure 33 Size increase of PS-COOH in FPlasma-wo-IgG with increasing amount of proteins per given surface area
of nanomaterial The intensity contribution at Θ = 30deg to the overall scattered light of aggregates is
illustrated in green the one of particles in red 62
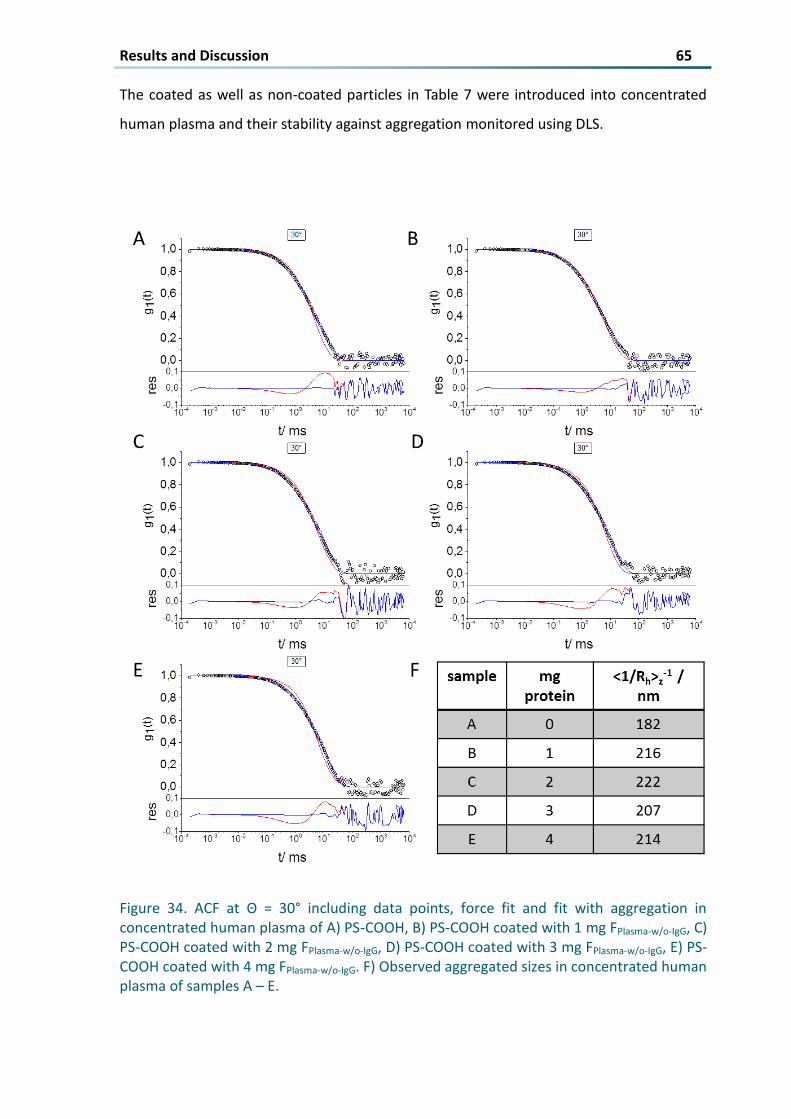
Figure 34 ACF at Θ = 30deg including data points force fit and fit with aggregation in concentrated human
plasma of A) PS-COOH B) PS-COOH coated with 1 mg FPlasma-wo-IgG C) PS-COOH coated with 2 mg
FPlasma-wo-IgG D) PS-COOH coated with 3 mg FPlasma-wo-IgG E) PS-COOH coated with 4 mg FPlasma-wo-IgG F)
Observed aggregated sizes in concentrated human plasma of samples A ndash E 65
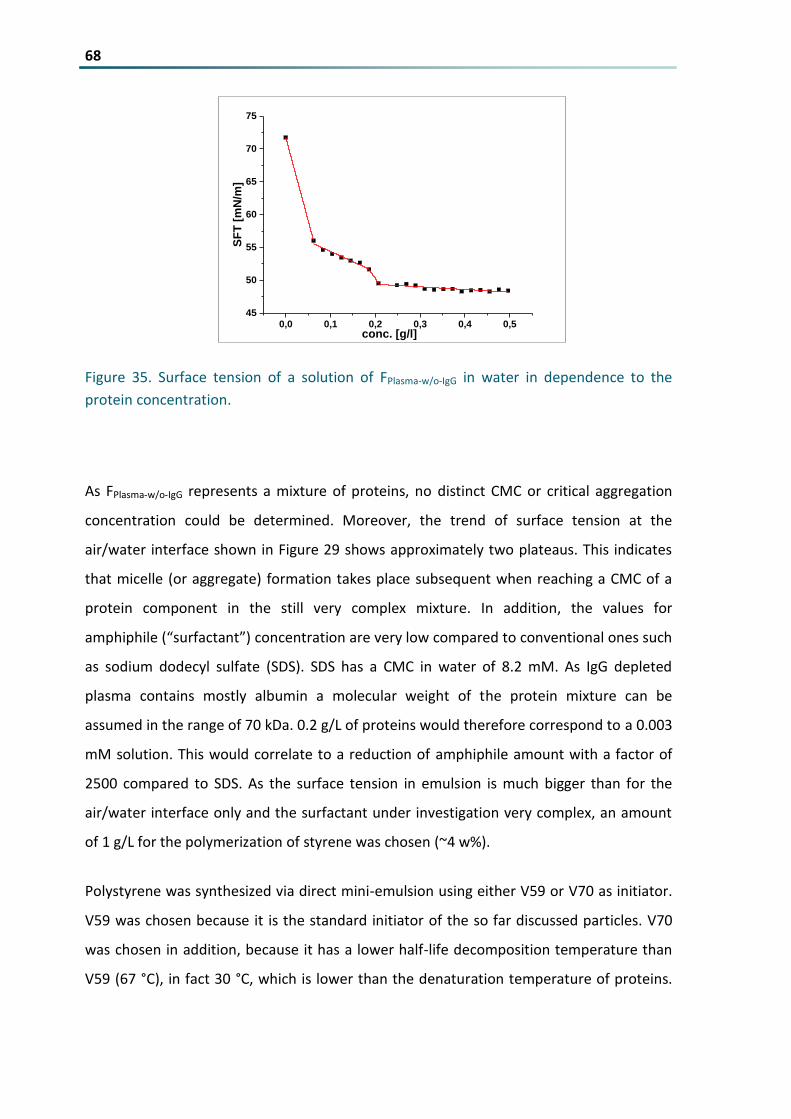
Figure 35 Surface tension of a solution of FPlasma-wo-IgG in water in dependence to the protein concentration
68
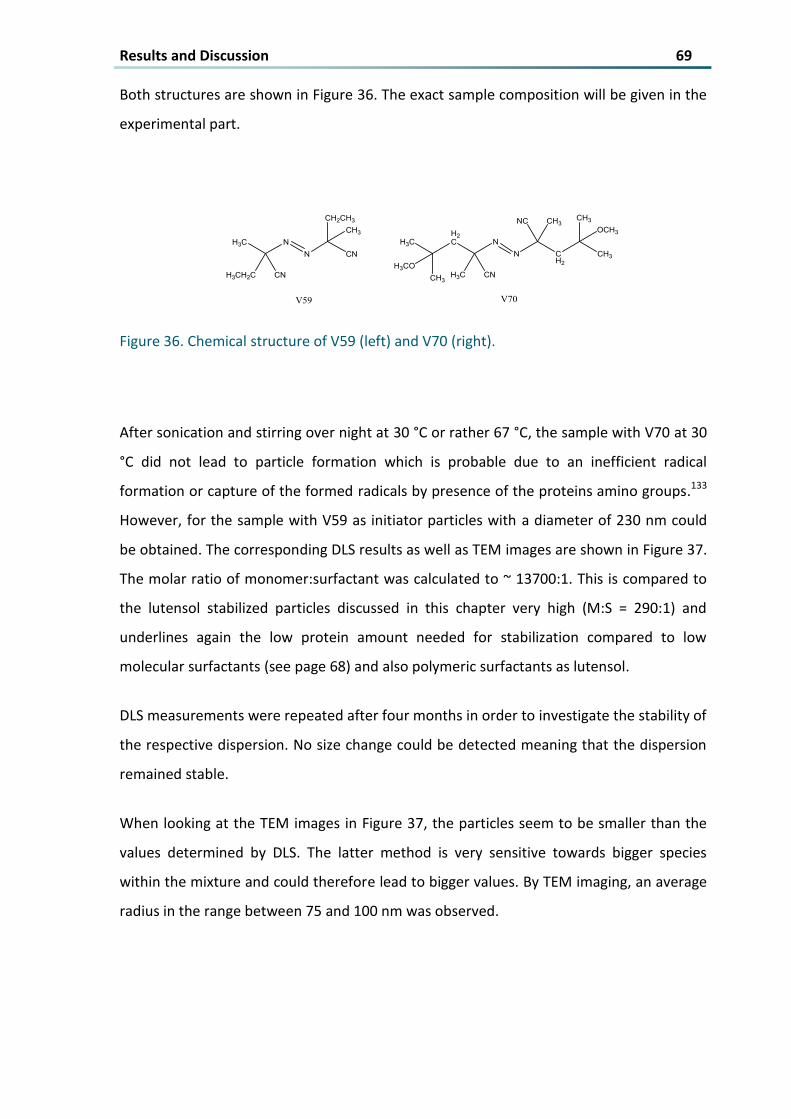
VI Figure 36 Chemical structure of V59 (left) and V70 (right) 69
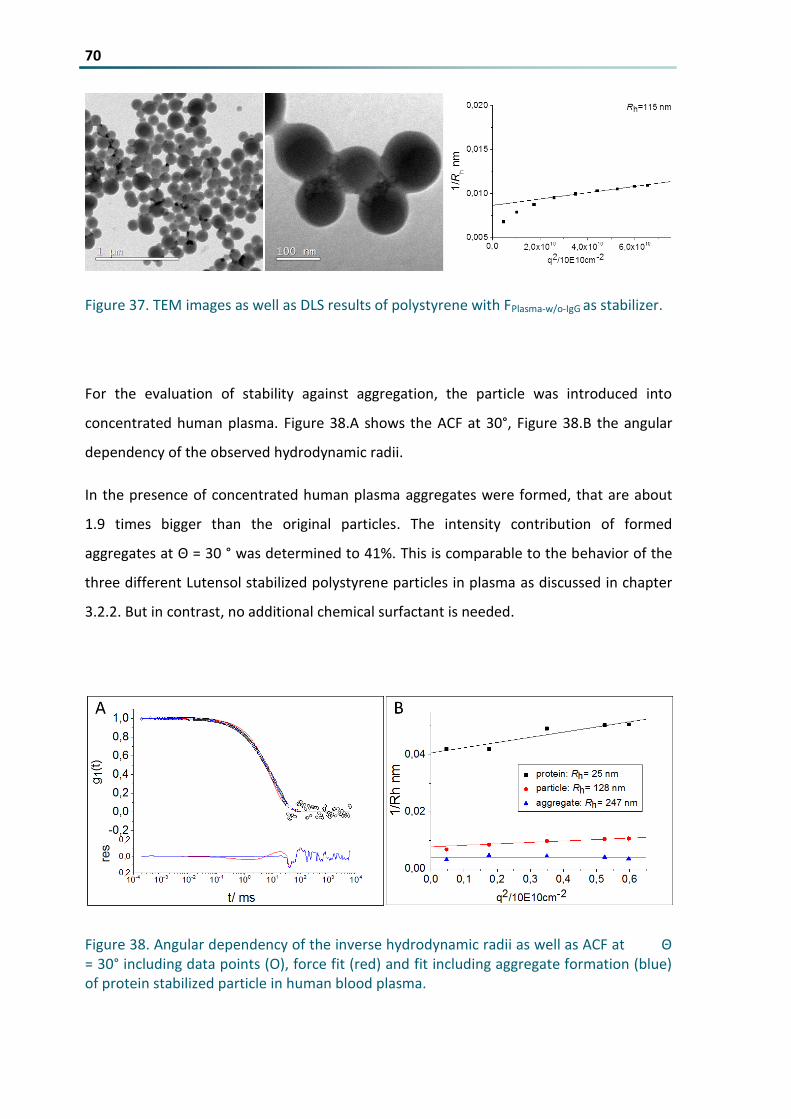
Figure 37 TEM images as well as DLS results of polystyrene with FPlasma-wo-IgG as stabilizer 70
Figure 38 Angular dependency of the inverse hydrodynamic radii as well as ACF at Θ = 30deg including
data points (O) force fit (red) and fit including aggregate formation (blue) of protein stabilized particle
in human blood plasma 70
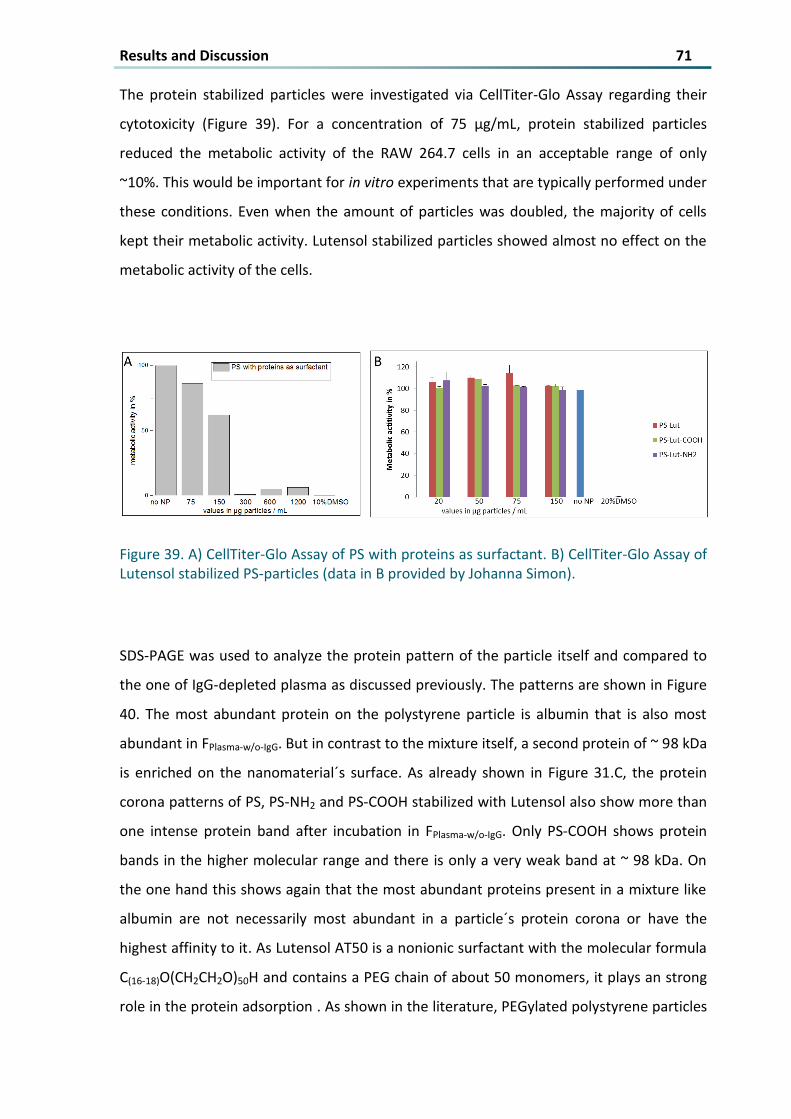
Figure 39 A) CellTiter-Glo Assay of PS with proteins as surfactant B) CellTiter-Glo Assay of Lutensol
stabilized PS-particles (data in B provided by Johanna Simon) 71
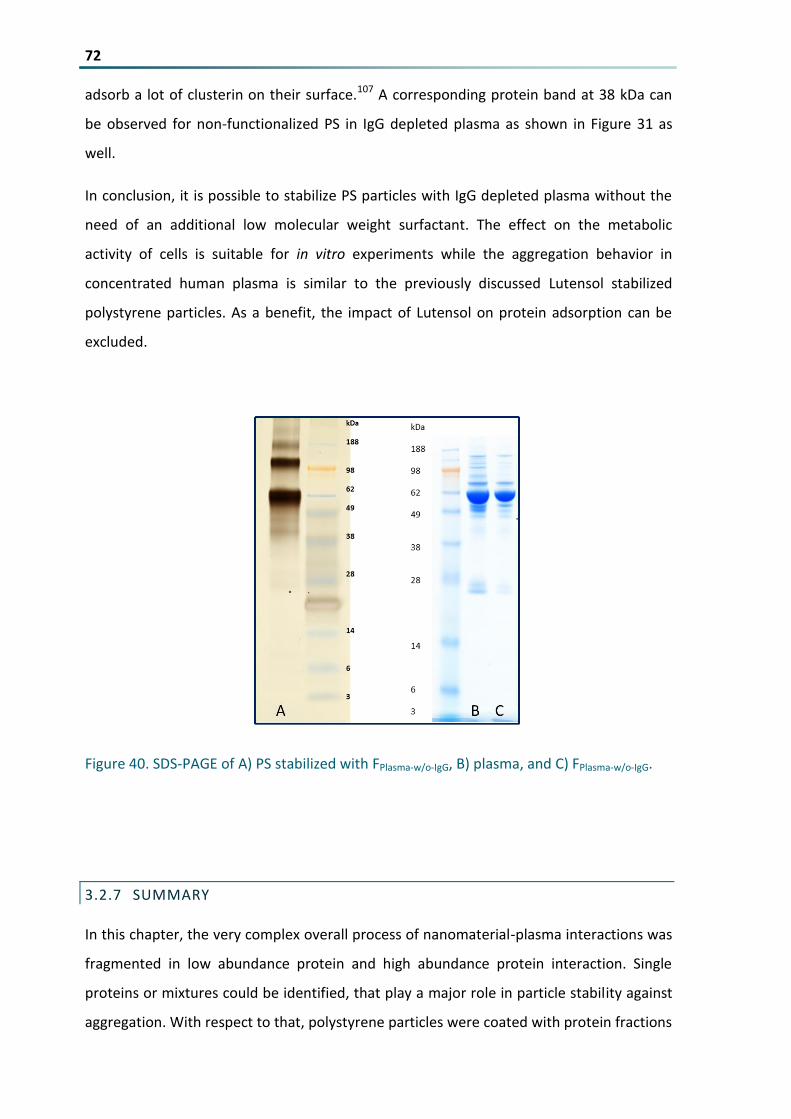
Figure 40 SDS-PAGE of A) PS stabilized with FPlasma-wo-IgG B) plasma and C) FPlasma-wo-IgG 72
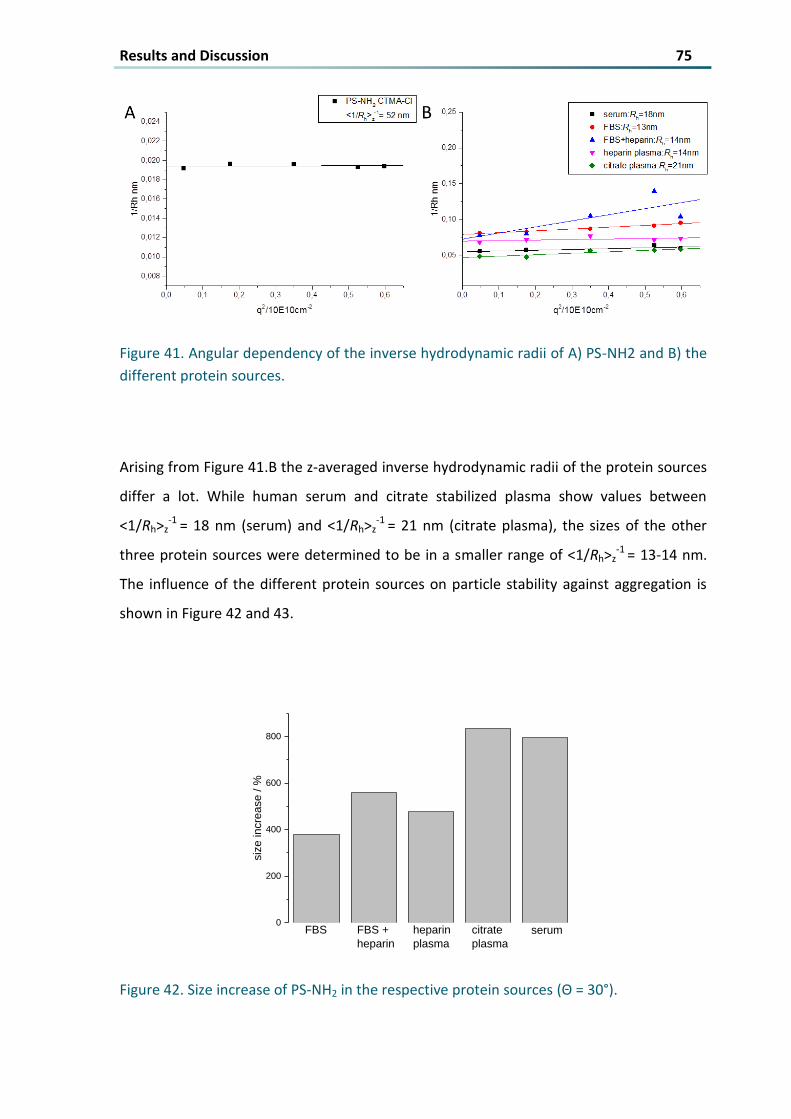
Figure 41 Angular dependency of the inverse hydrodynamic radii of A) PS-NH2 and B) the different protein
sources 75
Figure 42 Size increase of PS-NH2 in the respective protein sources (Θ = 30deg) 75
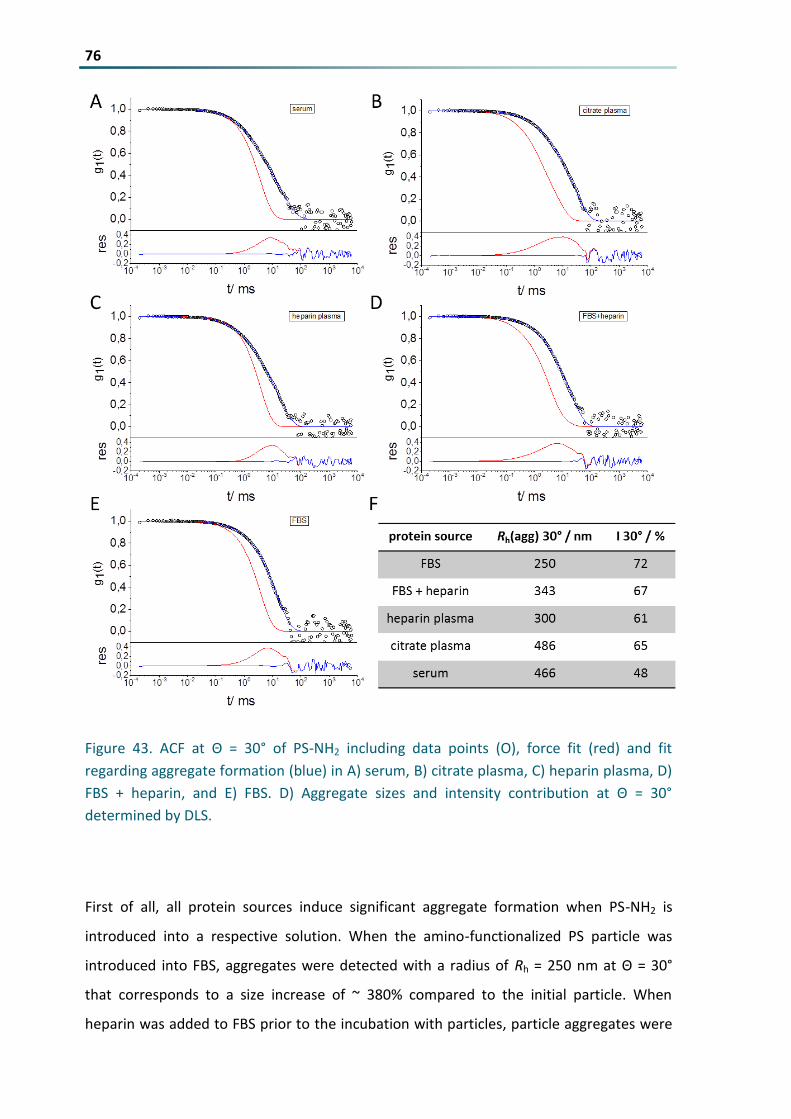
Figure 43 ACF at Θ = 30deg of PS-NH2 including data points (O) force fit (red) and fit regarding aggregate
formation (blue) in A) serum B) citrate plasma C) heparin plasma D) FBS + heparin and E) FBS D)
Aggregate sizes and intensity contribution at Θ = 30deg determined by DLS 76
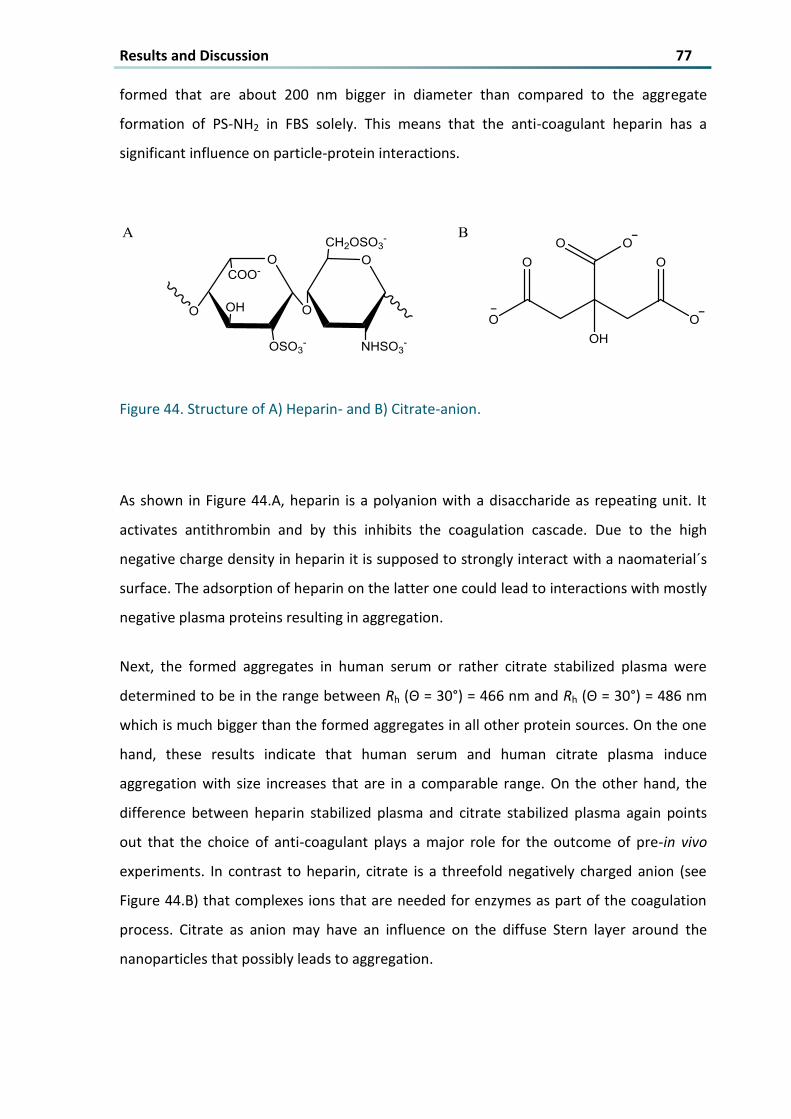
Figure 44 Structure of A) Heparin- and B) Citrate-anion 77
Figure 45 A) Autocorrelation function of serum pool at scattering angle 30deg with the distribution of the
three different size fractions B) Fluctuation of the three different size fractions between different
probands 80
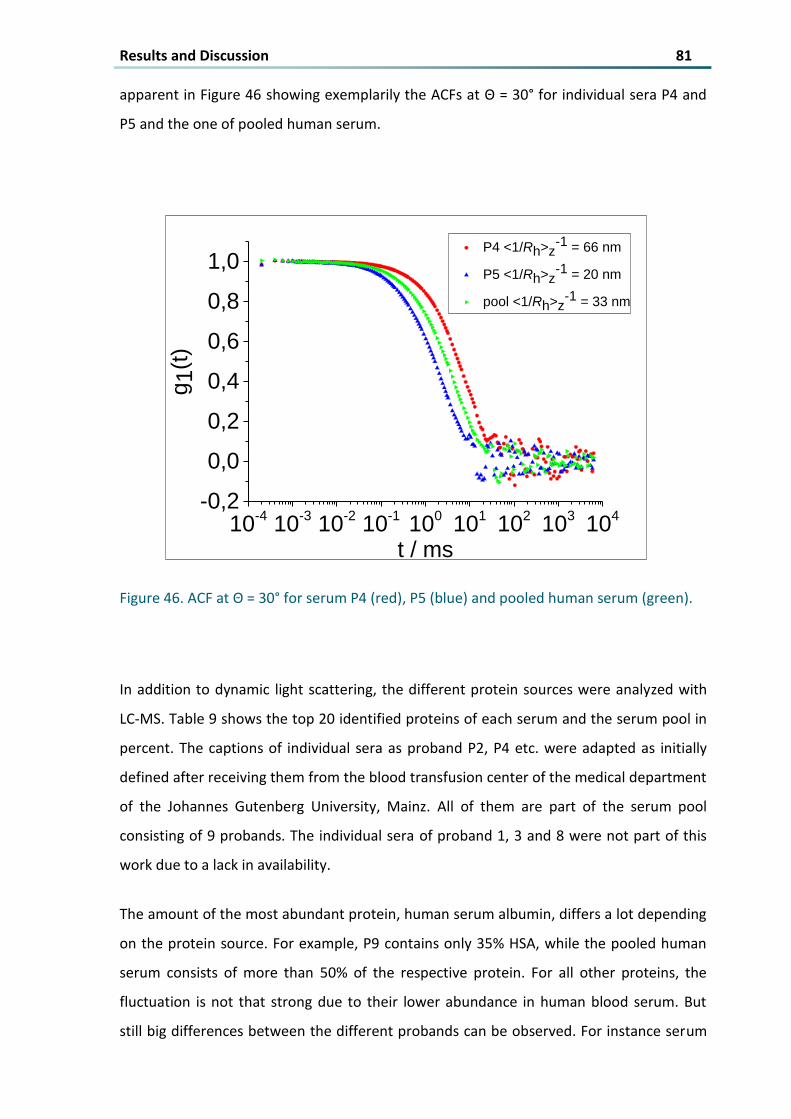
Figure 46 ACF at Θ = 30deg for serum P4 (red) P5 (blue) and pooled human serum (green) 81
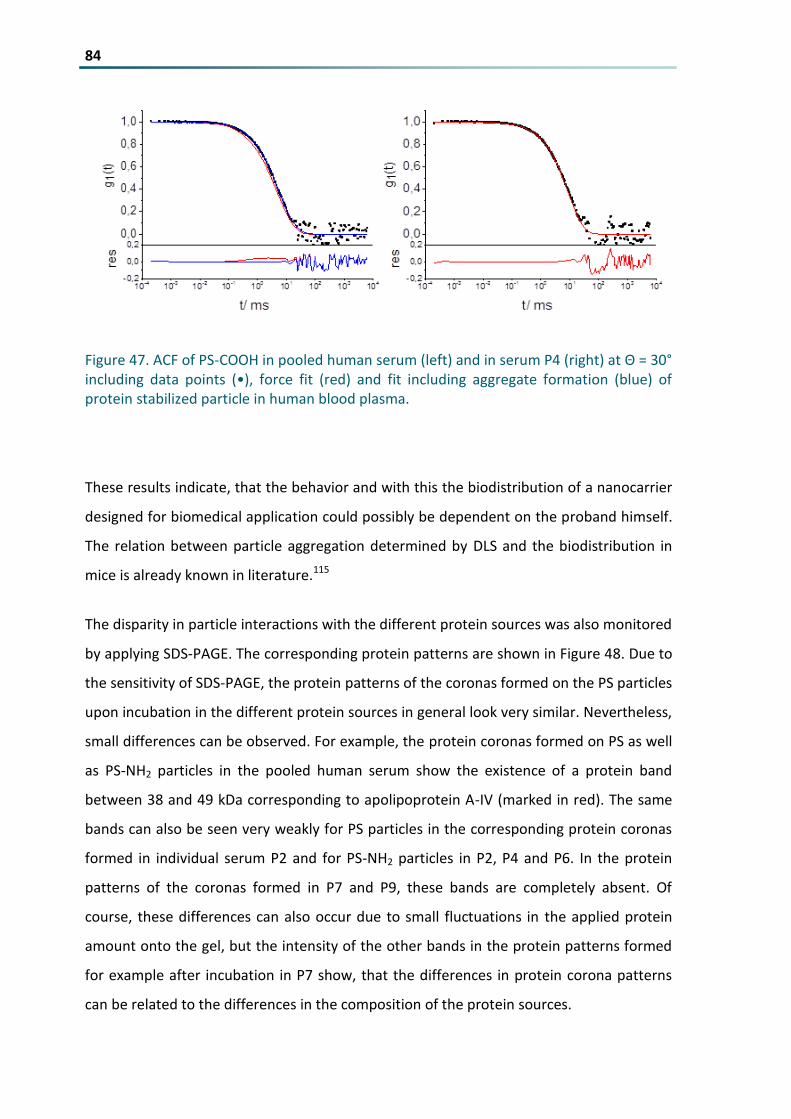
Figure 47 ACF of PS-COOH in pooled human serum (left) and in serum P4 (right) at Θ = 30deg including data
points (bull) force fit (red) and fit including aggregate formation (blue) of protein stabilized particle in
human blood plasma 84
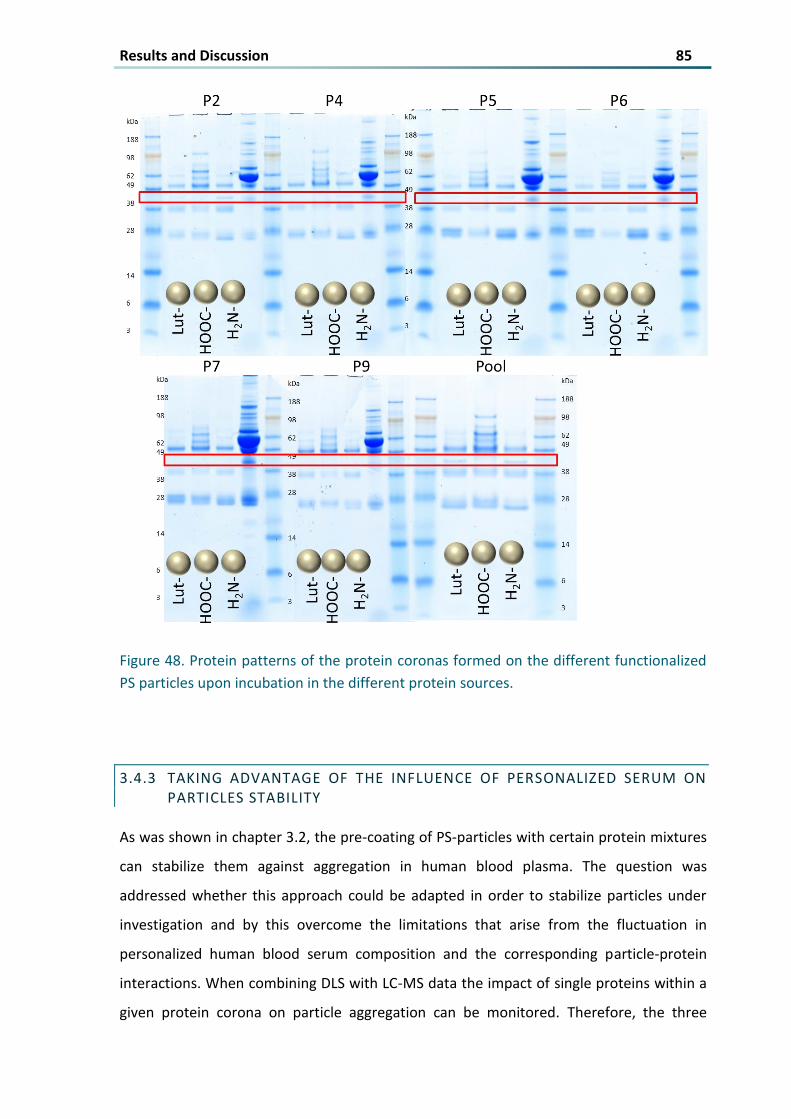
Figure 48 Protein patterns of the protein coronas formed on the different functionalized PS particles upon
incubation in the different protein sources 85
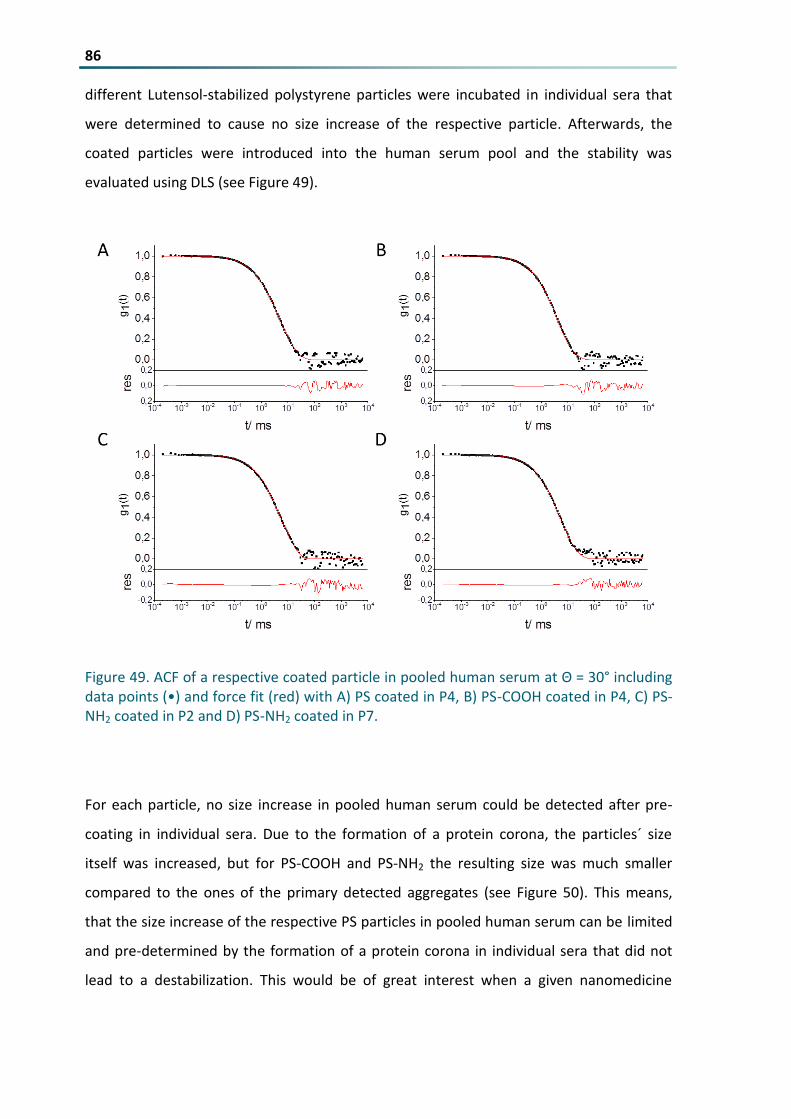
Figure 49 ACF of a respective coated particle in pooled human serum at Θ = 30deg including data points (bull)
and force fit (red) with A) PS coated in P4 B) PS-COOH coated in P4 C) PS-NH2 coated in P2 and D) PS-
NH2 coated in P7 86
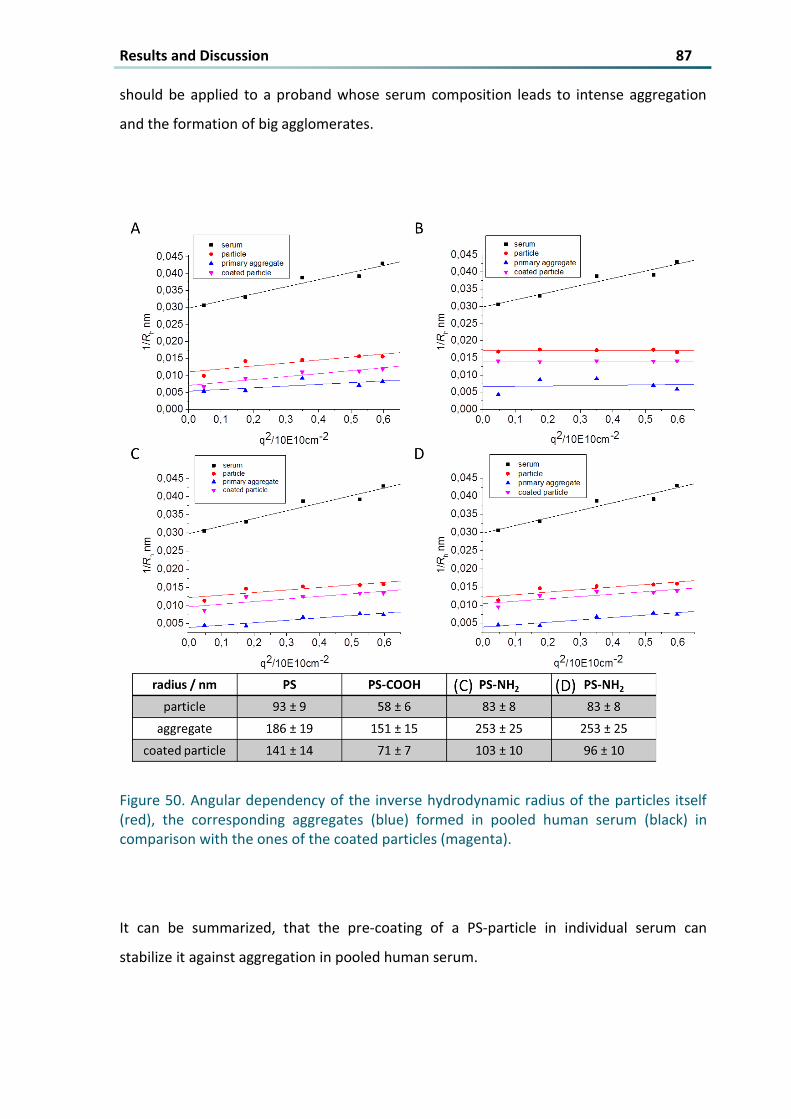
Figure 50 Angular dependency of the inverse hydrodynamic radius of the particles itself (red) the
corresponding aggregates (blue) formed in pooled human serum (black) in comparison with the ones
of the coated particles (magenta) 87
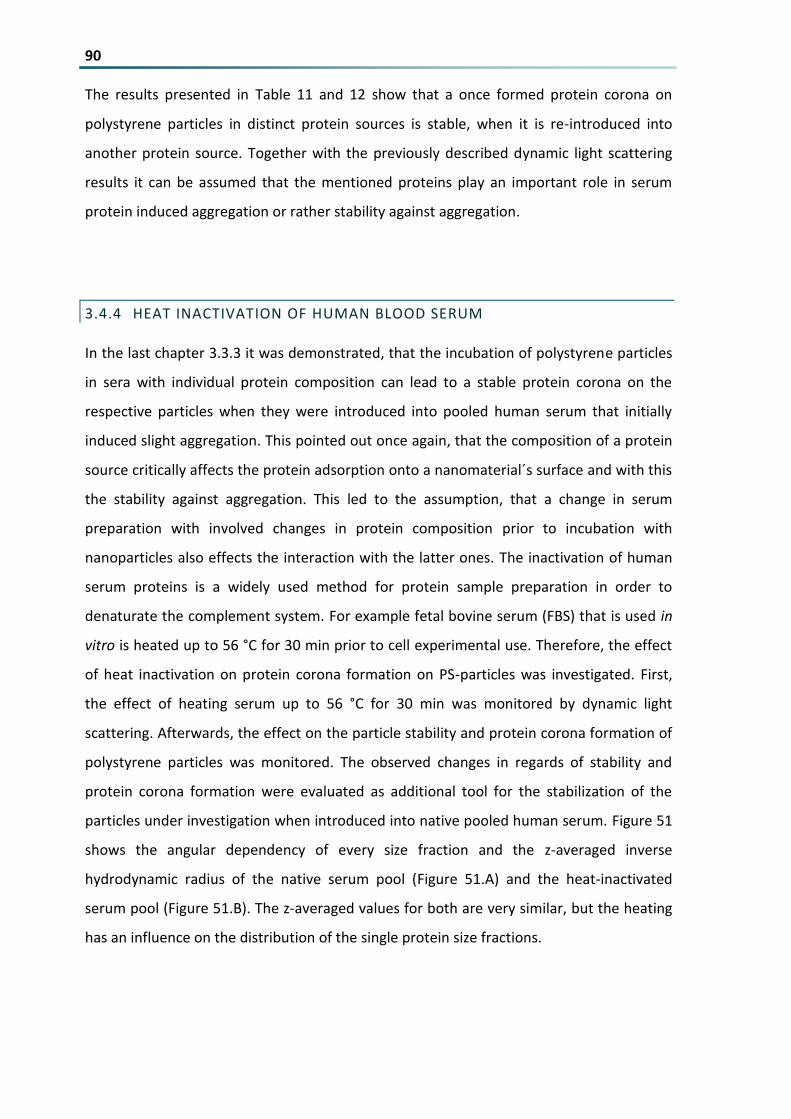
Figure 51 Angular dependency of the inverse hydrodynamic radii as well as the z-averaged value obtained in
native human serum pool (A) and heat inactivated human serum pool (B) 91
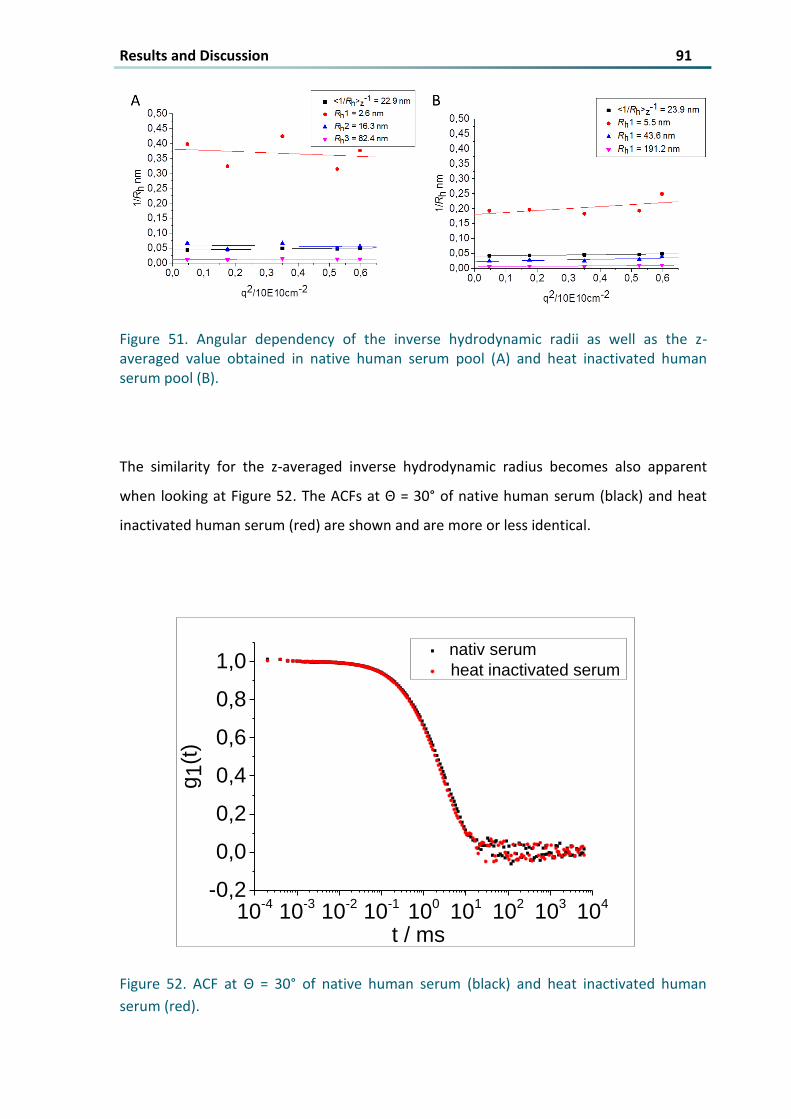
Figure 52 ACF at Θ = 30deg of native human serum (black) and heat inactivated human serum (red) 91
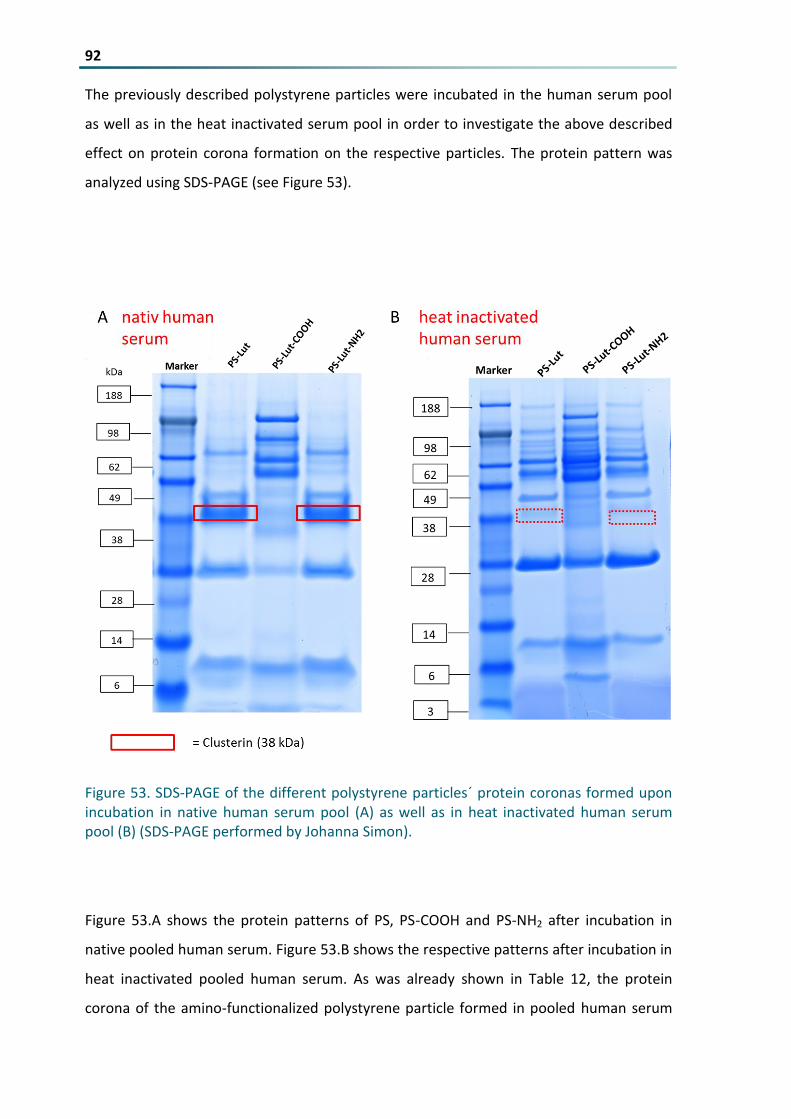
Figure 53 SDS-PAGE of the different polystyrene particlesacute protein coronas formed upon incubation in
native human serum pool (A) as well as in heat inactivated human serum pool (B) (SDS-PAGE
performed by Johanna Simon) 92
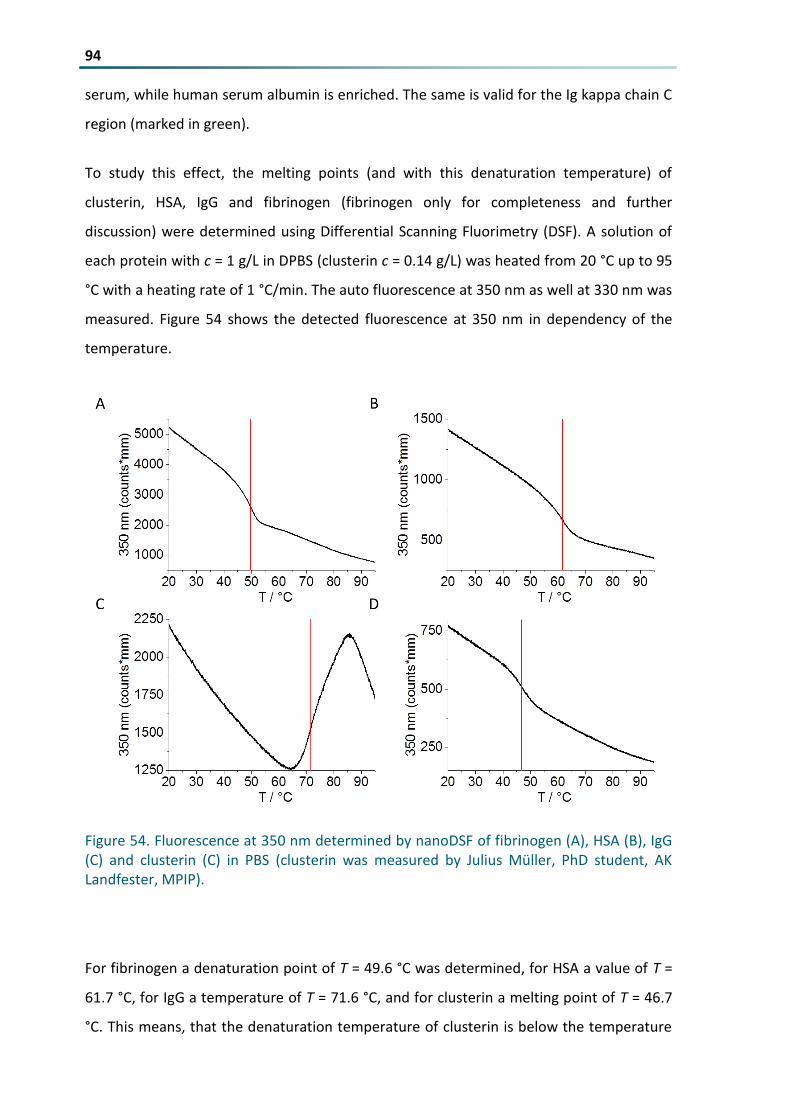
Figure 54 Fluorescence at 350 nm determined by nanoDSF of fibrinogen (A) HSA (B) IgG (C) and clusterin
(C) in PBS (clusterin was measured by Julius Muumlller PhD student AK Landfester MPIP) 94
Contents VII Figure 55 Size increase of the polystyrene particles in native or heat inactivated human serum pool
obtained by DLS in comparison with the size increase in native human serum pool after coating with
inactive human serum pool 96
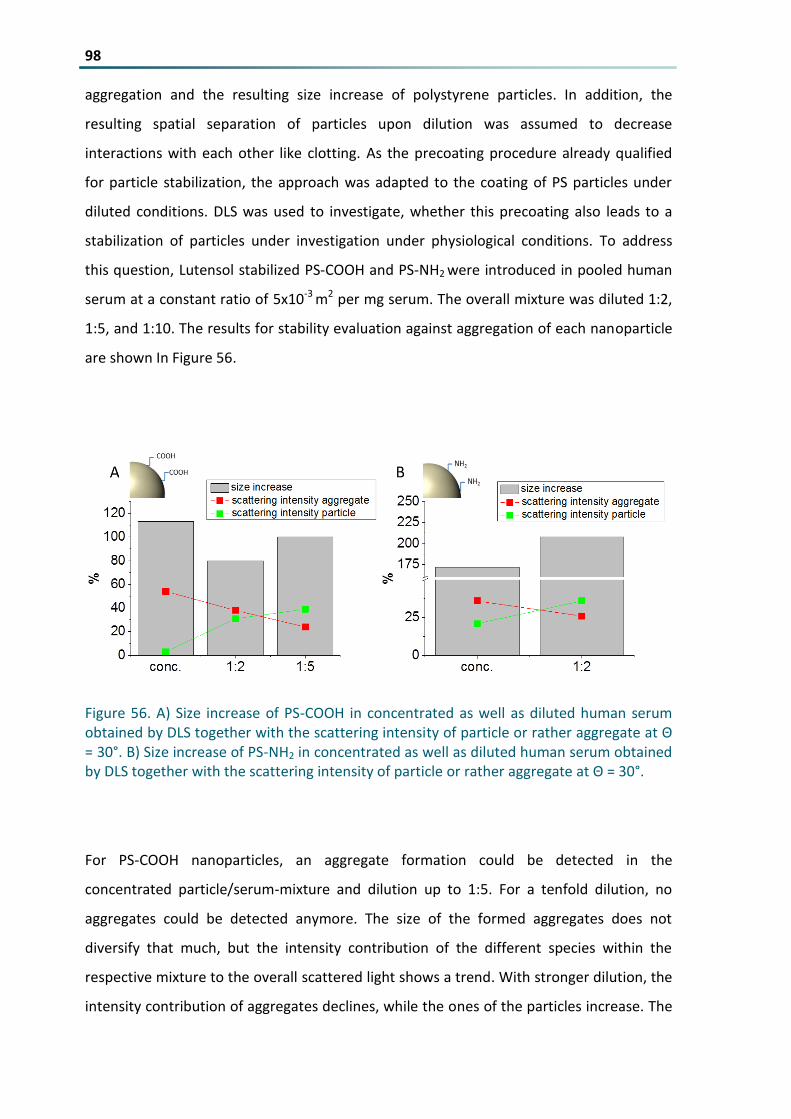
Figure 56 A) Size increase of PS-COOH in concentrated as well as diluted human serum obtained by DLS
together with the scattering intensity of particle or rather aggregate at Θ = 30deg B) Size increase of PS-
NH2 in concentrated as well as diluted human serum obtained by DLS together with the scattering
intensity of particle or rather aggregate at Θ = 30deg 98
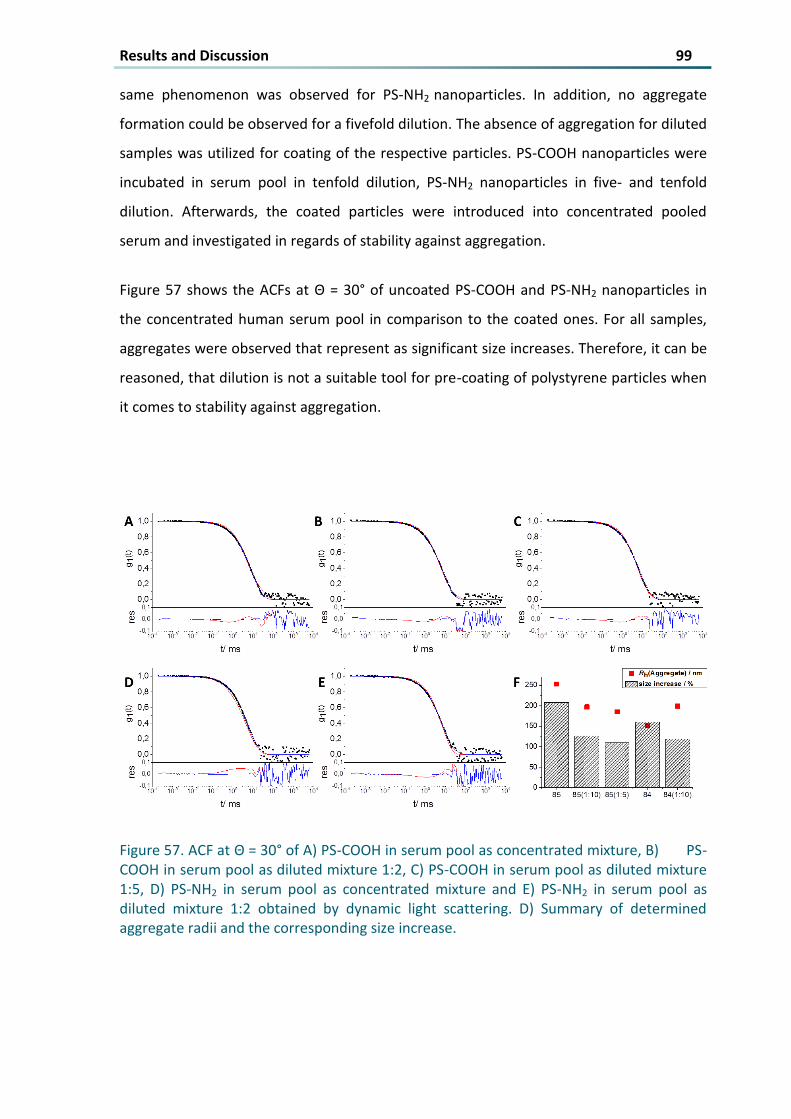
Figure 57 ACF at Θ = 30deg of A) PS-COOH in serum pool as concentrated mixture B) PS-COOH in serum
pool as diluted mixture 12 C) PS-COOH in serum pool as diluted mixture 15 D) PS-NH2 in serum pool
as concentrated mixture and E) PS-NH2 in serum pool as diluted mixture 12 obtained by dynamic light
scattering D) Summary of determined aggregate radii and the corresponding size increase 99
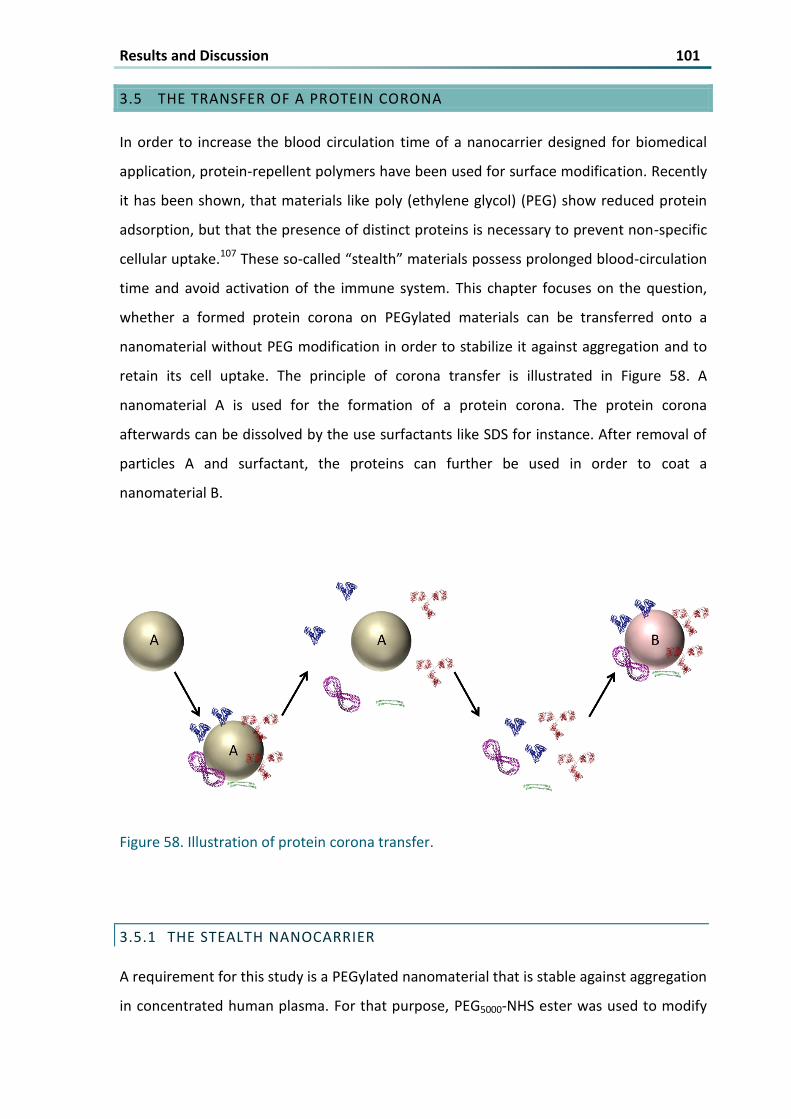
Figure 58 Illustration of protein corona transfer 101
Figure 59 A) Angular dependency of the inverse hydrodynamic radius of PS-PEG5000 obtained by DLS B) ACF
at Θ = 30deg of PS-PEG5000 in concentrated human plasma including data points and force fit 103
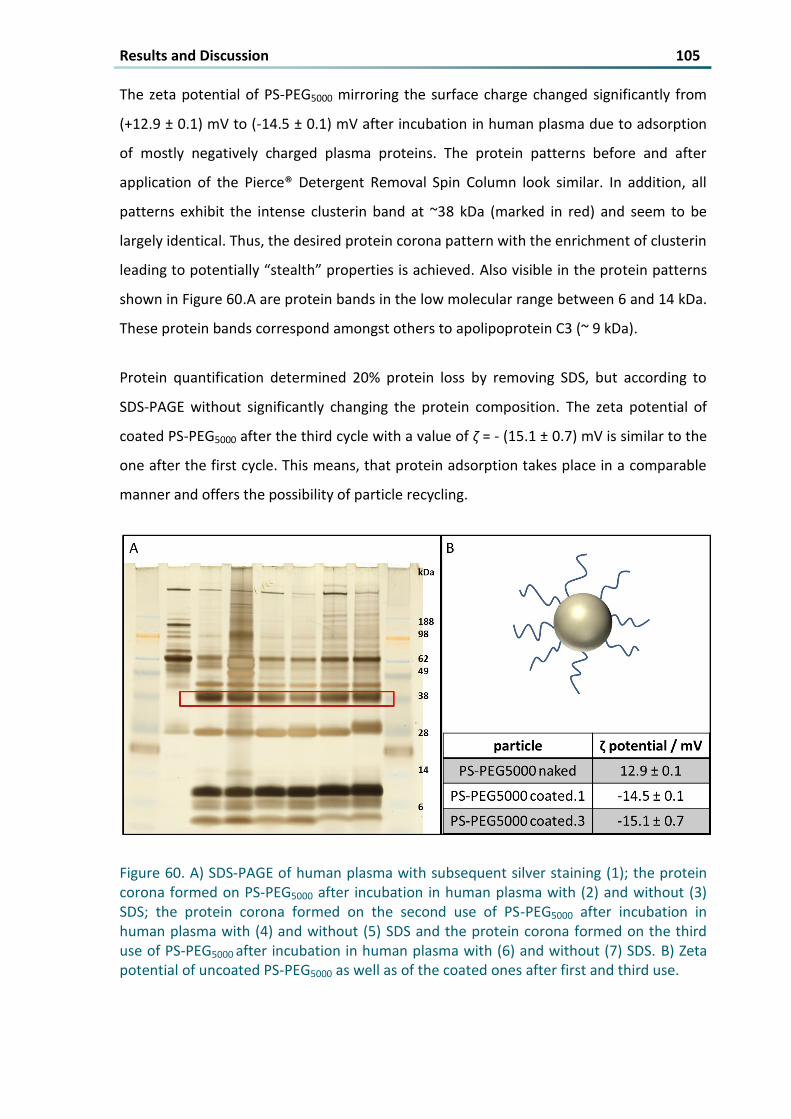
Figure 60 A) SDS-PAGE of human plasma with subsequent silver staining (1) the protein corona formed on
PS-PEG5000 after incubation in human plasma with (2) and without (3) SDS the protein corona formed
on the second use of PS-PEG5000 after incubation in human plasma with (4) and without (5) SDS and
the protein corona formed on the third use of PS-PEG5000 after incubation in human plasma with (6)
and without (7) SDS B) Zeta potential of uncoated PS-PEG5000 as well as of the coated ones after first
and third use 105
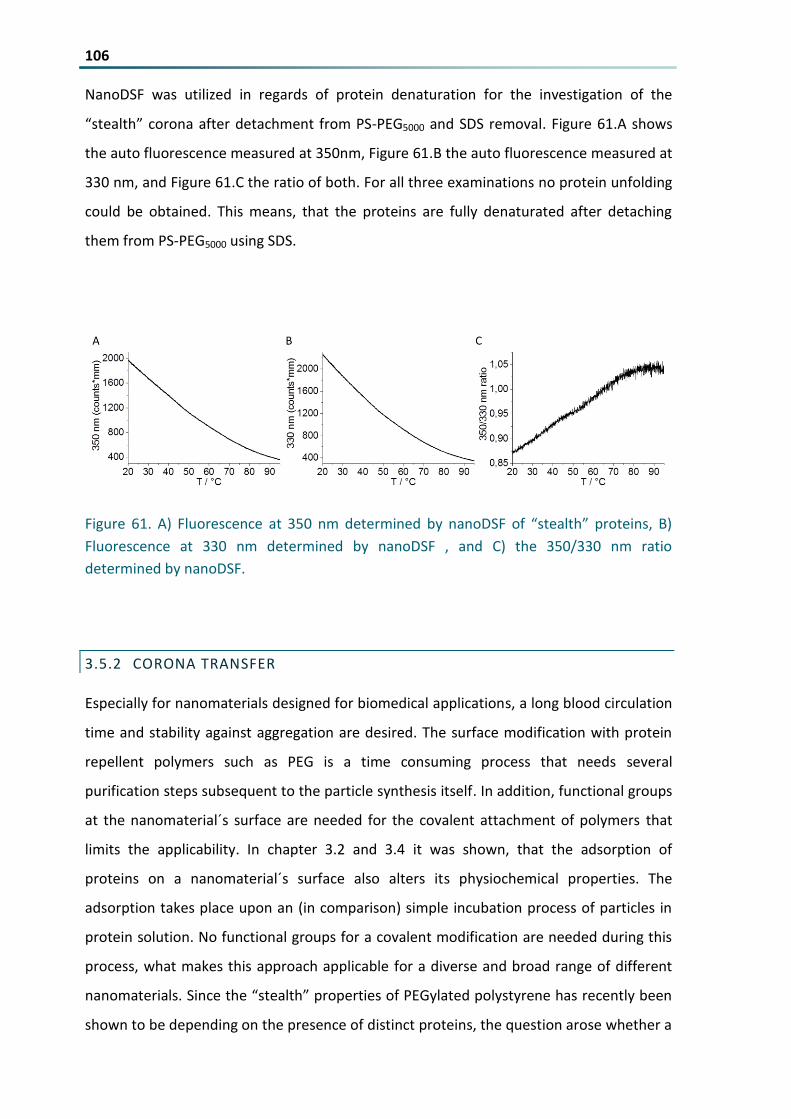
Figure 61 A) Fluorescence at 350 nm determined by nanoDSF of ldquostealthrdquo proteins B) Fluorescence at 330
nm determined by nanoDSF and C) the 350330 nm ratio determined by nanoDSF 106
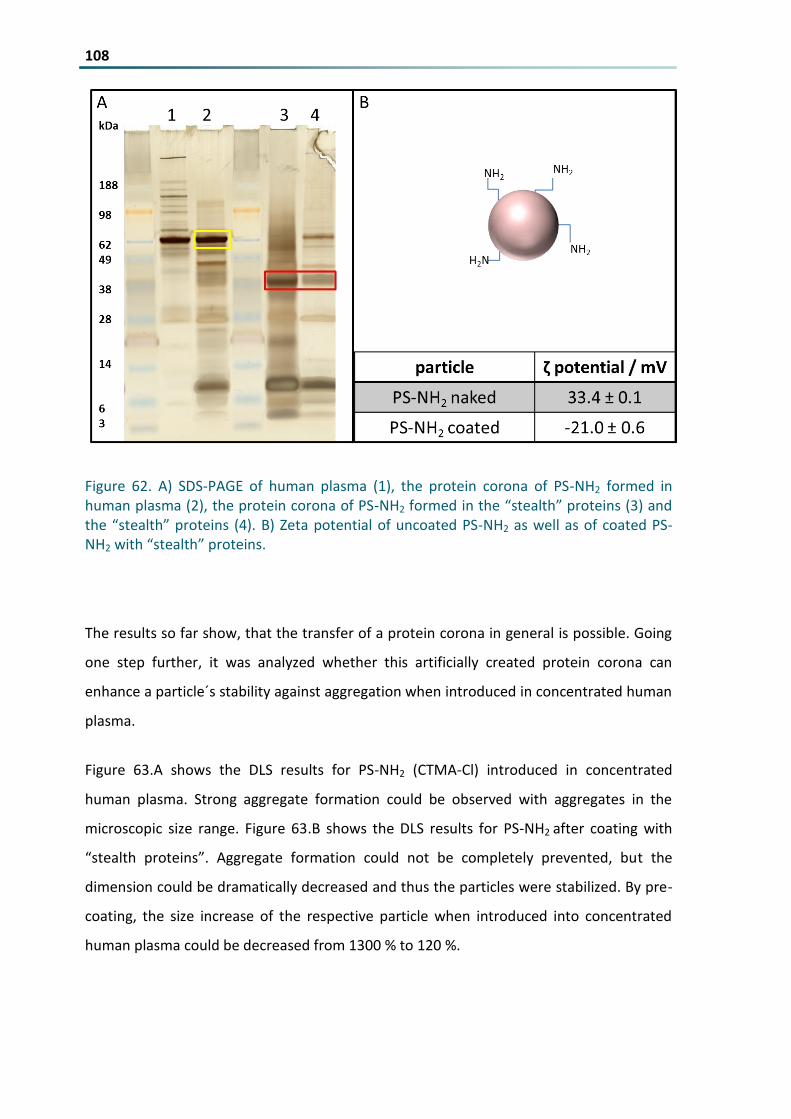
Figure 62 A) SDS-PAGE of human plasma (1) the protein corona of PS-NH2 formed in human plasma (2) the
protein corona of PS-NH2 formed in the ldquostealthrdquo proteins (3) and the ldquostealthrdquo proteins (4) B) Zeta
potential of uncoated PS-NH2 as well as of coated PS-NH2 with ldquostealthrdquo proteins 108
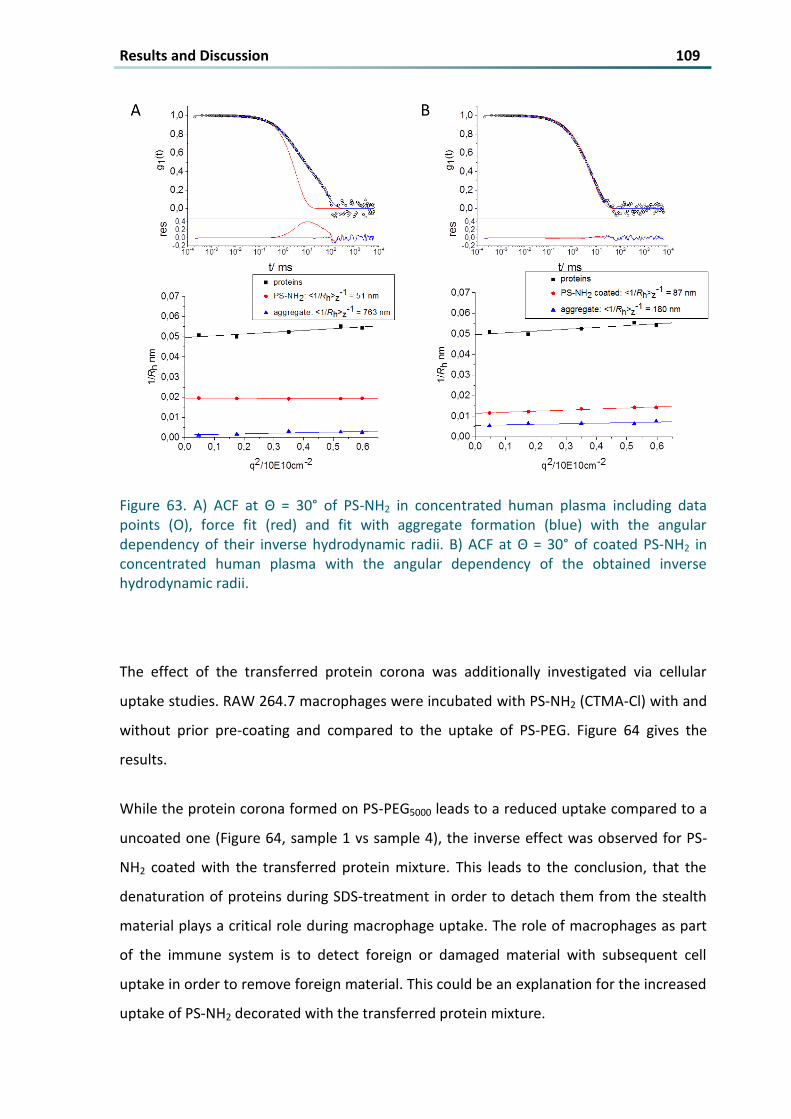
Figure 63 A) ACF at Θ = 30deg of PS-NH2 in concentrated human plasma including data points (O) force fit
(red) and fit with aggregate formation (blue) with the angular dependency of their inverse
hydrodynamic radii B) ACF at Θ = 30deg of coated PS-NH2 in concentrated human plasma with the
angular dependency of the obtained inverse hydrodynamic radii 109
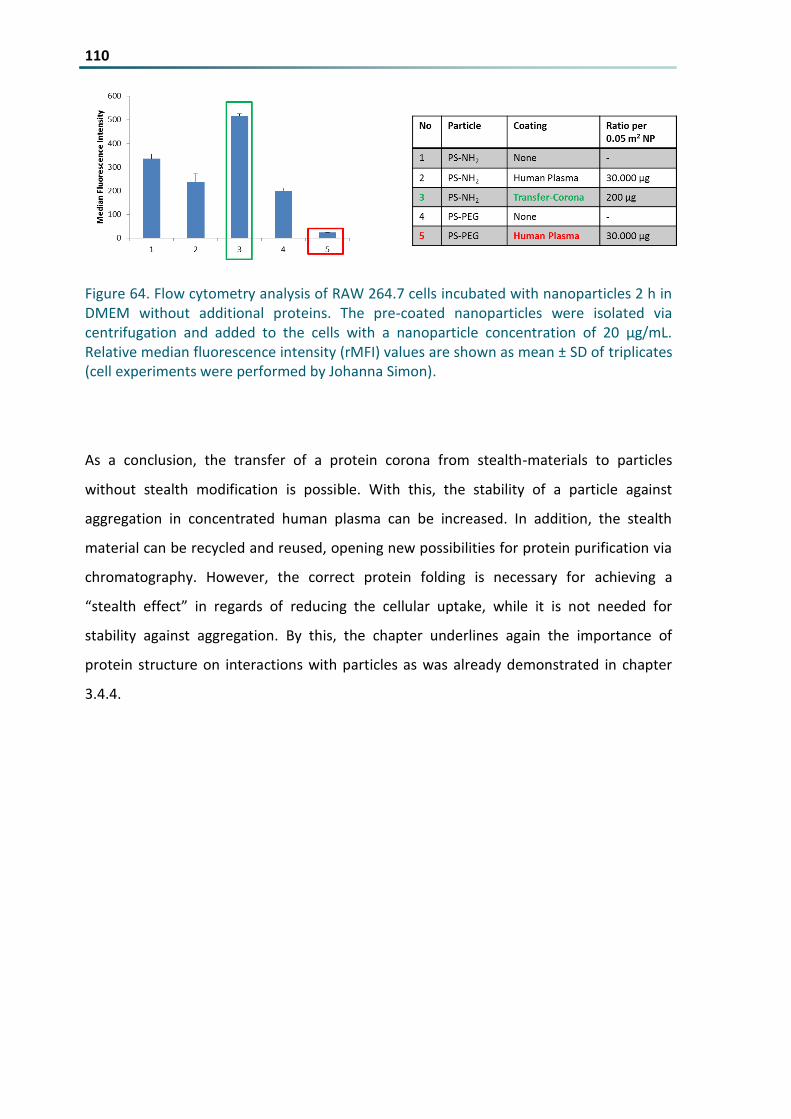
Figure 64 Flow cytometry analysis of RAW 2647 cells incubated with nanoparticles 2 h in DMEM without
additional proteins The pre-coated nanoparticles were isolated via centrifugation and added to the
cells with a nanoparticle concentration of 20 microgmL Relative median fluorescence intensity (rMFI)
values are shown as mean plusmn SD of triplicates (cell experiments were performed by Johanna Simon)110
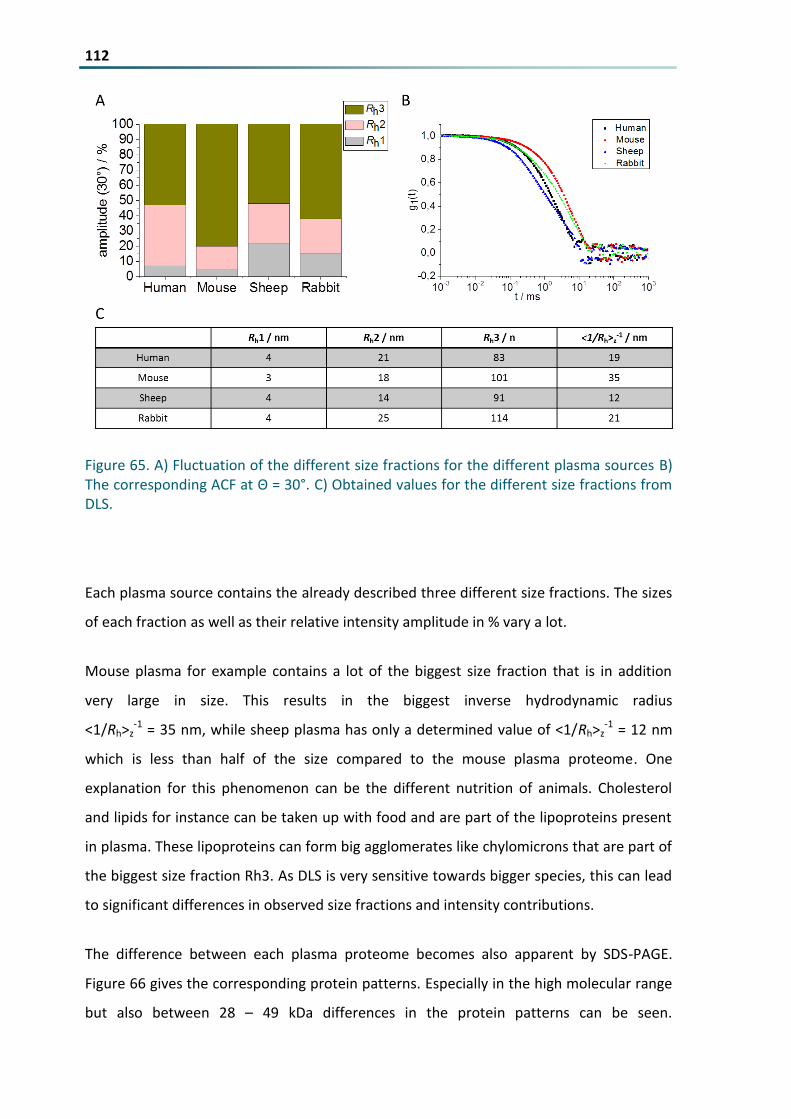
Figure 65 A) Fluctuation of the different size fractions for the different plasma sources B) The corresponding
ACF at Θ = 30deg C) Obtained values for the different size fractions from DLS 112
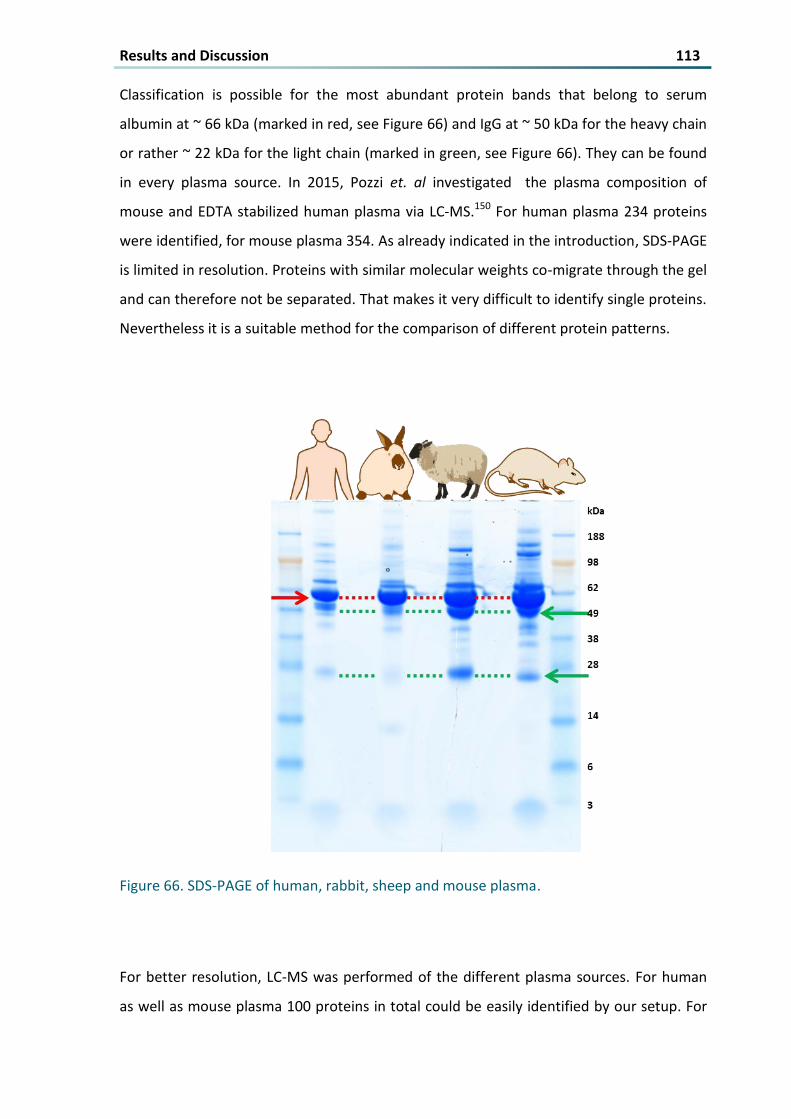
Figure 66 SDS-PAGE of human rabbit sheep and mouse plasma 113
Figure 67 A) Observed size increases in of the different PS-particles after exposure to human mouse
rabbit and sheep plasma B) Zeta potential of uncoated PS-particles as well as coated particles in the
different plasma sources under investigation 117
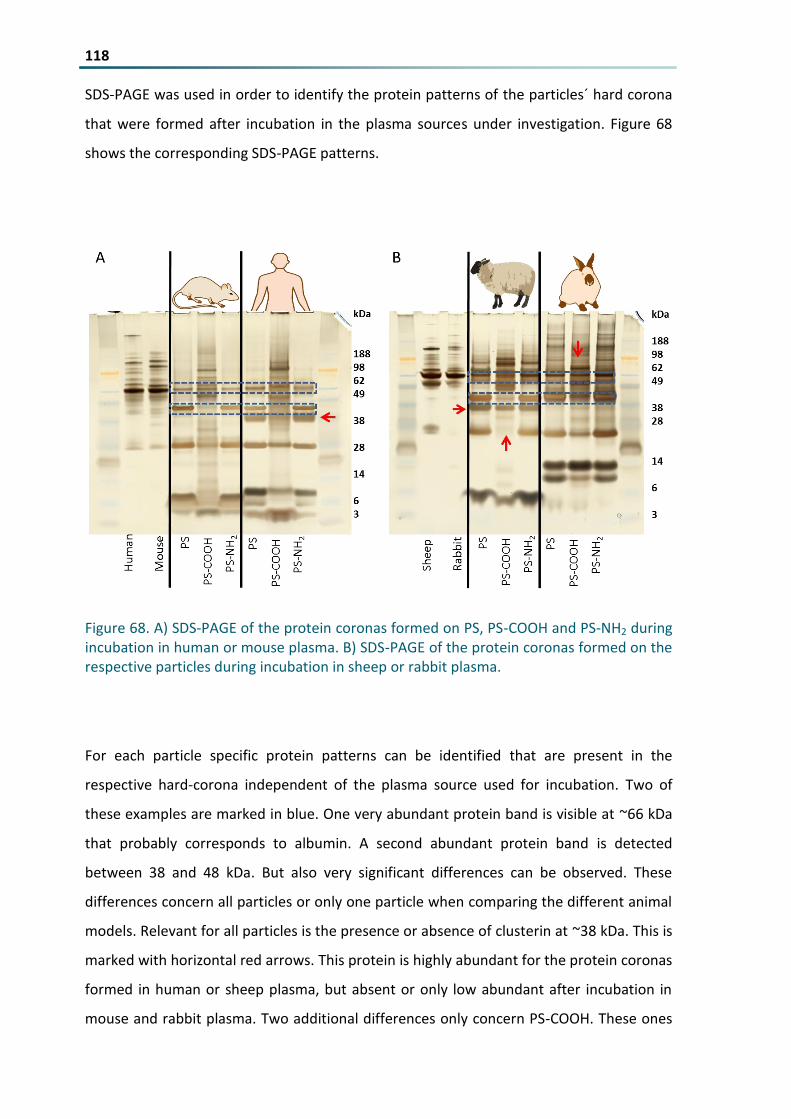
VIII Figure 68 A) SDS-PAGE of the protein coronas formed on PS PS-COOH and PS-NH2 during incubation in
human or mouse plasma B) SDS-PAGE of the protein coronas formed on the respective particles
during incubation in sheep or rabbit plasma 118
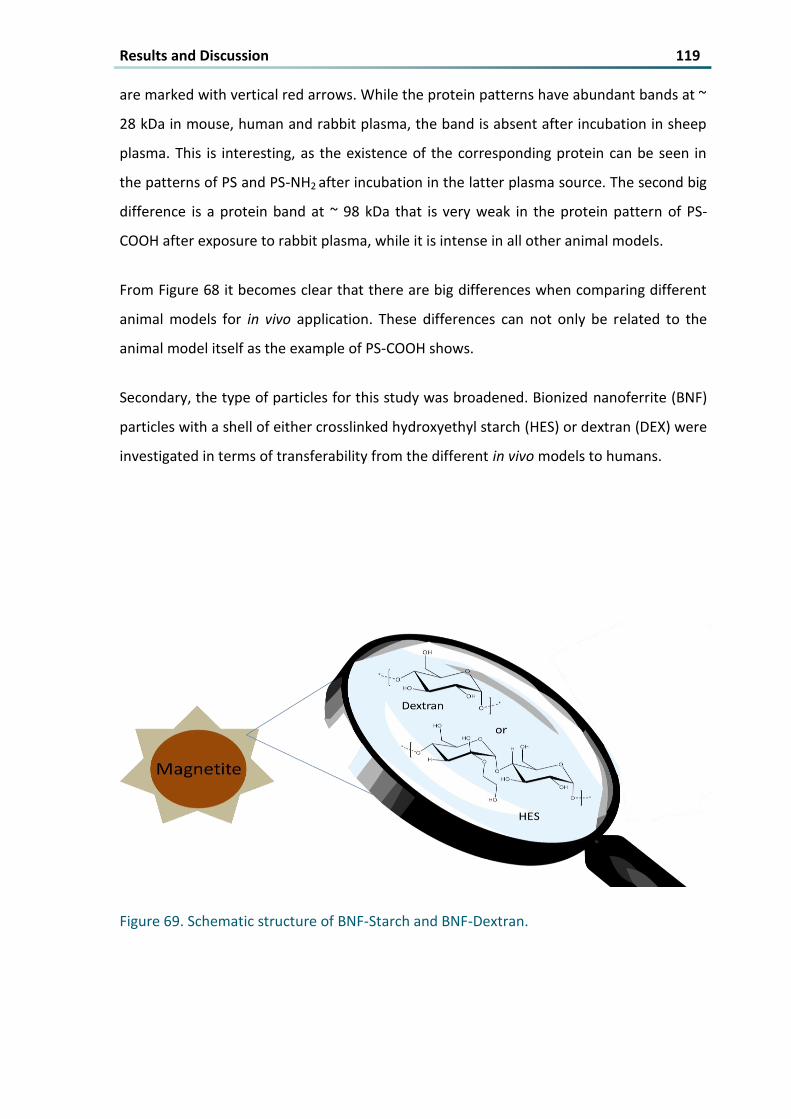
Figure 69 Schematic structure of BNF-Starch and BNF-Dextran 119
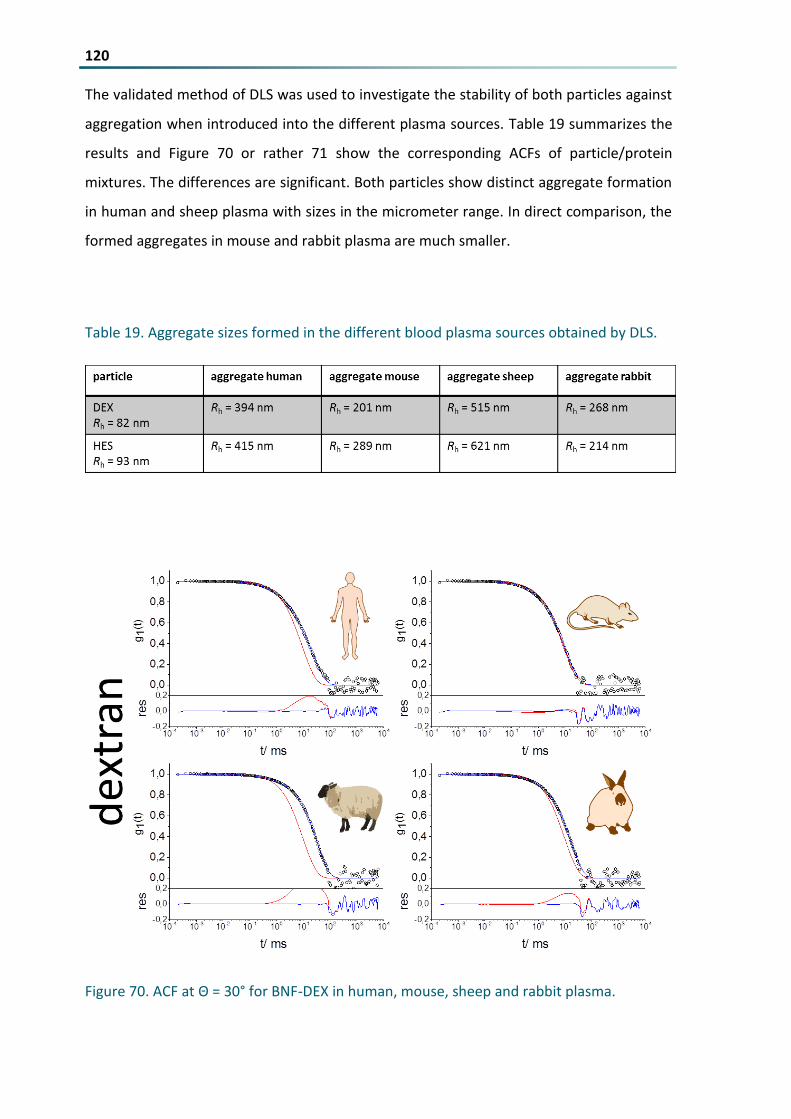
Figure 70 ACF at Θ = 30deg for BNF-DEX in human mouse sheep and rabbit plasma 120
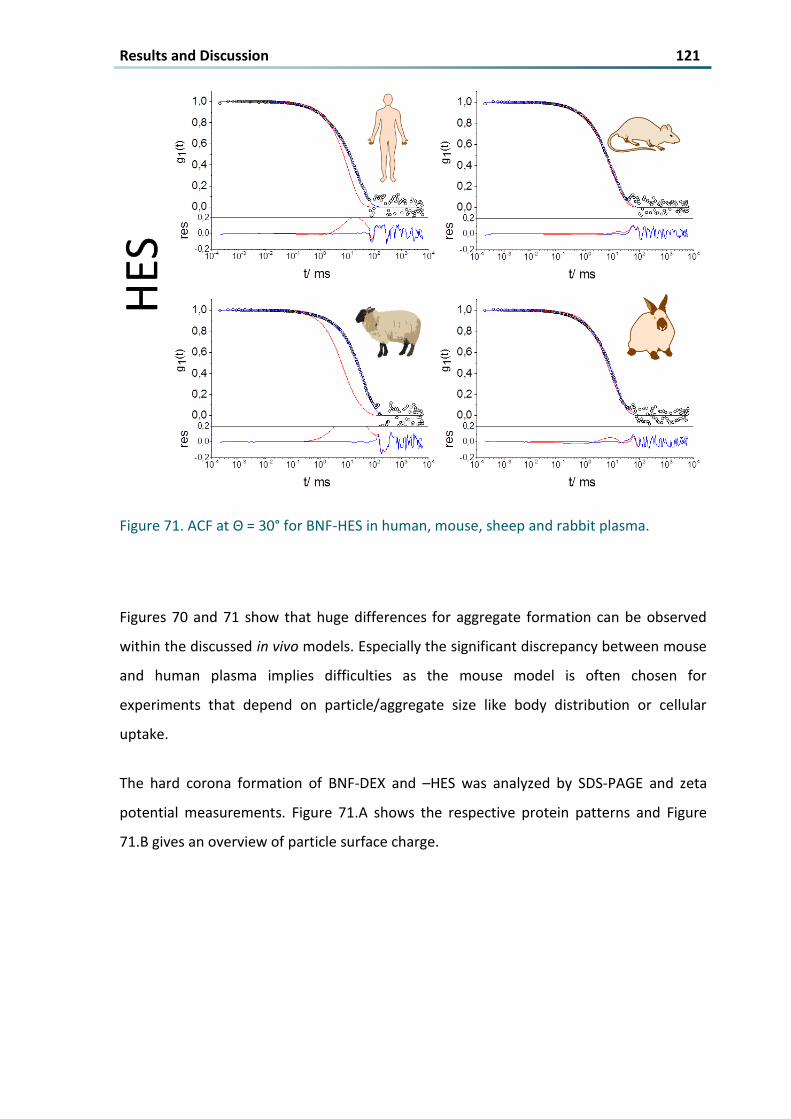
Figure 71 ACF at Θ = 30deg for BNF-HES in human mouse sheep and rabbit plasma 121
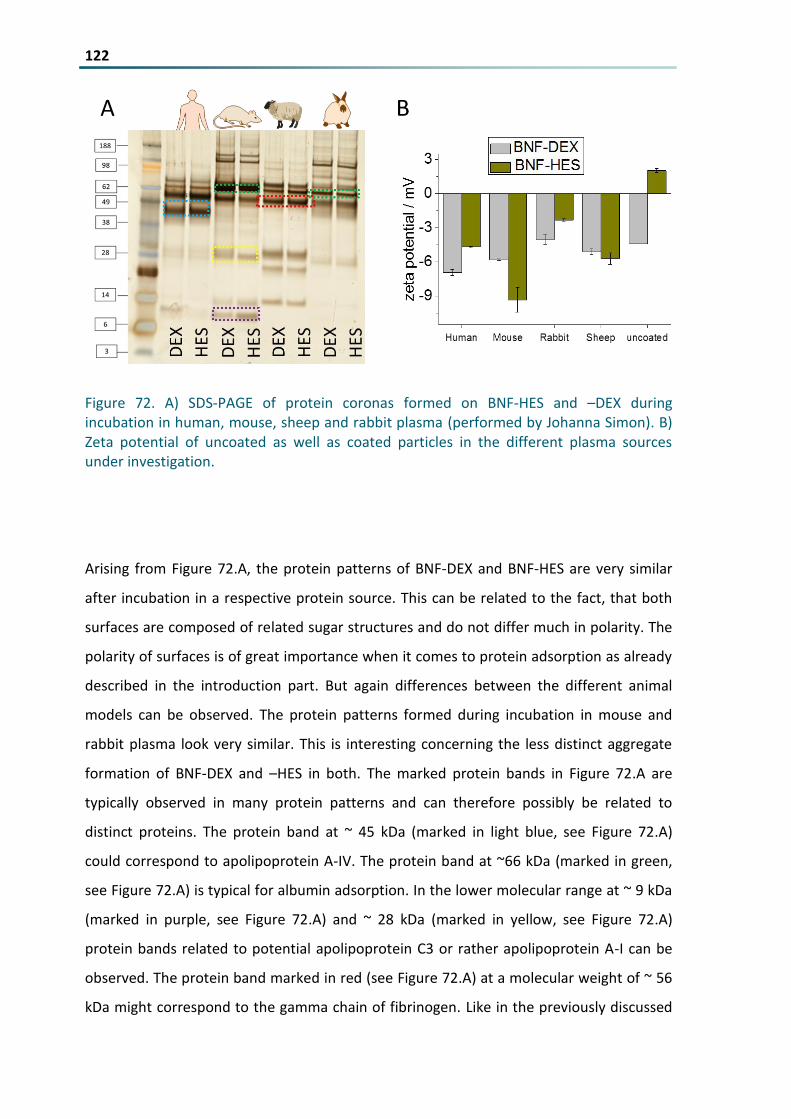
Figure 72 A) SDS-PAGE of protein coronas formed on BNF-HES and ndashDEX during incubation in human
mouse sheep and rabbit plasma (performed by Johanna Simon) B) Zeta potential of uncoated as well
as coated particles in the different plasma sources under investigation 122
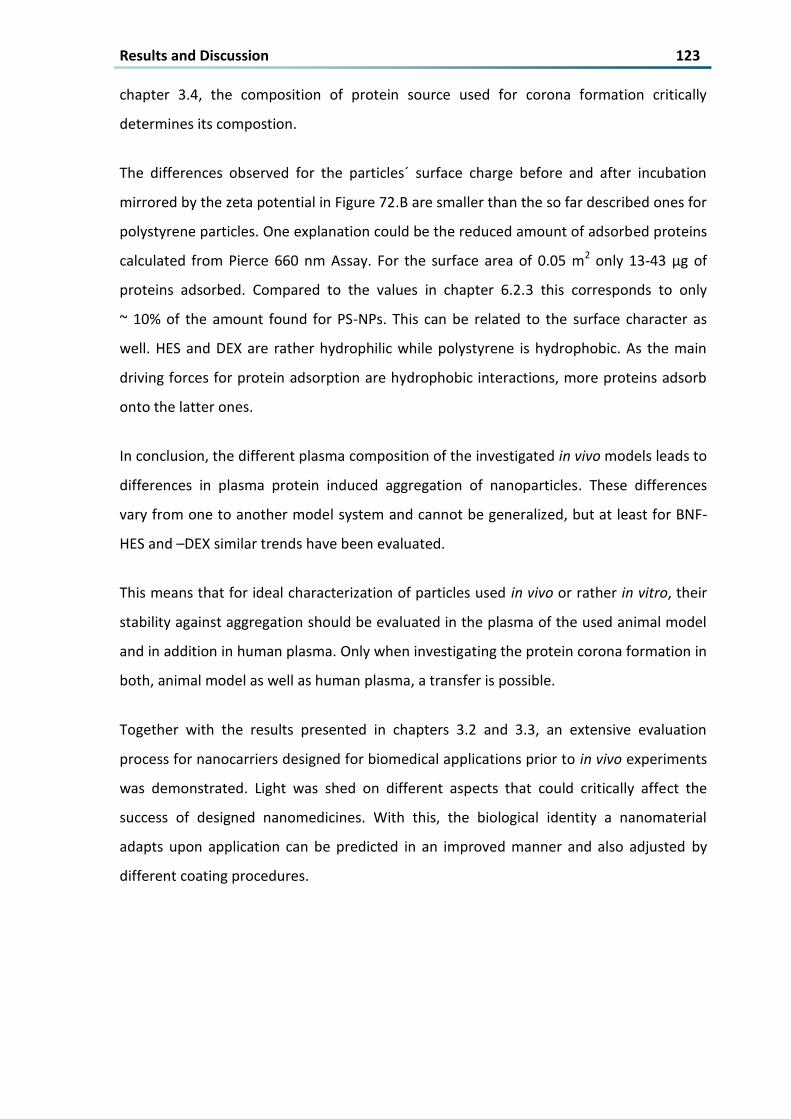
Figure 73 Molecular structures of the cholesterol-based amphiphilic lipid ananlogues Reprinted (adapted)
with permission from (ldquoEvaluation of Multifunctional Liposomes in Human Blood Serum by Light
Scatteringrdquo Mohr et al Langmuir 2014 30 14954-14962) Copyright copy 2014 American Chemical
Society 125
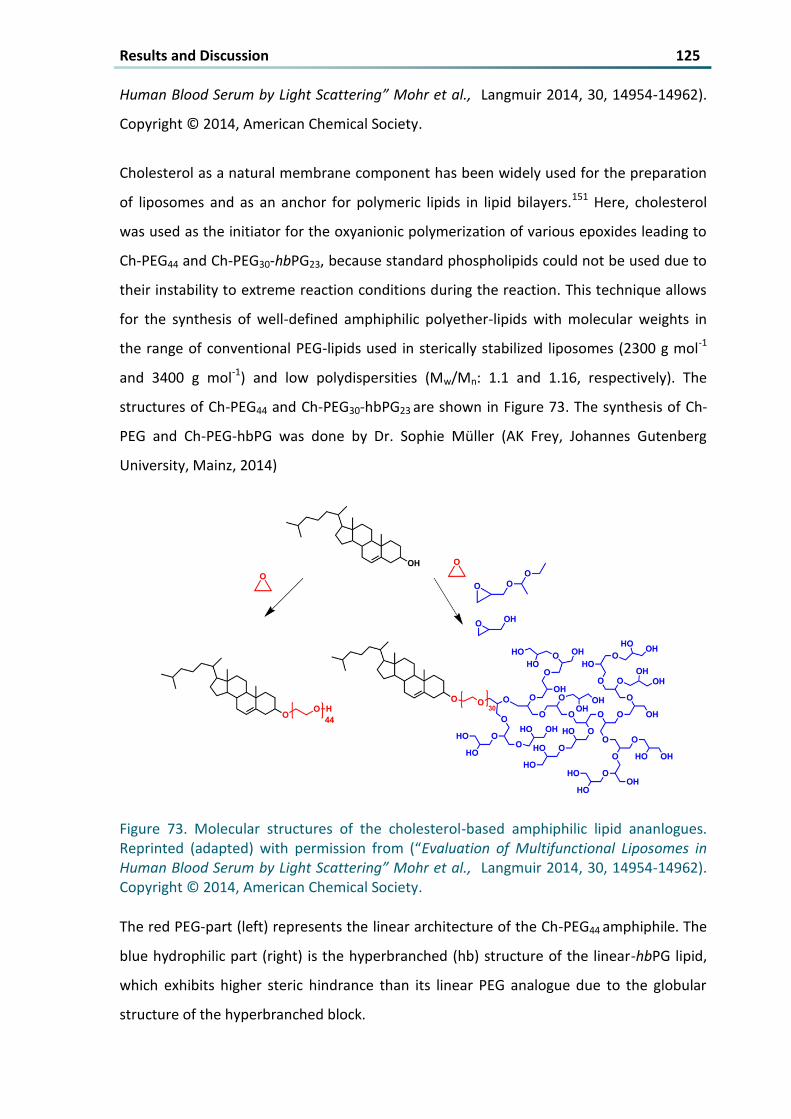
Figure 74 Cartoon of PEGylated liposomes Reprinted (adapted) with permission from (ldquoEvaluation of
Multifunctional Liposomes in Human Blood Serum by Light Scatteringrdquo Mohr et al Langmuir 2014 30
14954-14962) Copyright copy 2014 American Chemical Society 126
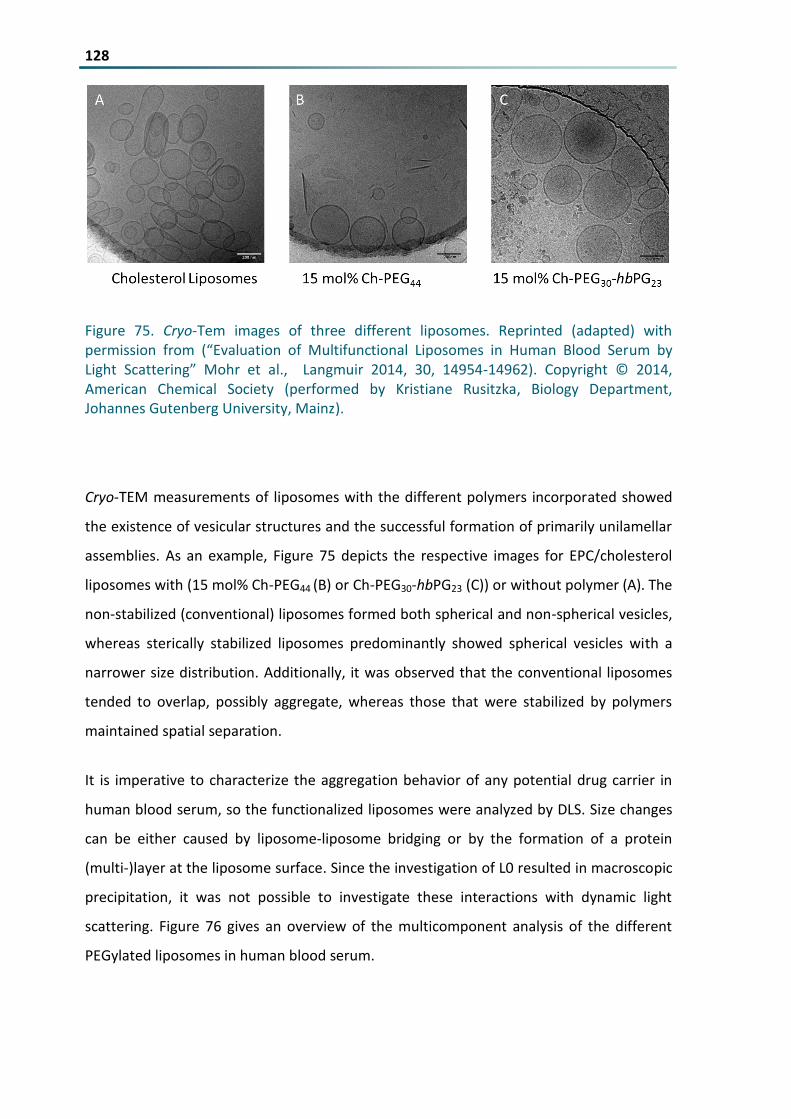
Figure 75 Cryo-Tem images of three different liposomes Reprinted (adapted) with permission from
(ldquoEvaluation of Multifunctional Liposomes in Human Blood Serum by Light Scatteringrdquo Mohr et al
Langmuir 2014 30 14954-14962) Copyright copy 2014 American Chemical Society (performed by
Kristiane Rusitzka Biology Department Johannes Gutenberg University Mainz) 128
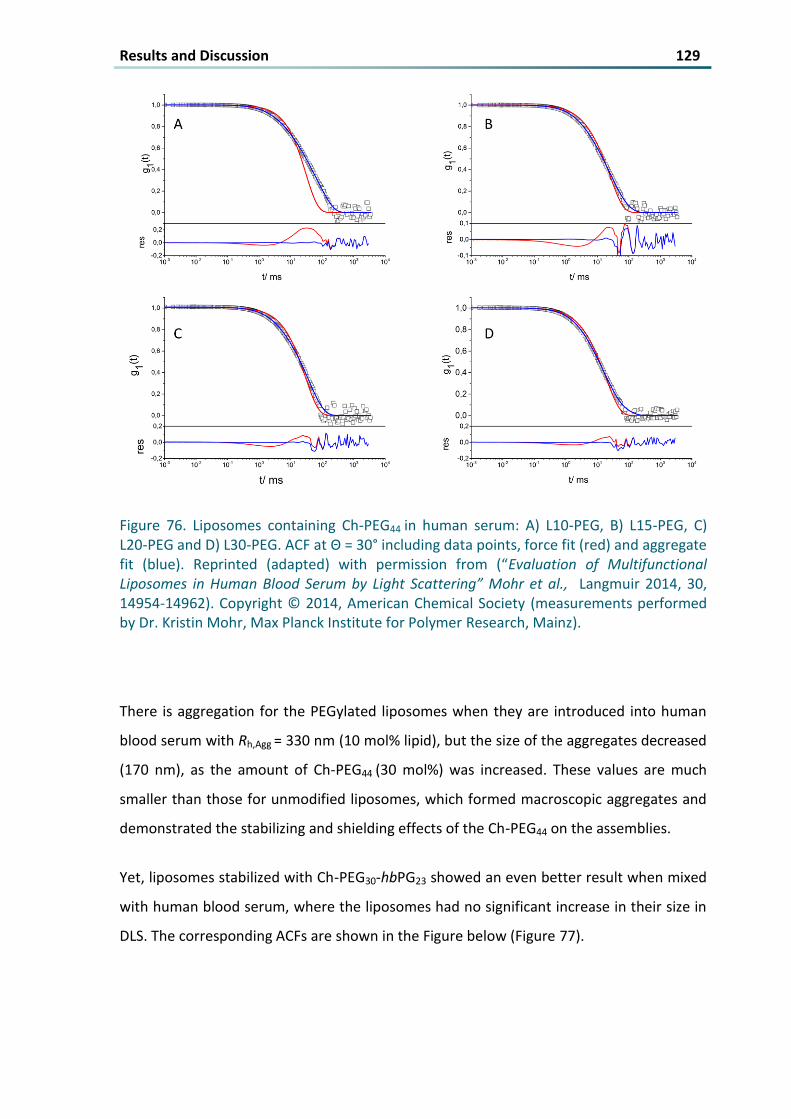
Figure 76 Liposomes containing Ch-PEG44 in human serum A) L10-PEG B) L15-PEG C) L20-PEG and D) L30-
PEG ACF at Θ = 30deg including data points force fit (red) and aggregate fit (blue) Reprinted (adapted)
with permission from (ldquoEvaluation of Multifunctional Liposomes in Human Blood Serum by Light
Scatteringrdquo Mohr et al Langmuir 2014 30 14954-14962) Copyright copy 2014 American Chemical
Society (measurements performed by Dr Kristin Mohr Max Planck Institute for Polymer Research
Mainz) 129
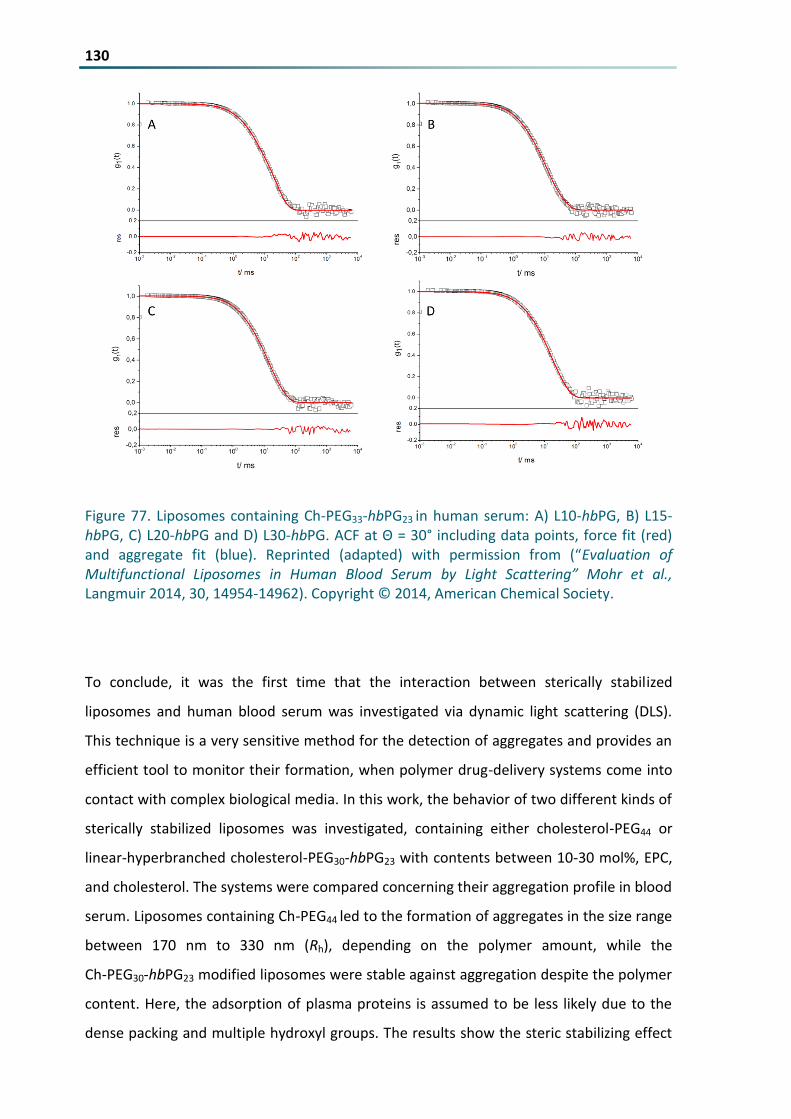
Figure 77 Liposomes containing Ch-PEG33-hbPG23 in human serum A) L10-hbPG B) L15-hbPG C) L20-hbPG
and D) L30-hbPG ACF at Θ = 30deg including data points force fit (red) and aggregate fit (blue)
Reprinted (adapted) with permission from (ldquoEvaluation of Multifunctional Liposomes in Human Blood
Serum by Light Scatteringrdquo Mohr et al Langmuir 2014 30 14954-14962) Copyright copy 2014
American Chemical Society 130
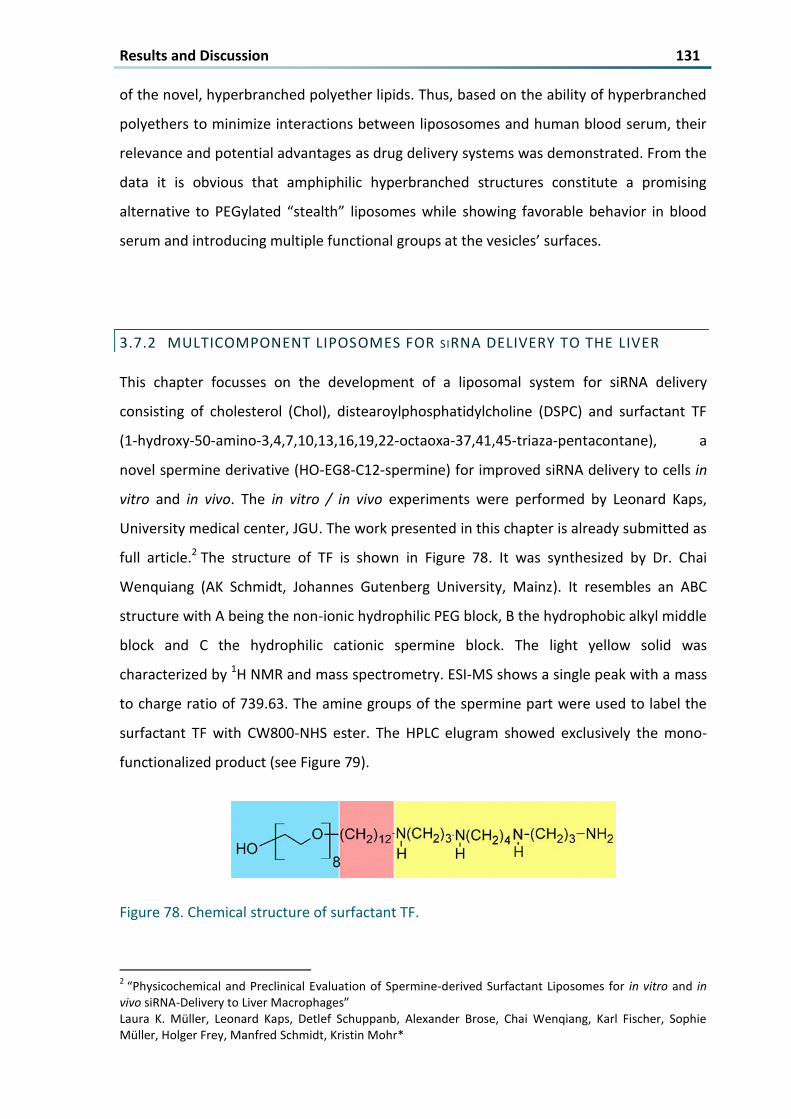
Figure 78 Chemical structure of surfactant TF 131
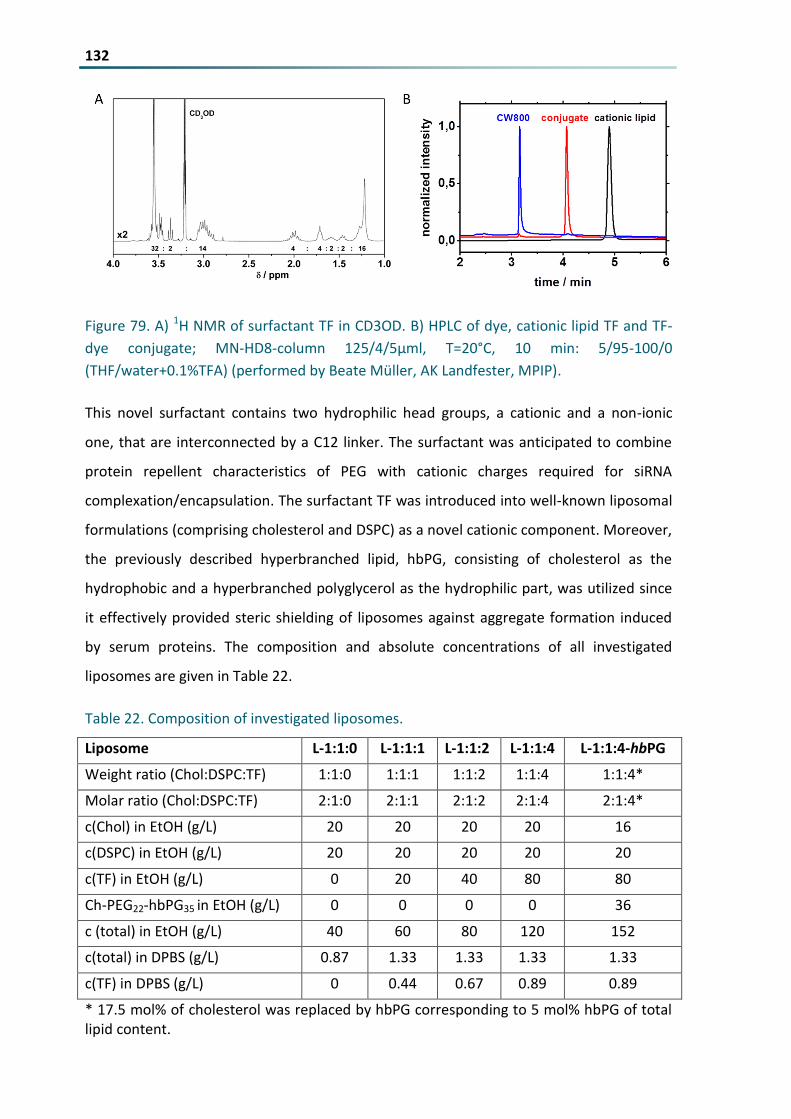
Figure 79 A) 1H NMR of surfactant TF in CD3OD B) HPLC of dye cationic lipid TF and TF-dye conjugate MN-
HD8-column 12545microml T=20degC 10 min 595-1000 (THFwater+01TFA) (performed by Beate
Muumlller AK Landfester MPIP) 132
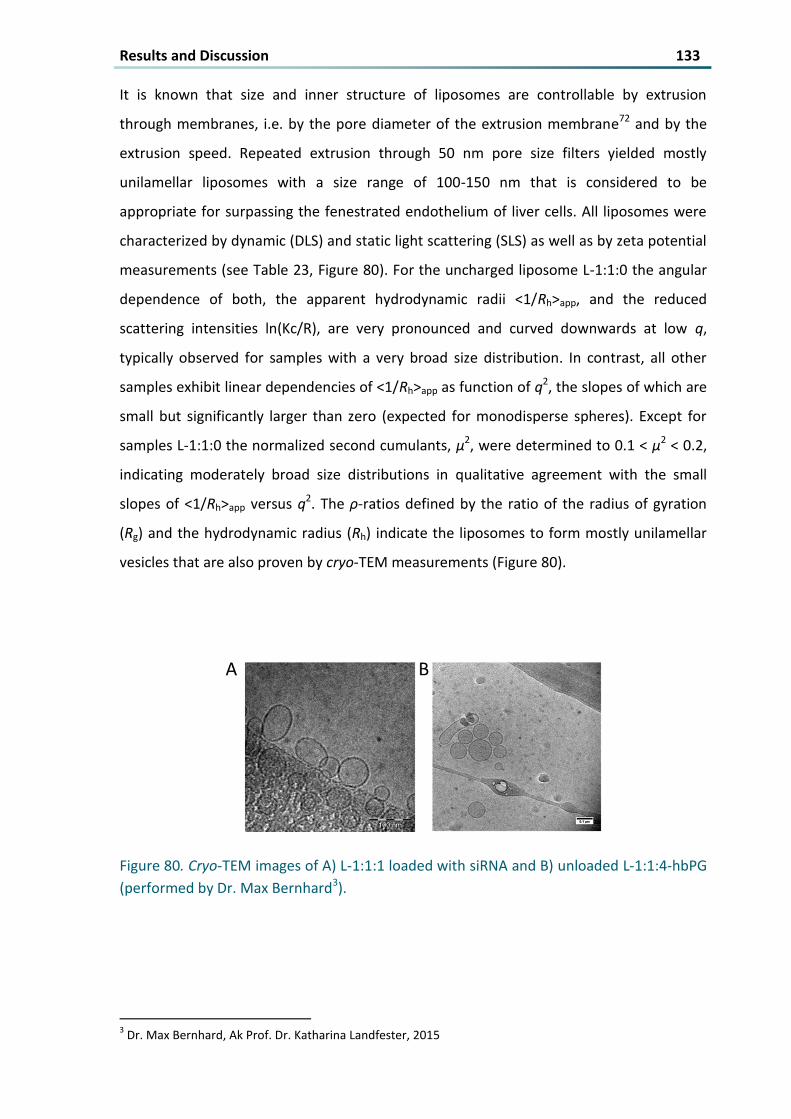
Figure 80 Cryo-TEM images of A) L-111 loaded with siRNA and B) unloaded L-114-hbPG (performed by Dr
Max Bernhard) 133
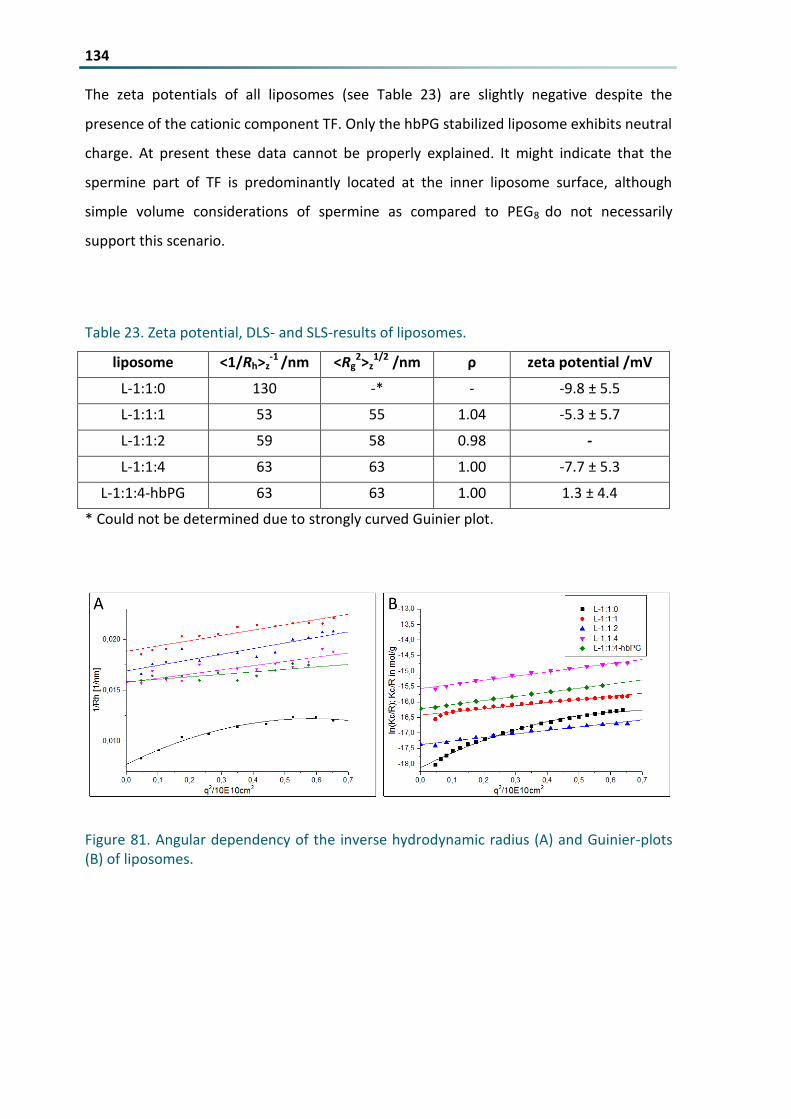
Figure 81 Angular dependency of the inverse hydrodynamic radius (A) and Guinier-plots (B) of liposomes
134
Contents IX Figure 82 Autocorrelation functions of the different liposomal systems in human serum at 30deg and the
respective aggregate size with its impact on the scattering intensity Red lines Force fit with the pure
component correlation blue lines Fit with an additional aggregate term Residues of the respective
fits are shown in the lower part of the graphs 136
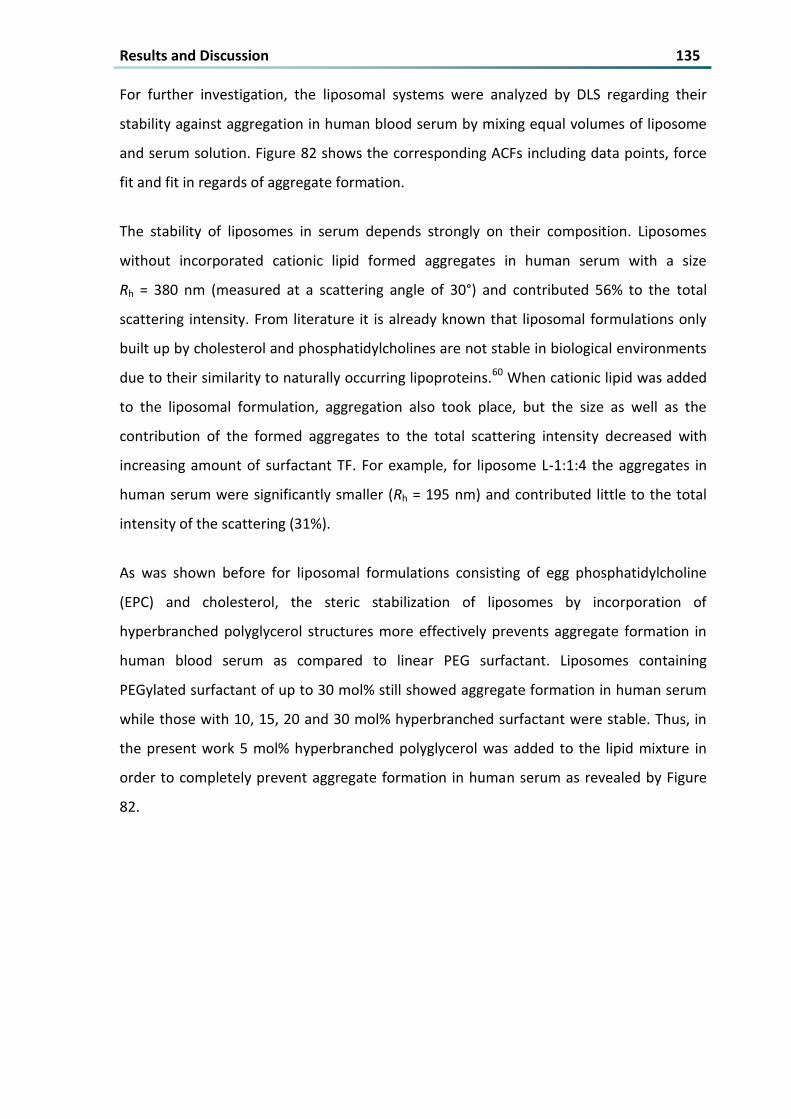
Figure 83 A) Angular dependency of the inverse hydrodynamic radius of siRNA loaded liposomes B)
Guinier-plots of siRNA-loaded liposomes 137
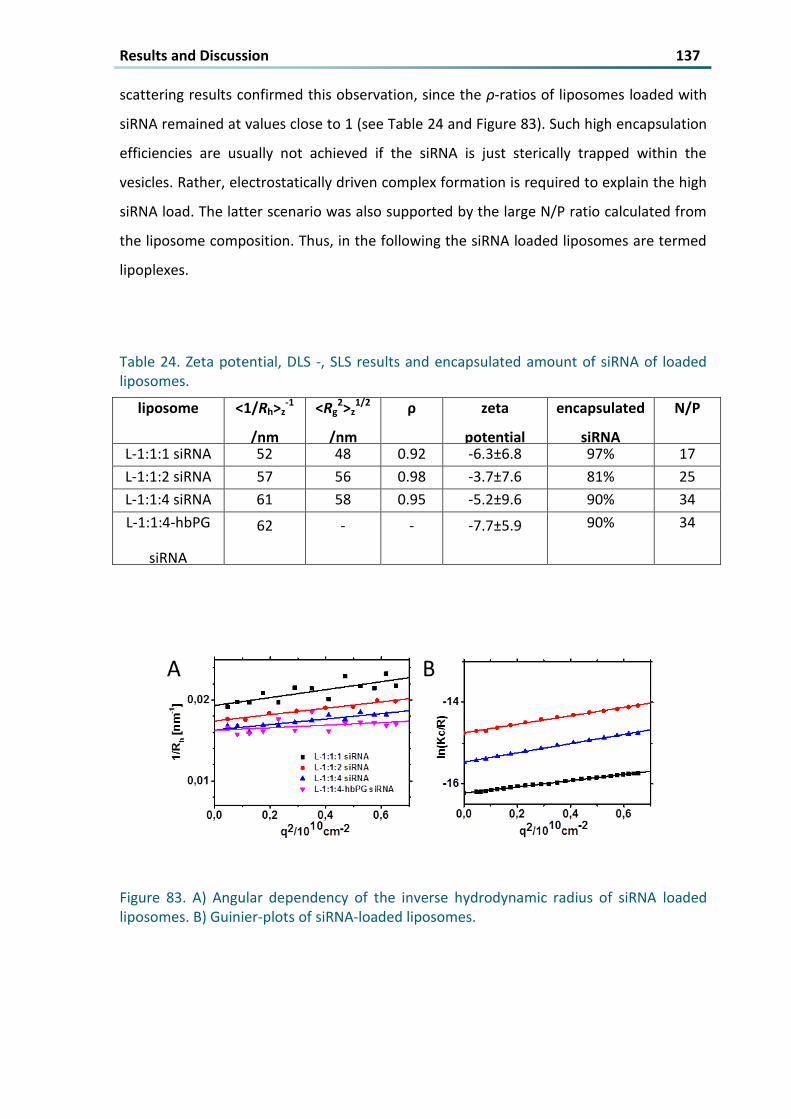
Figure 84 Zeta potential of L-111 in comparison to the zeta potential of L-111 loaded with different types
of siRNA 138
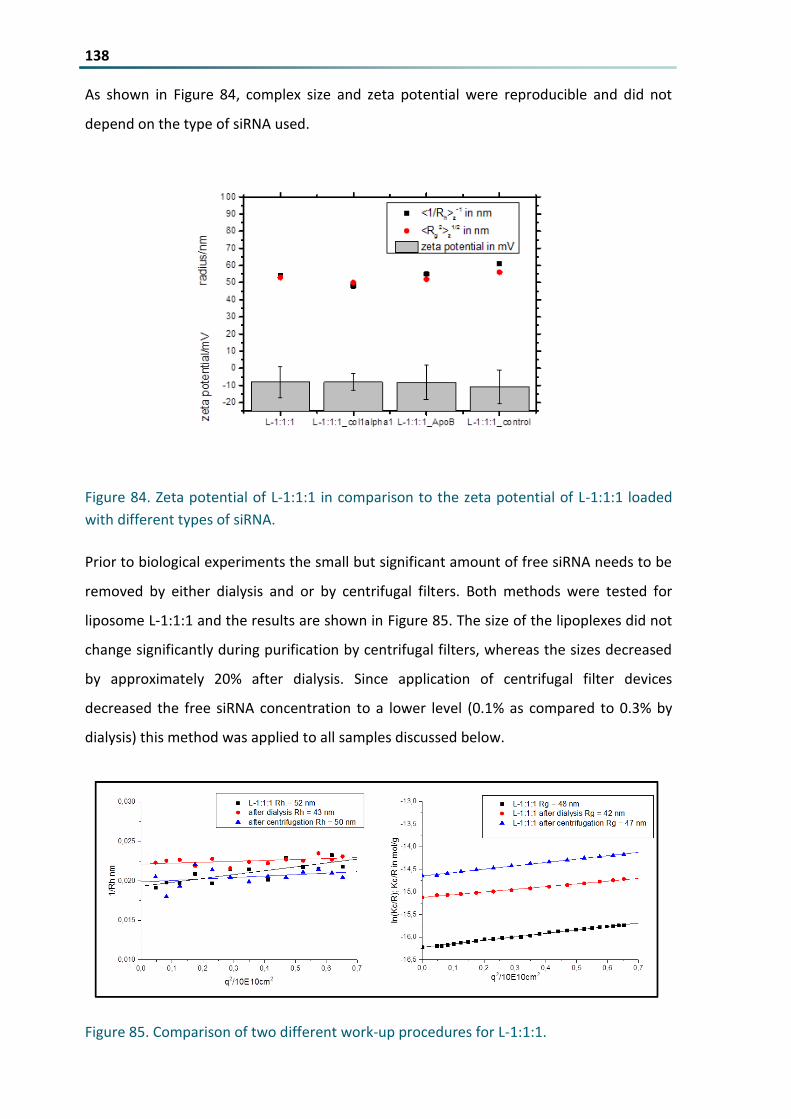
Figure 85 Comparison of two different work-up procedures for L-111 138
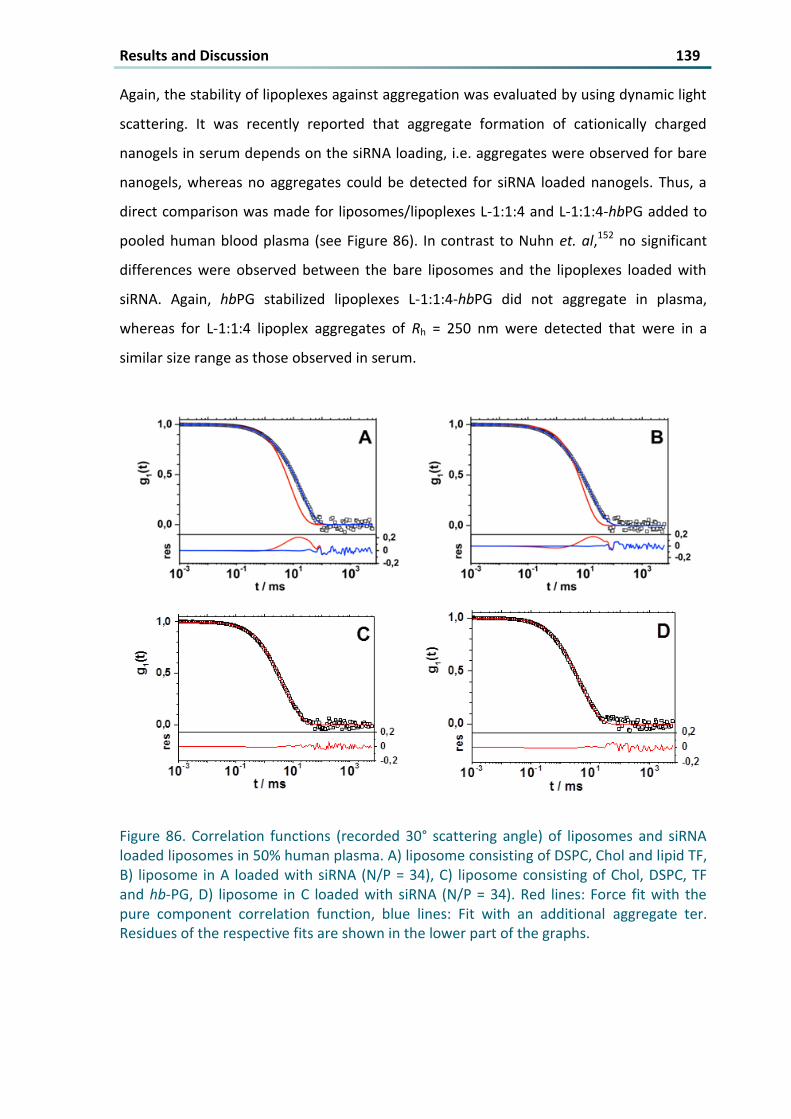
Figure 86 Correlation functions (recorded 30deg scattering angle) of liposomes and siRNA loaded liposomes in
50 human plasma A) liposome consisting of DSPC Chol and lipid TF B) liposome in A loaded with
siRNA (NP = 34) C) liposome consisting of Chol DSPC TF and hb-PG D) liposome in C loaded with
siRNA (NP = 34) Red lines Force fit with the pure component correlation function blue lines Fit with
an additional aggregate ter Residues of the respective fits are shown in the lower part of the graphs
139
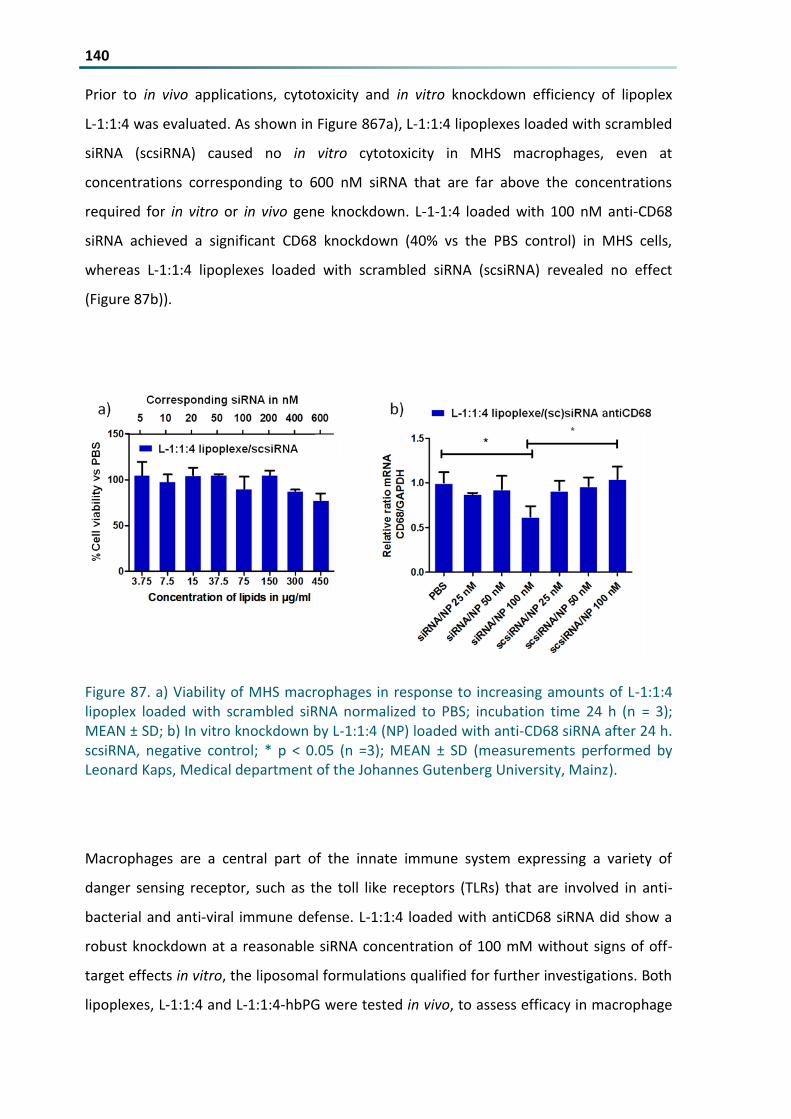
Figure 87 a) Viability of MHS macrophages in response to increasing amounts of L-114 lipoplex loaded with
scrambled siRNA normalized to PBS incubation time 24 h (n = 3) MEAN plusmn SD b) In vitro knockdown
by L-114 (NP) loaded with anti-CD68 siRNA after 24 h scsiRNA negative control p lt 005 (n =3)
MEAN plusmn SD (measurements performed by Leonard Kaps Medical department of the Johannes
Gutenberg University Mainz) 140
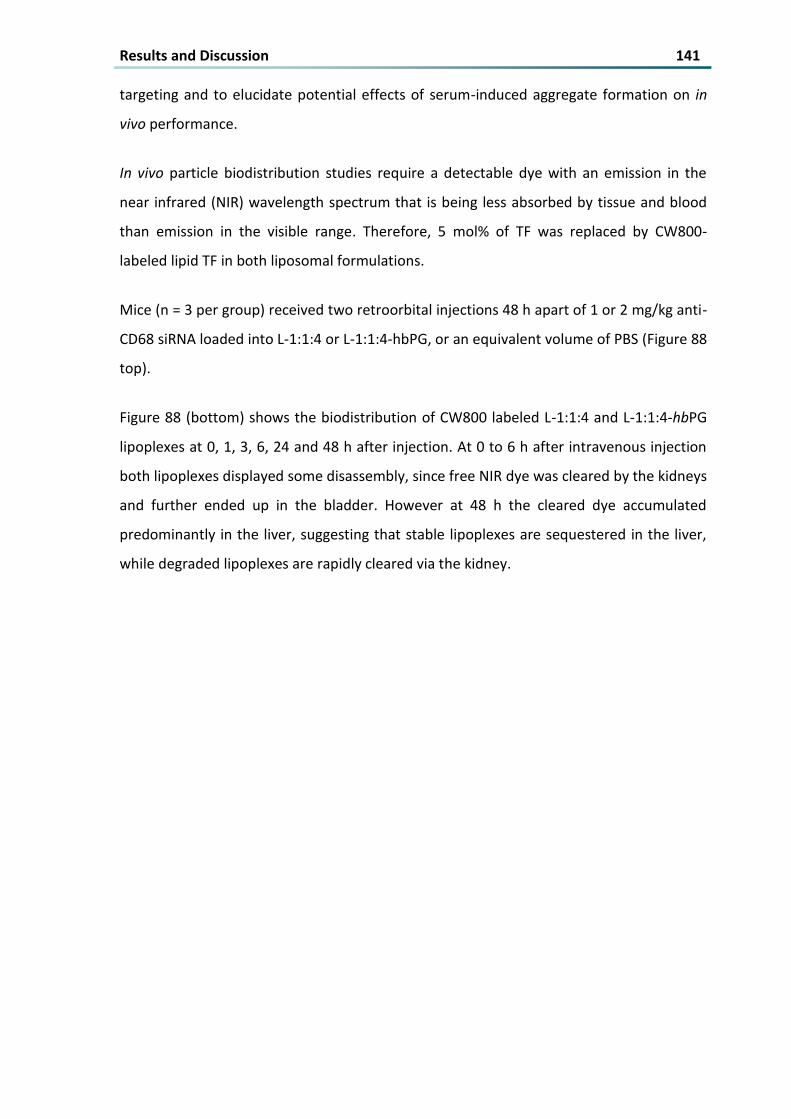
Figure 88 Top) In vivo knockdown outline Mice received two retroorbital injections of 1 or 2 anti-CD68
siRNA encapsulated in L-114 or L-114-hbPG in vivo imaging period indicated above timeline
Bottom) In vivo images system (IVIS) pictures of mice injected with 1 mgkg or 2 mgkg antiCD68
siRNA loaded in L-114 lipoplexes (left) or L-1-14-hbPG hbPG stabilized lipoplexe (right) labeled with
CW800 near infrared dye at 0 1 3 24 and 48h (measurements performed by Leonard Kaps) 142
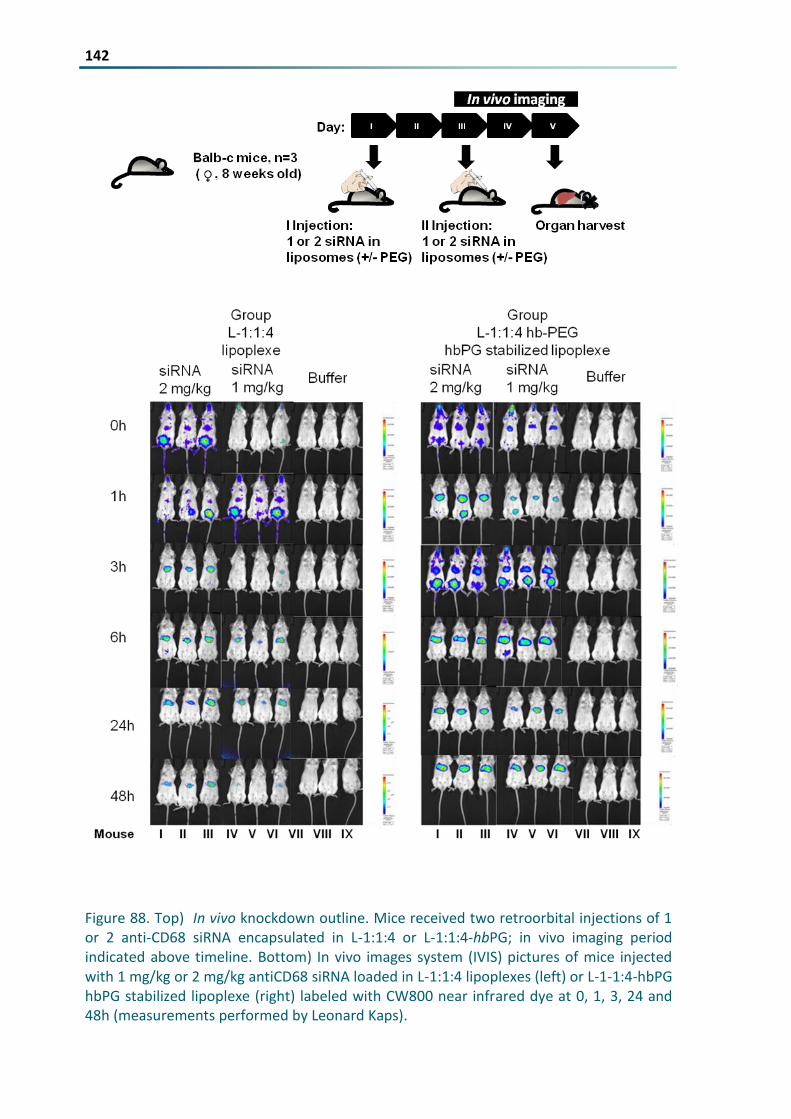
Figure 89 Ex vivo organ quantification of L-114 lipolplex (blue) and L-1-14-hbPG (red) labeled with near
infrared dye 48 h after the second injection p lt 0001 MEAN plusmn SD (measurements performed by
Leonard Kaps) 143
Figure 90 IVIS pictures of ex vivo organs from mice that were injected with 1 mgkg or 2 mgkg antiCD68
siRNA loaded in L-114 or L-1-14-hbPG respectively labeled with near infrared dye 48h after injection
(measurements performed by Leonard Kaps) 144
Figure 91 In vivo liver resident macrophage uptake of L-114 lipoplex (blue) and L-1-14-hbPG lipoplex (red)
labeled with NIR dye 48 h after the second injection MEAN plusmn SD (measurements performed by
Leonard Kaps) 145
Figure 92 In vivo knockdown of the macrophage specific gene CD68 in the liver of mice that were injected
twice with 1 mgkg or 2 mgkg anti-CD68 siRNA loaded into L-114 (blue) or L-1-14-hbPG lipoplexe
(red) plt001 for anti-CD68 siRNA vs negative controls MEAN plusmn SD (measurements performed by
Leonard Kaps) 145
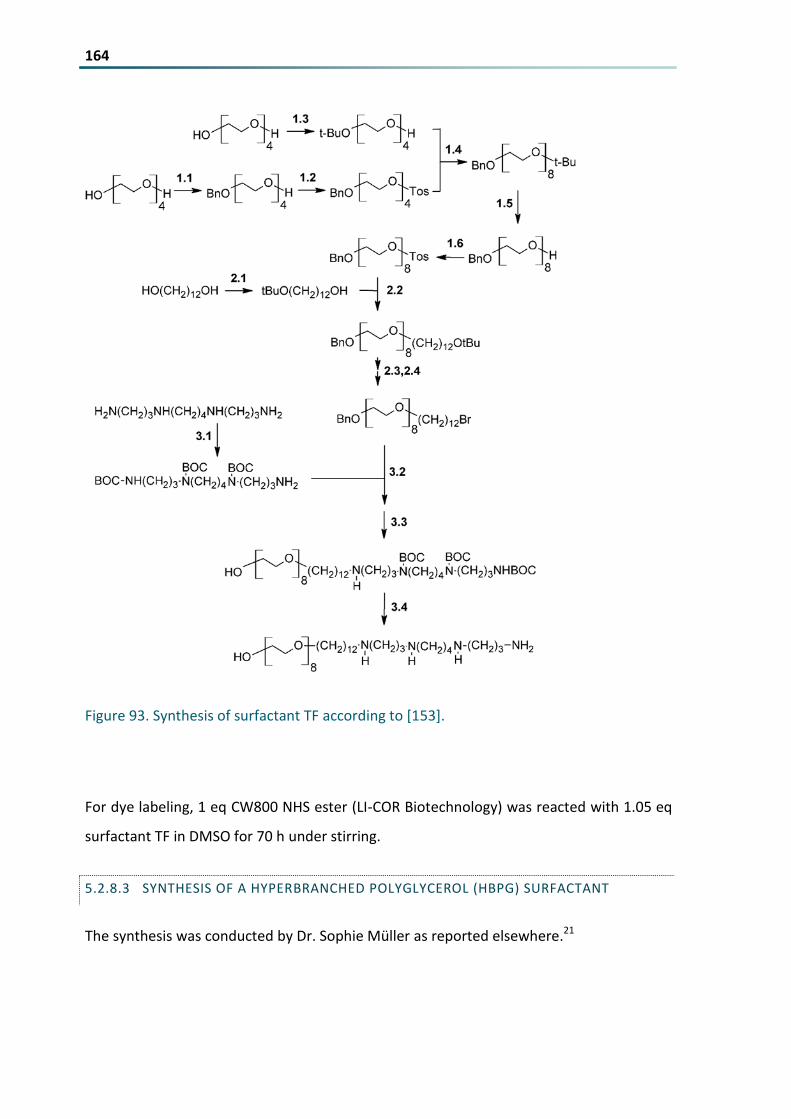
Figure 93 Synthesis of surfactant TF according to [153] 164
X LIST OF TABLES
Table 1 ρ-ratios and their corresponding geometry for macromolecules113
19
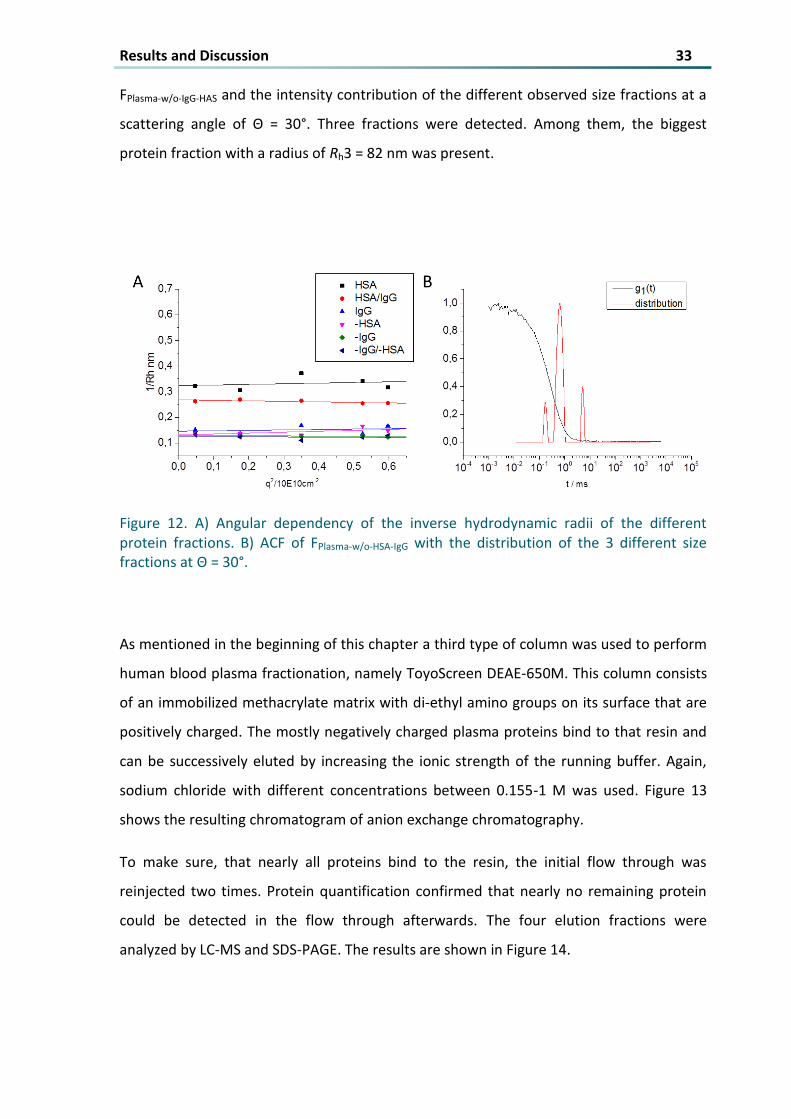
Table 2 Obtained protein fractions (c = 1 gL) with their hydrodynamic radius and composition according to
LC-MS 32
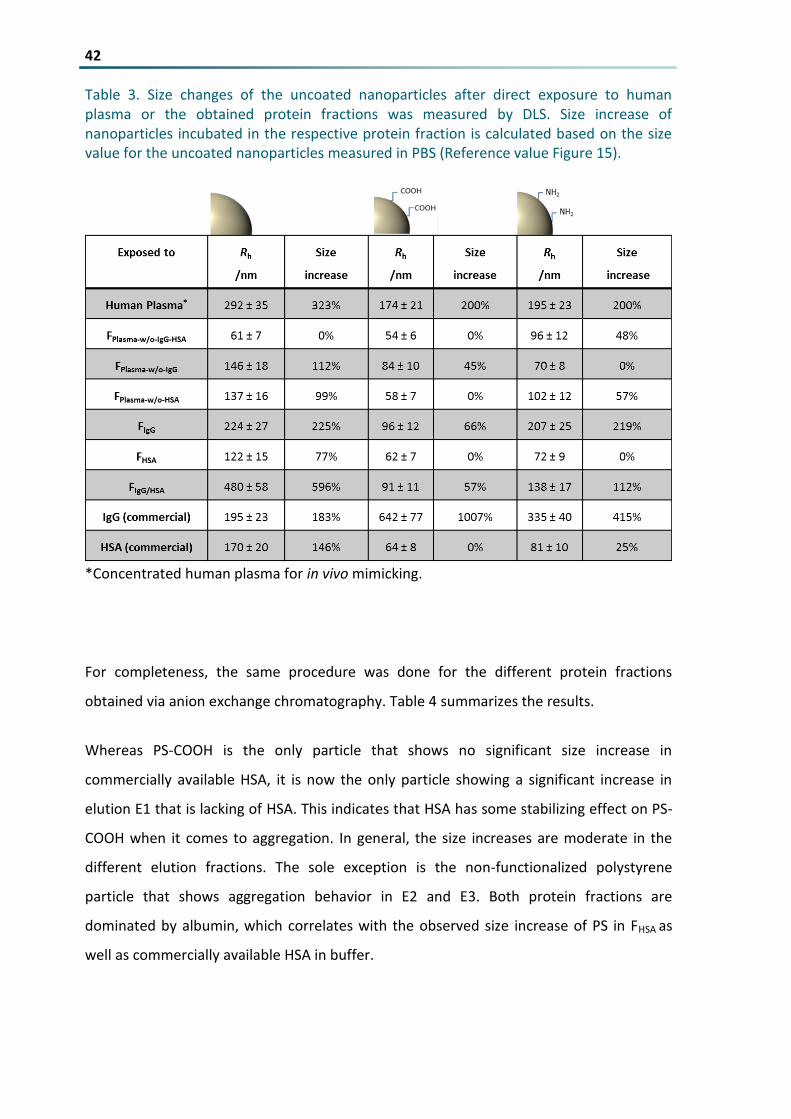
Table 3 Size changes of the uncoated nanoparticles after direct exposure to human plasma or the obtained
protein fractions was measured by DLS Size increase of nanoparticles incubated in the respective
protein fraction is calculated based on the size value for the uncoated nanoparticles measured in PBS
(Reference value Figure 15) 42
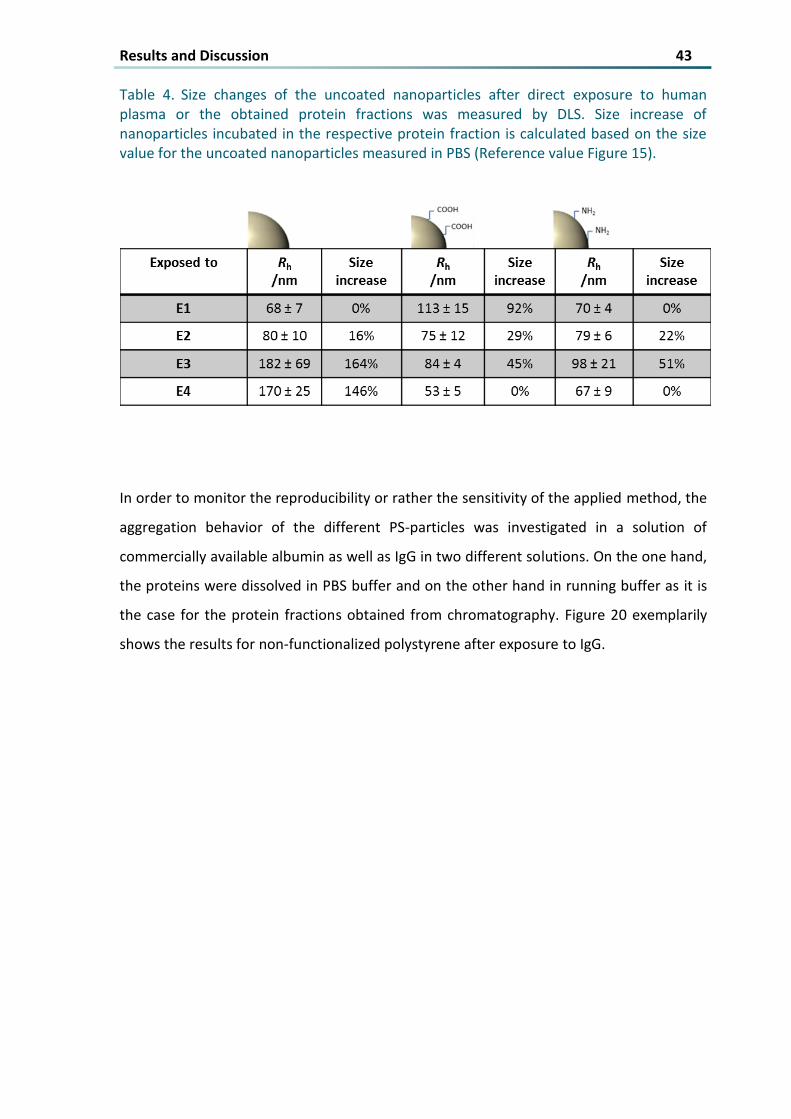
Table 4 Size changes of the uncoated nanoparticles after direct exposure to human plasma or the obtained
protein fractions was measured by DLS Size increase of nanoparticles incubated in the respective
protein fraction is calculated based on the size value for the uncoated nanoparticles measured in PBS
(Reference value Figure 15) 43
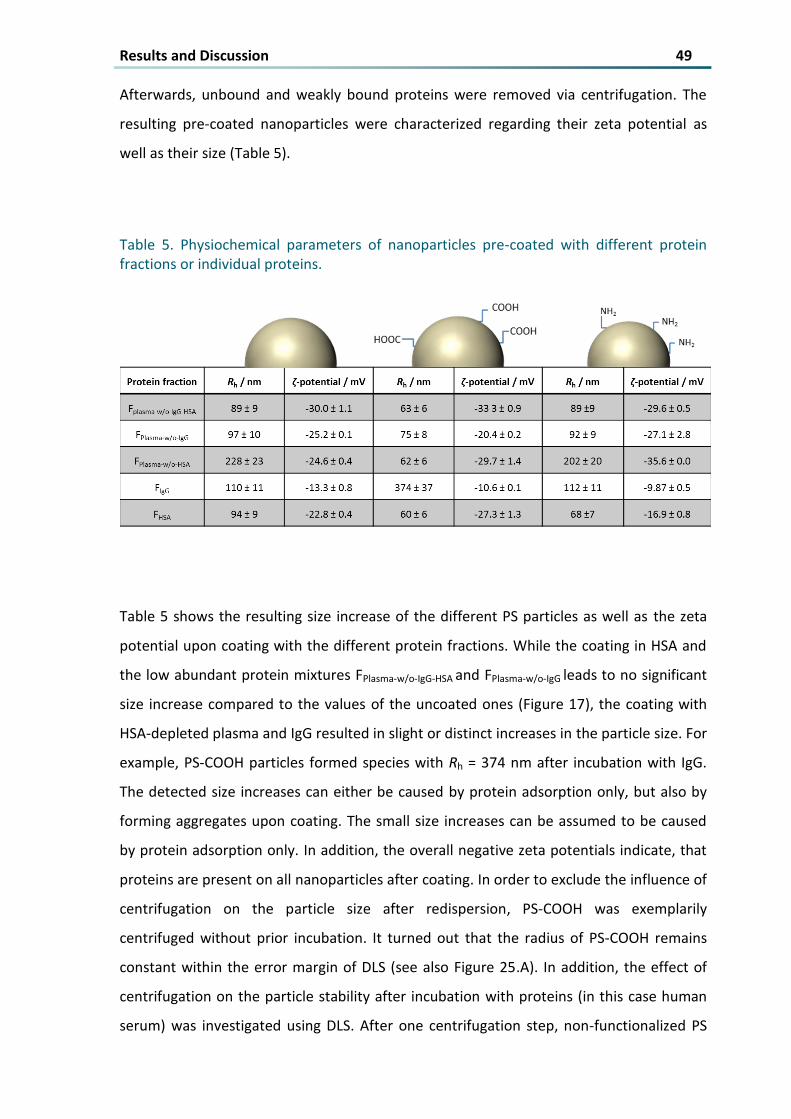
Table 5 Physiochemical parameters of nanoparticles pre-coated with different protein fractions or
individual proteins 49
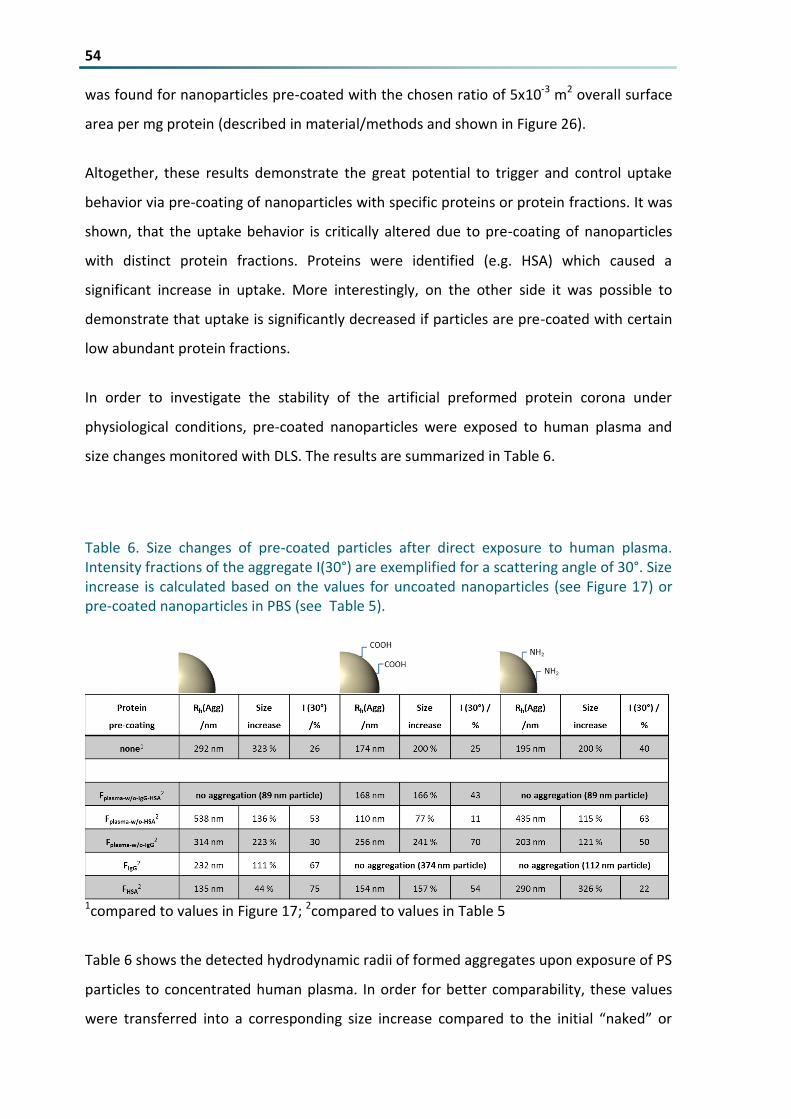
Table 6 Size changes of pre-coated particles after direct exposure to human plasma Intensity fractions of
the aggregate I(30deg) are exemplified for a scattering angle of 30deg Size increase is calculated based on
the values for uncoated nanoparticles (see Figure 17) or pre-coated nanoparticles in PBS (see Table 5)
54
Table 7 Physicochemical parameters of coated PS-COOH particles in FPlasma-wo-IgG 64
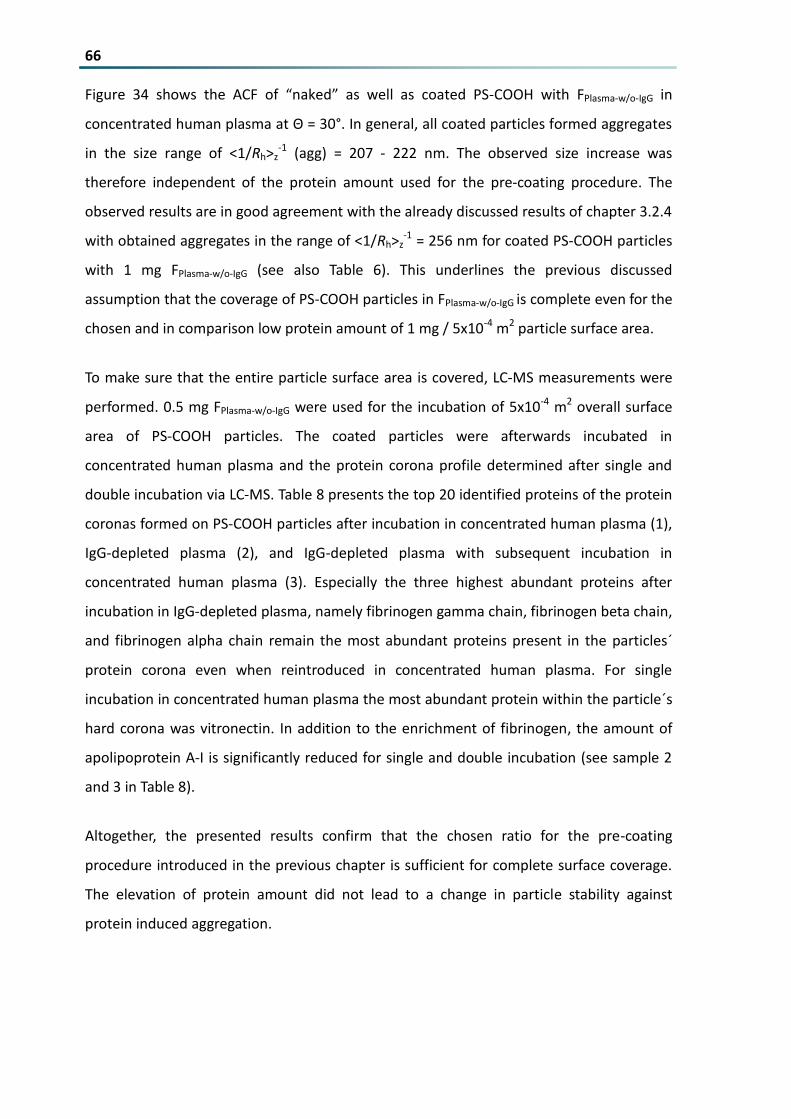
Table 8 Top 20 identified proteins in the protein corona formed on PS-COOH particles after incubation in
concentrated human plasma (1) IgG-depleted plasma (2) and IgG-depleted plasma with subsequent
incubation in concentrated human plasma (3) determined via LC-MS (LC-MS measurements were
performed by Johanna Simon) 67
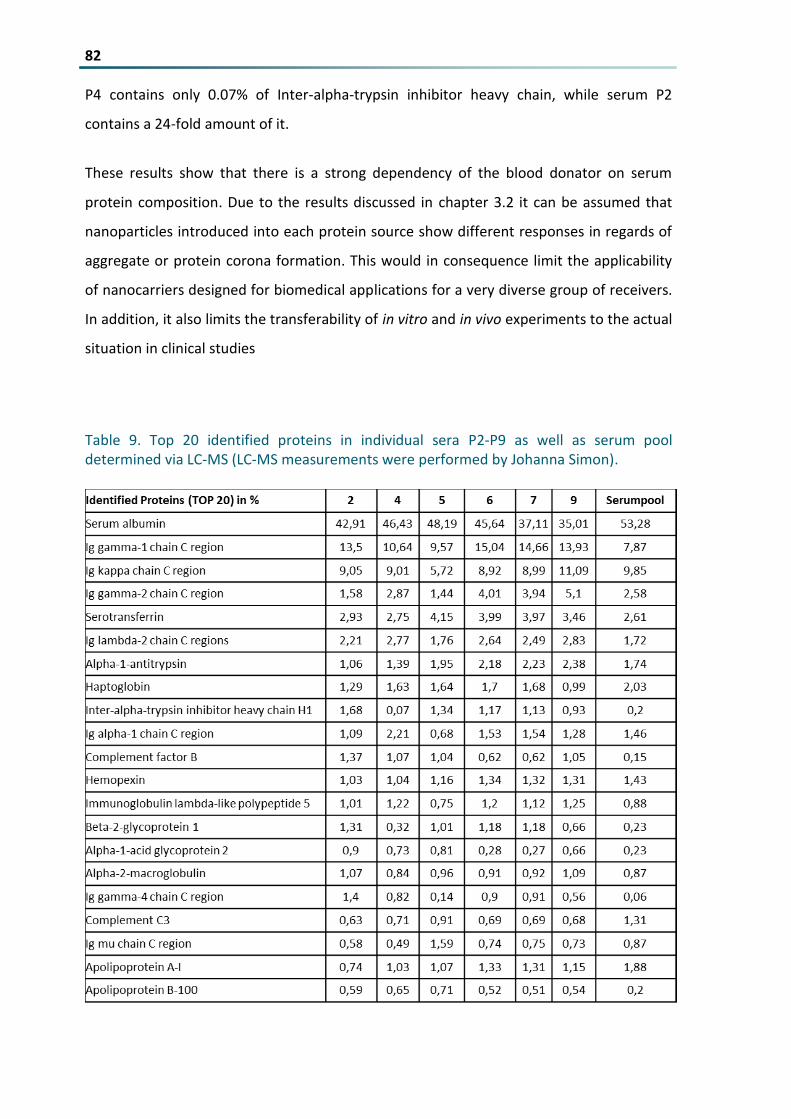
Table 9 Top 20 identified proteins in individual sera P2-P9 as well as serum pool determined via LC-MS (LC-
MS measurements were performed by Johanna Simon) 82
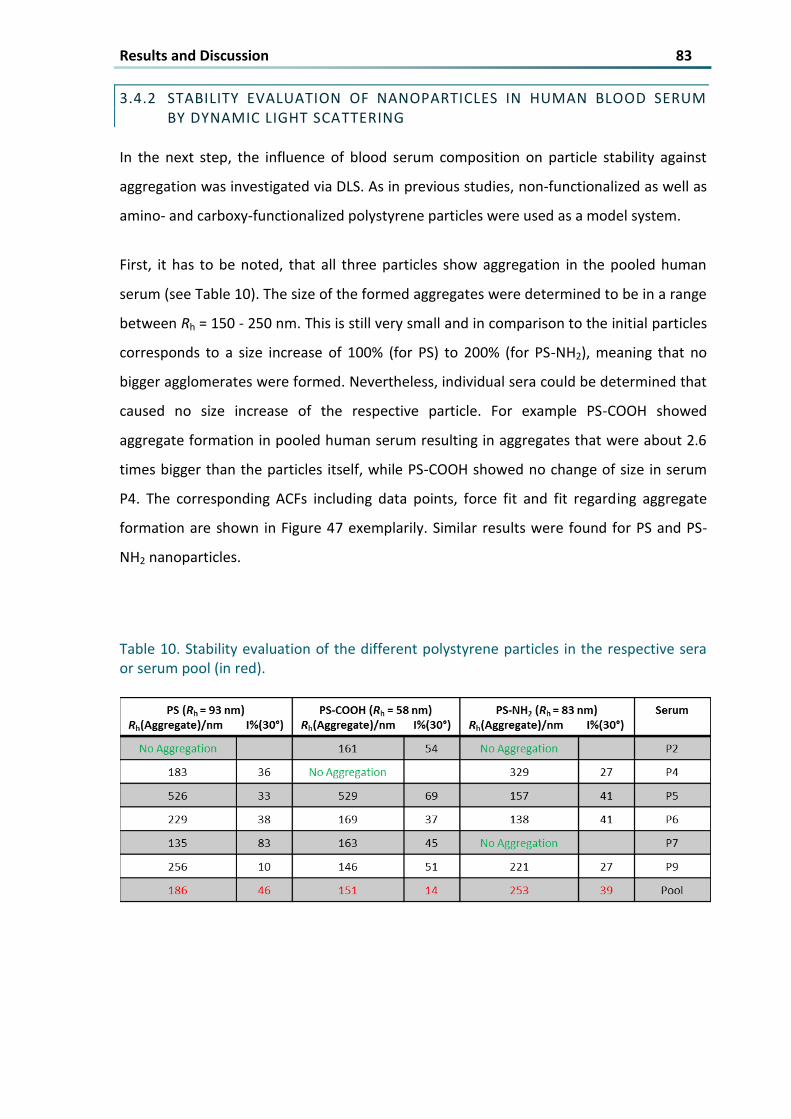
Table 10 Stability evaluation of the different polystyrene particles in the respective sera or serum pool (in
red) 83
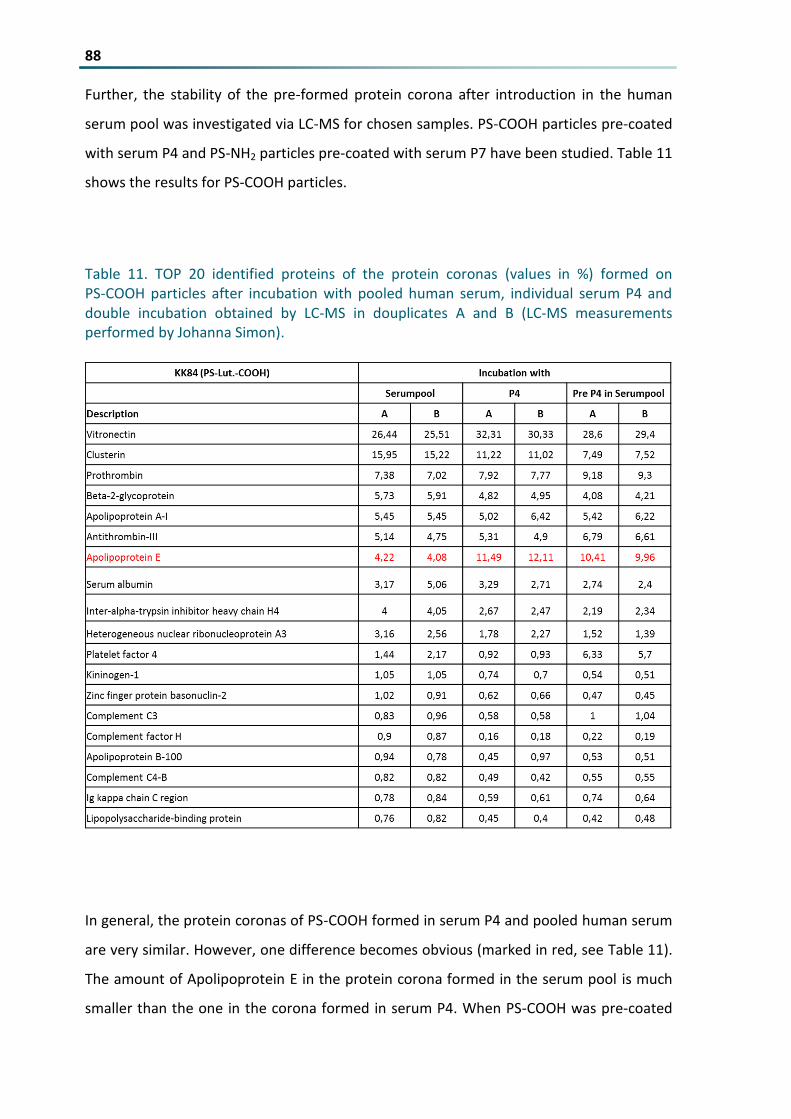
Table 11 TOP 20 identified proteins of the protein coronas (values in ) formed on PS-COOH particles
after incubation with pooled human serum individual serum P4 and double incubation obtained by
LC-MS in douplicates A and B (LC-MS measurements performed by Johanna Simon) 88
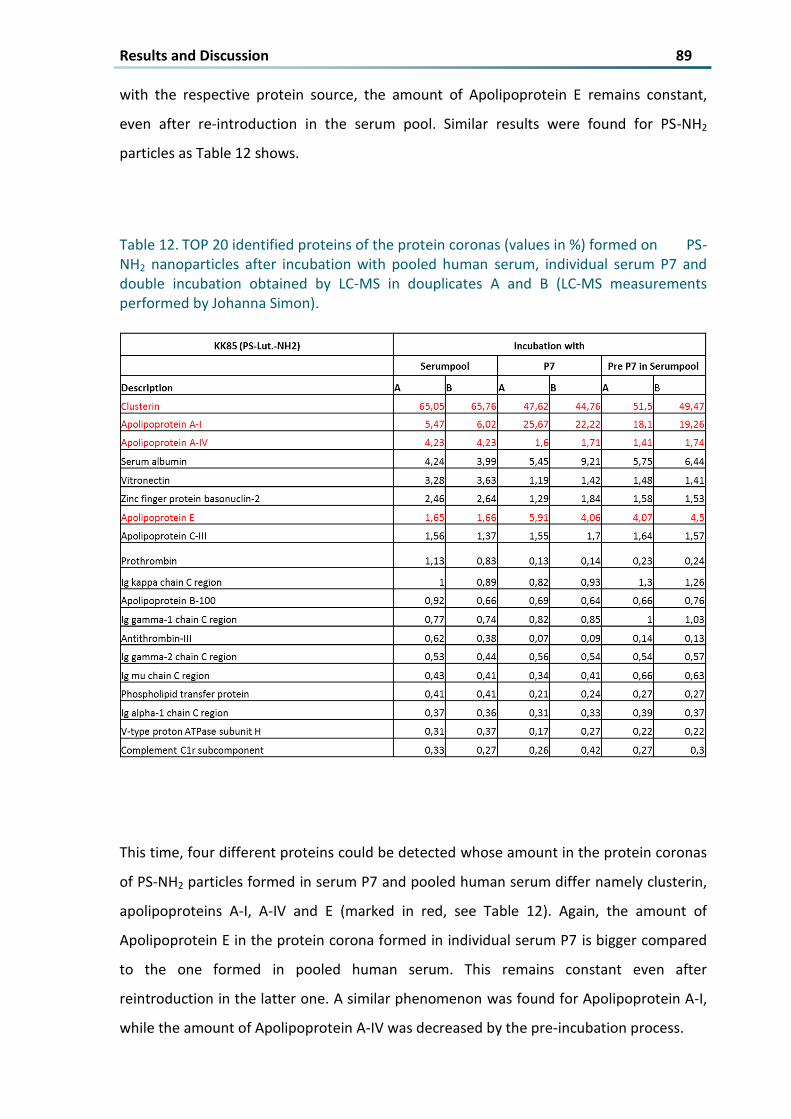
Table 12 TOP 20 identified proteins of the protein coronas (values in ) formed on PS-NH2 nanoparticles
after incubation with pooled human serum individual serum P7 and double incubation obtained by
LC-MS in douplicates A and B (LC-MS measurements performed by Johanna Simon) 89
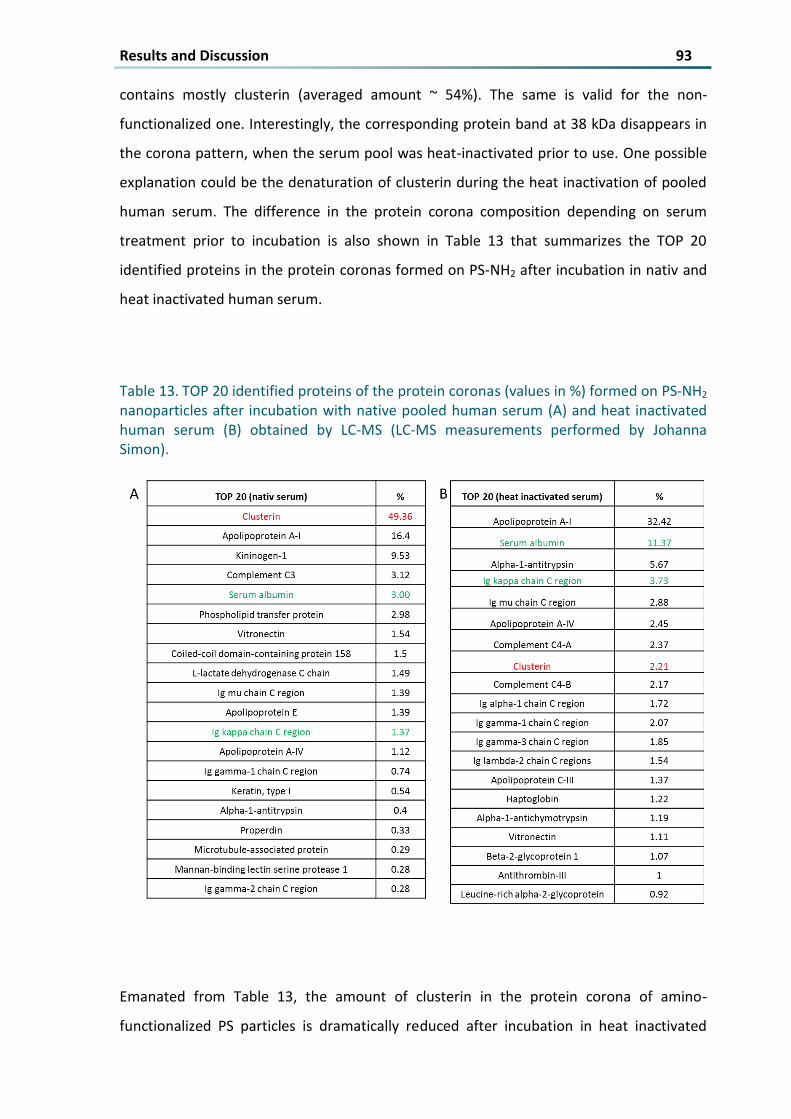
Table 13 TOP 20 identified proteins of the protein coronas (values in ) formed on PS-NH2 nanoparticles
after incubation with native pooled human serum (A) and heat inactivated human serum (B) obtained
by LC-MS (LC-MS measurements performed by Johanna Simon) 93
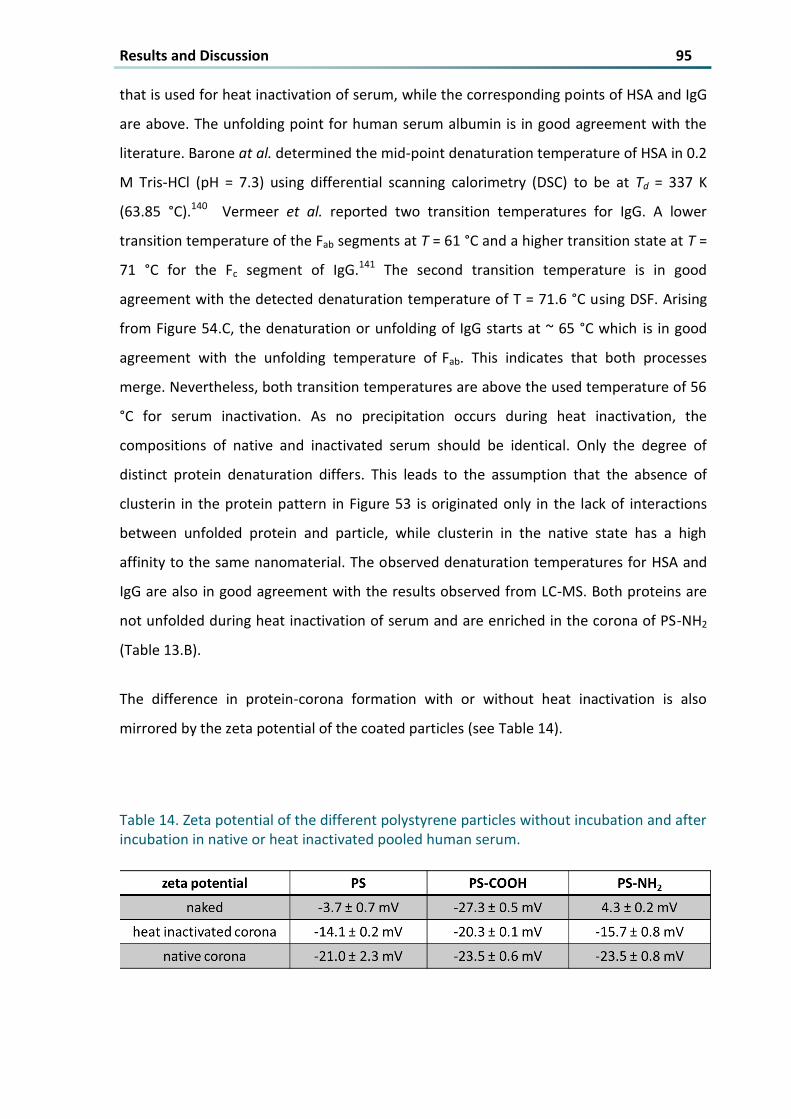
Table 14 Zeta potential of the different polystyrene particles without incubation and after incubation in
native or heat inactivated pooled human serum 95
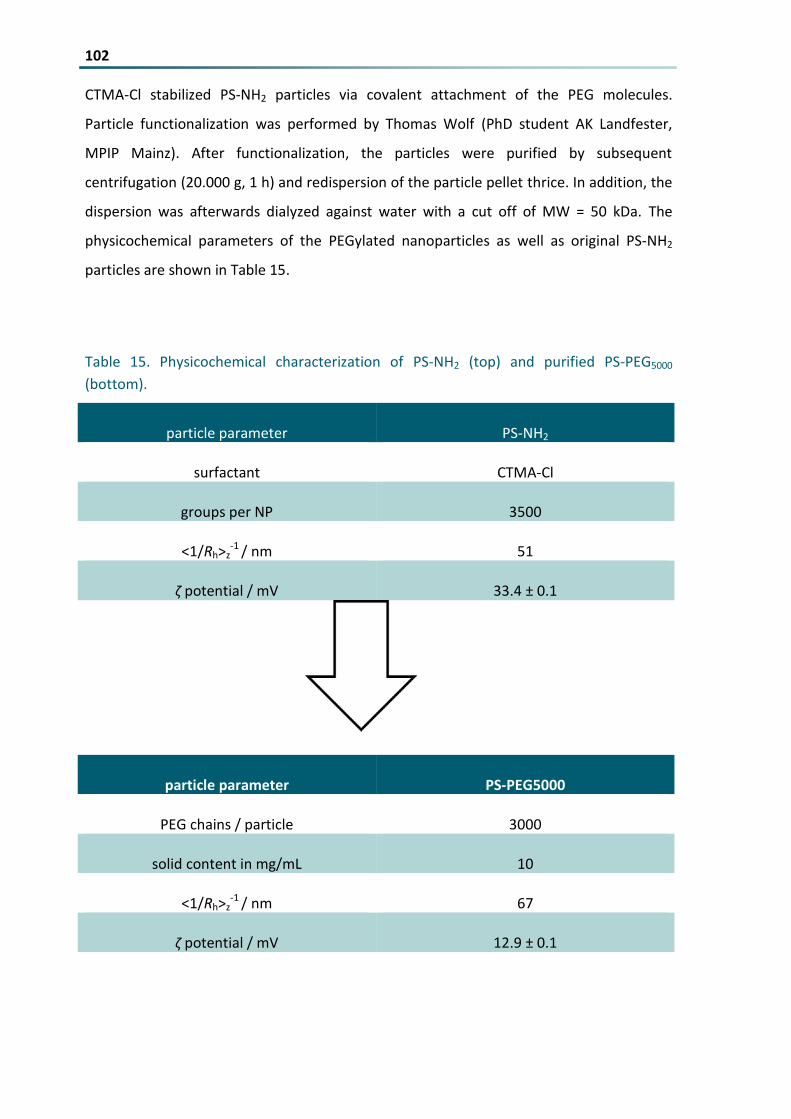
Table 15 Physicochemical characterization of PS-NH2 (top) and purified PS-PEG5000 (bottom) 102
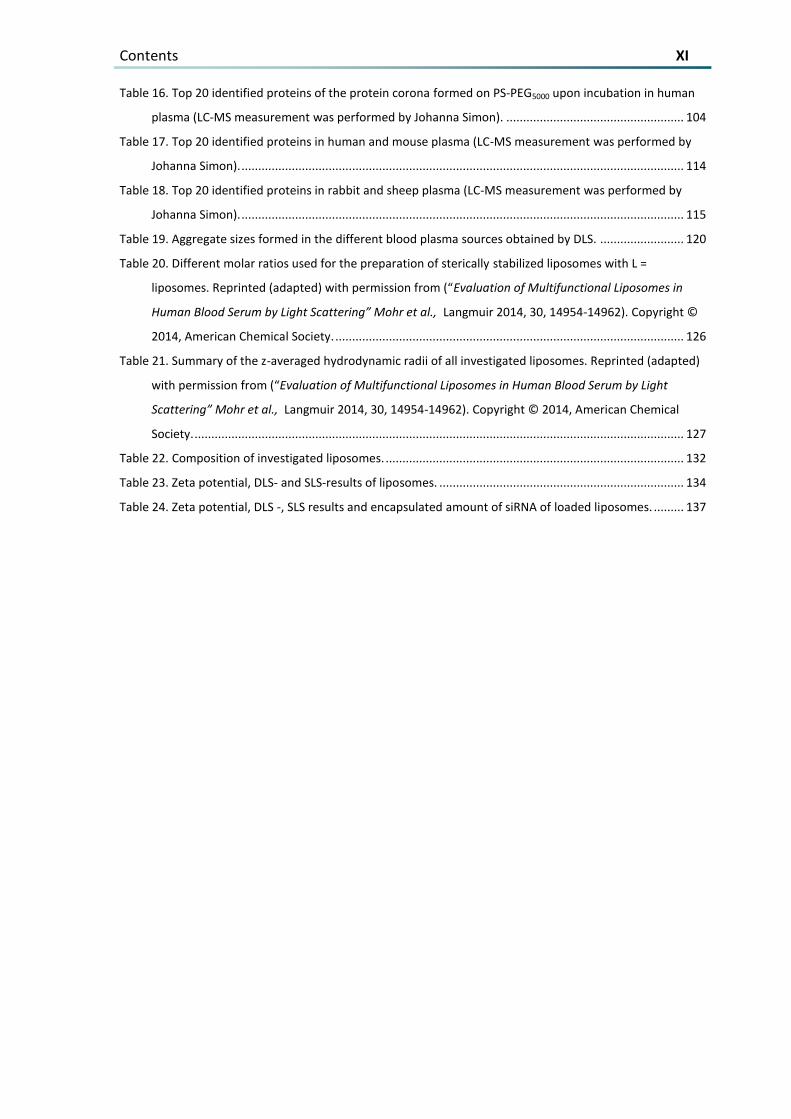
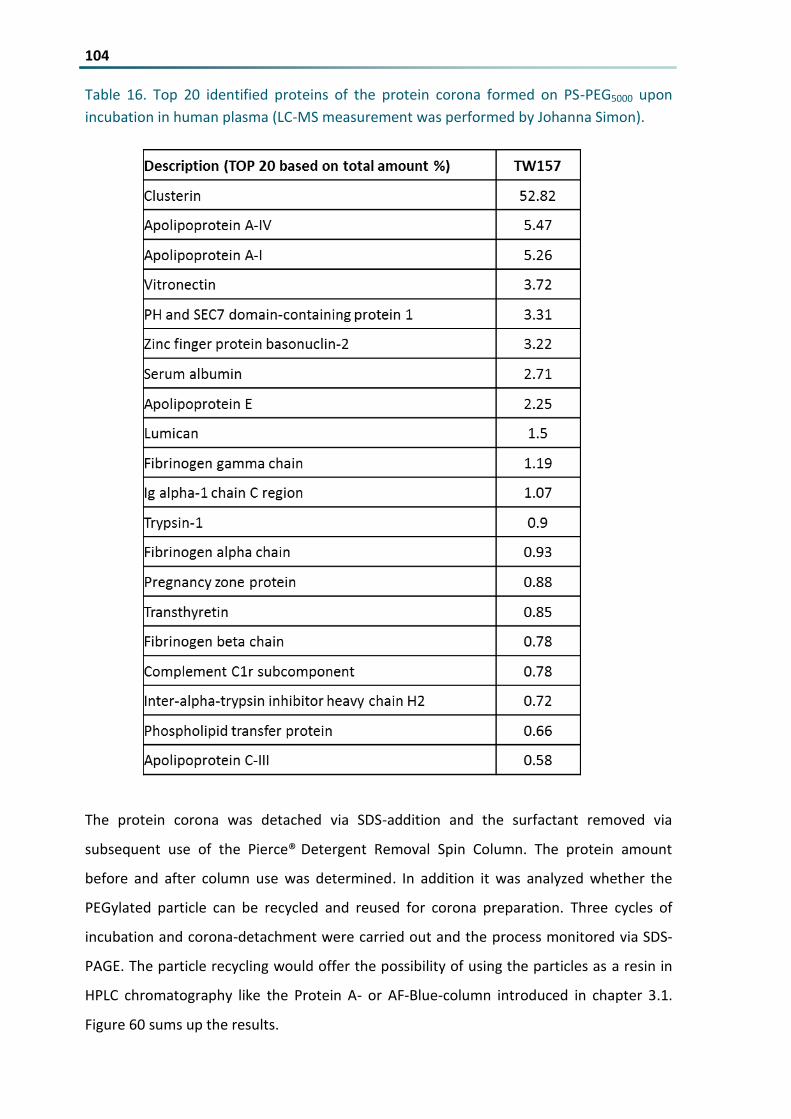
Contents XI Table 16 Top 20 identified proteins of the protein corona formed on PS-PEG5000 upon incubation in human
plasma (LC-MS measurement was performed by Johanna Simon) 104
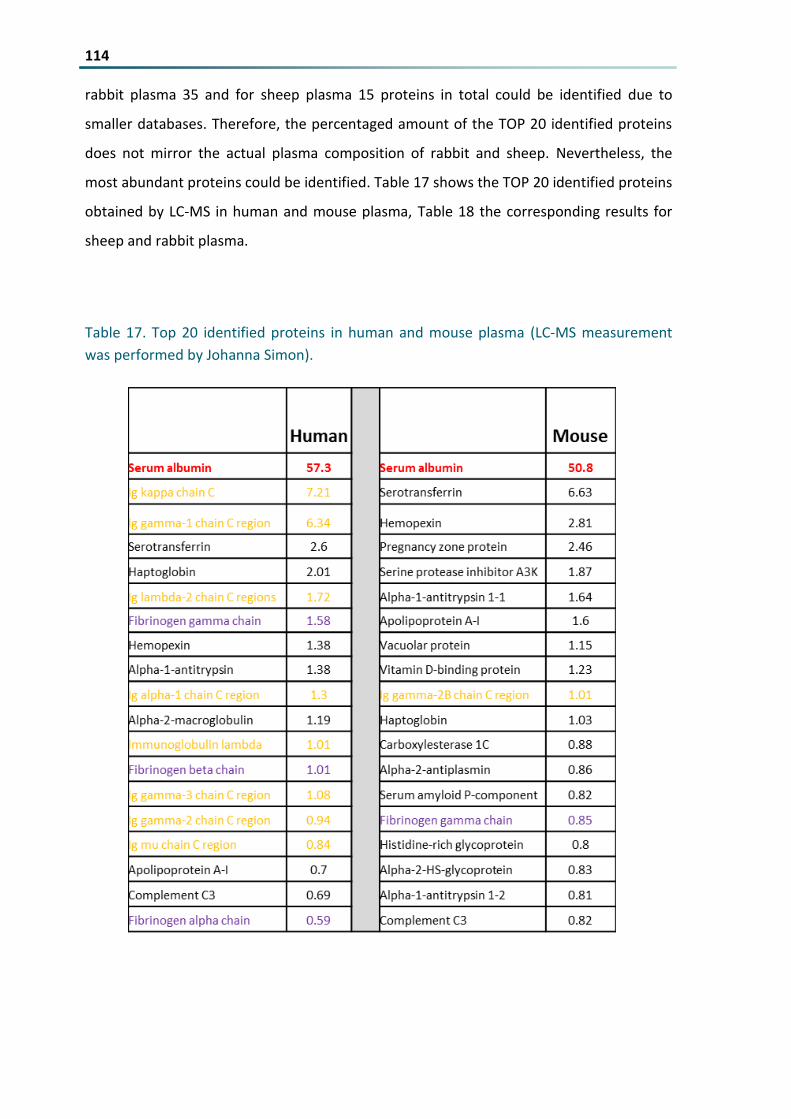
Table 17 Top 20 identified proteins in human and mouse plasma (LC-MS measurement was performed by
Johanna Simon) 114
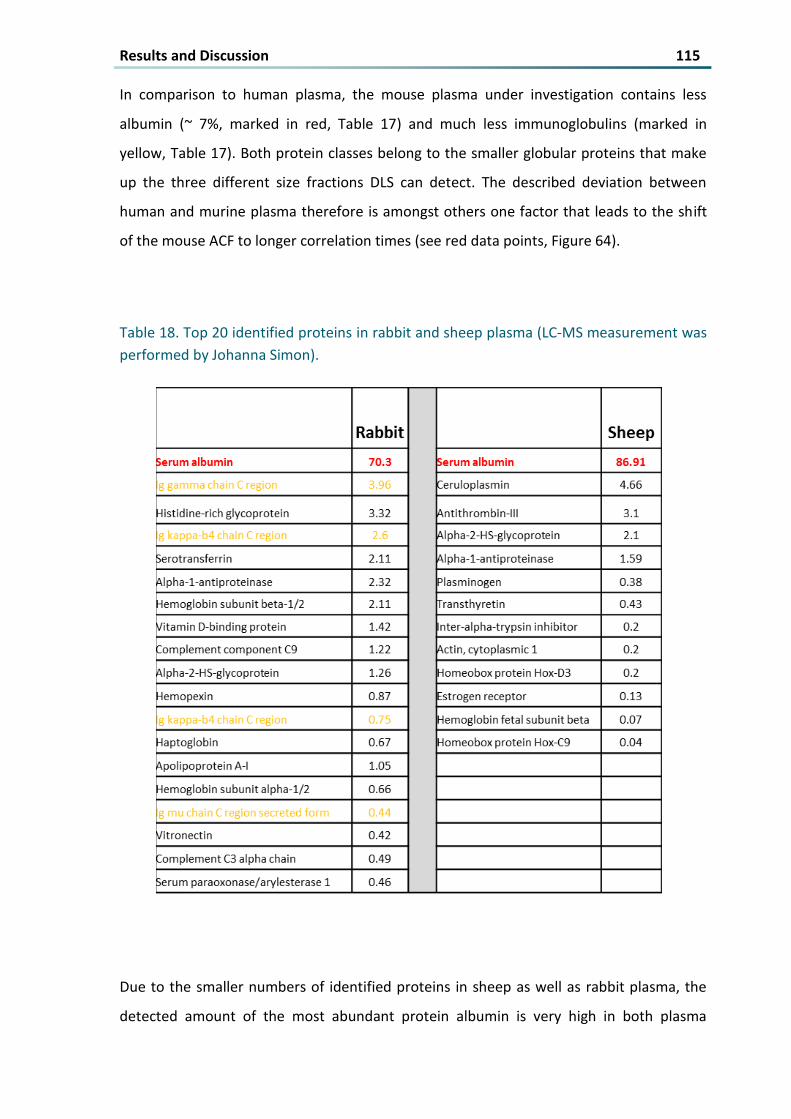
Table 18 Top 20 identified proteins in rabbit and sheep plasma (LC-MS measurement was performed by
Johanna Simon) 115
Table 19 Aggregate sizes formed in the different blood plasma sources obtained by DLS 120
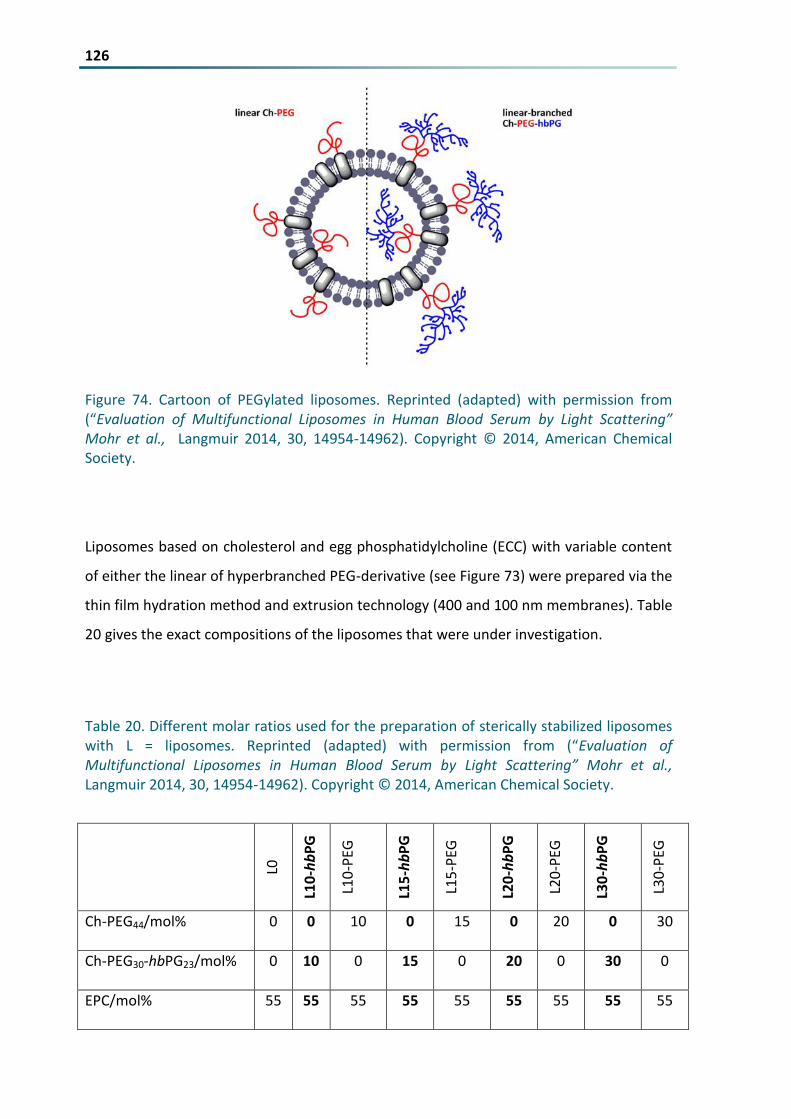
Table 20 Different molar ratios used for the preparation of sterically stabilized liposomes with L =
liposomes Reprinted (adapted) with permission from (ldquoEvaluation of Multifunctional Liposomes in
Human Blood Serum by Light Scatteringrdquo Mohr et al Langmuir 2014 30 14954-14962) Copyright copy
2014 American Chemical Society 126
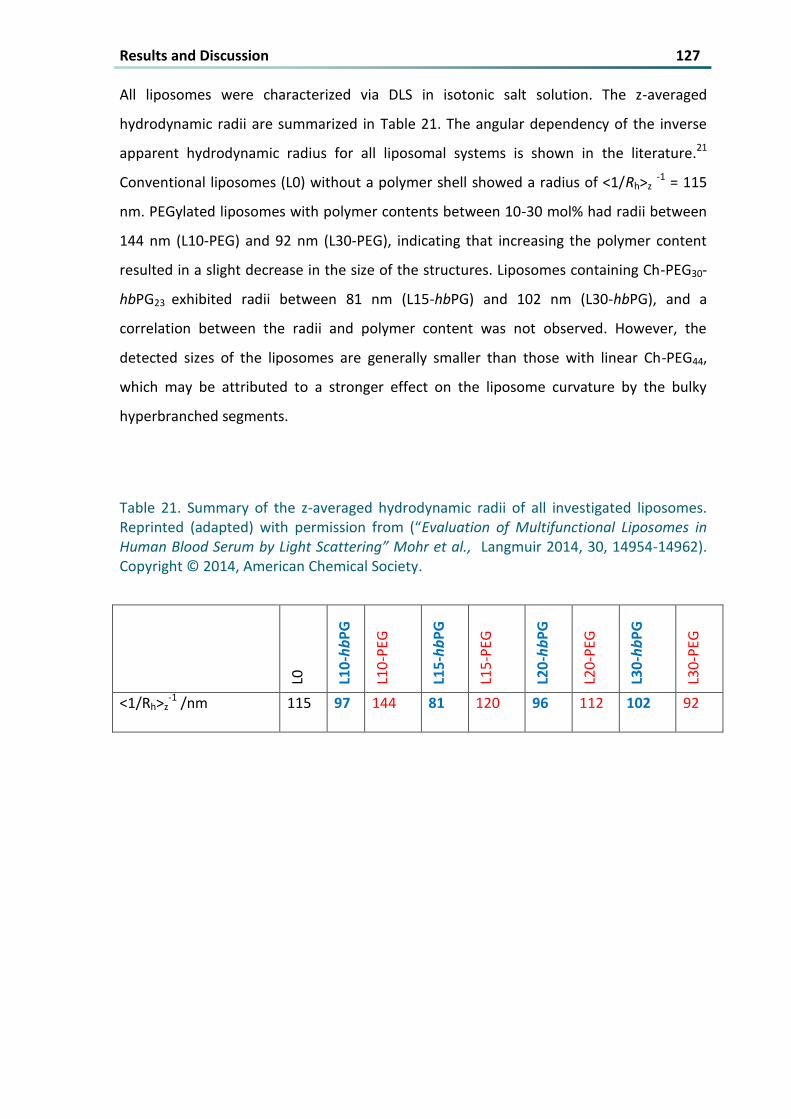
Table 21 Summary of the z-averaged hydrodynamic radii of all investigated liposomes Reprinted (adapted)
with permission from (ldquoEvaluation of Multifunctional Liposomes in Human Blood Serum by Light
Scatteringrdquo Mohr et al Langmuir 2014 30 14954-14962) Copyright copy 2014 American Chemical
Society 127
Table 22 Composition of investigated liposomes 132
Table 23 Zeta potential DLS- and SLS-results of liposomes 134
Table 24 Zeta potential DLS - SLS results and encapsulated amount of siRNA of loaded liposomes 137
XII
Abstract 1
1 ABSTRACT
The development of nanomaterials for biomedical application has become of great
interest in the last decades Especially in cancer therapy the encapsulation of drugs in a
carrier provides many advantages over administering active ingredients only The
nanomaterials are designed to guide the anti-cancer drug specifically to the tumor tissue
This way the cytotoxic side effects that occur during chemotherapy can be reduced In
addition the active compound itself can be protected from degradation
But still the application of nanomaterials in cancer treatment is limited due to some
drawbacks in understanding and foreseeing the physiological responses a nanocarrier
induces upon administration So far nanocarriers are usually applied intravenously This
means that the carrier system immediately comes into contact with the human blood and
the therein dissolved proteins This results in the rapid formation of a protein corona on
the nanomaterialacutes surface that alters its chemical and physical properties in a significant
manner
In this study the influence of single proteins as well as protein mixtures on the
physicochemical properties of polystyrene particles as a model system is investigated The
single proteins as well as protein mixtures that are exempted from the most abundant
proteins albumin and immunoglobulin G were obtained from the fractionation of human
blood plasma Incubation of the respective particles in defined protein fractions was used
to form predetermined protein coronas that were further investigated in regards of
stabilizing or destabilizing effects on a particle under in vivo conditions using dynamic light
scattering In addition the effect of a given protein corona on cellular uptake by
macrophages was monitored This way the possibility of stabilizing particles against
aggregation via pre-coating was introduced
The concept of pre-coating nanomaterials for tailoring their stability against aggregation
was broadened in order to overcome the difficulties that occur because of a fluctuation in
the blood serum proteome composition among different individuals
2 Next the focus was put on the transferability of different in vivo animal models to
humans It turned out that the stability of polystyrene as well as dextran- and starch-
coated particles against aggregation strongly depends on the protein source
After screening the mentioned factors that influence the protein corona formation by the
use of polystyrene particles as a model system liposomes for siRNA delivery to the liver
have been investigated and optimized regarding their stability against aggregation
In summary the closer look that is taken on the different factors that influence the
physicochemical properties of a nanomaterial after exposure to human blood offers
several opportunities of pre-in vivo screening methods for novel nanomaterials In
addition it introduces possible ways of how the interactions between nanomaterials and
proteins can be used for stabilization against aggregation
Introduction 3
2 INTRODUCTION
In the last decades designing nanomaterials for biomedical applications has become of
great interest1 These systems are designed for specific targeting of for example tumor
cells and by this reduce cytotoxic side-effects2 So far most drug delivery systems are
given parenterally meaning intramuscular or intravenously2 In consequence
nanomaterials come into contact with biological media like cytosol or blood and interact
with present proteins and cells
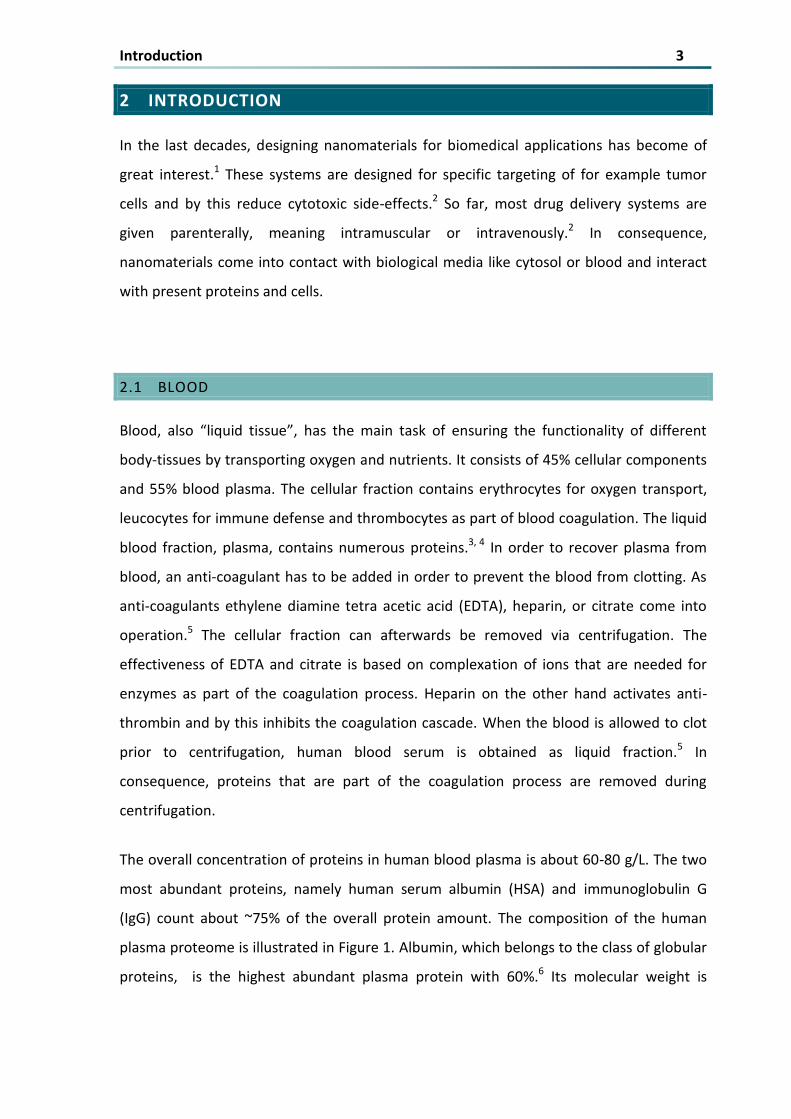
21 BLOOD
Blood also ldquoliquid tissuerdquo has the main task of ensuring the functionality of different
body-tissues by transporting oxygen and nutrients It consists of 45 cellular components
and 55 blood plasma The cellular fraction contains erythrocytes for oxygen transport
leucocytes for immune defense and thrombocytes as part of blood coagulation The liquid
blood fraction plasma contains numerous proteins3 4 In order to recover plasma from
blood an anti-coagulant has to be added in order to prevent the blood from clotting As
anti-coagulants ethylene diamine tetra acetic acid (EDTA) heparin or citrate come into
operation5 The cellular fraction can afterwards be removed via centrifugation The
effectiveness of EDTA and citrate is based on complexation of ions that are needed for
enzymes as part of the coagulation process Heparin on the other hand activates anti-
thrombin and by this inhibits the coagulation cascade When the blood is allowed to clot
prior to centrifugation human blood serum is obtained as liquid fraction5 In
consequence proteins that are part of the coagulation process are removed during
centrifugation
The overall concentration of proteins in human blood plasma is about 60-80 gL The two
most abundant proteins namely human serum albumin (HSA) and immunoglobulin G
(IgG) count about ~75 of the overall protein amount The composition of the human
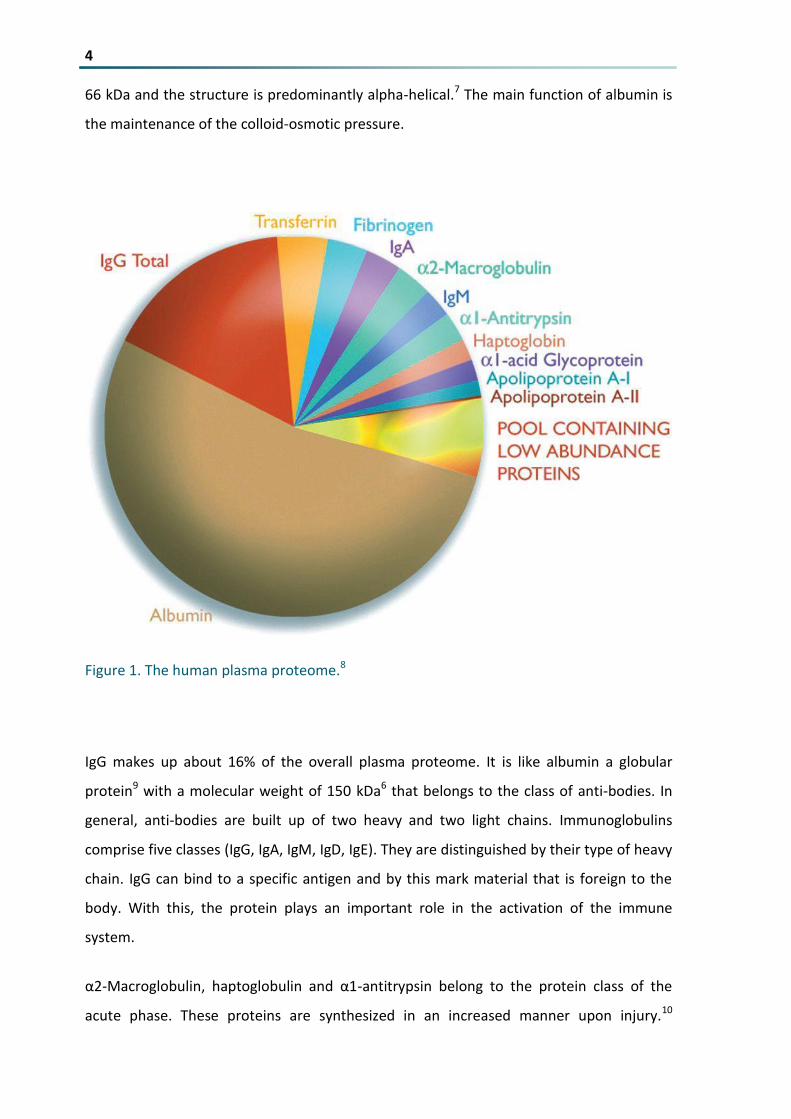
plasma proteome is illustrated in Figure 1 Albumin which belongs to the class of globular
proteins is the highest abundant plasma protein with 606 Its molecular weight is
4 66 kDa and the structure is predominantly alpha-helical7 The main function of albumin is
the maintenance of the colloid-osmotic pressure
Figure 1 The human plasma proteome8
IgG makes up about 16 of the overall plasma proteome It is like albumin a globular
protein9 with a molecular weight of 150 kDa6 that belongs to the class of anti-bodies In
general anti-bodies are built up of two heavy and two light chains Immunoglobulins
comprise five classes (IgG IgA IgM IgD IgE) They are distinguished by their type of heavy
chain IgG can bind to a specific antigen and by this mark material that is foreign to the
body With this the protein plays an important role in the activation of the immune
system
α2-Macroglobulin haptoglobulin and α1-antitrypsin belong to the protein class of the
acute phase These proteins are synthesized in an increased manner upon injury10
Introduction 5 Fibrinogen which also plays an important role in the hemostatic process is part of the
coagulation process of blood11 Clotting occurs when the protein is converted to fibrin by
thrombin12
Apolipoprotein A-I and A-II belong to the class of lipoproteins Lipoproteins are aggregates
that are build-up of proteins lipids and cholesterol Their main function is the transport of
lipids According to their density lipoproteins can be divided in chylomicrons high density
lipoprotein (HDL) intermediate density lipoproteins (IDL) low density lipoprotein (LDL)
and very low density lipoprotein (VLDL)13
22 NANOMATERIALS AS DRUG DELIVERY SYSTEMS
Nanoparticles (NPs) for biomedical applications are a very promising and exciting research
field Especially when it comes to cancer treatment the idea of incorporating drugs into
nano-sized drug carriers is very attractive since the so far used chemotherapeutics cause
several cytotoxic side-effects On the one hand the encapsulation of drugs offers the
opportunity of targeting to the desired cells and by this increasing the mentioned
specificity On the other hand the loading of drugs into nanomaterials protects the drug
itself from degradation
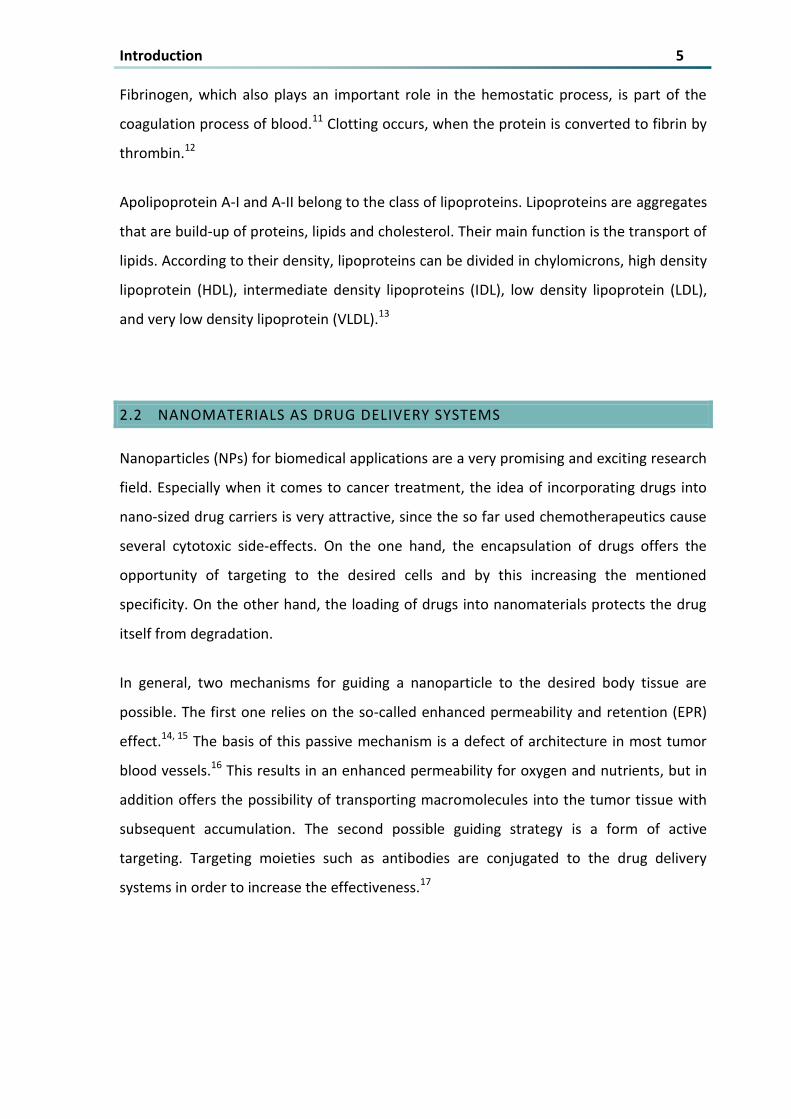
In general two mechanisms for guiding a nanoparticle to the desired body tissue are
possible The first one relies on the so-called enhanced permeability and retention (EPR)
effect14 15 The basis of this passive mechanism is a defect of architecture in most tumor
blood vessels16 This results in an enhanced permeability for oxygen and nutrients but in
addition offers the possibility of transporting macromolecules into the tumor tissue with
subsequent accumulation The second possible guiding strategy is a form of active
targeting Targeting moieties such as antibodies are conjugated to the drug delivery
systems in order to increase the effectiveness17
6
Figure 2 Passive18 (1) versus active (2) targeting The defect architecture of tumor tissue allows the penetration with nutrients and macromolecules By conjugating antibodies to macromolecules the accumulation can be increased by specific antibody-receptor interactions on the surface of tumor cells Figure 2 (1) Reprinted from Advanced Drug Delivery Reviews Volume 65 Issue 1 Hirashi Maeda Hideaki Nakamura Jun Fang ldquoThe EPR effect for macromolecular drug delivery to solid tumors Improvement of tumor uptake lowering of systemic toxicity and distinct tumor imaging in vivordquo Pages 71-79 Copyright copy (2012) with permission from Elsevier Elsevier
A variety of nano-particular systems are investigated for cancer therapy They include
polymeric nanoparticles19 liposomes20 21 metallic core nanoparticles22 23 dendrimers24
polymeric micelles25-27 and viral nanoparticles28 Each system bears several advantages
but also limitations Liposomes are a very prominent strategy to incorporate siRNA for
delivery and are therefore discussed in detail within this introduction22
221 LIPOSOMES FOR SIRNA DELIVERY
This chapter has already been published and is reprinted from Biochemical and
Biophysical Research Communications Volume 468 Issue 3 Laura K Muumlller Katharina
Landfester ldquoNatural liposomes and synthetic polymeric structures for biomedical
applicationsrdquo Pages 411-418 Copyright copy (2015) with permission from Elsevier29
Since the discovery of RNA interference (RNAi) as novel therapeutic strategy for gene
silencing by Fire et al in 199830 and Elbashir et al in 200131 32 the development of
suitable carrier systems for (synthetic) siRNA targeted towards specific disease relevant
Introduction 7 genes became of great interest Despite their high efficiency for siRNA delivery viral
vectors are limited in application due to possible inflammatory and immunogenic
responses33 Therefore the design of novel non-viral delivery strategies is a rapidly
growing field Among them the direct chemical modification of siRNA34 as well as loading
the cargo into carrier systems such as nanoparticles have been widely studied Polymeric
nanoparticles consisting of biodegradable or biocompatible polymers like chitosan have
been successfully used for the delivery of siRNA into the lungs of mice in order to silence
GAPDH or EGFP35 36 Another approach for the development of non-viral siRNA delivery
vectors is inspired by naturally occurring structures such as eukaryotic membranes
Systems based on self-assembled structures out of amphiphilic molecules are the most
prominent and well-studied siRNA carriers37
An important example for such amphiphilic molecules are natural occurring lipids38 Up to
a certain concentration these lipids are soluble on a molecular level in water but above a
critical concentration aggregates are formed39 In order to minimize the repelling
interactions with water the hydrophobic tails cluster together while the hydrophilic heads
repel each other due to sterical and electrostatical hindrance This way three dimensional
assembled structures like micelles bilayers or vesicles are formed (Figure 3b)40
If composed of (phospho-)lipids (Figure 3a) the latter ones are also usually called
liposomes41-43 and can be both single-component systems and multi-component systems
which means that other molecules like for example cholesterol are also incorporated This
is also the case for the natural cell membrane where cholesterol plays an important role
for the membranes viscosity according to the fluid mosaic model from Singer and
Nicholson44
8 a)
b) c)
Figure 3 a) Schematic structure of left) phosphoglycerides and right) sphingophospholipids with the polar head (orange) and the apolar tail (blue) b) schematic 3D structure of self-assembled lipids with A) micelle B) bilayer and C) vesicle c) PEG modification of liposomes with high density (left) and low density (right) reprinted from
Biochemical and Biophysical Research Communications Volume 468 Issue 3 Laura K Muumlller Katharina Landfester ldquoNatural liposomes and synthetic polymeric structures for biomedical applicationsrdquo Pages 411-418 Copyright copy (2015) with permission from Elsevier
Due to their structure shown in Figure 3b liposomes allow the encapsulation of a high
variety of drugs such as hydrophilic (inside the core) hydrophobic (in the hydrophobic
part of the membrane) as well as amphiphilic molecules (as part of the membrane) The
loading of siRNA cargo into ldquoman-maderdquo liposomes is a very prominent strategy22 due to
the biocompatibility of the constituents and the simple preparation by only mixing the
different components ldquoLipoplexesrdquo which are formed due to electrostatic interactions
between positively charged lipids and the negatively charged siRNA20 were identified to
enhance the efficiency of siRNA delivery in contrast to using naked siRNA45 Numerous
studies on cationic lipidic vectors have been reported46 among them 1-oleoyl-2-[6-[(7-
nitro-2-13-benzoxadiazol-4-yl)amino[hexanoyl]-3-trimethylammonium propane
Introduction 9 (DOTAP)47 or N-[1-(2 3-dioleyloxy)propyl]-NNN-trimethylammonium chloride
(DOTMA)48 A major drawback of using cationic lipids is the potential undesired
interaction with negatively charged serum proteins as well as possible inflammation
response49-51 The addition of cholesterol or other neutral lipids such as distearoyl
phosphatidylcholine (DSPC)52 to lipoplexes in order to form multi-component liposomes is
a successful method to overcome the above mentioned problems53 54 In addition
cholesterol offers the opportunity of simple modification strategies with for example
ligands Another approach to circumvent the described drawbacks is the surface
modification of liposomes with poly(ethylene glycol) (PEG) (see Figure 2c)55 The
conformation of PEG on a liposomesacute surface is dependent on many factors such as
density of the grafted polymer mirroring the available space the polymer chains can
capture56 In case of low grafting density each PEG chain has enough space to be in
coiled-structures but when the grafting density is increased the chains are forced to
elongate due to the steric hindrance between two chains In the presence of this highly
biocompatible polymer reduced aggregation as well as prolonged blood circulation time
of liposomes was obtained57-59 The so-called ldquostealth-liposomesrdquo60 already found their
way into clinical use61 62 The most prominent and commercially available among them is
DoxilTM which is a liposomal formulation with doxorubicin (DOX) as drug for anticancer
treatment63 64 Doxorubicin belongs to the group of anthracylines that have an
antineoplastic effect but also cause several side effects like for example cardiotoxicity65
Encapsulation of DOX in liposomes was found to reduce the drug accumulation in heart
and to increase its localization in tumor cells66 The latter feature was contributed mainly
to the prolonged half-life in blood circulation of the PEGylated liposomal system66 67
According to the fact that neutral lipids and PEG-modified ones are limited in electrostatic
interactions with siRNA the formulation of more complex systems needs a little more
effort than just mixing the components Among the several approaches the lipid film
method is the most prominent one in order to synthesize highly PEGylated liposomes37 In
principle a dried thin lipid film with all liposomal components is dissolved with a
concentrated siRNA solution68 Downsizing and size-control can further be done by
sonication69-71 or by extrusion through a polycarbonate membrane with defined pore
sizes72
10 The synthesis of lipids often requires multiple steps and several purification methods73
Therefore Langer and Anderson developed a new class of ldquolipidoidsrdquo74 which are lipid-like
materials that can be synthesized rapidly A combinatorial library was provided and the
new components screened in animal models regarding efficiency and safety for siRNA
delivery By this a formulation was identified that allows low-dose gene silencing in the
liver of mice52 According to Langer and Anderson the advantage of low-dose gene-
silencing would be the reduced amount of carrier material injected intravenously or the
possibility of multiple gene-silencing with only one intravenous administration within the
tolerability of the carrier materials It was shown that simultaneous silencing of five
hepatocellular gene targets in C57BL6 mice is possible The fact that low-dose gene-
silencing could also be achieved in non-human primates (Cynomolgus monkeys) paves the
way for safe and effective siRNA delivery52 In recent studies the lipid-like materials were
advanced to co-deliver siRNA and pDNA for the combined application of gene silencing
and expression75 135-Triazinine-246-trione (TNT) lipid derivatives were identified that
encapsulated more than 99 of siRNA as well as pDNA Injection of luciferase pDNA and
Tie2 siRNA in C57BL6 mice resulted in simultaneous gene expression and silencing This
could be of great interest for future treatment of diseases that are related to the
disordered function of several genes
An approach towards understanding and ranking the efficiency of lipid-based siRNA
delivery systems was made by Zhang et al who developed an in vitro assay that is based
on the delivery pathway liposomal systems are believed to undergo after intravenous
injection76 including distribution cell uptake ending in endosomes and siRNA release The
different stages in vivo were mimicked by for example incubating the lipidic systems with
anionic liposomes mirroring endosomal escape and the amount of released siRNA was
quantified It turned out that with increasing amount of anionic liposome add-on to the
cationic liposomes under investigation the siRNA release was increased drastically at
pH=6 (mimicking endosomal environment) whereas the siRNA release only slightly
increased at pH=7576 16 liposomal systems were investigated with the introduced in vitro
assay regarding the siRNA release The percentage of siRNA release out of the different
liposomal systems after incubation in rat serum correlated nicely with the effectiveness of
the respective system regarding the in vivo knockdown of ApoB at mRNA level in Sprague-
Introduction 11 Dawley female rats offering the possibility of identifying promising systems prior to in
vivo evaluation
The interaction of cationic liposomes for siRNA delivery with anionic liposomes at
physiological pH points towards a well-known problem of liposomal drug delivery in
general The composition of the lipid shell varies due to interactions and exchange with
other lipids This phenomenon is originated in the highly dynamic equilibrium between
lipids in solution and lipids incorporated in the designed liposomes as well as the high
similarity of the designed liposomes to naturally occurring systems like for example LDL
and HDL also containing for instance cholesterol
Effort towards solving this and enhancing the stability of the described delivery systems
was taken by Aigner and coworkers who combined liposomal systems with polymers in
order to design ldquolipopolyplexesrdquo for DNA or siRNA delivery77
23 PROTEIN CORONA
Many approaches have been made towards the use of nanoparticles for biomedical
applications The synthetic identity of a nanomaterial designed in the lab plays an
important role when it comes to the cellular uptake of the system Lerch et al
investigated the correlation between the size of NPs and the effectiveness of overcoming
the cell membrane barrier78 But also the materialacutes shape79 as well as surface charge80
influence the cellular uptake
As already mentioned most drug delivery systems are applied intravenously This means
that they come into contact with blood and its components in the first place As soon as a
nanoparticle enters the blood stream it is rapidly covered with surrounding proteins that
adsorb onto the materialacutes surface This protein layer is called protein corona and it has
become more and more clear that it defines the biological identity of a given material
significantly81-85
The transformation of a nanomaterialacutes chemical identity into its biological identity is
illustrated in Figure 4
12
Figure 4 Chemical versus biological identity of a nanomaterial after intravenous injection86 Adapted from ldquoWalkey C D Chan W C Understanding and controlling the interaction of nanomaterials with proteins in a physiological environment Chem Soc Rev 2012 41 2780-2799rdquo with permission of The Royal Society of Chemistry
The protein corona can be divided up into two parts the so-called ldquohardrdquo and ldquosoftrdquo
corona87 Both differ in the binding strength of proteins and thus their exchange times
between the adsorbed and dissolved state88 High abundance proteins adsorb onto a
nanomaterialacutes surface rapidly due to their availability But it is already known that those
proteins are more and more replaced by proteins with a higher affinity This effect is
known in literature as Vroman effect who studied the subsequent replacement of
fibrinogen by other proteins on flat surfaces89 90
Introduction 13 The change from flat surfaces towards curved surfaces as in the case for nanoparticles
leads also to changes in protein interactions91 Cedervall et al investigated the adsorption
of HSA on N-isopropylacrylamideN-tert-butylacrylaminde copolymer nanoparticles with
different sizes representing different surface curvatures92 It turned out that the
equilibrium association constant of HSA is independent of the nanoparticlesacute size but the
amount of protein that is needed to reach saturation differs in relation to the particle size
and with this the surface curvature The more hydrophobic surface is available for protein
interactions the number of bound protein molecules increases
As a nanomaterial is body-foreign material macrophages as part of the immune system
play a critical role in the blood circulation time of the carrier system Proteins within a
nanomaterialacutes protein corona that enhance the uptake of the reticuloendothelial system
are referred to as ldquoopsoninsrdquo93 94 One example for opsonins is IgG Lunov et al showed
that IgG-adsorption onto polystyrene particles (PS) initiates phagocytosis by human
macrophages95 HSA and apolipoproteins on the other hand are often referred to as
dysopsonins that enhance the circulation time of a nano carrier96
The type of interactions between nanoparticles and proteins can be electrostatic as well
as hydrophobic Roser et al investigated the interactions of surface-modified albumin
spheres with human serum in regards of phagocytosis and bio-distribution97 With this a
direct correlation of surface charge and protein adsorption was shown But more and
more it became clear that the main driving forces for protein adsorption are hydrophobic
interactions In general hydrophobic particles show increased protein coverage compared
to hydrophilic particles98 99
It is already known that the adsorption of proteins on a nanomaterials surfaces can
induce conformal changes100 With this their enzymatic activity can be lost101 or binding
sites for other proteins can be hidden Norde et al monitored the structural changes of
bovine serum albumin (BSA) between the adsorbed and dissolved state102 Structural
changes of the protein during adsorption on hydrophilic silica particles haven been found
to be reversible meaning it regained its native structure when dissolved again On the
other hand the adsorption of BSA onto hydrophobic polystyrene nanoparticles has been
found to be irreversible leading to changes in the secondary structure of the respective
protein
14 The proteins present in biological fluids are in consequence of enzymatic or chemical
reactions glycosylated in high amounts This means that carbohydrates are covalently
attached to them Recently Wan et al analyzed the role of glycans present in a protein
corona on nanoparticle-cell interactions103 The removal of carbohydrates from a given
protein corona was found to increase cell membrane adhesion as well as cell uptake of
SiO2 NPs
As already mentioned particle size and surface charge influence a nanomaterialacutes body-
distribution and cellular uptake The adsorption of proteins leads to an increase in size and
a coverage of initial particle surface charge Thus it is obvious that the protein
composition on a NP strongly influences its body-distribution Taken this together with the
concept of opsonization many efforts have been made towards surface modification of
nanomaterials in order to reduce protein adsorption
231 THE STEALTH EFFECT
The surface modification with protein repellent substances is a wide-spread method in
order to decrease the degree of opsonization and to increase the time in blood-circulation
of nanoparticles As opsonization and adsorption of proteins is increased on hydrophobic
nanomaterials hydrophilic molecules have been used for modification The most
prominent example is poly (ethylene glycol) (PEG) By PEGylation a nanomaterial is
masked against rapid immunological responses104 The resulting materials are therefore
also termed ldquostealthrdquo materials105 The modification can be done either by covalently
attaching PEG or also by adsorption of polymer chains onto the nanomaterialacutes surface106
As already described for liposomes the degree or surface density of PEG has
consequences on its 3D structure and with this also on protein corona formation104 With
increasing density of PEG chains the protein adsorption was found to be reduced but not
completely prevented
Schoumlttler et al recently showed that the presence of distinct proteins within the protein
corona of stealth materials is even required and necessary in order to prevent un-specific
cellular uptake of nanomaterials107 Clusterin which is also termed apolipoprotein J was
Introduction 15 identified to play a major role in the stealth effect PEGylated stealth particles were found
to be taken up by macrophages in similar range as non-PEGylated particles when no
proteins were present Only in the presence of plasma the unwanted uptake of stealth
materials could be completely inhibited while the non-PEGylated control-particles
showed no significant change in cellular uptake behavior This opens new possibilities
when it comes to surface modification of nanomaterials Not only the attachment of
polymers but also the modification with specific proteins could be promising candidates
in order to make ldquostealthrdquo materials
Figure 5 Protein adsorption on stealth-materials (right) is reduced in comparison to non-modified NPs (left)
24 PROTEIN CORONA ANALYSIS
Due to the fact that the protein corona can be divided up into the soft and the hard
corona which differ in the binding strength of present proteins the analysis of protein-
particle interactions strongly depends on prior sample preparation108
In general the protein corona formation is usually carried out by introducing a certain
surface area of nanomaterial into a respective protein source like human blood plasma or
serum After incubation some methods like isothermal titration calorimetry (ITC)
dynamic light scattering (DLS) or asymmetric flow ndash field flow fractionation (AF-FFF) are
suitable methods to analyze the soft corona as no washing steps are needed prior to
16 analysis On the other hand methods like liquid chromatography-mass spectrometry (LC-
MS) SDS polyacrylamide gel electrophoresis (SDS-PAGE) or protein quantification within
the corona require the removal of unbound proteins This can either be done by
centrifugation of the particle protein mixture or by separation via a magnetic field The
latter one is limited to magnetic particles Depending on the binding strength of proteins
within the corona the shear forces applied for separation of unbound proteins lead also
to a removal of weakly bound proteins of the soft corona and with this to an altering of
corona composition This is illustrated in Figure 6
Figure 6 Soft vs hard corona obtained by the removal of free proteins using for instance
centrifugation or magnetic separation
241 IN SITU ANALYSIS
2411 ISOTHERMANL TITRATION CALORIMETRY
Isothermal titration calorimetry is a technique that monitors heat changes that occur
during adsorption of proteins on a nanomaterials surface109 110 In principle two
measurement cells are isolated by a mantle in order to keep the temperature constant
One cell the measurement cell is equipped with one component like the nanomaterial
under investigation while the second cell serves as reference cell The temperature of
both cells is kept constant during the whole measurement When a second component
under investigation like a protein solution is added stepwise in the measurement cell a
Introduction 17 temperature change occurs in case there is some interaction between both components
This temperature change can be detected and adjusted ITC is a method that therefore
allows to determine binding thermodynamics between proteins and nanomaterials
2412 FIELD FLOW FRACTIONATION
Asymmetric flow ndash field flow fractionation (AF-FFF) is a chromatography like technique
This method is suitable for the separation and size determination of polymers and colloids
in solution In principle a laminar flow is applied between two parallel plates in a thin
channel This leads to a parabolic flow profile Is now a cross flow applied that acts
perpendicular to this flow particles or molecules introduced into the channel are pushed
against the so called accumulation wall This leads to a higher local concentration of
particles at the wall and thus induces diffusion of particles in the opposite direction
According to their diffusion coefficients particles with different sizes are located with
different distances from the accumulation wall and can therefore be separated
Tsai et al used AF-FFF together with complementary techniques in order to investigate
the adsorption and conformation of bovine serum albumin (BSA) on gold nanoparticles
(AuNP) Here the method was applied in order to fractionate possible agglomerates after
BSA and AuNP conjugation The size-determination of every fraction could be correlated
with results obtained from dynamic light scattering111
2413 DYNAMIC LIGHT SCATTERING
As dynamic light scattering (DLS) is an often used method within this work it will be
described in more detail
Dynamic light scattering in general is a method that determines the size of a given species
by using the diffusion of molecules in solution At each scattering angle during the
measurement a given scattering volume is under investigation Due to the already
mentioned diffusion of molecules they diffuse in and out of the observation volume This
18 leads to a fluctuation in scattering intensity over time which is the detected measurand
An auto-correlator converts the signal into an autocorrelation function (ACF) of scattering
intensity
1198922(119902 119905) =lt119868(119902119905)119868(119902119905+120591)gt
lt119868(119902119905)2gt (1)
I(qt) is the time dependent scattering intensity that gets multiplied with the scattering
intensity I(qt+ τ ) that is shifted by the time τ With the Siegert equation112 that gives the
relation between equation (1) and the experimentally measurable field autocorrelation
function g1(qt) equation (2) is valid for a given scattering vector q
1198921(119905) = radic1198922(119905)minus119860
119860 (2)
In equation (2) A describes the experimentally determined baseline For monodisperse
particles the autocorrelation function g2(qt) can be described as a simple exponential
decay
1198922(119902 119905) = 119860 times 119890(minus1199022119863119905) (3)
The diffusion coefficient D is related to the inverse correlation time Γ
120548 = 1
120591= 1199022119863 (4)
For disperse samples an averaged diffusion coefficient is determined that is dependent
on the scattering angle q Therefore the true value has to be calculated by extrapolating
q 0 With the use of the Stokes-Einstein equation the z-averaged hydrodynamic radius
Rh can be obtained from the extrapolated diffusion coefficient Dz
lt1
119877ℎgt119911
minus1=119896119879
6120587120578119863119911 (5)
When the temperature T and the solventacutes viscosity η are known the hydrodynamic
radius can be obtained The ratio of radius of gyration obtained from static light scattering
Introduction 19 and the hydrodynamic radius obtained from dynamic light scattering gives information
about the geometry of the system under investigation
120588 =radiclt119877119892
2gt119911
lt1
119877ℎgt119911
minus1 (6)
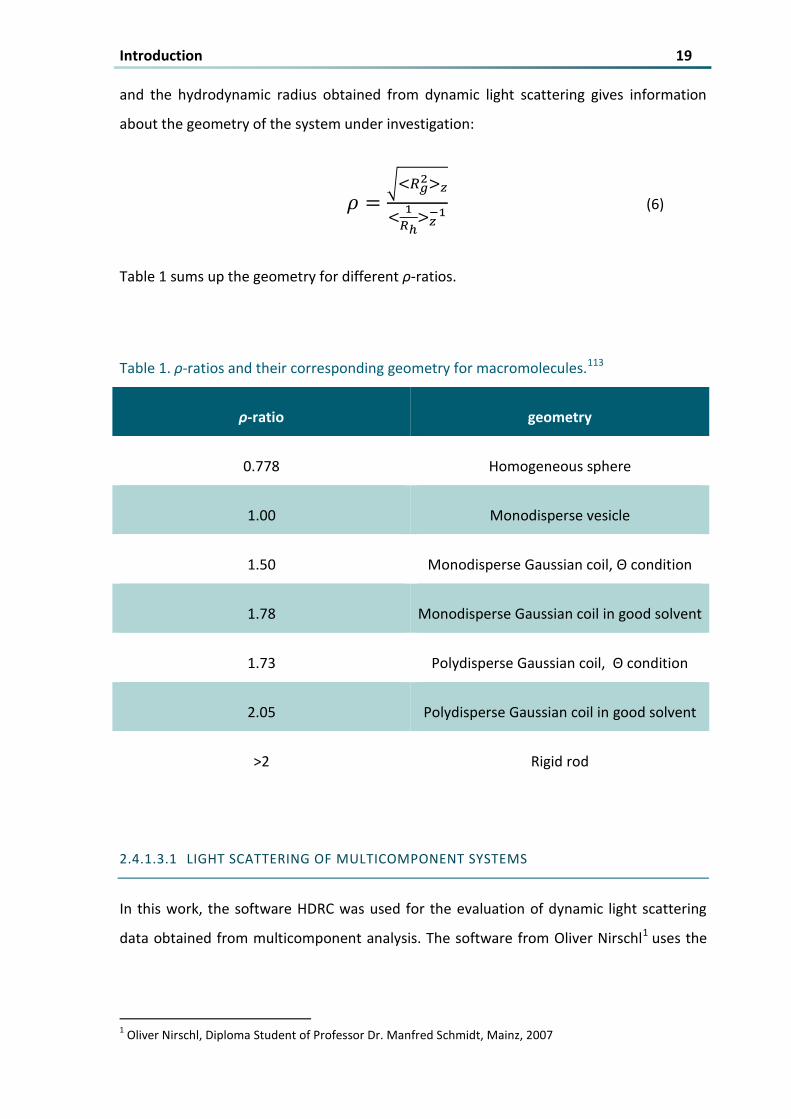
Table 1 sums up the geometry for different ρ-ratios
Table 1 ρ-ratios and their corresponding geometry for macromolecules113
ρ-ratio geometry
0778 Homogeneous sphere
100 Monodisperse vesicle
150 Monodisperse Gaussian coil Θ condition
178 Monodisperse Gaussian coil in good solvent
173 Polydisperse Gaussian coil Θ condition
205 Polydisperse Gaussian coil in good solvent
gt2 Rigid rod
24131 LIGHT SCATTERING OF MULTICOMPONENT SYSTEMS
In this work the software HDRC was used for the evaluation of dynamic light scattering
data obtained from multicomponent analysis The software from Oliver Nirschl1 uses the
1 Oliver Nirschl Diploma Student of Professor Dr Manfred Schmidt Mainz 2007
20 simplex algorithm (downhill-simplex) in order to describe non-linear functions that
depend on several parameters
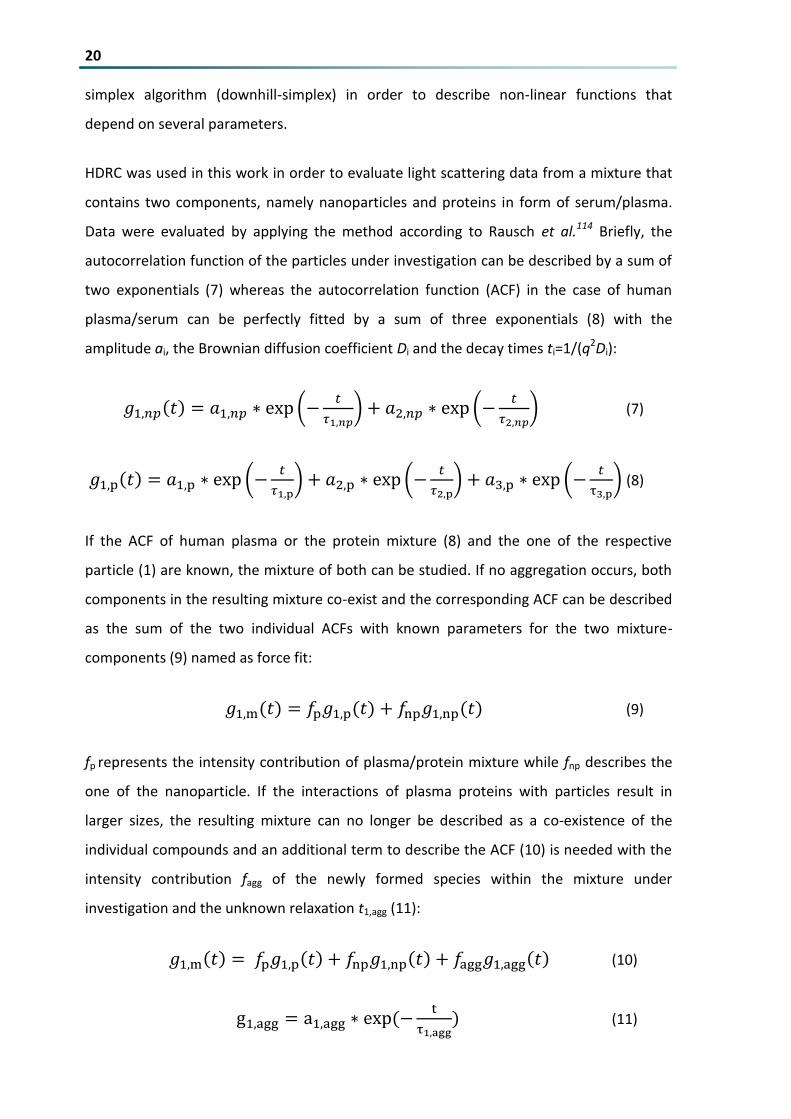
HDRC was used in this work in order to evaluate light scattering data from a mixture that
contains two components namely nanoparticles and proteins in form of serumplasma
Data were evaluated by applying the method according to Rausch et al114 Briefly the
autocorrelation function of the particles under investigation can be described by a sum of
two exponentials (7) whereas the autocorrelation function (ACF) in the case of human
plasmaserum can be perfectly fitted by a sum of three exponentials (8) with the
amplitude ai the Brownian diffusion coefficient Di and the decay times ti=1(q2Di)
1198921119899119901(119905) = 1198861119899119901 lowast exp (minus119905
1205911119899119901) + 1198862119899119901 lowast exp (minus
119905
1205912119899119901) (7)
1198921p(119905) = 1198861p lowast exp (minus119905
1205911p) + 1198862p lowast exp (minus
119905
1205912p) + 1198863p lowast exp (minus
119905
τ3p) (8)
If the ACF of human plasma or the protein mixture (8) and the one of the respective
particle (1) are known the mixture of both can be studied If no aggregation occurs both
components in the resulting mixture co-exist and the corresponding ACF can be described
as the sum of the two individual ACFs with known parameters for the two mixture-
components (9) named as force fit
1198921m(119905) = 119891p1198921p(119905) + 119891np1198921np(119905) (9)
fp represents the intensity contribution of plasmaprotein mixture while fnp describes the
one of the nanoparticle If the interactions of plasma proteins with particles result in
larger sizes the resulting mixture can no longer be described as a co-existence of the
individual compounds and an additional term to describe the ACF (10) is needed with the
intensity contribution fagg of the newly formed species within the mixture under
investigation and the unknown relaxation t1agg (11)
1198921m(119905) = 119891p1198921p(119905) + 119891np1198921np(119905) + 119891agg1198921agg(119905) (10)
g1agg = a1agg lowast exp (minust
τ1agg) (11)
Introduction 21 The above described method was first introduced by Rausch et al in 2010114 In 2014 a
work was presented that correlates the results obtained from dynamic light scattering
with the in vivo body distribution of polystyrene nanoparticles in mice115 Nanoparticles
that formed aggregates accumulated in the liver of mice while stable particles with no
significant size increase were distributed over the whole mice body due to their blood
circulation
2414 FLUORESCENT CORRELATION SPECTROSCOPY
Fluorescent correlation spectroscopy (FCS)116 is in principal very similar to DLS but in
contrast the intensity fluctuation of a fluorescence signal is detected Roumlcker et al used
this technique in order to analyze the adsorption of HSA on small polymer-coated
nanoparticles117 The limitation of this method is obvious While with dynamic light
scattering every species within a mixture can be detected FCS only observes fluorescence
labelled species
242 HARD CORONA ANALYSIS
The methods described in the following have the requirement of removing unbound
proteins and can therefore not be performed in situ Thus only the hard corona with
strongly bound proteins is under investigation
For analysis the proteins have to be detached from the particle surface via add-on of
anionic detergents like sodium dodecyl sulfate (SDS) urea or thiourea
The amount of proteins present in a nanomaterialacutes hard corona can be determined
afterwards by using assays that are based on calorimetric quantification like the BCA
protein assay The assay is based on the protein quantification with bichinonic acid (BCA)
and is a combination of biuret reaction and complexation of copper (l) ions with BCA118
The BCA complex has an adsorption maximum at 562 nm and can therefore be used for
protein quantification as its amount is directly proportional to a present protein amount
22
2421 SDS POLYACRYLAMIDE GEL ELECTROPHORESIS
A first idea of the composition of a protein corona under investigation can be obtained by
using SDS polyacrylamide gel electrophoresis (SDS-PAGE) The method is based on the
separation of proteins according to their molecular weight when an electrical field is
applied To ensure the separation of proteins only according to their molecular weight
other factors that may interfere have to be reduced Therefore the tertiary structure of
proteins is destroyed prior to analyzing them via gel-electrophoresis This is done by the
adding of SDS119 and a reducing agent for the reduction of disulphide bonds In addition
SDS guarantees the coverage of protein charges resulting in a negative charge that is
directly proportional to the peptide chain length The denaturated proteins are deposited
onto a polyacrylamide gel When voltage is applied the proteins migrate through the gel
in the direction of the anode according to their negative charge The gel acts like a filter
allowing small molecules to diffuse faster than big molecules
After the successful separation of proteins the protein pattern that has been formed on
the gel can be visualized by different staining procedures The most common ones are the
silver staining and the staining with Commassie brilliant blue
The drawback of the described method is the limited resolution Proteins with similar
molecular weights co-migrate through the gel and can therefore not be separated That
makes it very difficult to identify single proteins Nevertheless it is a suitable method for
the comparison of different protein patterns
In order to increase the separating capacity the SDS-gel electrophoresis can be done in
two dimensions120 or extended to western blotting But the most powerful tool to identify
proteins within a certain corona so far is the combination of liquid chromatography with
mass spectrometry
2422 LIQUID CHROMATOGRAPHY-MASS SPECTROMETRY
As already said this method is a combination of liquid chromatography (LC) and mass
spectrometry (MS) Prior to analysis the proteins need to be digested into smaller
Introduction 23 fragments This can be done by adding the protein trypsin121 The peptide-mixture can
afterwards be separated in a first step by liquid chromatography This chromatography
method is based on the dissolving of analytes in a liquid phase The liquid phase
afterwards passes a stationary phase that can either be hydrophilic or hydrophobic
(reversed phase) The separation principle is based on the adjustment of an equilibrium in
interactions of the analytes with both mobile and stationary phase The analytes are
therefore separated according to their hydrophobic or rather hydrophilic character After
a first separation the analytes in this case peptide fractions can be transferred into a
mass-spectrometer for further separation Mass spectrometry is a powerful tool in order
to separate analytes according to their mass to charge ratio This indicates that the
analytes have to be ionized prior to separation For proteins the electro-spray ionization
(ESI) is a widely used method as it is a suitable tool to ionize macromolecules In principle
a solution of analytes passes a capillary on whose end an electric field is applied Ions
within the analyte solution are attracted by the counter-electrode A so-called Tylor-cone
forms at the end of the capillary in which ions repel each other Due to the repulsion an
aerosol of ions in solvent is formed While the solvent evaporates the droplets are scaled
down which again leads to repulsion between single ions within one droplet This leads to
a decay into smaller droplets At the end of the cascade single ions are obtained in the
gas phase that can afterwards be analyzed according to their mass to charge ratio There
are different types of analyzers like a time of flight (TOF) analyzer or a quadrupole The
first one accelerates ions by an electric field of known strength This acceleration results in
the same kinetic energy for ions with the same charge The velocity of the ions depend on
the mass-to-charge ratio meaning that the time a particle needs to reach the detector
gives the mass to charge ratio of the ion when the experimental parameters like distance
are known Quadrupoles consists of four rod-electrodes that are ordered parallel while
each opposing rod pair is connected together electrically In addition a superimposed
high frequency alternating current voltage is applied leading ions to travel down the
quadrupole between the rods Only ions with a specific mass to charge ratio can reach the
detector as the trajectory of every other mz-ratio is unstable and thus the ions collidate
with the electrodes By varying the potentials of the electrodes and the superimposed
high frequency alternating current voltage the ions are consecutively guided through the
quadrupole according to their mass to charge ratio The combination of three quadrupoles
in series allows the detection of MSMS spectra which means that ions that are
24 separated in a first quadrupole can be fragmented further on and again be separated
according to their mass to charge ratio with the third quadrupole The second
quadrupoles serves for the fragmentation When the third quadrupole is replaced by a
TOF analyzer the system is called Q-TOF and is part of the setup that was used to perform
LC-MS measurements shown in this work
The detected mass to charge ratios can be compared to a database that allows the
identification of distinct proteins or protein fragments
Tenzer et al used label-free quantitative LC-MS in order to obtain time-resolved profiles
of corona formation on silica and polystyrene nanoparticles122 Nanoparticle-specific
coronas were found to form rapidly that change only in the amount of adsorbed protein
but not in the protein composition
LC-MS also allowed the already mentioned determination of distinct proteins that play a
critical role in the stealth effect107
2423 ZETA-POTENTIAL
The zeta potential or electric potential of a diffusing particle in solution mirrors the
surface charge of the respective particle under investigation and can thus also provide
information about possible protein adsorption
When charged particles are in solution ions with the opposite charge present in the
suspension medium attach at the particlesacute surface Further ions arrange loosely around
the first ion layer and form a diffuse layer When an electrical field is applied the particles
will move according to their charge Ions in the diffuse layer are sheared off building up a
potential that is called zeta potential ζ Under similar conditions the zeta potential can be
used as measurand for a particleacutes surface potential 1 mM potassium chloride solution is
usually used as suspension medium When an electrical field is applied ions in suspension
diffuse according to their charge while the diffusion speed is depending on the particle
size The so-called electrophoretic mobility can be transferred into the zeta potential by
using the Smoluchowsky123 equation
Introduction 25
119906119864 = 41205871205760 times119863120577
4120587120578=
120576120577
120578 (12)
Here uE stands for the electrophoretic mobility η for the viscosity ε for the dielectric
constant and D for the diffusion coefficient
As the majority of the plasma proteins is negatively charged the adsorption of proteins
onto a nanomaterialacutes surface results in a change of the zetapotential to negative values
even if the particle itself is positively charged124 For example Baier et al monitored the
BSA adsorption on differentially charged polystyrene nanoparticles via zeta potential
measurements125
25 AIM OF THIS WORK
The aim of this work is to get a better understanding of nanoparticle protein interactions
and how these interactions can be useful for further biomedical applications Therefore
single proteins as well as low abundant protein mixture were obtained by the
fractionation of human plasma Their influence on nanoparticle stability and effect on
cellular uptake was investigated By the combination of dynamic light scattering under in
vivo conditions and the protein identification via LC-MS single proteins could be
identified that play a role in protein corona formation and stabilization of respective
particles under investigation against aggregation Critical steps in the evaluation of novel
nanomaterials for biomedical application like the universal validation of protein corona
studies when examining single probands as well as the transfer from in vivo animal models
to humans were investigated
In general protein particle interactions are very complex and depend on many factors
Therefore studies are often based on phenomenological observations while a
physicochemical description remains difficult In this work the analysis of protein induced
aggregation of nanoparticles using dynamic light scattering is also based on
phenomenological studies The process of observed aggregation can involve nanoparticle
bridging the adsorption of proteins and protein-protein aggregates on the nanomaterialacutes
surface By combining dynamic light scattering with fluorescent correlation spectroscopy
26 one basic approach towards understanding the processes involved in protein induced
aggregation of nanoparticles was made
Results and Discussion 27
3 RESULTS AND DISCUSSION
The results part of this work is divided up into seven parts After presenting the different
protein mixtures that were obtained by fractionation of human plasma the interactions of
the respective protein fractions with polystyrene particles as model system were
investigated Afterwards a short overview of the impact of different protein sources like
human blood serum or plasma on pre-in vivo studies is given In the fourth and fifth
chapter the difference in blood serum composition of individual probands as well as the
protein composition of the corona of stealth materials were utilized for particle
stabilization against aggregation In chapter six the transferability of different in vivo
models on humans is discussed In the last section the model system of polystyrene
particles is changed towards the investigation of multifunctional liposomes for biomedical
applications
31 FRACTIONATION OF HUMAN BLOOD PLASMA
As already described in the introduction human serum albumin and IgG are very
abundant in human plasma Thus these proteins adsorb onto an introduced
nanomaterialacutes surface in the first place But over time the proteins are replaced by
proteins with higher affinities The interactions of low abundant proteins with
nanoparticles are therefore of great interest in order to get a better understanding of
protein corona formation and particle stability under physiological conditions Plasma
fractionation is a widely used process to enrich specific components from human plasma
like IgG and was utilized in this work in order to deplete human blood plasma from the
two most abundant proteins Highly complex protein mixtures with various low abundant
proteins were created and could be used for the investigation of particle-protein
interactions As already defined in the introduction the human blood proteome can be
either obtained as plasma or serum depending on the preparation method In contrast to
serum plasma contains also the proteins that are part of the coagulation process As the
low abundant proteins play a major role in this study human blood plasma stabilized with
citrate (and not serum) was chosen for the fractionation A detailed study on the different
protein sources for pre-in vivo studies will be given in chapter 33
28 In this work three different columns were used for the isolation of single proteins as well
as various low abundant protein mixtures in order to investigate their influence on protein
nanomaterial interactions Two of them are based on affinity chromatography and were
used for most questions discussed in further chapters The third one is predicated on
anion-exchange chromatography
For the separation of IgG a ToyoSreen AF-rProtein A HC-650F column was used The
column consists of a resin with immobilized Protein A that binds to the heavy chain of IgG
This way IgG similar proteins and IgG-bound proteins are retained while the other ones
flow through the column By the addition of citric acid the interactions of IgG and Protein
A are disrupted and IgG can be eluted from the column Figure 7 shows the chromatogram
of the IgG separation from human plasma According to protein quantification via BCA
Assay 93 of the total amount of injected proteins could be recovered 15 of the total
eluted amount consists of IgG
sample Concentration gL Amount mg Amount
injection 22 11 100
Flow Through 57 86 78
IgG 17 17 15
Figure 7 Chromatogram of IgG separation via Protein A column and the corresponding
protein amount in the fractions according to a BCA Assay
0 5 10 15
00
05
10
15
20
25
ab
so
rba
nce
t min
flow through
IgG elution
Results and Discussion 29 The efficiency of IgG removal was investigated via LC-MS and SDS-PAGE Figure 8 shows
the according results
Figure 8 A) Protein patterns obtained by SDS-PAGE of plasma and the protein fractions obtained by Protein A affinity chromatography with FT1 = flow through Protein A column B) LC-MS analysis of the respective protein fractions (LC-MS measurements performed by Dr Susanne Schoumlttler)
LC-MS data confirmed that an IgG protein fraction was obtained that consists of more
than 94 immunoglobulins The remaining plasma protein mixture contained only about
6 IgG showing a good separating capacity of the Protein A column A comprehensive list
of the LC-MS data will be presented in the supplementary information
By applying a ToyoScreen AF-Blue HC-650M column human serum albumin (HSA) could
be isolated The columnacutes resin exhibits covalently attached Cibacron Blue F3GA dye on its
surface as shown in Figure 9
Figure 9 Chemical structure of Cibacron Blue
30 HSA has a strong binding affinity to the dye that is caused by hydrophobic and
electrostatic interactions Therefore high concentrations of salt are required to detach
the protein126 This was done by the addition of 2 M sodium chloride solution Figure 10
shows the chromatogram of HSA separation
sample Concentration gL Amount mg Amount
injection 57 57
Flow Through 06 13 99
HSA 18 36 56
calculated from the total protein amount in plasma not from the injection
Figure 10 Chromatogram of HSA separation via AffiGel-Blue column and the
corresponding protein amount in the fractions according to a BCA Assay
Again the efficiency of HSA-removal was monitored by applying SDS-PAGE and LC-MS
Figure 11 shows the results The flow through protein fraction contained only 4 of HSA
When looking at the corresponding albumin elution fraction it turned out that it consists
of immunoglobulins and albumin in comparable amounts This phenomenon is already
well-known in literature describing that Cibacron Blue F3GA also has a strong affinity to
IgG and other plasma components126 127
0 5 10 15 20 25 30 35
00
05
10
15
20
25
abso
rba
nce
t min
flow through
albumin elution
Results and Discussion 31 In order to increase the purity of isolated HSA both chromatography techniques were
combined meaning that IgG and HSA removal columns were connected in series (step by
step) This way the amount of Albumin could be increased up to 84 A detailed overview
of LC-MS data is provided in the supplementary information According to protein
quantification via a BCA assay the total HSA amount recovered by the series connection
was 56 of the total protein amount which is in good agreement with literature values
(HSA amount in plasma ~60)6
Figure 11 A) Protein patterns obtained by SDS-PAGE of plasma and the protein fractions obtained by series connection of Protein A affinity chromatography and AffiGel Blue affinity chromatography with FT1 = flow through Protein A column and FT2 = FT1 with subsequent HSA removal B) LC-MS analysis of the respective protein fractions with FT = flow through AffiGel Blue column (LC-MS measurements performed by Dr Susanne Schoumlttler)
The resulting protein fractions were further on characterized with dynamic light scattering
(DLS) in order to determine their hydrodynamic radius lt1Rhgtz-1 In order to simplify the
description and to distinguish them from commercially available proteins the enriched
fractions of isolated proteinsprotein mixtures are named as FProtein whereas the plasma
fractions depleted from certain proteins are denominated as FPlasma-wo-Protein Table 2
summarizes the DLS results
32 Table 2 Obtained protein fractions (c = 1 gL) with their hydrodynamic radius and composition according to LC-MS
Fraction Protein Hydrodynamic radius
FIgG 942 Ig 056 HSA
524 others
lt1Rhgtz-1
= 68 nm
FHSA 8414 HSA 358 Ig
1228 others
lt1Rhgtz-1
= 31 nm
FHSAIgG 4739 HSA 346 Ig
1801 others
lt1Rhgtz-1
= 37 nm
FPlasma-wo-IgG 5692 HSA 587 Ig
185 Fibrinogen 3536 others
lt1Rhgtz-1
= 76 nm
FPlasma-wo-HSA 408 HSA
277 Ig
451 Serotransferin
1338 alpha1-antitrypsin
033 others
lt1Rhgtz-1
= 76 nm
FPlasma-wo-IgG-HSA
154 Haptoglobulin
147 α-1-antitrypsin
123 Serotransferrin
79 α-2-macroglobulin
lt1Rhgtz-1
= 79 nm
c = 06 gL
For IgG a hydrodynamic radius of lt1Rhgtz-1 = 68 nm was found whereas for albumin a
value of lt1Rhgtz-1 = 31 nm was found Both values are in good agreement with the
literature128 For example Rausch et al reported a z-averaged hydrodynamic radius for
albumin (c = 062 gL in DPBS) of lt1Rhgtz-1 = 36 nm129 As FHSAIgG presents a mixture of
both proteins it is obvious that the detected hydrodynamic radius has to be within the
range of the already mentioned radii with a measured value of lt1Rhgtz-1 = 37 nm Figure
12A shows the corresponding angular dependency of the inverse hydrodynamic radii of
each protein fraction In general the detected values are very small This effect can be
traced back to the low protein concentration compared to concentrated plasma When
plasma is diluted 160 the z-averaged hydrodynamic radius decreases from lt1Rhgtz-1 = 19
nm to lt1Rhgtz-1 = 11 nm Also for the individual size fractions Rh1 Rh2 and Rh3 trends can
be observed While the smallest size fraction remains constant in the range of ~ 3 nm the
values for Rh2 and Rh3 are halved upon dilution Another indication that the small values
are only based on dilution and not on removal of bigger protein species during
fractionation is shown in Figure 12B Figure 12B shows the autocorrelation function of
Results and Discussion 33 FPlasma-wo-IgG-HAS and the intensity contribution of the different observed size fractions at a
scattering angle of Θ = 30deg Three fractions were detected Among them the biggest
protein fraction with a radius of Rh3 = 82 nm was present
Figure 12 A) Angular dependency of the inverse hydrodynamic radii of the different protein fractions B) ACF of FPlasma-wo-HSA-IgG with the distribution of the 3 different size fractions at Θ = 30deg
As mentioned in the beginning of this chapter a third type of column was used to perform
human blood plasma fractionation namely ToyoScreen DEAE-650M This column consists
of an immobilized methacrylate matrix with di-ethyl amino groups on its surface that are
positively charged The mostly negatively charged plasma proteins bind to that resin and
can be successively eluted by increasing the ionic strength of the running buffer Again
sodium chloride with different concentrations between 0155-1 M was used Figure 13
shows the resulting chromatogram of anion exchange chromatography
To make sure that nearly all proteins bind to the resin the initial flow through was
reinjected two times Protein quantification confirmed that nearly no remaining protein
could be detected in the flow through afterwards The four elution fractions were
analyzed by LC-MS and SDS-PAGE The results are shown in Figure 14
34
Figure 13 Chromatogram of DEAE anion exchange chromatography
What comes first into mind when looking at both LC-MS data as well as SDS-PAGE (see
Figure 13) is the absence of HSA (in yellow) in elution fraction 1 All other fractions
contain the high abundance protein This underlines the already mentioned fact that a
high ionic strength is needed to overcome the strong binding affinity of the HSA
As a next step all three columns were connected in series meaning sequential removal of
IgG and HSA followed by anion exchange chromatography resulting in very low protein
concentrations in each fraction The success of the overall series connection was
monitored by using SDS-PAGE shown in Figure 15 The SDS-PAGE shows the good
enrichment of single proteins in the elution of IgG and albumin as well as the
corresponding change in relative band intensities in the separation of E1-E4
In conclusion by applying Protein A and AffiGel-Blue affinity chromatography it was
possible to enrich the single proteins FIgG and FHSA with good purity In addition the three
low abundant protein mixtures FPlasma-wo-IgG FPlasma-wo-HSA and FPlasma-wo-IgG-HSA could be
obtained As a second tool for fractionation DEAE anion exchange chromatography was
used to obtain four elution fractions E1-4 Those protein fractions were used for further
investigations on protein-nanoparticle interactions
0 20 40
0
1
2
abso
rban
ce
t min
flow
through
recirculate
E1
E2
E3
E4
Results and Discussion 35
Figure 14 LC-MS analysis of elution fraction 1 ndash 4 (LC-MS performed by Dr Susanne Schoumlttler AK Landfester Max Planck Institute for Polymer Research Mainz 2015) and SDS-PAGE of the respective protein fractions
Figure 15 SDS-PAGE of series connection of Protein A column AffiGel Blue column and DEAE column with FT1-3 = flow through after each column and E1-4 elution fraction 1-4 of DEAE column
36
32 FRACTIONS OF PROTEIN MIXTURES DIFFERENTIALLY AGGREGATE
NANOPARTICLES AND INFLUENCE THE CELLULAR UPTAKE
The formation of a protein corona on a nanomaterialacutes surface is a highly complex process
that is influenced by various factors such as size shape and charge of the nanomaterial In
addition the protein source itself namely blood plasma is very complex and contains
thousands of different proteins Especially the influence of the low abundant proteins on
particle stability and corona formation is of great interest since the high abundant
proteins are partly replaced by them over time upon blood exposure on the surface of
nanomaterials By depletion of HSA and IgG various low abundant protein mixtures could
be obtained and their composition could be determined precisely by using LC-MS as
shown in the previous chapter By introducing nanoparticles into the defined protein
mixtures a monitoring of the effects on particle stability and of the changes in
physicochemical parameters was possible This way the overall process of nanomaterial-
plasma interactions could be fragmented into low abundant and high abundant protein
interactions with a nanomaterial A closer look and deeper understanding of the processes
involved in the protein corona formation could be addressed by this means As already
known in the literature124 and described in the introduction the coating of nanoparticles
in single commercially available proteins can alter the nanomaterialacutes properties With
respect to their influence on the particle stability the protein fractions here could be used
for that approach as well As benefit the fractionation of human plasma into protein
fractions could possibly be performed from the patientacutes own plasma and used as
precoating of the nanocarriers ex vivo The overall procedure therefore qualified as pre-in
vivo screening method for nanomaterials designed for biomedical applications and the
directed adjustment of carrier properties
The different obtained protein fractions were used to investigate the stability of
polystyrene nanoparticles against aggregation using DLS The protein fractions were
further applied to form a predetermined protein corona on differently functionalized
polystyrene nanoparticles (PS) DLS was also used to investigate the stability of the
protein-coated nanoparticles when re-introduced into human plasma In addition the
influence of the artificially created protein corona on cellular uptake of nanomaterials was
studied Cell experiments were carried out by Johanna Simon (Max Planck Institute for
Results and Discussion 37 Polymer Research Mainz) LC-MS measurements were done either by Johanna Simon or
Dr Susanne Schoumlttler
321 THE PARTICLES UNDER INVESTIGATION
Three differently functionalized polystyrene particles were synthesized via direct
miniemulsion copolymerization as already described in literature125 namely without
surface modification (PS) and with amino (PS-NH2) or carboxy-functionalization (PS-
COOH) For stabilization of the different particle dispersions Lutensol AT50 was used as a
non-ionic surfactant Figure 16 shows the angular dependency of the inverse
hydrodynamic radii of the three particles under investigation obtained by DLS and Figure
17 summarizes the physicochemical parameters of the different particles regarding
hydrodynamic radius (Rh) determined by DLS charge obtained by ζ-potential
measurements and number of surface groups per NP quantified by particle charge
titration
Figure 16 Angular dependency of the inverse hydrodynamic radii of PS PS-COOH and PS-NH2 obtained by DLS
00 01 02 03 04 05 06
0010
0015
0020
0025 PS
PS-COOH
PS-NH2
q210E10cm-2
1R
h n
m
38 The 1 mM KCl solution used for zeta potential determination has an approximately neutral
pH Under these conditions the carboxy-groups of PS-COOH are deprotonated resulting in
the detected negative charge while the amine groups in PS-NH2 are extensively
protonated and thus positively charged
Figure 17 TEM images and physicochemical characterization of polystyrene nanoparticles with different surface functionalization
322 SOFT PROTEIN CORONA ANALYSIS
With DLS it was possible to directly monitor the size increase of nanoparticles in the
respective protein fractionsfull plasma The data were evaluated by applying the method
according to Rausch et al114 that was already described in the introduction It has to be
noted that the additional size formed in the respective mixture can be either caused by
nanoparticle bridging the adsorption of proteins or protein-protein aggregates on the
nanomaterialacutes surface
Prior to experiments with the different protein fractions the effect of the protein amount
in relation to a given surface area of NPs on the aggregation behavior of the different
polystyrene particles was monitored using different dilutions of the plasma The surface
area of particles introduced into a given volume of plasmadilution was kept constant at
Results and Discussion 39 5x10⁻⁴ m2 resulting in different ratios of surface area per mg protein The results are
summarized in Figure 18
Figure 18 Size increase of respective PS-particles in dependence of the protein amount
The aggregation behavior in the range between 01 and 12 mg plasma proteins in relation
to the given surface area was comparable Only for very high amounts and thus
concentrations of proteins the size increased dramatically In order to be able to compare
with low abundant proteins a low amount of proteins (1 mg) for the given surface area
was chosen for all experiments with the isolated protein fractions Similar particles have
already been under investigation in a likewise approach by Mohr et al who investigated
the aggregation behavior in concentrated human serum and diluted human serum by a
factor of ten But in contrast to the work presented here the amount of particles was also
reduced by a factor of ten115 Therefore and because of the use of serum instead of
plasma trends can be compared but not the absolute results of the DLS measurements
For the study presented here human plasma was the protein source of choice because of
the great importance of the low abundant proteins (see also page 27) Mohr et al
determined the size increase of non-functionalized PS and PS-NH2 particles to be
independent of the protein concentration while the aggregate formation of PS-COOH
particles was strongly dependent on the surrounding serum concentration115 The results
presented here show a similar trend While the size increase of PS and PS-NH2 particles
was found to be moderate with increasing protein concentration the size of PS-COOH
particles increased significant with increasing protein concentration
40 In Figure 19 the autocorrelation functions (ACFs) of a mixture of the respective PS-particle
and FPlasma-wo-IgG-HSA (A) or concentrated human plasma (B) are shown exemplarily where
g1(t) is the field correlation function and res the residuum between the fits and data
Measurements were performed at 37 degC for better in vivo mimicking The force fit
(indicated by the red line Figure 19A) could perfectly describe the ACF of the mixture of
nanoparticles and FPlasma-wo-IgG-HSA In contrast an additional aggregate fraction (indicated
by the blue line Figure 19B) was observed for the particles and plasma Smaller scattering
angles like eg 30deg or 60deg are more sensitive for the detection of a small amount of
formed bigger species within a mixture under investigation compared to bigger scattering
angles Therefore these angles give the best information about aggregation 30deg
measurements are the most sensitive ones and the corresponding intensity contribution
(I) and ACFs are therefore shown in this work with favor But 30deg measurements are also
most prone to artefacts Thus 60deg data are sometimes shown instead of 30deg ACFs
Figure 19 A) ACFs of the different particles in isolated FPlasma-wo-IgG-HSA at Θ = 60deg including data points (bull) and the forced fit as the sum of the individual components (red) with the corresponding residuals resulting from the difference between data and fit B) ACFs of the different particles in human plasma at Θ = 60deg including data points (bull) forced fit (red) and fit with additional aggregate function (blue) with the corresponding residuals resulting from the difference between data and the two fits
Results and Discussion 41 Table 3 gives an overview of the DLS results of all uncoated particles after direct exposure
to the different protein fractions obtained by affinity chromatography In addition
measurements were also performed in human plasma and commercially available
proteins in buffer IgG was purchased from privigenreg as solution for infusion with a purity
98 The hydrodynamic radius in running buffer was determined to be lt1Rhgtz-1 = 55 nm
which is in good agreement with the value for FIgG (lt1Rhgtz-1 = 68 nm) The small deviation
can be related to the small amount of other ingredients like eg L-prolin Human serum
albumin was purchased from sigma as lyophilized powder with a purity of gt99 With DLS
the radius in the running buffer was determined to be of lt1Rhgtz-1 = 57 nm Small
aggregates were observed that explain the slightly bigger value compared to FHSA (of
lt1Rhgtz-1 = 31 nm) Human plasma was used undiluted in order to be as close as possible
to in vivo conditions
First of all it was noted that all uncoated particles aggregated in human plasma A size
increase with values between Rh(Agg) = 174 nm and Rh(Agg) = 292 nm was measured
Next it was found that the non-functionalized polystyrene particle changes its size in
nearly every protein fraction In contrast the amino-functionalized particle remained
stable except in the presence of IgG This is significant considering that the hard corona
formed around these two nanoparticles in human plasma is very similar as shown in
Figure 20 Therefore the relevant protein probably is part of the soft corona which can so
far only be studied with DLS The absence of a detected size increase does therefore also
not mean that there is no corona present It just cannot be detected due to the sensitivity
of the methods It is only possible to detect additional sizes in the plasma particle
mixture if the intensity fractions (i e amplitudes) of the newly formed complexes surpass
the detection limit for DLS In detail intensity fractions between 3 (for sizes outside the
size range of the original components) and 20 (for sizes in the size range of the original
components) of newly formed particles are necessary to be detected by the described
fitting procedure
42 Table 3 Size changes of the uncoated nanoparticles after direct exposure to human plasma or the obtained protein fractions was measured by DLS Size increase of nanoparticles incubated in the respective protein fraction is calculated based on the size value for the uncoated nanoparticles measured in PBS (Reference value Figure 15)
Concentrated human plasma for in vivo mimicking
For completeness the same procedure was done for the different protein fractions
obtained via anion exchange chromatography Table 4 summarizes the results
Whereas PS-COOH is the only particle that shows no significant size increase in
commercially available HSA it is now the only particle showing a significant increase in
elution E1 that is lacking of HSA This indicates that HSA has some stabilizing effect on PS-
COOH when it comes to aggregation In general the size increases are moderate in the
different elution fractions The sole exception is the non-functionalized polystyrene
particle that shows aggregation behavior in E2 and E3 Both protein fractions are
dominated by albumin which correlates with the observed size increase of PS in FHSA as
well as commercially available HSA in buffer
Results and Discussion 43 Table 4 Size changes of the uncoated nanoparticles after direct exposure to human plasma or the obtained protein fractions was measured by DLS Size increase of nanoparticles incubated in the respective protein fraction is calculated based on the size value for the uncoated nanoparticles measured in PBS (Reference value Figure 15)
In order to monitor the reproducibility or rather the sensitivity of the applied method the
aggregation behavior of the different PS-particles was investigated in a solution of
commercially available albumin as well as IgG in two different solutions On the one hand
the proteins were dissolved in PBS buffer and on the other hand in running buffer as it is
the case for the protein fractions obtained from chromatography Figure 20 exemplarily
shows the results for non-functionalized polystyrene after exposure to IgG
44
Figure 20 A) Angular dependency of the inverse hydrodynamic radii as well as ACF at Θ = 30deg including data points (O) force fit (red) and fit including aggregate formation (blue) of PS in IgG and running buffer as medium B) Angular dependency of the inverse hydrodynamic radii as well as ACF at Θ = 30deg including data points (O) force fit (red) and fit including aggregate formation (blue) of PS in IgG and PBS buffer as medium
Figure 20A shows the angular dependency of the observed hydrodynamic radii as well as
the ACF at a scattering angle of 30deg including data points force fit and fit including
aggregate formation of PS in IgG and running buffer as the medium whereas Figure 20B
shows the corresponding results for PBS as medium under investigation In both cases
aggregates were formed in the size range between 312 and 326 nm in diameter For
human serum albumin in running buffer and PBS also comparable results were obtained
while aggregates in the size range between 352 and 374 nm in diameter were detected
(Figure 21)
Results and Discussion 45
Figure 21 A) Angular dependency of the inverse hydrodynamic radii as well as ACF at Θ = 30deg including data points (O) force fit (red) and fit including aggregate formation (blue) of PS in HSA and running buffer as medium B) Angular dependency of the inverse hydrodynamic radii as well as ACF at Θ = 30deg including data points (O) force fit (red) and fit including aggregate formation (blue) of PS in HSA and PBS buffer as medium
Additionally both proteins were analyzed with circular dichroism (CD) spectroscopy in PBS
as well as running buffer Again no significant change for the different solutions could be
observed The resulting spectra are shown in Figure 22 and are in good agreement with
spectra reported in literature7 9 130 Therefor it can be assumed that both proteins have a
similar secondary structure in both buffers under investigation
46
Figure 22 A) CD spectrum of IgG in PBS and running buffer at 37 degC with c = 1 gL B) CD spectrum of HSA in PBS and running buffer at 37 degC with c = 1 gL
323 HARD PROTEIN CORONA ANALYSIS
To study the hard protein corona the nanoparticles were incubated in human plasma
Particles in complex with proteins were separated from free protein via centrifugation and
redispersed in PBS Zeta potentials the amount of adsorbed protein and the hard protein
corona pattern were analyzed
In agreement with results found in literature124 the surface charge indicated by the zeta-
potential after the incubation in human plasma is the same for all functionalization types
in the range between ζ = - (32-38) mV whereas prior to incubation differences related to
the surface functionalization were measured The change in the detected zeta potentials
to negative values in a similar range makes clear why the different PS particles show
similar aggregation behavior in concentrated human plasma independent of their surface
functionalization When the nanomaterial is introduced into plasma the surface is
covered with proteins and the initial surface charge masked by the protein corona The
amount of bound proteins after incubation in human plasma was quantified via a Pierce
660 nm assay Interestingly the hard corona of all particles formed after exposure to
human plasma contains nearly the same amount of proteins for all particles in the range
between ~ 275 and 326 microg proteins per 005 m2 particle surface area (Figure 23) but
when analyzing the formed hard protein corona profile via SDS-PAGE the differences
between the particles becomes apparent (Figure 23) While the protein pattern of PS and
PS-NH2 are very similar the one of PS-COOH differs a lot The same phenomenon was
Results and Discussion 47 observed via LC-MS and is shown in Figure 24 A detailed list of data is given in the
supplementary information
Figure 23 A) SDS-PAGE of protein coronas that were formed upon incubation of the different PS-particles in concentrated human blood plasma B) Hard corona analysis by protein quantification and ζ-potential measurement
Based on the LC-MS data single protein bands in the patterns obtained from SDS-PAGE
could be related to specific proteins For PS and PS-NH2 nanoparticles intense bands at
~ 38 kDa belonging to clusterin ~ 28 kDa corresponding to apolipoprotein A-I and ~ 9 kDa
corresponding to apolipoprotein C3 can be seen in Figure 21 For PS-COOH nanoparticles
the protein bands at ~ 64 kDa and ~ 47 kDa can be related to the alpha and beta chains of
fibrinogen The two bands at lower molecular ranges at ~ 28 kDa and ~ 9 kDa also
correspond to the already mentioned proteins apolipoprotein A-I and C3
LC-MS data confirmed that the protein coronas formed on PS and PS-NH2 nanoparticles
contain mostly clusterin and apolipoproteins A-I and A-IV that can be summarized
altogether as lipoproteins PS-COOH particles on the other hand also adsorbed a lot of
fibrinogen on its surface upon incubation that is part of the coagulation proteins
illustrated in red in Figure 24 These results are again in good agreement with the
obtained results from Mohr et al after incubation of the already mentioned related
particles in human serum For PS and PS-NH2 particles the reported protein coronas are
48 also very similar and contain mostly lipoproteins while the profile of PS-COOH particles
after serum incubation differs and contains also a high amount of coagulation proteins115
To sum up despite somehow similar formed hard coronas on PS and PS-NH2 the stability
of both in the respective protein mixtures differ a lot This leads to the assumption that
the proteins leading to significant size increases are only present in the soft corona In
addition the masking of particle surface charge by mostly negative plasma proteins
explains the similar aggregation behavior of all particles in concentrated human plasma
Figure 24 Plasma composition in comparison to the hard corona composition of each particle analyzed via LC-MS (LC-MS measurements performed by Johanna Simon)
324 TAILORING THE HARD CORONA
The so far discussed polystyrene particles were modified by coating their surface with the
obtained protein fractions from affinity chromatography This way a predetermined
protein corona was created that will further on be related to as the so called ldquoartificial
protein coronardquo Nanoparticles were incubated with different protein fractions or
individual proteins for 1 h at 37 degC (5x10⁻³ m2 overall surface area mg protein)
Results and Discussion 49 Afterwards unbound and weakly bound proteins were removed via centrifugation The
resulting pre-coated nanoparticles were characterized regarding their zeta potential as
well as their size (Table 5)
Table 5 Physiochemical parameters of nanoparticles pre-coated with different protein fractions or individual proteins
Table 5 shows the resulting size increase of the different PS particles as well as the zeta
potential upon coating with the different protein fractions While the coating in HSA and
the low abundant protein mixtures FPlasma-wo-IgG-HSA and FPlasma-wo-IgG leads to no significant
size increase compared to the values of the uncoated ones (Figure 17) the coating with
HSA-depleted plasma and IgG resulted in slight or distinct increases in the particle size For
example PS-COOH particles formed species with Rh = 374 nm after incubation with IgG
The detected size increases can either be caused by protein adsorption only but also by
forming aggregates upon coating The small size increases can be assumed to be caused
by protein adsorption only In addition the overall negative zeta potentials indicate that
proteins are present on all nanoparticles after coating In order to exclude the influence of
centrifugation on the particle size after redispersion PS-COOH was exemplarily
centrifuged without prior incubation It turned out that the radius of PS-COOH remains
constant within the error margin of DLS (see also Figure 25A) In addition the effect of
centrifugation on the particle stability after incubation with proteins (in this case human
serum) was investigated using DLS After one centrifugation step non-functionalized PS
50 remained stable mirrored by the slope of the angular dependency of the inverse
hydrodynamic radii (see Figure 25B) A size increase of ~ 20 nm (radius) originated in the
formed protein layer was detected But already after the second centrifugation step the
particles precipitated during the DLS measurement indicated by the negative slope of the
angular dependency of the inverse hydrodynamic radii The redispersion after the fourth
centrifugation step was difficult and already formed aggregates bigger species
sedimented The sample taken for DLS is therefore not representative and explains why
the data points are shifted to smaller radii again (but very broad)
Figure 25 A) Angular dependency of the inverse hydrodynamic radius of PS-COOH (bull) and centrifuged PS-COOH (bull) B) Angular dependency of the inverse hydrodynamic of PS (bull) PS after incubation in human plasma and one centrifugation step (bull) two (bull) three (bull) and four centrifugation steps (bull)
According to the above described DLS results the PS particles in Table 5 were only
centrifuged once after incubation in the different protein fractions Those pre-coated
nanoparticles were used to investigate the stability of an ldquoartificial protein coronardquo under
in vivo conditions and its impact on cellular uptake
A murine macrophage-like cell line (RAW 2647) was used to study whether it is possible
to specifically trigger cellular uptake by pre-coating of nanoparticles with different protein
fractions obtained after plasma fractionation Flow cytometry analysis gave quantitative
information about uptake behavior (Figure 26) and confocal laser scanning microscopy
Results and Discussion 51 (cLSM) (Figure 27) was used to visualize the uptake process To ensure the absence of any
additional proteins cellular uptake studies were carried out in medium without plasma or
serum proteins To demonstrate the effect of pre-coating cellular uptake behavior of the
uncoated (ldquonakedrdquo) particles is represented by the red line in Figure 26
Figure 26 Flow cytometry analysis of RAW 2647 cells incubated with uncoated or pre-coated nanoparticles for 2 h in DMEM without additional proteins Nanoparticles were pre-incubated with individual proteins (A) or different protein fractions (B) separated from unbound proteins via centrifugation and added to the cells with a nanoparticle concentration of 75 microgmL Relative median fluorescence intensity (rMFI) values are shown as mean plusmn SD of triplicates The red line serves as a reference for cellular uptake of uncoated nanoparticles (rMFI = 1) A studentacutes t-test was performed to demonstrate the difference in uptake behavior of uncoated and pre-coated nanoparticles (indicated by p values lt 001 or p lt 0001) (all cell experiments were performed by Johanna Simon)
In general non-functionalized and amino-functionalized particles (Figure 26) showed
similar uptake trends after pre-incubation Especially pre-incubation with FHSA (2) and
FIgGHSA (3) caused strongly enhanced cellular uptake (p lt 0001) in comparison to
uncoated (ldquonakedrdquo) particles There was no significant size increase observed for PS and
PS-NH2 particles pre-coated with FHSA As cellular uptake was strongly altered due to pre-
52 incubation with FHSA it illustrates that cellular uptake is triggered by protein adsorption
Confocal laser scanning microscopy (Figure 27) confirmed the intracellular localization of
the pre-coated nanoparticles Analog results were obtained for PS-COOH particles pre-
coated with FHSA (2) and FIgGHSA (3) although this effect was not as significant (p lt 001)
as for PS and PS-NH2 In addition pre-coating with FIgG (4) caused increasing cellular
uptake compared to uncoated particles as well Hence there was a size increase
measured after the particles were pre-incubated with FIgG (Rh values Table 5) Therefore
it was not possible to clearly demonstrate that cellular uptake is triggered by the
adsorption of IgG or if uptake behavior is altered due to the size increase Macrophages
take up nanoparticles by several mechanisms131 132 One of the most interesting uptake
mechanism is called phagocytosis that also enables the uptake of bigger species
Figure 27 cLSM images of RAW2647 cells after incubation with pre-coated nanoparticles for 2h in DMEM without additional proteins Exemplary shown for PS pre-coated with HSA (A) PS-COOH pre-coated with IgG (B) PS-NH2 pre-coated with IgG (C) Scale bars = 10 microm
Going further the influence of pre-coating with various low-abundant protein fractions
(Figure 26B) was studied Here it was found that pre-coating with some protein fractions
resulted in significantly decreased cellular uptake (p lt 0001 ) compared to uncoated
nanoparticles This effect was caused by the low abundant protein fraction FPlasma-wo-HSA-IgG
for PS and PS-NH2 particles In contrast pre-coating of PS-COOH with FPlasma-wo-HSA-IgG
revealed no significant influence on uptake behavior Interestingly pre-coating of PS-
COOH with FPlasma-wo-IgG caused strongly reduced uptake compared to uncoated particles
Results and Discussion 53 Importantly there was only a slight change (Table 5) observed of PSPS-NH2 pre-coated
with FPlasma-wo-HSA-IgG and PS-COOH pre-incubated with FPlasma-wo-IgG This highlights that
cellular uptake is strongly influenced by adsorption of the less abundant plasma proteins
on the nanoparticlesacute surface124
In addition it was analyzed whether the pre-coating ratio between nanoparticles and
proteins had an effect on cellular uptake behavior As exemplary shown in Figure 28 PS-
COOH nanoparticles were pre-coated with varying amounts of IgG depleted plasma
Figure 28 Flow cytometry analysis of RAW 2647 cells incubated with nanoparticles pre-coated with varying amounts of Ig depleted plasma for 2 h in DMEM without additional proteins Different pre-coating ratios between the amount of proteins (in mg) and the defined surface of nanoparticles (510-3 m2) were chosen The pre-coated nanoparticles were isolated via centrifugation and added to the cells with a nanoparticle concentration of 75 microgmL Relative median fluorescence intensity (rMFI) values are shown as mean plusmn SD of triplicates The red line serves as a reference for cellular uptake of uncoated nanoparticles (rMFI = 1) A studentacutes t-test was performed to demonstrate the difference in uptake behavior of uncoated and pre-coated nanoparticles (indicated by p values lt 001 or p lt 0001) (all cell experiments were performed by Johanna Simon)
A strong correlation between the amount of proteins used for pre-coating and cellular
uptake was found (Figure 28) Going down to a pre-coating ratio of 150 microg proteins per of
5x10⁻³ m2 NP surface area (1) there was no significant difference between the uptake
behavior of coated and uncoated NP Clearly the strongest influence on uptake behavior
54 was found for nanoparticles pre-coated with the chosen ratio of 5x10⁻³ m2 overall surface
area per mg protein (described in materialmethods and shown in Figure 26)
Altogether these results demonstrate the great potential to trigger and control uptake
behavior via pre-coating of nanoparticles with specific proteins or protein fractions It was
shown that the uptake behavior is critically altered due to pre-coating of nanoparticles
with distinct protein fractions Proteins were identified (eg HSA) which caused a
significant increase in uptake More interestingly on the other side it was possible to
demonstrate that uptake is significantly decreased if particles are pre-coated with certain
low abundant protein fractions
In order to investigate the stability of the artificial preformed protein corona under
physiological conditions pre-coated nanoparticles were exposed to human plasma and
size changes monitored with DLS The results are summarized in Table 6
Table 6 Size changes of pre-coated particles after direct exposure to human plasma Intensity fractions of the aggregate I(30deg) are exemplified for a scattering angle of 30deg Size increase is calculated based on the values for uncoated nanoparticles (see Figure 17) or pre-coated nanoparticles in PBS (see Table 5)
1compared to values in Figure 17 2compared to values in Table 5
Table 6 shows the detected hydrodynamic radii of formed aggregates upon exposure of PS
particles to concentrated human plasma In order for better comparability these values
were transferred into a corresponding size increase compared to the initial ldquonakedrdquo or
Results and Discussion 55 coated particles In addition the intensity contribution of the newly formed species on the
overall scattered light at a scattering angle Θ = 30 deg is shown This value is proportional to
concentration x molecular weight of the formed aggregates
The amino-functionalized as well as the non-functionalized particle could be stabilized
against aggregation via a pre-coating with FPlasma-wo-IgG-HSA (Table 6) This is of great interest
as the original particles formed aggregates in human plasma in the size range of
Rh(Agg)PS = 292 nm and Rh(Agg)PS-NH2 = 195 nm In contrast the pre-coating of PS-COOH
with FPlasma-wo-IgG-HAS leads to the formation of aggregates in a size range of
Rh(Agg)PS-COOH = 168 nm (Table 6)
The principal method to stabilize nanoparticles against aggregation in human plasma via
pre-coating with an artificial protein corona is illustrated in Figure 29 Furthermore the
ACFs of the uncoated as well as the pre-coated PS particles in human plasma are shown
exemplary
Figure 29 Pre-coating of nanoparticles (Rh(cp)) with distinct low abundant protein fractions stabilizes nanoparticles against aggregation in human plasma A) DLS analysis demonstrates aggregation formation (Rh(agg)) of PS particles (Rh(p)) in human plasma ACF of PS particles in human plasma at Θ = 30deg is shown B) Pre-coating of PS particles with FPlasma-wo-IgG-HSA prevents the formation of aggregates ACFs of the PS particles in isolated FPlasma-wo-IgG-HSA at Θ = 30deg is illustrated
56 Most intriguingly PS-COOH and PS-NH2 pre-coated with IgG remained stable after
exposure to human plasma However those particles showed a size increase after pre-
coating (values see Table 5) in contrast to PS and PS-NH2 particles pre-coated with FPlasma-
wo-IgG-HSA (values see Table 5)
In order for completeness and better illustration all ACFs of naked as well as coated
particles under in vivo conditions are shown in Figure 30 If no additional size could be
detected in regards to all scattering angles no additional force fit was applied
A)
Results and Discussion 57
B)
Figure 30 A+B) Angular dependency of the inverse hydrodynamic radii as well as ACF at Θ
= 30deg including data points (bull) force fit (red) and fit including aggregate formation (blue)
of naked as well as coated PS particles in concentrated human plasma (comparable to in
vivo conditions)
In order to get a better understanding of the obtained DLS results SDS-PAGE was used to
analyze the protein patterns of the different PS particles after incubation in the different
protein fractions as well as after subsequent incubation in human plasma Both
incubations were carried out for 1 h at 37 degC In Figure 31 the protein patterns are shown
ldquoSrdquo describes the single incubation of PS particles in the respective protein fraction
whereas ldquoDrdquo describes the incubation in a protein fraction with subsequent incubation in
human plasma
58
Figure 31 Protein patterns of formed hard coronas with single (S) as well as double incubation with subsequent plasma incubation (D) of PS particles in A) IgG B) HSA C) FPlasma-wo-IgG and D) FPlasma-wo-IgG-HSA
As already shown in Figure 23A the protein patterns of the three different polystyrene
particles show very intense bands in the range between ~35-45 kDa after incubation in
human plasma Figure 31A shows single incubation in FIgG as well as double incubation in
FIgG and human plasma The results of the single incubation show that the protein corona
pattern varies with the pool of proteins present in the incubation medium For the double
incubation the patterns look very similar to the corresponding patterns of the IgG-coated
particles Significant is the absence or very weak presence of proteins in the range
between ~35-45 kDa (marked in red) that are the most abundant ones for single
incubation in human plasma This shows that the once formed protein corona is stable
even after re-introduction in human plasma For the single incubation of PS particles in
Results and Discussion 59 HSA (Figure 31B) the protein patterns also show the absence or very weak presence of
protein bands at the already described molecular weight range Nevertheless after
subsequent incubation in human plasma a protein band at ~ 28 kDa becomes visible for
all particles Figure 31C shows the protein patterns for single and double incubation with
IgG depleted plasma Despite looking very similar for the single as well as double
incubation in the first place differences in the protein patterns could be observed for PS
and PS-NH2 in the higher molecular range between ~ 62 and 98 kDa As requested also for
the incubation in HSA this shows that the protein corona formation continues during the
double incubation This could be an explanation for the detected aggregate formation of
the coated particles that were observed with DLS upon exposure to human plasma Figure
31D shows the protein patterns after single as well as double incubation of the three PS
particles The most intense protein bands at ~ 28 kDa and ~ 50 kDa for the single
incubation remain the most intense bands also after subsequent incubation in human
plasma Despite the appearance of additional protein bands this indicates that the
protein corona formed upon single incubation is somehow solid Again a correlation to
the stabilization of coated PS and PS-NH2 in concentrated human plasma can be drawn
Taken together these results show that an artificially created protein corona can enable
the stabilization of nanoparticles against aggregation in human plasma and moreover
offers the possibility to specifically trigger cellular uptake behavior Once formed an
artificially created protein corona remains stable in particular cases when re-introduced in
human plasma
325 THE IMPACT OF PROTEIN CONCENTRATION ON PARTICLE AGGREGATION AND STABILIZATION VIA PRE-COATING
When inspecting Table 3 (see chapter 324) the three differently functionalized
polystyrene nanoparticles change their size in some protein fractions only very slightly As
already pointed out aggregate formation can in general involve nanoparticle bridging the
adsorption of proteins or protein-protein aggregates on the nanomaterialacutes surface This
chapter addresses the question which processes are involved when DLS detects small size
increases of the particles It is possible that the small size increases can be related solely
60 to the formation of a protein corona around the nanomaterials Another explanation
could also be a small percentage of bridged nanoparticles due to incomplete protein
coverage on the particlesacute surfaces So far the processes cannot be distinguished with
DLS
In order to get a better understanding the aggregation of PS-COOH in FPlasma-wo-IgG was
chosen for further investigations For the conditions discussed in the previous chapter a
size increase of PS-COOH particles in the respective protein fraction of 45 was detected
Theoretically 1 mg protein for the discussed particle surface area of 5x10⁻⁴ m2 would be
enough to cover the entire particle surface area FPlasma-wo-IgG contains mostly HSA As
approximation an overall molecular weight of ~ 70 kDa can therefore be assumed This
means that in 1 mg overall protein amount a number n of 86x1012 single proteins is
present As human serum albumin belongs to the group of globular proteins (see also
introduction part of this work) the overall surface area of proteins can be estimated with
the following equation
119904119906119903119891119886119888119890 119886119903119890119886 119901119903119900119905119890119894119899119904 = 119899 times 119874 (13)
119874 = 41205871199032 (14)
Here n describes the number of proteins and O the surface area of one globular protein
With DLS a radius r of lt1Rhgtz-1 = 76 nm for FPlasma-wo-IgG was determined (see also Table
2 chapter 31) Using equation (14) for the surface area of a sphere a surface area of
726 nm2 for one protein can be calculated When applying equation 13 this leads to an
overall protein surface area of 60 cm2 a value that is 125 times bigger than the particle
surface area of 5 cm2 Nevertheless FPlasma-wo-IgG still represents a mixture of proteins with
different affinities to PS-COOH It is possible that only distinct proteins adsorb onto the
nanomaterialacutes surface and the coverage is not complete In order to investigate this the
amount of present proteins during incubation of PS-COOH was varied and the influence
on particle size investigated via DLS Figure 32 shows the ACFs including data points force
fit and fit considering aggregate formation of each sample at Θ = 60deg
Results and Discussion 61
Figure 32 Autocorrelation function at Θ = 60deg of PS-COOH in FPlasma-wo-IgG including data points (bull) force fit (red) and fit with aggregate formation (blue) From A to D the protein amount per surface area was increased by a factor of 16
Figure 33 shows the respective size increase of formed aggregates in each sample
together with the intensity contribution (I) at Θ = 30deg of aggregate (green) and particle
(red)
62
Figure 33 Size increase of PS-COOH in FPlasma-wo-IgG with increasing amount of proteins per given surface area of nanomaterial The intensity contribution at Θ = 30deg to the overall scattered light of aggregates is illustrated in green the one of particles in red
In general the size of formed aggregates increased with increasing amount of present
proteins during incubation For very low protein concentrations (see Figure 32 and 33 A +
B) a size increase of 24 ndash 27 was observed This corresponds to 12 ndash 17 nm particle
increase in radius and is in good agreement with the observed size increase of PS-COOH in
concentrated human serum after one centrifugation step representing the formed hard
corona under saturated conditions (see Figure 25 size increase ~ 20 nm in radius) In
addition the particle in original size was not detectable anymore within the mixture the
formed small ldquoaggregatesldquo contributed 99 to the overall scattered light at Θ = 30deg
When the amount of proteins was increased to 1 mg (sample C) or 2 mg (sample D) per
given surface area the PS-COOH particles increased ~ 60 in radius For 1 mg the
particles predominated the scattered light at Θ = 30deg with a contribution of I = 75
while for 2 mg the aggregates predominated with I = 62 This indicates that with
increasing amount of proteins the degree of aggregation increases In addition the
overall size increase contradicts the assumption of incomplete surface coverage leading to
bridged nanoparticles for the determined size increase of PS-COOH in FPlasma-wo-IgG that
was observed and discussed in the previous chapter 324
A B C D E F0
50
100
150
200 size increase
I (30deg) aggregate
I (30deg) particle
Results and Discussion 63 The presumption that bridged nanoparticles are not the origin for the observed small size
increases becomes even more likely when looking at sample E and F in Figure 32 and 33
These samples represent the highest amount of proteins during incubation of PS-COOH
particles in FPlasma-wo-IgG The observed size-increase amounts 127 ndash 194 and again the
aggregates predominated the scattered light for very high protein concentrations (sample
F) All in all the DLS results suggest that at very low concentration the proteins adsorb
onto the nanomaterialacutes surface and tend to induce protein-protein aggregation on the
nanoparticles that also involve the accumulation of particles when the protein amount is
increased
In order to tighten these suggestions chosen samples have also been investigated with
FCS performed by Jennifer Schultze (PhD student in the group of Dr Kaloian Koynov AK
Butt Max-Planck-Institute for Polymer Research Mainz) In contrast to DLS FCS only
detects fluorescent species within the sample under investigation namely the particles
An averaged size can be detected and in addition the determined fluorescent brightness
(in counts per fluorescent object) implies information about possible aggregate formation
containing multiple particles In general FCS measurements of the PS particles under
investigation included difficulties The concentration used for DLS measurements is very
low in comparison to the ones than are usually used for FCS measurements (magnitude of
10) Moreover the particles are very hydrophobic and tended to adsorb onto the partially
hydrophobic (due to surface modification) bottom glass slide of the used FCS
measurement chambers (Nuncreg Lab-Tek) Therefore only trends can be observed and
discussed For PS-COOH particles in buffer a hydrodynamic radius of Rh ~ 60 nm was
determined by FCS which is in good agreement with the size determined by DLS The
fluorescent brightness was in the range of 66 kHz for the used excitation laser intensity
When 5x10⁻⁴ m2 surface area of PS-COOH particles were incubated in 1 mg FPlasma-wo-IgG
protein solution (sample C) the averaged hydrodynamic radius increased to Rh ~ 80 nm
Simultaneously the fluorescent brightness increased to 440 kHz This means that the
small size increase that was also detected in DLS includes the formation of aggregates
containing more than one particle When the amount of proteins during incubation was
quadruplicated (sample F) the averaged detected size using FCS was in the range of Rh ~
110 nm and the fluorescent brightness at 250 kHz The trend for increasing size with
increasing protein amount during incubation correlates again with the DLS measurements
64 In addition the formed aggregates contained once more multiple PS-COOH particles
which became apparent in the fluorescent brightness The sample C was measured 1 h
later than sample F which could be one possible explanation for the higher brightness
Still the trend of increasing the fluorescent objectacutes brightness after incubation in FPlasma-
wo-IgG is valid
Altogether the results presented in this chapter lead to the assumption that aggregate
formation includes the formation of species containing multiple particles As the
aggregate size and degree of aggregation increase with increasing protein amount during
incubation the process is supposed to involve protein-protein aggregation on the
nanomaterialacutes surface that lead to the accumulation of particles
Another experimental setup that sheds light on the question whether the PS-COOH
surface area of 5x10⁻⁴ m2 is covered completely when incubated in 1 mg FPlasma-wo-IgG is the
pre-coating procedure (see also chapter 324) with subsequent introduction of coated
particles into concentrated human plasma The amount of proteins per given surface area
during incubation was therefore doubled tripled and quadruplicated Afterwards the
physicochemical parameters like size and zeta potential as well as the stability of coated
particles against aggregation was monitored using DLS The size of the coated particles
determined via DLS and the zeta potential are summed up in Table 7
Table 7 Physicochemical parameters of coated PS-COOH particles in FPlasma-wo-IgG
The size of the coated particles determined by DLS was found to be independent of the
protein amount used for the coating procedure in the range of lt1Rhgtz-1 = 87 ndash 92 nm
Also for the zeta potential no significant trend for varying protein amount was observed
Results and Discussion 65 The coated as well as non-coated particles in Table 7 were introduced into concentrated
human plasma and their stability against aggregation monitored using DLS
Figure 34 ACF at Θ = 30deg including data points force fit and fit with aggregation in concentrated human plasma of A) PS-COOH B) PS-COOH coated with 1 mg FPlasma-wo-IgG C) PS-COOH coated with 2 mg FPlasma-wo-IgG D) PS-COOH coated with 3 mg FPlasma-wo-IgG E) PS-COOH coated with 4 mg FPlasma-wo-IgG F) Observed aggregated sizes in concentrated human plasma of samples A ndash E
66 Figure 34 shows the ACF of ldquonakedrdquo as well as coated PS-COOH with FPlasma-wo-IgG in
concentrated human plasma at Θ = 30deg In general all coated particles formed aggregates
in the size range of lt1Rhgtz-1 (agg) = 207 - 222 nm The observed size increase was
therefore independent of the protein amount used for the pre-coating procedure The
observed results are in good agreement with the already discussed results of chapter 324
with obtained aggregates in the range of lt1Rhgtz-1 = 256 nm for coated PS-COOH particles
with 1 mg FPlasma-wo-IgG (see also Table 6) This underlines the previous discussed
assumption that the coverage of PS-COOH particles in FPlasma-wo-IgG is complete even for the
chosen and in comparison low protein amount of 1 mg 5x10⁻⁴ m2 particle surface area
To make sure that the entire particle surface area is covered LC-MS measurements were
performed 05 mg FPlasma-wo-IgG were used for the incubation of 5x10⁻⁴ m2 overall surface
area of PS-COOH particles The coated particles were afterwards incubated in
concentrated human plasma and the protein corona profile determined after single and
double incubation via LC-MS Table 8 presents the top 20 identified proteins of the protein
coronas formed on PS-COOH particles after incubation in concentrated human plasma (1)
IgG-depleted plasma (2) and IgG-depleted plasma with subsequent incubation in
concentrated human plasma (3) Especially the three highest abundant proteins after
incubation in IgG-depleted plasma namely fibrinogen gamma chain fibrinogen beta chain
and fibrinogen alpha chain remain the most abundant proteins present in the particlesacute
protein corona even when reintroduced in concentrated human plasma For single
incubation in concentrated human plasma the most abundant protein within the particleacutes
hard corona was vitronectin In addition to the enrichment of fibrinogen the amount of
apolipoprotein A-I is significantly reduced for single and double incubation (see sample 2
and 3 in Table 8)
Altogether the presented results confirm that the chosen ratio for the pre-coating
procedure introduced in the previous chapter is sufficient for complete surface coverage
The elevation of protein amount did not lead to a change in particle stability against
protein induced aggregation
Results and Discussion 67 Table 8 Top 20 identified proteins in the protein corona formed on PS-COOH particles after incubation in concentrated human plasma (1) IgG-depleted plasma (2) and IgG-depleted plasma with subsequent incubation in concentrated human plasma (3) determined via LC-MS (LC-MS measurements were performed by Johanna Simon)
326 USING PROTEIN MIXTURES AS SURFACTANTS FOR PARTICLE STABILIZATION
Going one step further the question arose whether it is possible to use the obtained
protein fractions for stabilization of particles from the beginning meaning as amphiphilic
stabilizer (ldquosurfactantrdquo) during synthesis FPlasma-wo-IgG was chosen as the most suitable
protein mixture as it is the protein mixture with the highest concentration of proteins
after removal of one high abundance protein The critical aggregation or micelle
concentration (CMC) determination of the respective protein solution is shown in Figure
35
68
Figure 35 Surface tension of a solution of FPlasma-wo-IgG in water in dependence to the
protein concentration
As FPlasma-wo-IgG represents a mixture of proteins no distinct CMC or critical aggregation
concentration could be determined Moreover the trend of surface tension at the
airwater interface shown in Figure 29 shows approximately two plateaus This indicates
that micelle (or aggregate) formation takes place subsequent when reaching a CMC of a
protein component in the still very complex mixture In addition the values for
amphiphile (ldquosurfactantrdquo) concentration are very low compared to conventional ones such
as sodium dodecyl sulfate (SDS) SDS has a CMC in water of 82 mM As IgG depleted
plasma contains mostly albumin a molecular weight of the protein mixture can be
assumed in the range of 70 kDa 02 gL of proteins would therefore correspond to a 0003
mM solution This would correlate to a reduction of amphiphile amount with a factor of
2500 compared to SDS As the surface tension in emulsion is much bigger than for the
airwater interface only and the surfactant under investigation very complex an amount
of 1 gL for the polymerization of styrene was chosen (~4 w)
Polystyrene was synthesized via direct mini-emulsion using either V59 or V70 as initiator
V59 was chosen because it is the standard initiator of the so far discussed particles V70
was chosen in addition because it has a lower half-life decomposition temperature than
V59 (67 degC) in fact 30 degC which is lower than the denaturation temperature of proteins
00 01 02 03 04 0545
50
55
60
65
70
75
SF
T [
mN
m]
conc [gl]
Results and Discussion 69 Both structures are shown in Figure 36 The exact sample composition will be given in the
experimental part
Figure 36 Chemical structure of V59 (left) and V70 (right)
After sonication and stirring over night at 30 degC or rather 67 degC the sample with V70 at 30
degC did not lead to particle formation which is probable due to an inefficient radical
formation or capture of the formed radicals by presence of the proteins amino groups133
However for the sample with V59 as initiator particles with a diameter of 230 nm could
be obtained The corresponding DLS results as well as TEM images are shown in Figure 37
The molar ratio of monomersurfactant was calculated to ~ 137001 This is compared to
the lutensol stabilized particles discussed in this chapter very high (MS = 2901) and
underlines again the low protein amount needed for stabilization compared to low
molecular surfactants (see page 68) and also polymeric surfactants as lutensol
DLS measurements were repeated after four months in order to investigate the stability of
the respective dispersion No size change could be detected meaning that the dispersion
remained stable
When looking at the TEM images in Figure 37 the particles seem to be smaller than the
values determined by DLS The latter method is very sensitive towards bigger species
within the mixture and could therefore lead to bigger values By TEM imaging an average
radius in the range between 75 and 100 nm was observed
70
Figure 37 TEM images as well as DLS results of polystyrene with FPlasma-wo-IgG as stabilizer
For the evaluation of stability against aggregation the particle was introduced into
concentrated human plasma Figure 38A shows the ACF at 30deg Figure 38B the angular
dependency of the observed hydrodynamic radii
In the presence of concentrated human plasma aggregates were formed that are about
19 times bigger than the original particles The intensity contribution of formed
aggregates at Θ = 30 deg was determined to 41 This is comparable to the behavior of the
three different Lutensol stabilized polystyrene particles in plasma as discussed in chapter
322 But in contrast no additional chemical surfactant is needed
Figure 38 Angular dependency of the inverse hydrodynamic radii as well as ACF at Θ = 30deg including data points (O) force fit (red) and fit including aggregate formation (blue) of protein stabilized particle in human blood plasma
Results and Discussion 71 The protein stabilized particles were investigated via CellTiter-Glo Assay regarding their
cytotoxicity (Figure 39) For a concentration of 75 microgmL protein stabilized particles
reduced the metabolic activity of the RAW 2647 cells in an acceptable range of only
~10 This would be important for in vitro experiments that are typically performed under
these conditions Even when the amount of particles was doubled the majority of cells
kept their metabolic activity Lutensol stabilized particles showed almost no effect on the
metabolic activity of the cells
Figure 39 A) CellTiter-Glo Assay of PS with proteins as surfactant B) CellTiter-Glo Assay of Lutensol stabilized PS-particles (data in B provided by Johanna Simon)
SDS-PAGE was used to analyze the protein pattern of the particle itself and compared to
the one of IgG-depleted plasma as discussed previously The patterns are shown in Figure
40 The most abundant protein on the polystyrene particle is albumin that is also most
abundant in FPlasma-wo-IgG But in contrast to the mixture itself a second protein of ~ 98 kDa
is enriched on the nanomaterialacutes surface As already shown in Figure 31C the protein
corona patterns of PS PS-NH2 and PS-COOH stabilized with Lutensol also show more than
one intense protein band after incubation in FPlasma-wo-IgG Only PS-COOH shows protein
bands in the higher molecular range and there is only a very weak band at ~ 98 kDa On
the one hand this shows again that the most abundant proteins present in a mixture like
albumin are not necessarily most abundant in a particleacutes protein corona or have the
highest affinity to it As Lutensol AT50 is a nonionic surfactant with the molecular formula
C(16-18)O(CH2CH2O)50H and contains a PEG chain of about 50 monomers it plays an strong
role in the protein adsorption As shown in the literature PEGylated polystyrene particles
72 adsorb a lot of clusterin on their surface107 A corresponding protein band at 38 kDa can
be observed for non-functionalized PS in IgG depleted plasma as shown in Figure 31 as
well
In conclusion it is possible to stabilize PS particles with IgG depleted plasma without the
need of an additional low molecular weight surfactant The effect on the metabolic
activity of cells is suitable for in vitro experiments while the aggregation behavior in
concentrated human plasma is similar to the previously discussed Lutensol stabilized
polystyrene particles As a benefit the impact of Lutensol on protein adsorption can be
excluded
Figure 40 SDS-PAGE of A) PS stabilized with FPlasma-wo-IgG B) plasma and C) FPlasma-wo-IgG
327 SUMMARY
In this chapter the very complex overall process of nanomaterial-plasma interactions was
fragmented in low abundance protein and high abundance protein interaction Single
proteins or mixtures could be identified that play a major role in particle stability against
aggregation With respect to that polystyrene particles were coated with protein fractions
Results and Discussion 73 and decorated with a predetermined ldquoartificialrdquo protein corona Their effect on cellular
uptake in macrophages as well as stabilization against aggregation in concentrated human
plasma was demonstrated The protein fraction FPlasma-wo-IgG could be also used for the
stabilization of particles as ldquosurfactantrdquo during synthesis
Altogether this shows that the interactions between plasma proteins and nanomaterials
designed for biomedicine can not only limit their application but can in fact be used as
tool for the adjustment and fine tuning of the nanocarrieracutes physicochemical properties
The stability of predetermined hard coronas upon exposure to concentrated human blood
plasma opens the possibility of defining not only the chemical identity of nanomaterials in
the laboratory but moreover also the biological identity to a certain extend
74
33 HUMAN BLOOD PLASMA VERSUS SERUM
When looking in the literature many different protein sources are used for pre-in vivo
studies on nanomaterials Fetal bovine serum (FBS) is found as cell culture media
supplement and commercially available In 1975 Honn Singley and Chavin already
pointed out that a high variability of serum could be observed depending on charge and
supplier134 But also human serum or plasma comes into operation for pre-in vivo studies
Dawson and coworkers used human plasma to evaluate the differences in protein corona
formation on silica and polystyrene nanoparticles depending on the protein concentration
during incubation87 In contrast Walkey et al used human serum in order to investigate
the impact of size and surface chemistry on protein adsorption onto gold nanoparticles135
As already pointed out in the introduction part of this work human blood serum and
human blood plasma can be both obtained after blood withdrawal from probands But
they differ in their protein composition depending on the preparation method For the
recovery of plasma from blood an anti-coagulant has to be added in order to prevent the
blood from clotting The cellular fraction of blood can afterwards be removed via
centrifugation When the blood is allowed to clot prior to centrifugation human blood
serum is obtained that lacks of proteins that are part of the coagulation process The
situation becomes even more complex as different anti-coagulants can be used for
plasma stabilization Pozzi et al136 and Monopoli et al87 both used EDTA stabilized human
plasma for protein corona studies whereas Winzen et al used heparin stabilized plasma
for the same108 The effectiveness of EDTA is based on the complexation of ions that are
needed for enzymes as part of the coagulation process Heparin on the other hand
activates anti-thrombin and by this inhibits the coagulation cascade Very recently
Schoumlttler et al showed that the protein source as well as the added anti-coagulant affect
nanoparticle protein corona and cellular uptake137
In this chapter the influence of protein source and anti-coagulant on particle aggregation
is discussed CTMA-Cl stabilized polystyrene particles with amino groups on the surface
that are already published107 137 were introduced in human blood serum citrate stabilized
plasma heparin plasma FBS and FBS with additional heparin The aggregation behavior
was monitored using DLS Figure 41 42 and 43 show the corresponding results
Results and Discussion 75
Figure 41 Angular dependency of the inverse hydrodynamic radii of A) PS-NH2 and B) the
different protein sources
Arising from Figure 41B the z-averaged inverse hydrodynamic radii of the protein sources
differ a lot While human serum and citrate stabilized plasma show values between
lt1Rhgtz-1 = 18 nm (serum) and lt1Rhgtz
-1 = 21 nm (citrate plasma) the sizes of the other
three protein sources were determined to be in a smaller range of lt1Rhgtz-1 = 13-14 nm
The influence of the different protein sources on particle stability against aggregation is
shown in Figure 42 and 43
Figure 42 Size increase of PS-NH2 in the respective protein sources (Θ = 30deg)
0
200
400
600
800
siz
e incre
ase
FBS FBS +
heparin
heparin
plasma
citrate
plasma
serum
76
Figure 43 ACF at Θ = 30deg of PS-NH2 including data points (O) force fit (red) and fit
regarding aggregate formation (blue) in A) serum B) citrate plasma C) heparin plasma D)
FBS + heparin and E) FBS D) Aggregate sizes and intensity contribution at Θ = 30deg
determined by DLS
First of all all protein sources induce significant aggregate formation when PS-NH2 is
introduced into a respective solution When the amino-functionalized PS particle was
introduced into FBS aggregates were detected with a radius of Rh = 250 nm at Θ = 30deg
that corresponds to a size increase of ~ 380 compared to the initial particle When
heparin was added to FBS prior to the incubation with particles particle aggregates were
Results and Discussion 77 formed that are about 200 nm bigger in diameter than compared to the aggregate
formation of PS-NH2 in FBS solely This means that the anti-coagulant heparin has a
significant influence on particle-protein interactions
Figure 44 Structure of A) Heparin- and B) Citrate-anion
As shown in Figure 44A heparin is a polyanion with a disaccharide as repeating unit It
activates antithrombin and by this inhibits the coagulation cascade Due to the high
negative charge density in heparin it is supposed to strongly interact with a naomaterialacutes
surface The adsorption of heparin on the latter one could lead to interactions with mostly
negative plasma proteins resulting in aggregation
Next the formed aggregates in human serum or rather citrate stabilized plasma were
determined to be in the range between Rh (Θ = 30deg) = 466 nm and Rh (Θ = 30deg) = 486 nm
which is much bigger than the formed aggregates in all other protein sources On the one
hand these results indicate that human serum and human citrate plasma induce
aggregation with size increases that are in a comparable range On the other hand the
difference between heparin stabilized plasma and citrate stabilized plasma again points
out that the choice of anti-coagulant plays a major role for the outcome of pre-in vivo
experiments In contrast to heparin citrate is a threefold negatively charged anion (see
Figure 44B) that complexes ions that are needed for enzymes as part of the coagulation
process Citrate as anion may have an influence on the diffuse Stern layer around the
nanoparticles that possibly leads to aggregation
78 The impact of the protein source and anti-coagulant on protein corona formation and
cellular uptake of PS-NH2 has already been investigated and published by Schoumlttler et
al137 For RAW2647 macrophages that were already discussed in the previous chapter
32 a strong dependence of uptake-behavior and protein source used for incubation was
observed While the incubation of PS-NH2 in FBS or heparin plasma led to a strong uptake
in RAW2647 macrophages there was only a very weak uptake detectable after
incubation in citrate plasma or human serum The anti-coagulant therefore also plays a
critical role in the outcome of in vitro studies Additionally the cell experiments
strengthen the assumption that citrate plasma and serum lead to comparable results
under the mentioned conditions137
Altogether protein source as well as anti-coagulant play a critical role in protein-particle
interactions and therefore influence the outcome of pre-in vivo experiments As the
effectiveness of heparin as anticoagulant is based on interactions with proteins citrate
was chosen as anti-coagulant for plasma experiments that complexes ions needed for the
coagulation cascade DLS together with cellular uptake studies from Schoumlttler et al137
indicate that protein induced aggregation of nanoparticles as well as uptake in RAW2647
macrophages after incubation in serum or rather citrate plasma do not differ in a
significant manner
Results and Discussion 79
34 EVALUATION OF NANOPARTICLE STABILITY IN HUMAN BLOOD SERUM BY DYNAMIC LIGHT SCATTERING THE IMPACT OF PERSONALIZED HUMAN BLOOD SERUM COMPOSITION
In the previous chapter the influence of distinct protein fractions obtained from human
blood plasma on particle stability against aggregation as well as protein corona formation
was investigated From literature it is already known that the human blood plasma
composition is related to the genetic background or geographical origin of healthy
individuals138 As the stability of polystyrene particles has been demonstrated to be
strongly dependant on the proteins present during incubation their stability and
interactions with proteins were assumed to be in addition strongly dependent on the
composition of individual human blood proteomes The following chapter addresses the
questions of how big the differences of blood composition are between diverse probands
and how this can influence the stability of nanocarriers against aggregation After analysis
of six individual sera and one serum pool the stability of PS particles in the respective
protein solution was investigated using dynamic light scattering In addition protein
corona formation was analyzed using LC-MS The LC-MS measurements were performed
by Johanna Simon By combining DLS and LC-MS data a correlation between particle
stability under in vivo conditions and protein corona composition was evaluated The
already described coating of nanoparticles in order to stabilize them was applied to
overcome the limitations arising from personalized blood serum composition It will be
shown within the next chapter that a once formed protein corona on a nanomaterialacutes
surface remains stable even when re-introducing it into another serum source This could
also be of great interest for nanomaterials that are designed to treat special diseases
meaning that the protein composition of target subject differs from the one of healthy
individuals138 139
Human blood serum was used for the investigations in this case as the highest number of
individual probands was available This way the best statistical representation could be
obtained In addition the influence of anti-coagulant mentioned in chapter 33 could be
excluded
80
341 ANALYSIS OF INDIVIDUAL AND POOLED HUMAN BLOOD SERUM
As already described in the introduction the ACF of human serum determined by dynamic
light scattering can be described by the sum of three exponentials Each of them
represents one size fraction of serum proteins Figure 45A exemplarily shows the ACF of a
serum pool from nine different blood donators
Figure 45 A) Autocorrelation function of serum pool at scattering angle 30deg with the distribution of the three different size fractions B) Fluctuation of the three different size fractions between different probands
The first size fraction represents smaller proteins such as human serum albumin or IgG
The intermediate fraction comprises slightly bigger proteins like IgM or LDL The third size
fraction is the biggest one and represents mostly lipoproteins for example big
chylomicrons Depending on the serum composition and the concentration of individual
proteins the hydrodynamic radii of each size fraction can vary Addressing this question
dynamic light scattering was used to investigate 6 individual sera and one pool regarding
their size distribution Figure 45B shows the result For the first size fraction
hydrodynamic radii in the range between Rh1 = 3-6 nm were detected For the second
one bigger differences between the sera under investigations were measured For
example the second protein fraction of P7 was determined to be Rh2 = 14 nm while the
one of P4 was much bigger with Rh2 = 52 nm The biggest size fraction showed values
between Rh3 = 83-211 nm The variation in sizes of each protein group in consequence
leads to a fluctuation of the z-averaged hydrodynamic radii This fluctuation becomes also
Results and Discussion 81 apparent in Figure 46 showing exemplarily the ACFs at Θ = 30deg for individual sera P4 and
P5 and the one of pooled human serum
Figure 46 ACF at Θ = 30deg for serum P4 (red) P5 (blue) and pooled human serum (green)
In addition to dynamic light scattering the different protein sources were analyzed with
LC-MS Table 9 shows the top 20 identified proteins of each serum and the serum pool in
percent The captions of individual sera as proband P2 P4 etc were adapted as initially
defined after receiving them from the blood transfusion center of the medical department
of the Johannes Gutenberg University Mainz All of them are part of the serum pool
consisting of 9 probands The individual sera of proband 1 3 and 8 were not part of this
work due to a lack in availability
The amount of the most abundant protein human serum albumin differs a lot depending
on the protein source For example P9 contains only 35 HSA while the pooled human
serum consists of more than 50 of the respective protein For all other proteins the
fluctuation is not that strong due to their lower abundance in human blood serum But
still big differences between the different probands can be observed For instance serum
10-4
10-3
10-2
10-1
100
101
102
103
104
-02
00
02
04
06
08
10 P4 lt1Rhgtz
-1 = 66 nm
P5 lt1Rhgtz-1 = 20 nm
pool lt1Rhgtz-1 = 33 nm
g1
(t)
t ms
82 P4 contains only 007 of Inter-alpha-trypsin inhibitor heavy chain while serum P2
contains a 24-fold amount of it
These results show that there is a strong dependency of the blood donator on serum
protein composition Due to the results discussed in chapter 32 it can be assumed that
nanoparticles introduced into each protein source show different responses in regards of
aggregate or protein corona formation This would in consequence limit the applicability
of nanocarriers designed for biomedical applications for a very diverse group of receivers
In addition it also limits the transferability of in vitro and in vivo experiments to the actual
situation in clinical studies
Table 9 Top 20 identified proteins in individual sera P2-P9 as well as serum pool determined via LC-MS (LC-MS measurements were performed by Johanna Simon)
Results and Discussion 83
342 STABILITY EVALUATION OF NANOPARTICLES IN HUMAN BLOOD SERUM BY DYNAMIC LIGHT SCATTERING
In the next step the influence of blood serum composition on particle stability against
aggregation was investigated via DLS As in previous studies non-functionalized as well as
amino- and carboxy-functionalized polystyrene particles were used as a model system
First it has to be noted that all three particles show aggregation in the pooled human
serum (see Table 10) The size of the formed aggregates were determined to be in a range
between Rh = 150 - 250 nm This is still very small and in comparison to the initial particles
corresponds to a size increase of 100 (for PS) to 200 (for PS-NH2) meaning that no
bigger agglomerates were formed Nevertheless individual sera could be determined that
caused no size increase of the respective particle For example PS-COOH showed
aggregate formation in pooled human serum resulting in aggregates that were about 26
times bigger than the particles itself while PS-COOH showed no change of size in serum
P4 The corresponding ACFs including data points force fit and fit regarding aggregate
formation are shown in Figure 47 exemplarily Similar results were found for PS and PS-
NH2 nanoparticles
Table 10 Stability evaluation of the different polystyrene particles in the respective sera or serum pool (in red)
84
Figure 47 ACF of PS-COOH in pooled human serum (left) and in serum P4 (right) at Θ = 30deg including data points (bull) force fit (red) and fit including aggregate formation (blue) of protein stabilized particle in human blood plasma
These results indicate that the behavior and with this the biodistribution of a nanocarrier
designed for biomedical application could possibly be dependent on the proband himself
The relation between particle aggregation determined by DLS and the biodistribution in
mice is already known in literature115
The disparity in particle interactions with the different protein sources was also monitored
by applying SDS-PAGE The corresponding protein patterns are shown in Figure 48 Due to
the sensitivity of SDS-PAGE the protein patterns of the coronas formed on the PS particles
upon incubation in the different protein sources in general look very similar Nevertheless
small differences can be observed For example the protein coronas formed on PS as well
as PS-NH2 particles in the pooled human serum show the existence of a protein band
between 38 and 49 kDa corresponding to apolipoprotein A-IV (marked in red) The same
bands can also be seen very weakly for PS particles in the corresponding protein coronas
formed in individual serum P2 and for PS-NH2 particles in P2 P4 and P6 In the protein
patterns of the coronas formed in P7 and P9 these bands are completely absent Of
course these differences can also occur due to small fluctuations in the applied protein
amount onto the gel but the intensity of the other bands in the protein patterns formed
for example after incubation in P7 show that the differences in protein corona patterns
can be related to the differences in the composition of the protein sources
Results and Discussion 85
Figure 48 Protein patterns of the protein coronas formed on the different functionalized
PS particles upon incubation in the different protein sources
343 TAKING ADVANTAGE OF THE INFLUENCE OF PERSONALIZED SERUM ON PARTICLES STABILITY
As was shown in chapter 32 the pre-coating of PS-particles with certain protein mixtures
can stabilize them against aggregation in human blood plasma The question was
addressed whether this approach could be adapted in order to stabilize particles under
investigation and by this overcome the limitations that arise from the fluctuation in
personalized human blood serum composition and the corresponding particle-protein
interactions When combining DLS with LC-MS data the impact of single proteins within a
given protein corona on particle aggregation can be monitored Therefore the three
86 different Lutensol-stabilized polystyrene particles were incubated in individual sera that
were determined to cause no size increase of the respective particle Afterwards the
coated particles were introduced into the human serum pool and the stability was
evaluated using DLS (see Figure 49)
Figure 49 ACF of a respective coated particle in pooled human serum at Θ = 30deg including data points (bull) and force fit (red) with A) PS coated in P4 B) PS-COOH coated in P4 C) PS-NH2 coated in P2 and D) PS-NH2 coated in P7
For each particle no size increase in pooled human serum could be detected after pre-
coating in individual sera Due to the formation of a protein corona the particlesacute size
itself was increased but for PS-COOH and PS-NH2 the resulting size was much smaller
compared to the ones of the primary detected aggregates (see Figure 50) This means
that the size increase of the respective PS particles in pooled human serum can be limited
and pre-determined by the formation of a protein corona in individual sera that did not
lead to a destabilization This would be of great interest when a given nanomedicine
Results and Discussion 87 should be applied to a proband whose serum composition leads to intense aggregation
and the formation of big agglomerates
Figure 50 Angular dependency of the inverse hydrodynamic radius of the particles itself (red) the corresponding aggregates (blue) formed in pooled human serum (black) in comparison with the ones of the coated particles (magenta)
It can be summarized that the pre-coating of a PS-particle in individual serum can
stabilize it against aggregation in pooled human serum
88 Further the stability of the pre-formed protein corona after introduction in the human
serum pool was investigated via LC-MS for chosen samples PS-COOH particles pre-coated
with serum P4 and PS-NH2 particles pre-coated with serum P7 have been studied Table 11
shows the results for PS-COOH particles
Table 11 TOP 20 identified proteins of the protein coronas (values in ) formed on PS-COOH particles after incubation with pooled human serum individual serum P4 and double incubation obtained by LC-MS in douplicates A and B (LC-MS measurements performed by Johanna Simon)
In general the protein coronas of PS-COOH formed in serum P4 and pooled human serum
are very similar However one difference becomes obvious (marked in red see Table 11)
The amount of Apolipoprotein E in the protein corona formed in the serum pool is much
smaller than the one in the corona formed in serum P4 When PS-COOH was pre-coated
Results and Discussion 89 with the respective protein source the amount of Apolipoprotein E remains constant
even after re-introduction in the serum pool Similar results were found for PS-NH2
particles as Table 12 shows
Table 12 TOP 20 identified proteins of the protein coronas (values in ) formed on PS-NH2 nanoparticles after incubation with pooled human serum individual serum P7 and double incubation obtained by LC-MS in douplicates A and B (LC-MS measurements performed by Johanna Simon)
This time four different proteins could be detected whose amount in the protein coronas
of PS-NH2 particles formed in serum P7 and pooled human serum differ namely clusterin
apolipoproteins A-I A-IV and E (marked in red see Table 12) Again the amount of
Apolipoprotein E in the protein corona formed in individual serum P7 is bigger compared
to the one formed in pooled human serum This remains constant even after
reintroduction in the latter one A similar phenomenon was found for Apolipoprotein A-I
while the amount of Apolipoprotein A-IV was decreased by the pre-incubation process
90 The results presented in Table 11 and 12 show that a once formed protein corona on
polystyrene particles in distinct protein sources is stable when it is re-introduced into
another protein source Together with the previously described dynamic light scattering
results it can be assumed that the mentioned proteins play an important role in serum
protein induced aggregation or rather stability against aggregation
344 HEAT INACTIVATION OF HUMAN BLOOD SERUM
In the last chapter 333 it was demonstrated that the incubation of polystyrene particles
in sera with individual protein composition can lead to a stable protein corona on the
respective particles when they were introduced into pooled human serum that initially
induced slight aggregation This pointed out once again that the composition of a protein
source critically affects the protein adsorption onto a nanomaterialacutes surface and with this
the stability against aggregation This led to the assumption that a change in serum
preparation with involved changes in protein composition prior to incubation with
nanoparticles also effects the interaction with the latter ones The inactivation of human
serum proteins is a widely used method for protein sample preparation in order to
denaturate the complement system For example fetal bovine serum (FBS) that is used in
vitro is heated up to 56 degC for 30 min prior to cell experimental use Therefore the effect
of heat inactivation on protein corona formation on PS-particles was investigated First
the effect of heating serum up to 56 degC for 30 min was monitored by dynamic light
scattering Afterwards the effect on the particle stability and protein corona formation of
polystyrene particles was monitored The observed changes in regards of stability and
protein corona formation were evaluated as additional tool for the stabilization of the
particles under investigation when introduced into native pooled human serum Figure 51
shows the angular dependency of every size fraction and the z-averaged inverse
hydrodynamic radius of the native serum pool (Figure 51A) and the heat-inactivated
serum pool (Figure 51B) The z-averaged values for both are very similar but the heating
has an influence on the distribution of the single protein size fractions
Results and Discussion 91
Figure 51 Angular dependency of the inverse hydrodynamic radii as well as the z-averaged value obtained in native human serum pool (A) and heat inactivated human serum pool (B)
The similarity for the z-averaged inverse hydrodynamic radius becomes also apparent
when looking at Figure 52 The ACFs at Θ = 30deg of native human serum (black) and heat
inactivated human serum (red) are shown and are more or less identical
Figure 52 ACF at Θ = 30deg of native human serum (black) and heat inactivated human
serum (red)
10-4
10-3
10-2
10-1
100
101
102
103
104
-02
00
02
04
06
08
10 nativ serum
heat inactivated serum
g1
(t)
t ms
92 The previously described polystyrene particles were incubated in the human serum pool
as well as in the heat inactivated serum pool in order to investigate the above described
effect on protein corona formation on the respective particles The protein pattern was
analyzed using SDS-PAGE (see Figure 53)
Figure 53 SDS-PAGE of the different polystyrene particlesacute protein coronas formed upon incubation in native human serum pool (A) as well as in heat inactivated human serum pool (B) (SDS-PAGE performed by Johanna Simon)
Figure 53A shows the protein patterns of PS PS-COOH and PS-NH2 after incubation in
native pooled human serum Figure 53B shows the respective patterns after incubation in
heat inactivated pooled human serum As was already shown in Table 12 the protein
corona of the amino-functionalized polystyrene particle formed in pooled human serum
Results and Discussion 93 contains mostly clusterin (averaged amount ~ 54) The same is valid for the non-
functionalized one Interestingly the corresponding protein band at 38 kDa disappears in
the corona pattern when the serum pool was heat-inactivated prior to use One possible
explanation could be the denaturation of clusterin during the heat inactivation of pooled
human serum The difference in the protein corona composition depending on serum
treatment prior to incubation is also shown in Table 13 that summarizes the TOP 20
identified proteins in the protein coronas formed on PS-NH2 after incubation in nativ and
heat inactivated human serum
Table 13 TOP 20 identified proteins of the protein coronas (values in ) formed on PS-NH2 nanoparticles after incubation with native pooled human serum (A) and heat inactivated human serum (B) obtained by LC-MS (LC-MS measurements performed by Johanna Simon)
Emanated from Table 13 the amount of clusterin in the protein corona of amino-
functionalized PS particles is dramatically reduced after incubation in heat inactivated
94 serum while human serum albumin is enriched The same is valid for the Ig kappa chain C
region (marked in green)
To study this effect the melting points (and with this denaturation temperature) of
clusterin HSA IgG and fibrinogen (fibrinogen only for completeness and further
discussion) were determined using Differential Scanning Fluorimetry (DSF) A solution of
each protein with c = 1 gL in DPBS (clusterin c = 014 gL) was heated from 20 degC up to 95
degC with a heating rate of 1 degCmin The auto fluorescence at 350 nm as well at 330 nm was
measured Figure 54 shows the detected fluorescence at 350 nm in dependency of the
temperature
Figure 54 Fluorescence at 350 nm determined by nanoDSF of fibrinogen (A) HSA (B) IgG (C) and clusterin (C) in PBS (clusterin was measured by Julius Muumlller PhD student AK Landfester MPIP)
For fibrinogen a denaturation point of T = 496 degC was determined for HSA a value of T =
617 degC for IgG a temperature of T = 716 degC and for clusterin a melting point of T = 467
degC This means that the denaturation temperature of clusterin is below the temperature
Results and Discussion 95 that is used for heat inactivation of serum while the corresponding points of HSA and IgG
are above The unfolding point for human serum albumin is in good agreement with the
literature Barone at al determined the mid-point denaturation temperature of HSA in 02
M Tris-HCl (pH = 73) using differential scanning calorimetry (DSC) to be at Td = 337 K
(6385 degC)140 Vermeer et al reported two transition temperatures for IgG A lower
transition temperature of the Fab segments at T = 61 degC and a higher transition state at T =
71 degC for the Fc segment of IgG141 The second transition temperature is in good
agreement with the detected denaturation temperature of T = 716 degC using DSF Arising
from Figure 54C the denaturation or unfolding of IgG starts at ~ 65 degC which is in good
agreement with the unfolding temperature of Fab This indicates that both processes
merge Nevertheless both transition temperatures are above the used temperature of 56
degC for serum inactivation As no precipitation occurs during heat inactivation the
compositions of native and inactivated serum should be identical Only the degree of
distinct protein denaturation differs This leads to the assumption that the absence of
clusterin in the protein pattern in Figure 53 is originated only in the lack of interactions
between unfolded protein and particle while clusterin in the native state has a high
affinity to the same nanomaterial The observed denaturation temperatures for HSA and
IgG are also in good agreement with the results observed from LC-MS Both proteins are
not unfolded during heat inactivation of serum and are enriched in the corona of PS-NH2
(Table 13B)
The difference in protein-corona formation with or without heat inactivation is also
mirrored by the zeta potential of the coated particles (see Table 14)
Table 14 Zeta potential of the different polystyrene particles without incubation and after incubation in native or heat inactivated pooled human serum
96 For all coated particles after incubation in native pooled human serum a more negative
surface charge could be detected than for the ones incubated in heat inactivated pooled
human serum In addition the zeta potentials of the coated particles in inactive human
serum differ while the ones of coated particles in native serum are similar in a range
between ζ = - (210 ndash 235) mV After incubation in inactive human serum the zeta
potentials of PS and PS-NH2 particles show values of ζ = -141 mV for PS or rather ζ = - 157
mV for PS-NH2 that are significant higher than the value for PS-COOH particles (ζ = - 203
mV) There are two possible explanations for the observed phenomenon On the one
hand the differences in zetapotential could be originated in a stronger impact of initial
surface change of the ldquonakedrdquo particles on protein adsorption On the other hand it is also
possible that the formed protein coronas on the polystyrene particles are not able to
mask the initial surface charge completely
These interesting results lead to the question whether this causes a change of stability
against aggregation of the PS particles in the serum pool as well Figure 55 compares the
observed size increases determined by DLS of the three particles under investigation when
introduced into native or rather heat inactivated pooled human serum
Figure 55 Size increase of the polystyrene particles in native or heat inactivated human serum pool obtained by DLS in comparison with the size increase in native human serum pool after coating with inactive human serum pool
All three particles under investigation showed a difference in aggregation behavior While
non-functionalized polystyrene showed a slightly pronounced size increase in heat
inactivated serum compared to the one in native serum PS-COOH and PS-NH2 formed
Results and Discussion 97 smaller species with size increases in the range between + 78 (PS-COOH) and + 65 (PS-
NH2) This lead to the question whether a pre-coating with heat inactivated serum pool
could lead to stabilization against aggregation of the functionalized PS-particles when
introduced into native serum The results are also shown in Figure 55 (denoted as ldquoin +
activerdquo) Interestingly the pre-coating lead to a size increase that is even bigger than for
the uncoated particles This effect was most obvious for PS-COOH
In conclusion the protein corona of the PS-particles under investigation strongly depends
on the preparation of pooled human serum prior to use Clusterin which is high abundant
in the protein corona of PS and PS-NH2 after incubation in native human serum pool
completely disappears when the serum pool is heat inactivated prior to incubation The
denaturation of proteins upon heat inactivation leads to conformal changes of the
proteins that also cause changes in their properties This results in a change of stability
against aggregation of the particles under investigation but pre-coating cannot stabilize
the particles against the same when re-introduced in native serum The results presented
in this chapter underline the already discussed strong dependency between serum
composition and the interactions of nanomaterials exposed to them Despite not leading
to full stability against aggregation in pooled human serum of polystyrene particles when
precoated with inactivated serum the data presented in this chapter demonstrate that
the heat inactivation of a given protein source alters its interactions with nanomaterials
This way the heat inactivation is another suitable tool for the adjustment of a
nanomaterialacutes physicochemical properties
345 DILUTION AS A TOOL FOR PRE-COATING OF NANOPARTICLES
As already shown in chapter 322 the amount of proteins per given surface area of
nanomaterial plays a critical role when looking at stability against aggregation The
amount of present proteins in chapter 322 was varied by the dilution of plasma The
question arose whether the dilution of proteins plays a role even when the amount of
proteins per m2 surface area is kept constant With this the equilibrium between
associated proteins on the particle surface and dissociated proteins in solution is
influenced It was monitored whether this shift critically affects the stability against
98 aggregation and the resulting size increase of polystyrene particles In addition the
resulting spatial separation of particles upon dilution was assumed to decrease
interactions with each other like clotting As the precoating procedure already qualified
for particle stabilization the approach was adapted to the coating of PS particles under
diluted conditions DLS was used to investigate whether this precoating also leads to a
stabilization of particles under investigation under physiological conditions To address
this question Lutensol stabilized PS-COOH and PS-NH2 were introduced in pooled human
serum at a constant ratio of 5x10⁻³ m2 per mg serum The overall mixture was diluted 12
15 and 110 The results for stability evaluation against aggregation of each nanoparticle
are shown In Figure 56
Figure 56 A) Size increase of PS-COOH in concentrated as well as diluted human serum obtained by DLS together with the scattering intensity of particle or rather aggregate at Θ = 30deg B) Size increase of PS-NH2 in concentrated as well as diluted human serum obtained by DLS together with the scattering intensity of particle or rather aggregate at Θ = 30deg
For PS-COOH nanoparticles an aggregate formation could be detected in the
concentrated particleserum-mixture and dilution up to 15 For a tenfold dilution no
aggregates could be detected anymore The size of the formed aggregates does not
diversify that much but the intensity contribution of the different species within the
respective mixture to the overall scattered light shows a trend With stronger dilution the
intensity contribution of aggregates declines while the ones of the particles increase The
Results and Discussion 99 same phenomenon was observed for PS-NH2 nanoparticles In addition no aggregate
formation could be observed for a fivefold dilution The absence of aggregation for diluted
samples was utilized for coating of the respective particles PS-COOH nanoparticles were
incubated in serum pool in tenfold dilution PS-NH2 nanoparticles in five- and tenfold
dilution Afterwards the coated particles were introduced into concentrated pooled
serum and investigated in regards of stability against aggregation
Figure 57 shows the ACFs at Θ = 30deg of uncoated PS-COOH and PS-NH2 nanoparticles in
the concentrated human serum pool in comparison to the coated ones For all samples
aggregates were observed that represent as significant size increases Therefore it can be
reasoned that dilution is not a suitable tool for pre-coating of polystyrene particles when
it comes to stability against aggregation
Figure 57 ACF at Θ = 30deg of A) PS-COOH in serum pool as concentrated mixture B) PS-COOH in serum pool as diluted mixture 12 C) PS-COOH in serum pool as diluted mixture 15 D) PS-NH2 in serum pool as concentrated mixture and E) PS-NH2 in serum pool as diluted mixture 12 obtained by dynamic light scattering D) Summary of determined aggregate radii and the corresponding size increase
100 By dilution the equilibrium between associated and dissociated proteins at the particle
surface is shifted In addition the particles in higher dilution are in bigger distances to
each other This way the possibility of interaction that leads to agglomeration is
decreased The results presented show that with increasing distance of PS particles to
each other the dimension of aggregate formation decreases Although a pre-coating did
not lead to stabilization of PS-COOH and PS-NH2 nanoparticles under concentrated
conditions the dependence of aggregation and dilution could be of great interest for
experiments that strongly depend on particle size like cellular uptake studies
346 SUMMARY
This chapter focussed on the consequences on particle stability and protein corona
formation upon a fluctuation in blood serum composition Many approaches were
introduced that should overcome the aggregation or size increase of particles in pooled
human serum In the style of pre-coating nanoparticles with certain stabilizing protein
mixtures that was already introduced in chapter 32 the incubation in individual sera
causing no size increases was utilized for the stabilization of polystyrene particles in
human serum pool Even though the same goal could not be achieved by pre-coating in
heat inactivated serum the method also demonstrated the strong correlation between a
protein sourceacutes composition and the interactions with particles Again new opportunities
for the adjustment of physicochemical parameters of nanomaterials were introduced
Results and Discussion 101
35 THE TRANSFER OF A PROTEIN CORONA
In order to increase the blood circulation time of a nanocarrier designed for biomedical
application protein-repellent polymers have been used for surface modification Recently
it has been shown that materials like poly (ethylene glycol) (PEG) show reduced protein
adsorption but that the presence of distinct proteins is necessary to prevent non-specific
cellular uptake107 These so-called ldquostealthrdquo materials possess prolonged blood-circulation
time and avoid activation of the immune system This chapter focuses on the question
whether a formed protein corona on PEGylated materials can be transferred onto a
nanomaterial without PEG modification in order to stabilize it against aggregation and to
retain its cell uptake The principle of corona transfer is illustrated in Figure 58 A
nanomaterial A is used for the formation of a protein corona The protein corona
afterwards can be dissolved by the use surfactants like SDS for instance After removal of
particles A and surfactant the proteins can further be used in order to coat a
nanomaterial B
Figure 58 Illustration of protein corona transfer
351 THE STEALTH NANOCARRIER
A requirement for this study is a PEGylated nanomaterial that is stable against aggregation
in concentrated human plasma For that purpose PEG5000-NHS ester was used to modify
102 CTMA-Cl stabilized PS-NH2 particles via covalent attachment of the PEG molecules
Particle functionalization was performed by Thomas Wolf (PhD student AK Landfester
MPIP Mainz) After functionalization the particles were purified by subsequent
centrifugation (20000 g 1 h) and redispersion of the particle pellet thrice In addition the
dispersion was afterwards dialyzed against water with a cut off of MW = 50 kDa The
physicochemical parameters of the PEGylated nanoparticles as well as original PS-NH2
particles are shown in Table 15
Table 15 Physicochemical characterization of PS-NH2 (top) and purified PS-PEG5000
(bottom)
particle parameter PS-NH2
surfactant CTMA-Cl
groups per NP 3500
lt1Rhgtz-1 nm 51
ζ potential mV 334 plusmn 01
particle parameter PS-PEG5000
PEG chains particle 3000
solid content in mgmL 10
lt1Rhgtz-1 nm 67
ζ potential mV 129 plusmn 01
Results and Discussion 103 DLS was used to determine size as well as stability of the purified particles in concentrated
human plasma Figure 59 shows the results
Figure 59 A) Angular dependency of the inverse hydrodynamic radius of PS-PEG5000 obtained by DLS B) ACF at Θ = 30deg of PS-PEG5000 in concentrated human plasma including data points and force fit
The particle itself shows a relatively low polydispersity as indicated by the moderate
angular dependency of the hydrodynamic radius (see Figure 59) and remains stable
against aggregation when introduced in concentrated human plasma
The particle was then incubated in plasma in order to form a ldquostealthrdquo-protein corona
enriched with clusterin as previously described107 Table 16 shows the top 20 identified
proteins by LC-MS that are present in the particlesacute hard corona
As shown in Table 16 the ldquostealthrdquo corona contains mostly lipoproteins Clusterin makes
up over 50 of the total protein composition but also apolipoproteins A-IV A-I and E are
present in a significant manner This is in good agreement with the literature107
104 Table 16 Top 20 identified proteins of the protein corona formed on PS-PEG5000 upon
incubation in human plasma (LC-MS measurement was performed by Johanna Simon)
The protein corona was detached via SDS-addition and the surfactant removed via
subsequent use of the Piercereg Detergent Removal Spin Column The protein amount
before and after column use was determined In addition it was analyzed whether the
PEGylated particle can be recycled and reused for corona preparation Three cycles of
incubation and corona-detachment were carried out and the process monitored via SDS-
PAGE The particle recycling would offer the possibility of using the particles as a resin in
HPLC chromatography like the Protein A- or AF-Blue-column introduced in chapter 31
Figure 60 sums up the results
Results and Discussion 105 The zeta potential of PS-PEG5000 mirroring the surface charge changed significantly from
(+129 plusmn 01) mV to (-145 plusmn 01) mV after incubation in human plasma due to adsorption
of mostly negatively charged plasma proteins The protein patterns before and after
application of the Piercereg Detergent Removal Spin Column look similar In addition all
patterns exhibit the intense clusterin band at ~38 kDa (marked in red) and seem to be
largely identical Thus the desired protein corona pattern with the enrichment of clusterin
leading to potentially ldquostealthrdquo properties is achieved Also visible in the protein patterns
shown in Figure 60A are protein bands in the low molecular range between 6 and 14 kDa
These protein bands correspond amongst others to apolipoprotein C3 (~ 9 kDa)
Protein quantification determined 20 protein loss by removing SDS but according to
SDS-PAGE without significantly changing the protein composition The zeta potential of
coated PS-PEG5000 after the third cycle with a value of ζ = - (151 plusmn 07) mV is similar to the
one after the first cycle This means that protein adsorption takes place in a comparable
manner and offers the possibility of particle recycling
Figure 60 A) SDS-PAGE of human plasma with subsequent silver staining (1) the protein corona formed on PS-PEG5000 after incubation in human plasma with (2) and without (3) SDS the protein corona formed on the second use of PS-PEG5000 after incubation in human plasma with (4) and without (5) SDS and the protein corona formed on the third use of PS-PEG5000 after incubation in human plasma with (6) and without (7) SDS B) Zeta potential of uncoated PS-PEG5000 as well as of the coated ones after first and third use
106 NanoDSF was utilized in regards of protein denaturation for the investigation of the
ldquostealthrdquo corona after detachment from PS-PEG5000 and SDS removal Figure 61A shows
the auto fluorescence measured at 350nm Figure 61B the auto fluorescence measured at
330 nm and Figure 61C the ratio of both For all three examinations no protein unfolding
could be obtained This means that the proteins are fully denaturated after detaching
them from PS-PEG5000 using SDS
Figure 61 A) Fluorescence at 350 nm determined by nanoDSF of ldquostealthrdquo proteins B)
Fluorescence at 330 nm determined by nanoDSF and C) the 350330 nm ratio
determined by nanoDSF
352 CORONA TRANSFER
Especially for nanomaterials designed for biomedical applications a long blood circulation
time and stability against aggregation are desired The surface modification with protein
repellent polymers such as PEG is a time consuming process that needs several
purification steps subsequent to the particle synthesis itself In addition functional groups
at the nanomaterialacutes surface are needed for the covalent attachment of polymers that
limits the applicability In chapter 32 and 34 it was shown that the adsorption of
proteins on a nanomaterialacutes surface also alters its physiochemical properties The
adsorption takes place upon an (in comparison) simple incubation process of particles in
protein solution No functional groups for a covalent modification are needed during this
process what makes this approach applicable for a diverse and broad range of different
nanomaterials Since the ldquostealthrdquo properties of PEGylated polystyrene has recently been
shown to be depending on the presence of distinct proteins the question arose whether a
Results and Discussion 107 transfer of a formed ldquostealth coronardquo onto a foreign nanomaterial by adsorption is
possible and whether this adsorption changes the physicochemical properties of a
nanomaterial towards stability against aggregation and reduced non-specific cellular
uptake of macrophages As shown in chapter 344 the denaturation of proteins can lead
to changes in their interactions with nanomaterials This leads also to a change in
properties The question was addressed whether this has an impact on the ldquostealth
properties regarding cellular uptake as well
As transfer particle CTMA-chloride stabilized PS-NH2 particles (see Table 15 top) were
chosen as they were used for PEG modification as well Particles with a surface area of
005 m2 were introduced in 200 microg of protein dissolved in PBS After one hour free and
weakly bound proteins were removed via centrifugation and washing of the particle
pellet First it had to be analyzed whether protein adsorption on the transfer particle took
place at all This was done by using SDS-PAGE as well zeta potential measurement in order
to monitor changes in the particleacutes surface charge SDS-PAGE was used to study whether
proteins could be detected in the particlesacute hard corona and whether the pattern looks
similar to the one of PS-PEG5000 In addition zeta potential measurements were utilized
for detection of changes on the nanomaterials surface after incubation in protein solution
Figure 62 gives an overview of the results
First of all it has to be noted that proteins could be detected after incubation of PS-NH2 in
the proteins detached from PS-PEG5000 This means that despite of losing their tertiary
structure when SDS was used to detach the proteins from PEGylated polystyrene they
adsorb to amino-functionalized PS when being exposed to it This is also mirrored in the
significant change of the zeta potential of the respective particle after incubation The
protein pattern formed on PS-NH2 after incubation in corona proteins differs from the one
formed in full plasma The most abundant protein in the higher molecular range after
incubation in full plasma is albumin at 66 kDa (see Figure 62 band marked yellow in Lane
2) whereas the hard corona after incubation in ldquostealth-proteinsrdquo shows the most intense
band at ~38 kDa (see Figure 62 marked in red in Lane 3 and 4) in the higher molecular
range This is similar to the pattern of PS-PEG5000
108
Figure 62 A) SDS-PAGE of human plasma (1) the protein corona of PS-NH2 formed in human plasma (2) the protein corona of PS-NH2 formed in the ldquostealthrdquo proteins (3) and the ldquostealthrdquo proteins (4) B) Zeta potential of uncoated PS-NH2 as well as of coated PS-NH2 with ldquostealthrdquo proteins
The results so far show that the transfer of a protein corona in general is possible Going
one step further it was analyzed whether this artificially created protein corona can
enhance a particleacutes stability against aggregation when introduced in concentrated human
plasma
Figure 63A shows the DLS results for PS-NH2 (CTMA-Cl) introduced in concentrated
human plasma Strong aggregate formation could be observed with aggregates in the
microscopic size range Figure 63B shows the DLS results for PS-NH2 after coating with
ldquostealth proteinsrdquo Aggregate formation could not be completely prevented but the
dimension could be dramatically decreased and thus the particles were stabilized By pre-
coating the size increase of the respective particle when introduced into concentrated
human plasma could be decreased from 1300 to 120
Results and Discussion 109
Figure 63 A) ACF at Θ = 30deg of PS-NH2 in concentrated human plasma including data points (O) force fit (red) and fit with aggregate formation (blue) with the angular dependency of their inverse hydrodynamic radii B) ACF at Θ = 30deg of coated PS-NH2 in concentrated human plasma with the angular dependency of the obtained inverse hydrodynamic radii
The effect of the transferred protein corona was additionally investigated via cellular
uptake studies RAW 2647 macrophages were incubated with PS-NH2 (CTMA-Cl) with and
without prior pre-coating and compared to the uptake of PS-PEG Figure 64 gives the
results
While the protein corona formed on PS-PEG5000 leads to a reduced uptake compared to a
uncoated one (Figure 64 sample 1 vs sample 4) the inverse effect was observed for PS-
NH2 coated with the transferred protein mixture This leads to the conclusion that the
denaturation of proteins during SDS-treatment in order to detach them from the stealth
material plays a critical role during macrophage uptake The role of macrophages as part
of the immune system is to detect foreign or damaged material with subsequent cell
uptake in order to remove foreign material This could be an explanation for the increased
uptake of PS-NH2 decorated with the transferred protein mixture
110
Figure 64 Flow cytometry analysis of RAW 2647 cells incubated with nanoparticles 2 h in DMEM without additional proteins The pre-coated nanoparticles were isolated via centrifugation and added to the cells with a nanoparticle concentration of 20 microgmL Relative median fluorescence intensity (rMFI) values are shown as mean plusmn SD of triplicates (cell experiments were performed by Johanna Simon)
As a conclusion the transfer of a protein corona from stealth-materials to particles
without stealth modification is possible With this the stability of a particle against
aggregation in concentrated human plasma can be increased In addition the stealth
material can be recycled and reused opening new possibilities for protein purification via
chromatography However the correct protein folding is necessary for achieving a
ldquostealth effectrdquo in regards of reducing the cellular uptake while it is not needed for
stability against aggregation By this the chapter underlines again the importance of
protein structure on interactions with particles as was already demonstrated in chapter
344
Results and Discussion 111
36 EVALUATION OF DIFFERENT IN VIVO MODELS FOR BIOMEDICAL APPLICATION
The increasing interest on nanocarriers for biomedical applications becomes apparent in
the number of publications on nanomedicine that rose from ten (~1990) to more than
1200 per year (2004)142 Compared to that the number of nanotechnology-enabled
products currently on the market is very small (~38 in 2006)142 The evaluation process
that a nanomaterial has to undergo prior to becoming an accepted pharmacy-medicament
is very time consuming and includes several critical steps Animal models are often used
as non-human source in order to evaluate the potential nanomaterial prior to clinical trials
with humans143 These animal tests are even required before exposure to humans144
Nevertheless the transfer from in vivo to humans bears several challenges and
limitations145 146 Mak et al refers to that problem as ldquoLost in translationrdquo147 The murine
model is the most commonly used one for testing drug candidates prior to clinical trials148
Despite the very different morphology of mice compared to humans many factors
influence the outcome of in vivo trials For example Cabib et al showed that the outcome
of experimental results is also depending on background variables like the period of food
shortage149 Very recently Laganagrave and coworkers used LC-MS to investigate the protein
corona formed on different liposomal formulations after incubation in mouse or rather
human plasma Their findings reported suggest that results from in vivo animal models are
not mandatory conferrable to humans150
This chapter focusses on the transferability of different in vivo animal models to humans
Citrate stabilized plasma from different animals was analyzed and compared to human
plasma In addition protein particle interactions were studied via DLS and SDS-PAGE The
so far developed pre-in vivo screening methods should further be modified to increase the
understanding of possible differences between the outcome of in vitro in vivo
experiments and clinical trials
361 CHARACTERIZATION OF DIFFERENT BLOOD PLASMA SOURCES
Plasma from three typical in vivo models namely rabbit mouse and sheep was chosen
and compared to human plasma As a first step DLS was used to determine the three
different size fractions for each plasma source Figure 65 summarizes the results
112
Figure 65 A) Fluctuation of the different size fractions for the different plasma sources B) The corresponding ACF at Θ = 30deg C) Obtained values for the different size fractions from DLS
Each plasma source contains the already described three different size fractions The sizes
of each fraction as well as their relative intensity amplitude in vary a lot
Mouse plasma for example contains a lot of the biggest size fraction that is in addition
very large in size This results in the biggest inverse hydrodynamic radius
lt1Rhgtz-1 = 35 nm while sheep plasma has only a determined value of lt1Rhgtz
-1 = 12 nm
which is less than half of the size compared to the mouse plasma proteome One
explanation for this phenomenon can be the different nutrition of animals Cholesterol
and lipids for instance can be taken up with food and are part of the lipoproteins present
in plasma These lipoproteins can form big agglomerates like chylomicrons that are part of
the biggest size fraction Rh3 As DLS is very sensitive towards bigger species this can lead
to significant differences in observed size fractions and intensity contributions
The difference between each plasma proteome becomes also apparent by SDS-PAGE
Figure 66 gives the corresponding protein patterns Especially in the high molecular range
but also between 28 ndash 49 kDa differences in the protein patterns can be seen
Results and Discussion 113 Classification is possible for the most abundant protein bands that belong to serum
albumin at ~ 66 kDa (marked in red see Figure 66) and IgG at ~ 50 kDa for the heavy chain
or rather ~ 22 kDa for the light chain (marked in green see Figure 66) They can be found
in every plasma source In 2015 Pozzi et al investigated the plasma composition of
mouse and EDTA stabilized human plasma via LC-MS150 For human plasma 234 proteins
were identified for mouse plasma 354 As already indicated in the introduction SDS-PAGE
is limited in resolution Proteins with similar molecular weights co-migrate through the gel
and can therefore not be separated That makes it very difficult to identify single proteins
Nevertheless it is a suitable method for the comparison of different protein patterns
Figure 66 SDS-PAGE of human rabbit sheep and mouse plasma
For better resolution LC-MS was performed of the different plasma sources For human
as well as mouse plasma 100 proteins in total could be easily identified by our setup For
114 rabbit plasma 35 and for sheep plasma 15 proteins in total could be identified due to
smaller databases Therefore the percentaged amount of the TOP 20 identified proteins
does not mirror the actual plasma composition of rabbit and sheep Nevertheless the
most abundant proteins could be identified Table 17 shows the TOP 20 identified proteins
obtained by LC-MS in human and mouse plasma Table 18 the corresponding results for
sheep and rabbit plasma
Table 17 Top 20 identified proteins in human and mouse plasma (LC-MS measurement
was performed by Johanna Simon)
Results and Discussion 115 In comparison to human plasma the mouse plasma under investigation contains less
albumin (~ 7 marked in red Table 17) and much less immunoglobulins (marked in
yellow Table 17) Both protein classes belong to the smaller globular proteins that make
up the three different size fractions DLS can detect The described deviation between
human and murine plasma therefore is amongst others one factor that leads to the shift
of the mouse ACF to longer correlation times (see red data points Figure 64)
Table 18 Top 20 identified proteins in rabbit and sheep plasma (LC-MS measurement was
performed by Johanna Simon)
Due to the smaller numbers of identified proteins in sheep as well as rabbit plasma the
detected amount of the most abundant protein albumin is very high in both plasma
116 sources according to LC-MS (see Table 18) For rabbit plasma the very high amount of
~ 70 is somehow traceable and fits the protein pattern obtained with SDS-PAGE (see
also Figure 65) But for sheep plasma a high variety of protein bands were obtained by
SDS-PAGE (see Figure 65) Therefore it can be assumed that the high percentaged amount
of albumin obtained via LC-MS is mostly originated in the small amount of only 15
identified proteins
The differences in blood plasma composition can have many origins Next to the apparent
different genotype the protein composition in blood is also influenced by outer terms and
conditions This can be physical stress during welfare or the nutrition but also injuries
Proteins of the acute phase are for example expressed in an increased manner in the
latter case
The impact of these different plasma proteome compositions on particle stability was
addressed in the next steps
362 INVESTIGATION OF PROTEIN-PARTICLE INTERACTIONS
The three different and already described Lutensol stabilized polystyrene nanoparticles
(see chapter 322) were introduced in each plasma source and their stability against
aggregation investigated by using DLS Figure 67A summarizes the observed size increase
of PS PS-COOH and PS-NH2 in human mouse rabbit and sheep plasma
Results and Discussion 117
Figure 67 A) Observed size increases in of the different PS-particles after exposure to human mouse rabbit and sheep plasma B) Zeta potential of uncoated PS-particles as well as coated particles in the different plasma sources under investigation
In general the size increase of each particle depends a lot on the plasma source it is
introduced into Non-functionalized PS nanoparticles for example forms aggregates in
sheep plasma that are 166 bigger than the original species while the same particle
increases only 14 in size when introduced into mouse plasma A second direct
observation can be made from Figure 67A Independent of the functionalization of the
three different polystyrene particles under investigation their size increases in rabbit
plasma are very similar and in comparison to the ones in other plasma sources low This
indicates on the one hand that the protein corona formation in rabbit plasma is not
depending on the surface charge of the polystyrene particles under investigation in a
strong manner On the other hand it also means that proteins present in the corona
formed in rabbit plasma do not lead to a pronounced aggregation behavior
In addition the change of surface charge of each particle after incubation in every plasma
source was monitored (Figure 67B) Due to the fact that most plasma proteins are
negatively charged the measured zeta potential again becomes negative after hard-
corona formation Small differences between the animal models can be observed
After incubation in human plasma the values for zeta potential are most negative in the
range between -32 and -38 mV while the values after incubation in sheep plasma are
around -26 mV This could be relevant for cellular uptake and hence the body distribution
118 SDS-PAGE was used in order to identify the protein patterns of the particlesacute hard corona
that were formed after incubation in the plasma sources under investigation Figure 68
shows the corresponding SDS-PAGE patterns
Figure 68 A) SDS-PAGE of the protein coronas formed on PS PS-COOH and PS-NH2 during incubation in human or mouse plasma B) SDS-PAGE of the protein coronas formed on the respective particles during incubation in sheep or rabbit plasma
For each particle specific protein patterns can be identified that are present in the
respective hard-corona independent of the plasma source used for incubation Two of
these examples are marked in blue One very abundant protein band is visible at ~66 kDa
that probably corresponds to albumin A second abundant protein band is detected
between 38 and 48 kDa But also very significant differences can be observed These
differences concern all particles or only one particle when comparing the different animal
models Relevant for all particles is the presence or absence of clusterin at ~38 kDa This is
marked with horizontal red arrows This protein is highly abundant for the protein coronas
formed in human or sheep plasma but absent or only low abundant after incubation in
mouse and rabbit plasma Two additional differences only concern PS-COOH These ones
Results and Discussion 119 are marked with vertical red arrows While the protein patterns have abundant bands at ~
28 kDa in mouse human and rabbit plasma the band is absent after incubation in sheep
plasma This is interesting as the existence of the corresponding protein can be seen in
the patterns of PS and PS-NH2 after incubation in the latter plasma source The second big
difference is a protein band at ~ 98 kDa that is very weak in the protein pattern of PS-
COOH after exposure to rabbit plasma while it is intense in all other animal models
From Figure 68 it becomes clear that there are big differences when comparing different
animal models for in vivo application These differences can not only be related to the
animal model itself as the example of PS-COOH shows
Secondary the type of particles for this study was broadened Bionized nanoferrite (BNF)
particles with a shell of either crosslinked hydroxyethyl starch (HES) or dextran (DEX) were
investigated in terms of transferability from the different in vivo models to humans
Figure 69 Schematic structure of BNF-Starch and BNF-Dextran
120 The validated method of DLS was used to investigate the stability of both particles against
aggregation when introduced into the different plasma sources Table 19 summarizes the
results and Figure 70 or rather 71 show the corresponding ACFs of particleprotein
mixtures The differences are significant Both particles show distinct aggregate formation
in human and sheep plasma with sizes in the micrometer range In direct comparison the
formed aggregates in mouse and rabbit plasma are much smaller
Table 19 Aggregate sizes formed in the different blood plasma sources obtained by DLS
Figure 70 ACF at Θ = 30deg for BNF-DEX in human mouse sheep and rabbit plasma
Results and Discussion 121
Figure 71 ACF at Θ = 30deg for BNF-HES in human mouse sheep and rabbit plasma
Figures 70 and 71 show that huge differences for aggregate formation can be observed
within the discussed in vivo models Especially the significant discrepancy between mouse
and human plasma implies difficulties as the mouse model is often chosen for
experiments that depend on particleaggregate size like body distribution or cellular
uptake
The hard corona formation of BNF-DEX and ndashHES was analyzed by SDS-PAGE and zeta
potential measurements Figure 71A shows the respective protein patterns and Figure
71B gives an overview of particle surface charge
122
Figure 72 A) SDS-PAGE of protein coronas formed on BNF-HES and ndashDEX during incubation in human mouse sheep and rabbit plasma (performed by Johanna Simon) B) Zeta potential of uncoated as well as coated particles in the different plasma sources under investigation
Arising from Figure 72A the protein patterns of BNF-DEX and BNF-HES are very similar
after incubation in a respective protein source This can be related to the fact that both
surfaces are composed of related sugar structures and do not differ much in polarity The
polarity of surfaces is of great importance when it comes to protein adsorption as already
described in the introduction part But again differences between the different animal
models can be observed The protein patterns formed during incubation in mouse and
rabbit plasma look very similar This is interesting concerning the less distinct aggregate
formation of BNF-DEX and ndashHES in both The marked protein bands in Figure 72A are
typically observed in many protein patterns and can therefore possibly be related to
distinct proteins The protein band at ~ 45 kDa (marked in light blue see Figure 72A)
could correspond to apolipoprotein A-IV The protein band at ~66 kDa (marked in green
see Figure 72A) is typical for albumin adsorption In the lower molecular range at ~ 9 kDa
(marked in purple see Figure 72A) and ~ 28 kDa (marked in yellow see Figure 72A)
protein bands related to potential apolipoprotein C3 or rather apolipoprotein A-I can be
observed The protein band marked in red (see Figure 72A) at a molecular weight of ~ 56
kDa might correspond to the gamma chain of fibrinogen Like in the previously discussed
Results and Discussion 123 chapter 34 the composition of protein source used for corona formation critically
determines its compostion
The differences observed for the particlesacute surface charge before and after incubation
mirrored by the zeta potential in Figure 72B are smaller than the so far described ones for
polystyrene particles One explanation could be the reduced amount of adsorbed proteins
calculated from Pierce 660 nm Assay For the surface area of 005 m2 only 13-43 microg of
proteins adsorbed Compared to the values in chapter 623 this corresponds to only
~ 10 of the amount found for PS-NPs This can be related to the surface character as
well HES and DEX are rather hydrophilic while polystyrene is hydrophobic As the main
driving forces for protein adsorption are hydrophobic interactions more proteins adsorb
onto the latter ones
In conclusion the different plasma composition of the investigated in vivo models leads to
differences in plasma protein induced aggregation of nanoparticles These differences
vary from one to another model system and cannot be generalized but at least for BNF-
HES and ndashDEX similar trends have been evaluated
This means that for ideal characterization of particles used in vivo or rather in vitro their
stability against aggregation should be evaluated in the plasma of the used animal model
and in addition in human plasma Only when investigating the protein corona formation in
both animal model as well as human plasma a transfer is possible
Together with the results presented in chapters 32 and 33 an extensive evaluation
process for nanocarriers designed for biomedical applications prior to in vivo experiments
was demonstrated Light was shed on different aspects that could critically affect the
success of designed nanomedicines With this the biological identity a nanomaterial
adapts upon application can be predicted in an improved manner and also adjusted by
different coating procedures
124
37 FROM THE MODEL SYSTEM TOWARDS LIPOSOMES FOR BIOMEDICAL APPLICATION
So far the interactions of polystyrene particles as a model system with human blood
plasmaserum proteins has been investigated in order to obtain a better understanding of
the various factors that have an impact on protein-corona formation In addition the
transferability from in vivo models towards the human plasma was analyzed The next
study changes from the model system of PS-lattices towards liposomal formulations for
biomedical application
In chapter 371 the development of stealth liposomes is focused A novel hyperbranched
polyglycerol was evaluated as alternative for PEG Despite the prolonged blood circulation
times that are usually achieved with PEGylation of nanocarriers there are still some
drawbacks Due to its linear structure the polymer contains only one terminal hydroxyl
groups that can be used for modification with for instance antibodies It will be
demonstrated that the novel hyperbranched structure outplays PEG in terms of liposome
stabilization against aggregation
In chapter 372 the gained insights into liposome stabilization from chapter 361 will be
utilized for the development of liposomes containing a novel cationic spermine derivative
The novel compound was investigated in regards of complexation properties for siRNA
The liposomal formulations were optimized regarding their stability and investigated in
vitro as well as in vivo for the delivery of siRNA to the liver of mice It will be demonstrated
that the system showed promising results in vitro and in vivo for liver accumulation and
knockdown efficiency
371 EVALUATION OF MULTIFUNCTIONAL LIPOSOMES IN HUMAN BLOOD SERUM BY DYNAMIC LIGHT SCATTERING
This chapter focusses on the development and characterization of ldquostealthrdquo liposomes
modified with a novel hyperbranched polyglycerol lipid (Cholesterol-PEG30-hbPG23) An
emphasis was placed on the stability of these liposomes in comparison to those containing
a linear PEG derivative (Cholesterol-PEG44) directly in human blood serum characterized
via dynamic light scattering (DLS) The results presented have already been published and
are reprinted (adapted) with permission from (ldquoEvaluation of Multifunctional Liposomes in
Results and Discussion 125 Human Blood Serum by Light Scatteringrdquo Mohr et al Langmuir 2014 30 14954-14962)
Copyright copy 2014 American Chemical Society
Cholesterol as a natural membrane component has been widely used for the preparation
of liposomes and as an anchor for polymeric lipids in lipid bilayers151 Here cholesterol
was used as the initiator for the oxyanionic polymerization of various epoxides leading to
Ch-PEG44 and Ch-PEG30-hbPG23 because standard phospholipids could not be used due to
their instability to extreme reaction conditions during the reaction This technique allows
for the synthesis of well-defined amphiphilic polyether-lipids with molecular weights in
the range of conventional PEG-lipids used in sterically stabilized liposomes (2300 g mol-1
and 3400 g mol-1) and low polydispersities (MwMn 11 and 116 respectively) The
structures of Ch-PEG44 and Ch-PEG30-hbPG23 are shown in Figure 73 The synthesis of Ch-
PEG and Ch-PEG-hbPG was done by Dr Sophie Muumlller (AK Frey Johannes Gutenberg
University Mainz 2014)
Figure 73 Molecular structures of the cholesterol-based amphiphilic lipid ananlogues Reprinted (adapted) with permission from (ldquoEvaluation of Multifunctional Liposomes in Human Blood Serum by Light Scatteringrdquo Mohr et al Langmuir 2014 30 14954-14962) Copyright copy 2014 American Chemical Society
The red PEG-part (left) represents the linear architecture of the Ch-PEG44 amphiphile The
blue hydrophilic part (right) is the hyperbranched (hb) structure of the linear-hbPG lipid
which exhibits higher steric hindrance than its linear PEG analogue due to the globular
structure of the hyperbranched block
126
Figure 74 Cartoon of PEGylated liposomes Reprinted (adapted) with permission from (ldquoEvaluation of Multifunctional Liposomes in Human Blood Serum by Light Scatteringrdquo Mohr et al Langmuir 2014 30 14954-14962) Copyright copy 2014 American Chemical Society
Liposomes based on cholesterol and egg phosphatidylcholine (ECC) with variable content
of either the linear of hyperbranched PEG-derivative (see Figure 73) were prepared via the
thin film hydration method and extrusion technology (400 and 100 nm membranes) Table
20 gives the exact compositions of the liposomes that were under investigation
Table 20 Different molar ratios used for the preparation of sterically stabilized liposomes with L = liposomes Reprinted (adapted) with permission from (ldquoEvaluation of Multifunctional Liposomes in Human Blood Serum by Light Scatteringrdquo Mohr et al Langmuir 2014 30 14954-14962) Copyright copy 2014 American Chemical Society
L0
L10
-hb
PG
L10
-PEG
L15
-hb
PG
L15
-PEG
L20
-hb
PG
L20
-PEG
L30
-hb
PG
L30
-PEG
Ch-PEG44mol 0 0 10 0 15 0 20 0 30
Ch-PEG30-hbPG23mol 0 10 0 15 0 20 0 30 0
EPCmol 55 55 55 55 55 55 55 55 55
Results and Discussion 127 All liposomes were characterized via DLS in isotonic salt solution The z-averaged
hydrodynamic radii are summarized in Table 21 The angular dependency of the inverse
apparent hydrodynamic radius for all liposomal systems is shown in the literature21
Conventional liposomes (L0) without a polymer shell showed a radius of lt1Rhgtz -1 = 115
nm PEGylated liposomes with polymer contents between 10-30 mol had radii between
144 nm (L10-PEG) and 92 nm (L30-PEG) indicating that increasing the polymer content
resulted in a slight decrease in the size of the structures Liposomes containing Ch-PEG30-
hbPG23 exhibited radii between 81 nm (L15-hbPG) and 102 nm (L30-hbPG) and a
correlation between the radii and polymer content was not observed However the
detected sizes of the liposomes are generally smaller than those with linear Ch-PEG44
which may be attributed to a stronger effect on the liposome curvature by the bulky
hyperbranched segments
Table 21 Summary of the z-averaged hydrodynamic radii of all investigated liposomes Reprinted (adapted) with permission from (ldquoEvaluation of Multifunctional Liposomes in Human Blood Serum by Light Scatteringrdquo Mohr et al Langmuir 2014 30 14954-14962) Copyright copy 2014 American Chemical Society
L0
L10
-hb
PG
L10
-PEG
L15
-hb
PG
L15
-PEG
L20
-hb
PG
L20
-PEG
L30
-hb
PG
L30
-PEG
lt1Rhgtz
-1 nm 115 97 144 81 120 96 112 102 92
128
Figure 75 Cryo-Tem images of three different liposomes Reprinted (adapted) with permission from (ldquoEvaluation of Multifunctional Liposomes in Human Blood Serum by Light Scatteringrdquo Mohr et al Langmuir 2014 30 14954-14962) Copyright copy 2014 American Chemical Society (performed by Kristiane Rusitzka Biology Department Johannes Gutenberg University Mainz)
Cryo-TEM measurements of liposomes with the different polymers incorporated showed
the existence of vesicular structures and the successful formation of primarily unilamellar
assemblies As an example Figure 75 depicts the respective images for EPCcholesterol
liposomes with (15 mol Ch-PEG44 (B) or Ch-PEG30-hbPG23 (C)) or without polymer (A) The
non-stabilized (conventional) liposomes formed both spherical and non-spherical vesicles
whereas sterically stabilized liposomes predominantly showed spherical vesicles with a
narrower size distribution Additionally it was observed that the conventional liposomes
tended to overlap possibly aggregate whereas those that were stabilized by polymers
maintained spatial separation
It is imperative to characterize the aggregation behavior of any potential drug carrier in
human blood serum so the functionalized liposomes were analyzed by DLS Size changes
can be either caused by liposome-liposome bridging or by the formation of a protein
(multi-)layer at the liposome surface Since the investigation of L0 resulted in macroscopic
precipitation it was not possible to investigate these interactions with dynamic light
scattering Figure 76 gives an overview of the multicomponent analysis of the different
PEGylated liposomes in human blood serum
Results and Discussion 129
Figure 76 Liposomes containing Ch-PEG44 in human serum A) L10-PEG B) L15-PEG C) L20-PEG and D) L30-PEG ACF at Θ = 30deg including data points force fit (red) and aggregate fit (blue) Reprinted (adapted) with permission from (ldquoEvaluation of Multifunctional Liposomes in Human Blood Serum by Light Scatteringrdquo Mohr et al Langmuir 2014 30 14954-14962) Copyright copy 2014 American Chemical Society (measurements performed by Dr Kristin Mohr Max Planck Institute for Polymer Research Mainz)
There is aggregation for the PEGylated liposomes when they are introduced into human
blood serum with RhAgg = 330 nm (10 mol lipid) but the size of the aggregates decreased
(170 nm) as the amount of Ch-PEG44 (30 mol) was increased These values are much
smaller than those for unmodified liposomes which formed macroscopic aggregates and
demonstrated the stabilizing and shielding effects of the Ch-PEG44 on the assemblies
Yet liposomes stabilized with Ch-PEG30-hbPG23 showed an even better result when mixed
with human blood serum where the liposomes had no significant increase in their size in
DLS The corresponding ACFs are shown in the Figure below (Figure 77)
130
Figure 77 Liposomes containing Ch-PEG33-hbPG23 in human serum A) L10-hbPG B) L15-hbPG C) L20-hbPG and D) L30-hbPG ACF at Θ = 30deg including data points force fit (red) and aggregate fit (blue) Reprinted (adapted) with permission from (ldquoEvaluation of Multifunctional Liposomes in Human Blood Serum by Light Scatteringrdquo Mohr et al Langmuir 2014 30 14954-14962) Copyright copy 2014 American Chemical Society
To conclude it was the first time that the interaction between sterically stabilized
liposomes and human blood serum was investigated via dynamic light scattering (DLS)
This technique is a very sensitive method for the detection of aggregates and provides an
efficient tool to monitor their formation when polymer drug-delivery systems come into
contact with complex biological media In this work the behavior of two different kinds of
sterically stabilized liposomes was investigated containing either cholesterol-PEG44 or
linear-hyperbranched cholesterol-PEG30-hbPG23 with contents between 10-30 mol EPC
and cholesterol The systems were compared concerning their aggregation profile in blood
serum Liposomes containing Ch-PEG44 led to the formation of aggregates in the size range
between 170 nm to 330 nm (Rh) depending on the polymer amount while the
Ch-PEG30-hbPG23 modified liposomes were stable against aggregation despite the polymer
content Here the adsorption of plasma proteins is assumed to be less likely due to the
dense packing and multiple hydroxyl groups The results show the steric stabilizing effect
Results and Discussion 131 of the novel hyperbranched polyether lipids Thus based on the ability of hyperbranched
polyethers to minimize interactions between lipososomes and human blood serum their
relevance and potential advantages as drug delivery systems was demonstrated From the
data it is obvious that amphiphilic hyperbranched structures constitute a promising
alternative to PEGylated ldquostealthrdquo liposomes while showing favorable behavior in blood
serum and introducing multiple functional groups at the vesiclesrsquo surfaces
372 MULTICOMPONENT LIPOSOMES FOR SIRNA DELIVERY TO THE LIVER
This chapter focusses on the development of a liposomal system for siRNA delivery
consisting of cholesterol (Chol) distearoylphosphatidylcholine (DSPC) and surfactant TF
(1-hydroxy-50-amino-3471013161922-octaoxa-374145-triaza-pentacontane) a
novel spermine derivative (HO-EG8-C12-spermine) for improved siRNA delivery to cells in
vitro and in vivo The in vitro in vivo experiments were performed by Leonard Kaps
University medical center JGU The work presented in this chapter is already submitted as
full article2 The structure of TF is shown in Figure 78 It was synthesized by Dr Chai
Wenquiang (AK Schmidt Johannes Gutenberg University Mainz) It resembles an ABC
structure with A being the non-ionic hydrophilic PEG block B the hydrophobic alkyl middle
block and C the hydrophilic cationic spermine block The light yellow solid was
characterized by 1H NMR and mass spectrometry ESI-MS shows a single peak with a mass
to charge ratio of 73963 The amine groups of the spermine part were used to label the
surfactant TF with CW800-NHS ester The HPLC elugram showed exclusively the mono-
functionalized product (see Figure 79)
Figure 78 Chemical structure of surfactant TF
2 ldquoPhysicochemical and Preclinical Evaluation of Spermine-derived Surfactant Liposomes for in vitro and in
vivo siRNA-Delivery to Liver Macrophagesrdquo Laura K Muumlller Leonard Kaps Detlef Schuppanb Alexander Brose Chai Wenqiang Karl Fischer Sophie Muumlller Holger Frey Manfred Schmidt Kristin Mohr
132
Figure 79 A) 1H NMR of surfactant TF in CD3OD B) HPLC of dye cationic lipid TF and TF-
dye conjugate MN-HD8-column 12545microml T=20degC 10 min 595-1000
(THFwater+01TFA) (performed by Beate Muumlller AK Landfester MPIP)
This novel surfactant contains two hydrophilic head groups a cationic and a non-ionic
one that are interconnected by a C12 linker The surfactant was anticipated to combine
protein repellent characteristics of PEG with cationic charges required for siRNA
complexationencapsulation The surfactant TF was introduced into well-known liposomal
formulations (comprising cholesterol and DSPC) as a novel cationic component Moreover
the previously described hyperbranched lipid hbPG consisting of cholesterol as the
hydrophobic and a hyperbranched polyglycerol as the hydrophilic part was utilized since
it effectively provided steric shielding of liposomes against aggregate formation induced
by serum proteins The composition and absolute concentrations of all investigated
liposomes are given in Table 22
Table 22 Composition of investigated liposomes
Liposome L-110 L-111 L-112 L-114 L-114-hbPG
Weight ratio (CholDSPCTF) 110 111 112 114 114
Molar ratio (CholDSPCTF) 210 211 212 214 214
c(Chol) in EtOH (gL) 20 20 20 20 16
c(DSPC) in EtOH (gL) 20 20 20 20 20
c(TF) in EtOH (gL) 0 20 40 80 80
Ch-PEG22-hbPG35 in EtOH (gL) 0 0 0 0 36
c (total) in EtOH (gL) 40 60 80 120 152
c(total) in DPBS (gL) 087 133 133 133 133
c(TF) in DPBS (gL) 0 044 067 089 089
175 mol of cholesterol was replaced by hbPG corresponding to 5 mol hbPG of total lipid content
Results and Discussion 133 It is known that size and inner structure of liposomes are controllable by extrusion
through membranes ie by the pore diameter of the extrusion membrane72 and by the
extrusion speed Repeated extrusion through 50 nm pore size filters yielded mostly
unilamellar liposomes with a size range of 100-150 nm that is considered to be
appropriate for surpassing the fenestrated endothelium of liver cells All liposomes were
characterized by dynamic (DLS) and static light scattering (SLS) as well as by zeta potential
measurements (see Table 23 Figure 80) For the uncharged liposome L-110 the angular
dependence of both the apparent hydrodynamic radii lt1Rhgtapp and the reduced
scattering intensities ln(KcR) are very pronounced and curved downwards at low q
typically observed for samples with a very broad size distribution In contrast all other
samples exhibit linear dependencies of lt1Rhgtapp as function of q2 the slopes of which are
small but significantly larger than zero (expected for monodisperse spheres) Except for
samples L-110 the normalized second cumulants μ2 were determined to 01 lt μ2 lt 02
indicating moderately broad size distributions in qualitative agreement with the small
slopes of lt1Rhgtapp versus q2 The ρ-ratios defined by the ratio of the radius of gyration
(Rg) and the hydrodynamic radius (Rh) indicate the liposomes to form mostly unilamellar
vesicles that are also proven by cryo-TEM measurements (Figure 80)
Figure 80 Cryo-TEM images of A) L-111 loaded with siRNA and B) unloaded L-114-hbPG
(performed by Dr Max Bernhard3)
3 Dr Max Bernhard Ak Prof Dr Katharina Landfester 2015
134 The zeta potentials of all liposomes (see Table 23) are slightly negative despite the
presence of the cationic component TF Only the hbPG stabilized liposome exhibits neutral
charge At present these data cannot be properly explained It might indicate that the
spermine part of TF is predominantly located at the inner liposome surface although
simple volume considerations of spermine as compared to PEG8 do not necessarily
support this scenario
Table 23 Zeta potential DLS- and SLS-results of liposomes
liposome lt1Rhgtz-1
nm ltRg2gtz
12 nm ρ zeta potential mV
L-110 130 - - -98 plusmn 55
L-111 53 55 104 -53 plusmn 57
L-112 59 58 098 -
L-114 63 63 100 -77 plusmn 53
L-114-hbPG 63 63 100 13 plusmn 44
Could not be determined due to strongly curved Guinier plot
Figure 81 Angular dependency of the inverse hydrodynamic radius (A) and Guinier-plots (B) of liposomes
Results and Discussion 135 For further investigation the liposomal systems were analyzed by DLS regarding their
stability against aggregation in human blood serum by mixing equal volumes of liposome
and serum solution Figure 82 shows the corresponding ACFs including data points force
fit and fit in regards of aggregate formation
The stability of liposomes in serum depends strongly on their composition Liposomes
without incorporated cationic lipid formed aggregates in human serum with a size
Rh = 380 nm (measured at a scattering angle of 30deg) and contributed 56 to the total
scattering intensity From literature it is already known that liposomal formulations only
built up by cholesterol and phosphatidylcholines are not stable in biological environments
due to their similarity to naturally occurring lipoproteins60 When cationic lipid was added
to the liposomal formulation aggregation also took place but the size as well as the
contribution of the formed aggregates to the total scattering intensity decreased with
increasing amount of surfactant TF For example for liposome L-114 the aggregates in
human serum were significantly smaller (Rh = 195 nm) and contributed little to the total
intensity of the scattering (31)
As was shown before for liposomal formulations consisting of egg phosphatidylcholine
(EPC) and cholesterol the steric stabilization of liposomes by incorporation of
hyperbranched polyglycerol structures more effectively prevents aggregate formation in
human blood serum as compared to linear PEG surfactant Liposomes containing
PEGylated surfactant of up to 30 mol still showed aggregate formation in human serum
while those with 10 15 20 and 30 mol hyperbranched surfactant were stable Thus in
the present work 5 mol hyperbranched polyglycerol was added to the lipid mixture in
order to completely prevent aggregate formation in human serum as revealed by Figure
82
136
Figure 82 Autocorrelation functions of the different liposomal systems in human serum at 30deg and the respective aggregate size with its impact on the scattering intensity Red lines Force fit with the pure component correlation blue lines Fit with an additional aggregate term Residues of the respective fits are shown in the lower part of the graphs
When siRNA (anti-CD68) was dissolved in the aqueous phase prior to liposome formation
it was encapsulated to a very large extent by all liposomes ie between 81 and 97 as
proven by a Quant-iTTM RiboGreenreg assay (Table 24) As shown by cryo-TEM (see Figure
80) the siRNA loaded liposomes preserved their unilamellar structure Quantitative light
Results and Discussion 137 scattering results confirmed this observation since the ρ-ratios of liposomes loaded with
siRNA remained at values close to 1 (see Table 24 and Figure 83) Such high encapsulation
efficiencies are usually not achieved if the siRNA is just sterically trapped within the
vesicles Rather electrostatically driven complex formation is required to explain the high
siRNA load The latter scenario was also supported by the large NP ratio calculated from
the liposome composition Thus in the following the siRNA loaded liposomes are termed
lipoplexes
Table 24 Zeta potential DLS - SLS results and encapsulated amount of siRNA of loaded liposomes
liposome lt1Rhgtz-1
nm
ltRg2gtz
12
nm
ρ zeta
potential
mV
encapsulated
siRNA
NP
L-111 siRNA 52 48 092 -63plusmn68 97 17
L-112 siRNA 57 56 098 -37plusmn76 81 25
L-114 siRNA 61 58 095 -52plusmn96 90 34
L-114-hbPG
siRNA
si
62 - - -77plusmn59 90 34
Figure 83 A) Angular dependency of the inverse hydrodynamic radius of siRNA loaded liposomes B) Guinier-plots of siRNA-loaded liposomes
138 As shown in Figure 84 complex size and zeta potential were reproducible and did not
depend on the type of siRNA used
Figure 84 Zeta potential of L-111 in comparison to the zeta potential of L-111 loaded
with different types of siRNA
Prior to biological experiments the small but significant amount of free siRNA needs to be
removed by either dialysis and or by centrifugal filters Both methods were tested for
liposome L-111 and the results are shown in Figure 85 The size of the lipoplexes did not
change significantly during purification by centrifugal filters whereas the sizes decreased
by approximately 20 after dialysis Since application of centrifugal filter devices
decreased the free siRNA concentration to a lower level (01 as compared to 03 by
dialysis) this method was applied to all samples discussed below
Figure 85 Comparison of two different work-up procedures for L-111
Results and Discussion 139 Again the stability of lipoplexes against aggregation was evaluated by using dynamic light
scattering It was recently reported that aggregate formation of cationically charged
nanogels in serum depends on the siRNA loading ie aggregates were observed for bare
nanogels whereas no aggregates could be detected for siRNA loaded nanogels Thus a
direct comparison was made for liposomeslipoplexes L-114 and L-114-hbPG added to
pooled human blood plasma (see Figure 86) In contrast to Nuhn et al152 no significant
differences were observed between the bare liposomes and the lipoplexes loaded with
siRNA Again hbPG stabilized lipoplexes L-114-hbPG did not aggregate in plasma
whereas for L-114 lipoplex aggregates of Rh = 250 nm were detected that were in a
similar size range as those observed in serum
Figure 86 Correlation functions (recorded 30deg scattering angle) of liposomes and siRNA loaded liposomes in 50 human plasma A) liposome consisting of DSPC Chol and lipid TF B) liposome in A loaded with siRNA (NP = 34) C) liposome consisting of Chol DSPC TF and hb-PG D) liposome in C loaded with siRNA (NP = 34) Red lines Force fit with the pure component correlation function blue lines Fit with an additional aggregate ter Residues of the respective fits are shown in the lower part of the graphs
140 Prior to in vivo applications cytotoxicity and in vitro knockdown efficiency of lipoplex
L-114 was evaluated As shown in Figure 867a) L-114 lipoplexes loaded with scrambled
siRNA (scsiRNA) caused no in vitro cytotoxicity in MHS macrophages even at
concentrations corresponding to 600 nM siRNA that are far above the concentrations
required for in vitro or in vivo gene knockdown L-1-14 loaded with 100 nM anti-CD68
siRNA achieved a significant CD68 knockdown (40 vs the PBS control) in MHS cells
whereas L-114 lipoplexes loaded with scrambled siRNA (scsiRNA) revealed no effect
(Figure 87b))
Figure 87 a) Viability of MHS macrophages in response to increasing amounts of L-114 lipoplex loaded with scrambled siRNA normalized to PBS incubation time 24 h (n = 3) MEAN plusmn SD b) In vitro knockdown by L-114 (NP) loaded with anti-CD68 siRNA after 24 h scsiRNA negative control p lt 005 (n =3) MEAN plusmn SD (measurements performed by Leonard Kaps Medical department of the Johannes Gutenberg University Mainz)
Macrophages are a central part of the innate immune system expressing a variety of
danger sensing receptor such as the toll like receptors (TLRs) that are involved in anti-
bacterial and anti-viral immune defense L-114 loaded with antiCD68 siRNA did show a
robust knockdown at a reasonable siRNA concentration of 100 mM without signs of off-
target effects in vitro the liposomal formulations qualified for further investigations Both
lipoplexes L-114 and L-114-hbPG were tested in vivo to assess efficacy in macrophage
Results and Discussion 141 targeting and to elucidate potential effects of serum-induced aggregate formation on in
vivo performance
In vivo particle biodistribution studies require a detectable dye with an emission in the
near infrared (NIR) wavelength spectrum that is being less absorbed by tissue and blood
than emission in the visible range Therefore 5 mol of TF was replaced by CW800-
labeled lipid TF in both liposomal formulations
Mice (n = 3 per group) received two retroorbital injections 48 h apart of 1 or 2 mgkg anti-
CD68 siRNA loaded into L-114 or L-114-hbPG or an equivalent volume of PBS (Figure 88
top)
Figure 88 (bottom) shows the biodistribution of CW800 labeled L-114 and L-114-hbPG
lipoplexes at 0 1 3 6 24 and 48 h after injection At 0 to 6 h after intravenous injection
both lipoplexes displayed some disassembly since free NIR dye was cleared by the kidneys
and further ended up in the bladder However at 48 h the cleared dye accumulated
predominantly in the liver suggesting that stable lipoplexes are sequestered in the liver
while degraded lipoplexes are rapidly cleared via the kidney
142
Figure 88 Top) In vivo knockdown outline Mice received two retroorbital injections of 1 or 2 anti-CD68 siRNA encapsulated in L-114 or L-114-hbPG in vivo imaging period indicated above timeline Bottom) In vivo images system (IVIS) pictures of mice injected with 1 mgkg or 2 mgkg antiCD68 siRNA loaded in L-114 lipoplexes (left) or L-1-14-hbPG hbPG stabilized lipoplexe (right) labeled with CW800 near infrared dye at 0 1 3 24 and 48h (measurements performed by Leonard Kaps)
Results and Discussion 143
Figure 89 Ex vivo organ quantification of L-114 lipolplex (blue) and L-1-14-hbPG (red) labeled with near infrared dye 48 h after the second injection p lt 0001 MEAN plusmn SD (measurements performed by Leonard Kaps)
48 h after the second lipoplex injection organs were imaged ex vivo (see Figure 90) Such
ex vivo organ images allow a more accurate quantification of lipoplex biodistribution Both
the simple lipoplex L-114 and the hbPG derivatized L-114-hbPG lipoplex accumulated in
the liver in a dose-dependent manner with L-114-hbPG showing a higher signal (Figure
89) which may be due to their longer blood circulation time originating from better
stealth properties against in vivo serum protein interaction
144
Figure 90 IVIS pictures of ex vivo organs from mice that were injected with 1 mgkg or 2 mgkg antiCD68 siRNA loaded in L-114 or L-1-14-hbPG respectively labeled with near infrared dye 48h after injection (measurements performed by Leonard Kaps)
After the second injection of the lipoplexes liver macrophages (CD45+ F480+-cells) were
isolated and subjected to FACS analysis to determine the in vivo macrophage-specific
uptake of the lipoplexes 48 h after the second injection approximately 3-6 of both
lipoplexes were taken up to by liver resident macrophages (Figure 91) This dose-
dependent uptake of both lipoplexes is lower than that of siRNA loaded nanogels that
were recently investigated
The two lipoplex formulations loaded with two concentrations of anti-CD68 siRNA (1 and
2 mgkg siRNA) induced a significant in vivo knockdown of up to 70 while lipoplexes
loaded with scrambled siRNA did not show any off target knockdown (Figure 92)
Results and Discussion 145
Figure 91 In vivo liver resident macrophage uptake of L-114 lipoplex (blue) and L-1-14-hbPG lipoplex (red) labeled with NIR dye 48 h after the second injection MEAN plusmn SD (measurements performed by Leonard Kaps)
Figure 92 In vivo knockdown of the macrophage specific gene CD68 in the liver of mice that were injected twice with 1 mgkg or 2 mgkg anti-CD68 siRNA loaded into L-114 (blue) or L-1-14-hbPG lipoplexe (red) plt001 for anti-CD68 siRNA vs negative controls MEAN plusmn SD (measurements performed by Leonard Kaps)
146 The successful in vivo knockdown demonstrates a functional siRNA delivery of both
liposomal formulations in liver macrophages in vitro and notably in vivo Interestingly the
applied 1 mgkg dose appears to be equally potent as the 2 mgkg siRNA dose and lower
concentrations may still be effective
In conclusion it could be demonstrated that serum or blood plasma induced aggregate
formation of liposomes and liposome-siRNA complexes (lipoplexes) may be avoided if the
surface is sterically shielded by incorporation of appropriate lipids that contain a short
polymer chain In the present work aggregate formation could be completely suppressed
by introduction of a novel lipid consisting of a cholesterol anchor and hyperbranched
polyglycerol Simple and sterically shielded liposomes almost quantitatively encapsulated
siRNA at NP = 34 The resulting lipoplexes showed promising results in in vitro and in vivo
studies of liver accumulation and knockdown efficiency towards the macrophage-specific
CD68 mRNA Another important conclusion is that for the investigated lipoplexes
serumplasma induced aggregates of as large as 500 nm in size (Rh = 250 nm) increase
cellular uptake and have no detectable effect on knockdown efficiency Likewise no
obvious side effects were observed for mice during the experimental time of up to 96
hours
summary and outlook 147
4 SUMMARY AND OUTLOOK
Within this work effort was taken towards a better understanding of the interactions
between nanomaterials and proteins of the human plasma proteome A closer look was
taken on the gap between the synthetic and biological identity of nanomaterials that
limits the biomedical application of nanocarriers so far
The most abundant proteins HSA and IgG were removed from human blood plasma
effectively This allowed the investigation of the single proteins but more importantly also
of various low abundant protein mixtures Plain polystyrene as well as amino-
functionalized polystyrene particles have been coated with FPlasma-wo-IgG-HSA in order to
successfully prevent the particles from aggregation under in vivo conditions In addition it
turned out that those decorated particles also were taken up by macrophages very
weakly meaning that the introduced pre-coating could also prolong blood circulation time
when it comes to administration For carboxy-functionalized polystyrene particles the
stabilizating against aggregation was possible with IgG but the coating and subsequent
redispersion lead to an increase in size
FPlasma-wo-IgG that was also obtained by plasma fractionation could be used for particle
stabilization when used as surfactant during polystyrene synthesis While the aggregation
behaviour was comparable to Lutensol-stabilzed particles this offers the possibility of
passing on chemical surfactants completely
The concept of pre-coating nanoparticles in order to tune their stability against
aggregation was also utilized to overcome the fluctuation in the blood proteome
composition when looking at different individuals Once formed protein coronas on the
polystyrene particles under investigation remained stable even when re-introduced into
another protein source (in this case pooled human serum) This could be of special
interest for drug carrier preparation prior to administration
The above mentioned transfer of a protein corona was not only limited to the change
from one protein medium into another It was also possible to transfer the protein corona
that was formed on ldquostealthrdquo nanocarriers onto non-modified nanoparticles The transfer
was successful in order to stabilize a respective particle against aggregation but the
148 reduced cellular uptake that is characteristic for the ldquostealthrdquo effect could not be
achieved This could have originated in the denaturation of proteins when detaching them
from the particles with SDS The introduced method offers new possibilities for blood
plasma fractionation by resins that can be inserted into an HPLC system In addition the
possibility of corona transfer could be useful for nanocarriers that are not suitable for
surface modification with ldquostealthrdquo polymers
Light was shed on the gap between different in vivo models and humans The protein
corona formation and the stability of particles under investigation strongly depends on
the protein source that is used as a model Results shown in this work suggest that the
investigation of particles regarding their stability against aggregation in plasma of the used
in vivo in vitro model as well as in human plasma is necessary to obtain a full
understanding of the protein particle interactions
Liposomes for siRNA delivery in vivo were optimized regarding their stability in human
serum plasma by modifying their surface with a novel hyperbranched polyglycerol The
encapsulation efficiency for siRNA of the liposomal structures was excellent The resulting
lipoplexes showed promising results in knockdown efficiency towards the macrophage
specific CD-68 mRNA in vivo
Altogether this study throws light on different parameters effecting the protein corona
formation as well as protein-induced aggregation of nanoparticles Moreover suggestions
were introduced of how these interactions could be used in order to control a particles
response upon introduction in biological media
Experimental section 149
5 EXPERIMENTAL SECTION
51 LIST OF EQUIPMENT
Equipment Purchaser
ToyoScreen AF-rProtein A HC-650F tosohbioscience DE
ToyoScreen AF-Blue HC-650M tosohbioscience DE
ToyoScreen DEAE-650M tosohbioscience DE
Agilent Technologies 1200 series Agilent Technologies USA
UV-detector Agilent Technologies USA
Diode Array Detector Agilent Technologies USA
MN HD8 12545microm column Macherey-Nagel DE
Evaporative Lightscattering Detector 385-LC Varian USA
ALVCGS 3 ALV GmbH DE
ALV-5004 multiple tau full digital correlator ALV GmbH DE
ALV-CGS 8F SLSDLS 5022F goniometer ALV GmbH DE
ALV-7004 correlators ALV GmbH DE
QEAPD Avalanche photodiode detector ALV GmbH DE
ALV-5000 multiple tau full digital correlator ALV GmbH DE
Prometheus NT48 Nanotemper Technologies DE
HeNe-Laser JDS Uniphase USA
Liposofast Extruder Avestin Europe GmbH DE
Liposofast Stabilizer Avestin Europe GmbH DE
Polycarbonate membranes Avestin Europe GmbH DE
150
Gas tight syringe Avestin Europe GmbH DE
Branson W450 digital sonifier GHEINEMANN DE
JEM-1400 electron microscope JEOL DE
Zetasizer Nano Z Malvern Instruments GmbH DE
Muumltek particle charge detector BTG DE
Titrino Automatic Titrator Metrohm AG CHE
cLSM Leica SP5 II with CW-STED Leica DE
Flow cytometer CyFlow ML Partec DE
Plate Reader Infinite M1000 Tecan DE
Power Supply Bio-Rad USA
SDS-PAGE Chamber MiniGel Tank Lifetechnologies USA
nanoACQUITY UPLC Waters USA
Synapt G2-Si mass spectrometer Waters USA
Bruker Avance 300 Spectrometer Bruker Corporation USA
Jasco J-815 spectrometer JASCO USA
NuPAGE 10 BisTris Protein Gel Novex ThermoFisher Scientific USA
NuPAGE LDS sample buffer Novex ThermoFisher Scientific USA
NuPAGE sample reducing agent Novex ThermoFisher Scientific USA
NuPAGE MES SDS running buffer Novex ThermoFisher Scientific USA
SeeBlue Plus2 Pre-Stained Standard Invitrogen USA
Simply Blue SafeStain Novex ThermoFisher Scientific USA
SilverQuestTM Silver Staining Kit ThermoFisher Scientific USA
Piercereg 660 nm assay ThermoScientific USA
Experimental section 151
Piercereg Detergent removal Spin Column ThermoScientific USA
Quant-itTM RiboGreen Assay Invitrogen USA
BCA Protein Macro Assay Kit SERVA Electrophoresis DE
Millex-LCR450nm filter Millipore IRL
Millex-GS220nm filter MerckMillipore DE
52 METHODS
521 FRACTIONATION OF HUMAN BLOOD PLASMA
Dulbeccoacutes phosphate buffered saline (DPBS) without calcium and magnesium was
purchased from Gibcolifetechnologies Germany The human blood plasma (citrate
stabilized) was prepared according to standard guidelines was obtained from the blood
transfusion service at the University Clinic of MainzGermany and aliquots stored at -80 degC
before used Human Serum Albumin (HSA) as well as Trizmareg hydrochloride solution was
purchased from Sigma Aldrich USA The protein fibrinogen was purchased from Aventis
Behring and immunoglobulin G from privigenreg (10 solution CSL Behring USA)
For separation of IgG a ToyoScreen AF-rProtein A HC-650F column (1 mL
tosohbioscoience Germany) was used with 001M TrisHCl (pH=74) as running buffer
(RB) The column was run as recommended by the manufacturer at 3 bar which was
achieved with a flow rate of 05 mLmin Before loading a sample the HPLC system was
purged with running buffer for 30 min until the baseline was constant over time
The human plasma was diluted 13 and filtered with LCR 450 nm filters to remove possible
protein-aggregates To avoid overload only 05 mL of sample were loaded on the column
The maximum load was determined prior to use at 07 mL 13 diluted plasma which
corresponds to 23 mg IgG The flow through was collected between 60 s and 270 s After
waiting for several minutes 2 mL of 02 M citric acid were injected One minute after
injection IgG was collected for 2 min and the fraction neutralized with 330 microL 1M tris base
solution
152 For separation of albumin a ToyoScreen AF-Blue HC-650M column (5mL tosohbioscience
Germany) was used with the similar running buffer as described earlier Prior to use the
column was washed with 20 mL deuterium oxide as well as 20 mL 2M guanidine After
running the system for 30 min with running buffer (3 bar 05 mLmin) until the baseline
was constant over time 05 mL of 12 diluted plasma was injected in order to achieve a
concentrated flowthrough The flowthrough was collected between 400 and 1200 min
45 min after the injection of 7 mL 2 M NaCl albumin was collected for 6 min
For anion exchange chromatography a ToyoScreen DEAE-650M column (1 mL
tosohbioscience Germany) was used Plasma was diluted 110 and filtered with LCR 450
nm filters prior to use 05 mL of sample were loaded on the column and the flow through
catched between 1 and 4 min The flow through was recirculated two times The four
elution fractions were obtained by subsequent injection of 0155 M 03 M 05 M and 1 M
NaCl 01 mL each
Protein concentrations in human plasma as well as in different fractions were determined
with a BCA Protein Macro Assay Kit from SERVA electrophoresis Germany according to
manufacturer Absorption at 562 nm was measured with a Tecan infinite M1000
For SDS PAGE 65 microL of the protein sample was mixed with 25 microL NuPAGE LDS Sample
Buffer and 1 microL NuPAGE Sample Reducing Agent and applied onto a NuPAGE 10 Bis Tris
Protein Gel (all Novex Thermo Fisher Scientific USA) The electrophoresis was carried out
in NuPAGE MES SDS Running Buffer at 100 V for 2 h with SeeBlue Plus2 Pre-Stained
Standard (Invitrogen USA) as a molecular marker The gel was stained using SimplyBlue
SafeStain (Novex Thermo Fisher Scientific)
For LC-MS analysis (performed by Susanne Schoumlttler or Johanna Simon) proteins were
digested following the protocol of Tenzer et al122 with following modifications 25 microg of
each protein sample was precipitated and trypsin was used with a 150 ratio
(enzymeprotein) For LC-MS analysis the samples were diluted 10-fold with aqueous 01
formic acid and spiked with 50 fmolmicroL Hi3 EColi Standard (Waters Corporation Germany)
for absolute quantification Quantitative analysis of protein samples was performed using
a nanoACQUITY UPLC system coupled with a Synapt G2-Si mass spectrometer (Waters
Corporation) Tryptic peptides were separated on the nanoACQUITY system equipped
Experimental section 153 with a C18 analytical reversed-phase column (17thinspμm 75 μm x 150 mm Waters
Corporation) and a C18 nanoACQUITY Trap Column (5 microm 180 microm x 20 mm Waters
Corporation) Samples were processed with mobile phase A consisting of 01 (vv) formic
acid in water and mobile phase B consisting of acetonitrile with 01 (vv) formic acid The
separation was performed at a sample flow rate of 03 microLmin using a gradient of 2-37
mobile phase B over 70 min As a reference compound 150 fmolmicroL Glu-Fibrinopeptide
was infused at a flow rate of 05 microLmin
Data-independent acquisition (MSE) experiments were performed on the Synapt G2-Si
operated in resolution mode Electrospray Ionization was performed in positive ion mode
using a NanoLockSpray source Data was acquired over a range of mz 50-2000 Da with a
scan time of 1 s ramped trap collision energy from 20 to 40 V with a total acquisition time
of 90 min All samples were analyzed in two technical replicates Data acquisition and
processing was carried out using MassLynx 41 and TansOmics Informatics software was
used to process data and identify peptides Data were post acquisition lock mass
corrected Noise reduction thresholds for low energy high energy and peptide intensity
were fixed at 120 25 and 750 counts respectively During database searches the protein
false discovery rate was set at 4 The generated peptide masses were searched against a
reviewed human protein sequence database downloaded from Uniprot The following
criteria were used for the search one missed cleavage maximum protein mass 600 kDa
fixed carbamidomethyl modification for cysteine and variable oxidation for methionine
For identification a peptide was required to have at least three assigned fragments and a
protein was required to have at least two assigned peptides and five assigned fragments
Quantitative data were generated based on the TOP3Hi3 approach[32] Quantitative data
were generated based on the TOP3Hi3 approach[32] providing the amount of each
protein in fmol
154
522 FRACTIONS OF PROTEIN MIXTURE DIFFERENTIALLY AGGREGATE NANOPARTICLES AND INFLUENCE THE CELLULAR UPTAKE
5221 SYNTHESIS OF PS PARTICLES ( BY KATJA KLEIN4)
A direct miniemulsion co-polymerization method according to previously published work
was used to synthesize functionalized as well as non-functionalized polystyrene
nanoparticles (NP) Briefly a total monomer amount of 6 g was used for each particle In
case of the non-functionalized NP this means 6 g styrene (Merck Germany) For the
functionalized particles 588 g styrene and 012 g functionalized co-monomer were used
For the preparation of negatively charged polystyrene nanoparticles acrylic acid (Aldrich
USA) 252 mg hexadecane (Aldrich) 5 mg arcBODIPY (for measurements that did not need
a fluorescent dye it was omitted) and 100 mg V59 (Wako chemicals Japan) as initiator
were added to a solution of 06 g Lutensol AT50 (BASF Germany) in 24 mL water under
vigorous stirring to prepare PS-COOH NPs For the synthesis of positively charged
polystyrene nanoparticles 2-aminoethyl methacrylate hydrochloride (AEMH Aldrich
Germany)) was added to the water phase and combined with the disperse phase as
described above to prepare PS-NH2 After combining water and disperse phase each
preparation was stirred for one hour and the emulsions afterwards ultrasonificated for
two minutes at 90 intensity (Branson Sonifier 12rdquo tip 450 W) After polymerization at
72 degC for 12 h the NPs were purified by centrifugation and redispersion in water three
times (13000 rpm 3-4 h)
5222 TRANSMISSION ELECTRON MICROSCOPY (TEM) (PERFORMED BY CHRISTOPH
SIEBERT5)
Transmission electron microscopy was carried out with a JEOL JEM-1400 electron
miscroscope operating at an acceleration voltage of 120 kV The samples were prepared
by diluting the 1 wt dispersion 150 with water One droplet was placed on a 300 mesh
carbon-coated copper grid and dried overnight
4 Katja Klein AK Prof Dr Katharina Landfester MPIP
5 Christoph Siebert AK Prof Dr Katharina Landfester MPIP
Experimental section 155
5223 DYNAMIC LIGHT SCATTERING (DLS)
All light scattering experiments were done on a commercially available instrument from
ALV GmbH (Langen Germany) consisting of an electronically controlled goniometer and
an ALV-5000 multiple tau full-digital correlators with 320 channels equipped with an
HeNe Laser 1 mL protein solutions as well as concentrated human plasma were filtered
through Millex GS 220nm filters into cylindrical quartz cuvettes (20 mm diameter Hellma
Muumlllheim) Particle dispersions were diluted 11000 with PBS running buffer or protein
solution and measured without filtering to avoid changes within the system under
investigation (5x10⁻⁴ m2 particle surface area per mg protein)
5224 PARTICLE CHARGE DETECTION (PCD) (PERFORMED BY ELKE MUTH6)
The amount of amine or carboxyl groups on the particle surface was calculated from
titration performed on a particle charge detector PCD 02 (Muumltek GmbH Germany)
combined with a Titrino Automatic Titrator 702 SM (Metrohm AG Switzerland) Carboxyl
groups were titrated against positively charged poly(diallyl dimethyl ammonium chloride)
(PDADAMC) while amino groups were titrated against negatively charged polyelectrolyte
standard sodium poly(ethylene sulfonate) (Pes-Na) 10 mL of the dispersion under
investigation with a solid content of 1 gL were titrated
5225 ZETA POTENTIAL
For determination of the zeta (ζ) potential of the different polystyrene nanoparticles a
Malvern zetasizer nano series instrument was used 20 microL of the respective dispersion was
diluted in 2 mL 1 mM KCl and filled into appropriate disposable folded capillary cells
5226 PROTEIN CORONA PREPARATION
Each nanoparticle was incubated with human plasma or the obtained protein fractions at
constant ratio of particle surface area to protein amount (5x10⁻³ m2 particle surface area
per mg protein) for one hour at 37 degC Unbound proteins in the supernatant were
separated from particles by centrifugation at 20000g for 30 min The coated particle
6 Elke Muth AK Prof Dr Katharina Landfester MPIP
156 pellet was resuspended in running buffer and in case for SDS-Page washed by three
centrifugation steps at 20000g for 30 min and subsequent redispersion in buffer For LC-
MS and protein quantification proteins were eluted from the nanoparticles by dissolving
the pellet in 300 microL of buffer (7M Urea 2 M Thiourea 4 CHAPS) The amount of proteins
was quantified using Pierce 660nm protein Assay (Thermo Scientific Germany) according
to manufacturers instructions and absortion at 660 nm was measured with a Tecan
infinite M1000
5227 CIRCULAR DICHROISM SPECTROSCOPY
CD spectra were recorded with a Jasco J-815 spectrometer equipped with a PTC-423S
Peltier type temperature-control system Measurements were perfomed at 37 degC in a 10
mm cell from 300 to 190 nm with a band width of 1 nm and a scanning speed of 20 nms
Proteins were dissolved in PBS or running buffer with a concentration of 1 gL
5228 MACROPHAGES
Murine macrophage-like cells (RAW 2647) were kept in Dulbeccoacutes modified eagle
medium (DMEM Invitrogen USA) supplement with 10 fetal bovine serum (FBS Sigma
Aldrich USA) and 1 penicillinstreptomycin (Invitrogen USA) Cells were grown in
humidified incubator at 37 degC and 5 CO2
5229 FLOW CYTOMETRY (PERFORMED BY JOHANNA SIMON)
1 x 10⁵ cellsmL (RAW 2647) were allowed to attach in six-well plates (2 mL per well)
After 12 h the cells were washed with DPBS to remove all proteins from FBS and kept in
DMEM without additional proteins Pre-coated nanoparticles (75 microgmL) were added to
cells and incubated for 2 h For further flow cytometry analysis cells were washed with
DPBS detached with trypsin (Invitrogen USA) centrifuged (4 min 266 g) and
resuspended in DPBS Flow cytometry measurements were performed on a CyFlow ML
cytometer (Partec Germany) with a 488 nm laser to excite the fluorescent labelled
nanoparticles and a 527 nm pass filter for emission detection (fluorescence channel 1
FL1) With FCS Express V4 (DeNovo Software USA) cells were selected on a forward
scattersideward scatter plot thereby excluding cell debris The gated events were further
Experimental section 157 analyzed in the FL1 channels The median in the FL1 channel (MFI) was determined from a
1D histogram as a relative figure for the amount of nanoparticles taken up or associated
with cells
As different nanoparticles contained different amounts of dye the fluorescence intensity
for each particle was measured with a Tecan Infinite R M1000 PRO microplate reader with
standard settings of the software icontrol reg at an excitation and emission wavelengths of
523 nm and 536 nm The fluorescence intensity values of each nanoparticle (FINP) were
further normalized (nFINP) to the fluorescence intensity value for PS particles (FIPS) to
further normalize the median fluorescence intensity (MFI) obtained from flow cytometry
measurements The following equations were used
n(FI)NP= FINP FIPS
nMFI=MFI(n(FI)NP )
For each cell uptake experiment the normalized median fluorescence intensity values
nMFI of uncoated nanoparticles (nMFI_) was determined to compare nMFI values of pre-
coated particles from different cell experiments According to this relative fluorescence
intensity values rMFI were calculated with the equation
rMFI=nMFInMFI_
52210 CONFOCAL LASER SCANNING MICROSCOPY (CLSM) (PERFORMED BY DR ANKE
KALTBEITZEL7)
1 x 10⁵ cellsmL (RAW 2647) were seeded in Ibidi iTreat μ-dishes (IBIDI Germany) for 24
h washed with PBS and kept in DMEM without additional proteins 75 microgmL pre-
incubated nanoparticles were added to cells for 2 h Afterwards cells were washed with
PBS three times and stained with CellMask Orange (CMO stock solution 5 mgmL in
DMSO Invitrogen USA) which labeled the cell membrane red CMO (02 microL) was diluted
with one mL of Hanksacute Balanced Salt solution (HBSS Life technologies USA) After adding
the diluted staining solution (400 microL) to cells live cell images were taken on a Leica TCS
7 Dr Anke Kaltbeitzel AK Prof Dr Katharina Landfester
158 SP5 II microscope with an HC PL APO CS 63x14 oil objective using the software LAS AF
3000 software The fluorescence signals of nanoparticles (excitation 488 nm pseudo
colored green) and CMO (excitation 561 nm pseudo colored red) were detected in a
serial scan mode at 502 ndash 534 nm and 579 ndash 642 nm
52211 SDS-PAGE AND LC-MS
Experiments were performed according to chapter 521
52212 SYNTHESIS OF POLYSTYRENE WITH PROTEINS AS SURFACTANT
The CMC of IgG depleted Plasma at the air water interface was determined using DCAT 21
from DataPhysics with a Du Nouumly-Ring RG11 Protein solution in water was added
dropwise up to a concentration of 05 gL and the change in surface tension detected
A direct miniemulsion co-polymerization method according to previously published work
was used to synthesize non-functionalized polystyrene nanoparticles (NP) Briefly 5 mg of
initiator V59 (Wakoo chemicals Japan) was dissolved in 560 microL styrene (Merck Germany)
with 32 microL hexadecane (gt 99 Sigma Aldrich) as osmotic pressure reagent 59 microL of this
stock solution was added to 2 mL of protein solution in water (c= 1 mgmL) The mixture
was stirred for 1 hour at room temperature and 1000 rpm Afterwards the emulsion was
ultrasonificated for two minutes at 70 intensity (indirect ultrasonifier branson digital
sonifier) and the polymerization carried out at 65 degC for 12 h The dispersion was diluted
and purified by centrifugation at 4000 rpm for 10 minutes The solid content of the
resulting dispersion was determined to be 05
Cell toxicity of the particles was determined by using a CellTiter-Gloreg Assay according to
manufacturer for particle concentrations from 75 up to 1200 microgmL For the SDS-Page the
SilverQuesttrade Silver Staining Kit from ThermoFisher Scientific was used as recommended
by manufacturer
Experimental section 159
52213 FLUORESCENT CORRELATION SPECTROSCOPY (FCS) (PERFORMED BY JENNIFER
SCHULTZE MPIP)
FCS experiments were performed using a commercial setup (Zeiss Germany) consisting of
the module ConfoCor 2 and an inverted microscope model Axiovert 200 with a Zeiss C-
Apochromat 40times12W water immersion objective
Dyes were excited by an argon laser (488 nm) Fluorescence light was filtered (LP 505 long
pass emission filter) and collected by an avalanche photodiode that enables single-photon
counting Eight-well polystyrene-chambered coverglass (Laboratory-Tek Nalge Nunc
International) was used as a sample cell
For each solution a series of 50 measurements (10 s each) were performed
The confocal observation volume was calibrated using AlexaFlour488 as a reference dye
with a known diffusion coefficient
523 HUMAN BLOOD PLASMA VERSUS SERUM
DLS measurements were performed according to chapter 521-2 All protein sources were
centrifuged prior to DLS measurements (20000 g 30 min) The experimental setup of
cited cell experiments as well as the origin of the protein sources and particles is already
published137
524 EVALUATION OF NP STABILITY IN HUMAN BLOOD SERUM
DLS LC-MS SDS-PAGE and zeta potential experiments were performed according to
chapter 521-2 The human serum pool was centrifuged prior to the introduction of
coated particles (20000 g 30 min)
160
5241 PROTEIN CORONA FORMATION
005 m2 or particle surface area were introduced into 500 microL individual serum or pooled
human serum and incubated for 1 h at 37 degC For light scattering experiments the
particles were separated from unbound proteins via centrifugation for 30 min at 20000 g
and the pellet resuspended in PBS For SDS-PAGE LC-MS analysis and zeta potential
determination the pellet was washed thrice with PBS and subsequent centrifugation at
20000 g for 30 min For SDS-Page proteins were eluted from the nanoparticles by
dissolving the pellet in 300 microL of buffer (7M Urea 2 M Thiourea 4 CHAPS) for LC-MS 2
SDS (gt 95 Merck) (solution (wv) in 625 mM TrisbullHCl was used The amount of proteins
was quantified using Pierce 660nm protein Assay (Thermo Scientific Germany) according
to manufacturers instructions and absorption at 660 nm was measured with a Tecan
infinite M1000 The human serum pool was centrifuged prior to the introduction of
coated particles (20000 g 30 min)
5242 HEAT INACTIVATION OF HUMAN SERUM
Serum was heated up to 56 degC for one hour and centrifuged for 30 min at 20000 g prior to
use
5243 NANO-DSF MEASUREMENTS
All proteins were dissolved wit c = 1 gL in PBS Clusterin (recombinant AG Koch-Brandt
JGU Mainz) was an exception and was dissolved with c = 014 gL The samples were
heated up from 20 degC to 95 degC with a heating rate of 1 degC min
5244 DILUTION AS TOOL FOR PRE-COATING
For DLS measurements the particles were introduced into concentrated human plasma
(centrifuged for 30 min at 20000 g and filtered with GS 220 nm filters into the cuvette) at
a constant ratio of 5x10⁻³ m2 per mg serum The overall solution was diluted 12 15 and
110 The dilution was done by diluting the plasma prior to particle introduction
Experimental section 161
525 THE TRANSFER OF A PROTEIN CORONA
LC-MS as well as nanoDSF and DLS measurements were performed as previously
described The protein concentration for nanoDSF measurements in PBS was c = 03 gL
PS-NH2 with CTMA-Cl as surfactant was synthesized by Katja Klein according to
literature107 The NH2-functionalization was determined by a fluorescamine assay The
NHS-coupling was performed by Thomas Wolf 5 mL of 1 particle dispersion (pH = 8)
were stirred at room temperature and 5 eq (in relation to the amine groups) PEG-ester
added in three equivalents with 20 min time lag After additional stirring for one hour the
particles were purified by subsequent centrifugation (20000 g 1 h) and redispersion of
the particle pellet thrice In addition the dispersion was afterwards dialyzed against water
with a cut off of MW = 50 kDa PEG functionalization was determined by NMR
spectroscopy
5251 OBTAINING STEALTH PROTEINS
005 m2 of PS-PEG5000 surface area were incubated in 500 microL human plasma for 1 hour at
37 degC Afterwards unbound and weakly bound proteins were removed via centrifugation
at 20000 g for 30 min The pellet was washed via resuspension in PBS and subsequent
centrifugation thrice After the last centrifugation step the pellet was resuspended in 100
microL of 2 SDS (gt 95 Merck) (solution (wv) in 625 mM TrisbullHCl The particles were
separated from the supernatant by centrifugation at 20000 g for 1 h Afterwards the
protein solution was obtained
5252 REMOVAL OF SDS
SDS was removed from the protein solution via the use of Piercereg Detergent Removal Spin
Column (05 mL ThermoScientific) The centrifugal column was placed in an 2 mL
Eppendorf tube and the storage buffer removed via centrifugation at 1500 g for 1 min
Afterwards the column was washed three times with 04 mL DPBS and centrifugation at
1500 g for 1 min 100 microL of sample were added and incubated at RT for 2 min After
centrifugation at 1500 g for 2 min the detergent free protein solution was obtained
Protein concentrations were determined using Pierce 660 nm protein assay according to
162 manufactureracutes instructions and absorption at 660 nm measured with a Tecan infinite
M1000
5253 PARTICLE RECYCLING
For particle recycling the already used particle pellet was resuspended in 1 mL DPBS and
incubated overnight Afterwards the supernatant was removed via centrifugation at
20000 g for 30 min The pellet was washed additional three times with PBS and
afterwards used again for incubation in human plasma
5254 TRANSFER OF THE PROTEIN CORONA ON PS-NH2
005 m2 of particle surface area were incubated in a solution of 200 microg proteins in PBS
After one hour at 37 degC the supernatant was removed via centrifugation at 20000 g for
30 min The pellet was resuspended in the original amount of MilliQ water For zeta
potential determination and SDS-PAGE the particle pellet was washed with PBS and
subsequent centrifugation at 20000 g for 30 min thrice
5255 CELL UPTAKE (PERFOMED BY JOHANNA SIMON)
Flow cytometry was performed as described in chapter 522 This time pre-coated
nanoparticles were added to cells and incubated for 2 h with a nanoparticle concentration
of 20 microgmL
526 EVALUATION OF DIFFERENT IN VIVO MODELS
BNF-Dextran-redF and BNF-Starch-redF were obtained by MicroMod Germany with a
solid content of 10 mgmL
Rabbit sheep and mouse plasma were purchased from GeneTex distributed by Biozol
Eching Germany In each case citrate was added as anti-coagulant
Protein corona formation as well as analysis was done as described before The proteins
were dissolved from the particles by using the above described urea buffer The only
Experimental section 163 difference was the staining of SDS-PAGEs Instead of commassie brilliant blue the
silverstaining was applied The SilverQuesttrade Silver Staining Kit from ThermoFisher
Scientific was used as recommended by manufacturer
527 EVALUATION OF MULTIFUNCTIONAL LIPOSOMES IN HUMAN BLOOD SERUM BY DYNAMIC LIGHT SCATTERING
The detailed information about materials and methods has already been published and
can be seen in ldquoEvaluation of Multifunctional Liposomes in Human Blood Serum by Light
Scatteringrdquo Mohr et al Langmuir 2014 30 14954-14962)21
528 MULTICOMPONENT LIPOSOMES FOR SIRNA DELIVERY TO THE LIVER
5281 REAGENTS
All solvents and reagents were purchased from Acros and Sigma Aldrich and used as
received unless mentioned otherwise Deuterated methanol-d4 was purchased from
Deutero GmbH Dulbeccoacutes phosphate buffered saline (DPBS) without calcium and
magnesium was purchased from Gibcolifetechnologies Human blood serum and blood
plasma prepared according to standard guidelines was obtained from the blood
transfusion service at the University Clinic of MainzGermany Human plasma was pooled
from 6 patients whereas serum originated from one patient Extruder stabilizer and
polycarbonate membranes were purchased from Avestin Europe GmbH The Quant-itTM
RiboGreenreg assay was obtained from Invitrogen CW800 NHS ester was procured from LI-
COR Biotechnology
5282 SYNTHESIS OF SURFACTANT TF AND DYE LABELING
Surfactant TF was synthesized according to Figure 93 by Dr Chai Wenquiang Detailed
information is provided in the dissertation of Dr Wenquiang153
164
Figure 93 Synthesis of surfactant TF according to [153]
For dye labeling 1 eq CW800 NHS ester (LI-COR Biotechnology) was reacted with 105 eq
surfactant TF in DMSO for 70 h under stirring
5283 SYNTHESIS OF A HYPERBRANCHED POLYGLYCEROL (HBPG) SURFACTANT
The synthesis was conducted by Dr Sophie Muumlller as reported elsewhere21
Experimental section 165
5284 LIPOSOME FORMULATION
The cationic lipid TF as well as cholesterol and DSPC were dissolved in ethanol at room
temperature with different weight ratios The ethanolic solution of lipids was dropped
into an aqueous solution of Dulbeccos phosphate-buffered saline (DPBS) under vigorous
stirring for several minutes The resulting liposomal mixture was extruded through a
polycarbonate membrane with a nominal pore-size of 50 nm In order to achieve
reproducible liposome preparation a semi-automatic controllable extruder was designed
for syringe volumes of 05 and 1 mL The homebuilt mechanical set-up utilizes the
LiposoFast Basic filter housing from AVESTIN Europe GmbH The syringes are electronically
driven by a stepping motor that enables a continuously tunable speed of the syringe
plunger between 7 mms and 04 mms Mostly unilamellar liposomes were obtained at
constant extrusion speed (49 mms corresponding to 52 mLmin) and 30 extrusion
cycles For light scattering measurements the extruded liposomes were filtered through a
Millex LCR 450nm filter into a dust-free Suprasil light scattering cuvette (Hellma
Muumllheim)
5285 LOADING OF LIPOSOMES WITH SIRNA
A desired amount of siRNA was dissolved in aqueous DPBS After adding the ethanolic
solution of lipids under vigorous stirring siRNA loaded liposomes (mass ratio TFsiRNA =
51 751 101 corresponding to NP = 17 25 34) were produced by repeated extrusion
as described before The amount of encapsulated siRNA was determined as described6
using the Quant-itTM RiboGreenreg assay from Invitrogen Purification of non-encapsulated
siRNA was performed using Amicon Ultra-2 mL Centrifugal filter devices (30K) or by
dialysis (MW 20K)
5286 DYNAMIC AND STATIC LIGHT SCATTERING
All dynamic light scattering experiments were performed with an instrument consisting of
HeNe laser (6328 nm 25 mW output power) an ALV-CGS 8F SLSDLS 5022F goniometer
equipped with eight simultaneously working ALV 7004 correlators and eight QEAPD
Avalanche photodiode detectors Static light scattering (SLS) experiments were carried out
on an ALVCGS3 instrument consisting of a HeNe laser a goniometer and an ALV-5004
166 multiple-tau full-digital correlator Measurements were performed at scattering angles
between Θ = 30 ndash 150deg with steps of 10deg
For DLS and SLS the liposomal solutions were diluted 120 vv by aqueous PBS to a total
lipid concentration of 003 gL and subsequently filtered through LCR 450 nm filters
(Millipore) Human serum as well as plasma was filtered through Millex GS filters 220 nm
nominal pore size (Millipore) into cylindrical Suprasil quartz cuvettes (20 mm diameter
Hellma Muumlllheim) in a dust-free flow hood By adding the liposomal solution in PBS the
human serum was diluted 11 resulting in a total protein concentration approximately 3
After incubation for 30 min at room temperature DLS measurements were performed at
20 degC
For the liposomes and lipoplexes in buffer the correlation functions showed a monomodal
decay and were fitted by a sum of two exponentials from which the first cumulant Г was
calculated The z-average diffusion coefficient Dz was obtained by extrapolation of Гq2 for
to q = 0 leading to the inverse z-average hydrodynamic radius Rh equiv lt1Rhgtz-1 by formal
application of Stokes law
For the measurements in serumplasma the correlation functions were analyzed
according to the method introduced by Rausch et al114 which is described in detail in the
introduction
5287 ZETA POTENTIAL
For determination of the zeta potential of the different liposomal systems a Malvern nano
zeta sizer was utilized 20 microL of liposomal solution was diluted in 2 mL 1mM KCl and filled
into disposable folded capillary cells (DTS 1060)
5288 CELL CULTURE (LEONARD KAPS)
Murine MHS alveolar macrophages (ATCC Teddington UK) were cultured in Dulbeccos
modified Eagles medium supplemented with 10 FBS 1 penicillin 1 L-glutamine and
1 streptomycin in 5 CO2 at 37 degC The medium was routinely changed every 2 days and
the cells were separated by cell scraping before reaching confluency
Experimental section 167
5289 IN VITRO CYTOTOXICITY (PERFORMED BY LEONARD KAPS)
The MTT (3-(45-dimethylthiazol-2-yl)-25-diphenyltetrazoliumbromide) assay was used to
assess potential cytotoxicity of the L-114 loaded with control scrambled siRNA (scsiRNA
see below) on MHS macrophages In brief the cells were seeded into 96-well plates at a
density of ~10000 cells per well After a 24 h incubation period supplement (as described
in detail above) containing medium with serial concentrations of L-114 (loaded with
control scsiRNA) corresponding to 5 10 20 50 100 200 400 and 600 nM scsiRNA
formulation was added to replace the cell culture medium After a 48 h incubation time
20 μL of MTT dissolved in PBS (4 mgmL) was added and incubated for another 4 h to
quantify the living cells followed by removal of the medium and addition of 150 μL DMSO
Finally the 96-well plates were read on an Infinite M200Pro spectrofluorometer (TECAN
Maumlnnerdorf Switzerland) at 570 nm
52810 IN VITRO KNOCKDOWN (PERFORMED BY LEONARD KAPS)
Anti-CD68 siRNA with the sequence
5rsquo-G6A 6U8 C6A 8C6 U6G 5U7 U-3rsquo
5rsquo-6G6 A7U 6U8 C5U 8C6 U5U 70-3rsquo
containing the following chemical modifications (methylations) at the 2rsquo position of the
ribose ring
0 3rsquoAmino-C6 5 2rsquoOMe-rU 6 2rsquoOMe-rA 7 2rsquoOMe-rC 8 2rsquoOMe-rG
was purchased from BioSpring (Germany Frankfurt)
As scramble siRNA siGENOME Non-Targeting siRNA 2 with the following sequence
5rsquo-UAAGGCUAUGAAGAGAUACUU-3rsquo
5rsquo-GUAUCUCUUCAUAGCCUUAUU-3rsquo
168 was purchased from Dharmacon (Dharmacon GE Healthcare Germany Freiburg)
Chemical modifications of the scsiRNA as intellectual property of Dharmacon were not
disclosed in the datasheet
As positive in vitro transfection control anti-CD68 siRNA was mixed with INTERFERin from
Polyplus transfection (Illkirch-Graffenstaden France) according to the manufactures
protocol
Before transfection MHS cells were seeded in 12-well culture plates at a density of
~100000 cells per well and allowed to adhere overnight After the plates were washed
three times with PBS the cells were incubated with a final liposomal siRNA concentration
of 25 nM 50 nM 100 nM in 1 mL supplement containing medium for 48 h
52811 QUANTITATIVE RT-PCR (PERFORMED BY LEONARD KAPS)
After transfection cellular RNAs was extracted with GeneMATRIX Universal RNA
Purification Kit from EURX (Berlin Germany) according to the manufactures protocol 1 μg
of total RNA was reverse transcribed into cDNA using the iScript cDNA Synthesis Kit (Bio-
Rad Hercules USA) according to the manufacturerrsquos protocol
The following Primers and probes were obtained from Eurofins (Mannheim Germany)
Glycerinaldehyd-3-phosphat-Dehydrogenase (GAPDH)
forward 5rsquo-AAGGTGAAGGTCGGAGTCAAC-3rsquo
reverse 5rsquo-GGGGTCATTGATGGCAACAATA-3rsquo
Pan macrophages marker CD68
forward 5rsquo-ACCGCCATGTAGTCCAGGTA-3rsquo
reverse 5rsquo-ATCCCCACCTGTCTCTCTCA-3rsquo
were purchased from Applied Biosystems (Carlsbad CA USA)
Experimental section 169 Syber Green reaction mixtures were purchased by Applied Biosystems (Germany
Darmstadt) GAPDH transcript levels were used to normalize data and to control for RNA
integrity The Syber Green reactions were performed using a Step One Plus sequence
amplification system Results are expressed as the ratio of the copy number of the target
gene divided by the number of copies of the housekeeping gene (GAPDH) within a single
PCR run
52812 IN VIVO KNOCKDOWN (PERFORMED BY LEONARD KAPS)
All animal studies were approved by the committee on animal care (Government of
Rhineland Palatinate Germany) 8 week old Balbc mice were kept under 12 h light-dark
cycles treated with human care and sacrificed by cervical dislocation Mice (n=3 per
group) were anaesthetized with isoflurane and injected retroorbitally with 1 mgkg or 2
mgkg anti-CD68 siRNA the scrambled control RNA loaded in L-114 or L-114-hbPG or
received buffer alone (250 microl PBS) All mice were injected twice 48 h apart Liver RNA was
extracted reverse transcribed and analyzed by quantitative RT-PCR as described above
52813 IN VIVO IMAGING (PERFORMED BY LEONARD KAPS)
In vivo near infrared fluorescence imaging of CW-800-labeled liposomes loaded with
siRNA was performed with the IVIS Spectrum Imaging system (Caliper LifeSciences)
Fluorescence source and filters were set for IR-excitation at 745 nm and emission at 800
48 h after the second injection the mice were sacrificed liver spleen lungs heart and
kidneys removed and transferred immediately into the image chamber for ex vivo
imaging Acquisition of images was performed with an integration time of 4 s
52814 ISOLATION OF LIVER NON-PARENCHYMAL CELLS (PERFORMED BY LEONARD
KAPS)
The nonparenchymal liver cell population was isolated and purified from the liver of
female Balbc mice according as described by us19 Briefly mice were anesthetized with
KetamineXylazine the livers were rinsed with PBS and after removal of the gall bladder
carefully homogenized and digested with 5000 U Collagenase IV from Sigma-Aldrich
(Munich Germany) in Krebs-Ringer-Buffer pH 74 for 30 min at 37 degC followed by
170 another homogenization and digestion step The cell suspension was filtered over a 100
microm cell strainer to remove non-digested particles and centrifuged at 17ndash21timesg for 4 min at
4 degC to remove hepatocytes The supernatant suspension was transferred into new tubes
and centrifuged again at 300timesg for 10 min and the cell pellet resuspended in 10 mL 1times Red
Blood Cell Lysis Solution from Milteny (Bergisch-Gladbach Germany) for 5 min at RT
followed by thorough washing with PBS
52815 FACS ANALYSIS (PERFORMED BY LEONARD KAPS)
In vivo macrophage uptake of CW-800-labeled siRNA loaded liposomes was measured by
FACS analysis using antibodies to CD45 (clone 30-F11) F480 (clone BM8) from
eBiolegend (San Diego USA) and Fixable Viability Dye eFluor 506 (eBioscience San Diego
USA) to exclude dead cells Cells were fixed with 4 paraformaldehyde (Histofix Roth
Germany) for 15 min at 37 degC and analyzed on a BD FACSCanto II flow cytometer BD
Bioscience (MississaugaCanada) Compensation was performed automatically with
FACSDiva software using corresponding single stained controls 50000 cells were
measured per staining Further analysis of flow cytometry data was performed with open
source Flowing Software 250 (Pertu Terho Turku Centre for Biotechnology Finland)
52816 STATISTICAL ANALYSIS (PERFORMED BY LEONARD KAPS)
Statistical comparisons were performed with student t-test analysis using the GraphPad
Prism (La Jolla USA) program
52817 1H NMR
1H NMR spectrum of the surfactant F was recorded on a Bruker AVANCE 300
spectrometer As deuterated solvent CD3OD was used For analysis MestReNova 8 from
Mestrelab Research SL was used The spectra were calibrated against the solvent signal
52818 HPLC (BEATE MUumlLLER)
The high pressure liquid chromatograms of dye cationic lipid TF and TF-dye conjugate
were measured by using an Agilent Series 1200 HPLC system with a MN-HD8-column
(12545microml) an evaporative light scattering detector 385-LC (Varian) and a diode array
Experimental section 171 detector (Agilent) The measurement was run at 20degC and a flow-rate of 1 mLmin As
liquid phase a THF water mixture was used (5 THF 95 water + 01 TFA) The THF
amount was increased within 10 minutes to 100
52819 CRYO-TEM (PERFORMED BY MAX BERNHARD)
For cryo-TEM imaging a JEOL 1400 transmission electron microscope equipped with a
cryogenic holder (Gatan USA) was used
172
References 173
6 REFERENCES
1 Zolnik B S Sadrieh N Regulatory perspective on the importance of ADME assessment of nanoscale material containing drugs Adv Drug Deliv Rev 2009 61 422-427
2 Duncan R Polymer conjugates as anticancer nanomedicines Nat Rev Cancer 2006 6 688-701
3 Pieper R Gatlin C L Makusky A J Russo P S Schatz C R Miller S S Su Q McGrath A M Estock M A Parmar P P The human serum proteome Display of nearly 3700 chromatographically separated protein spots on two‐dimensional electrophoresis gels and identification of 325 distinct proteins Proteomics 2003 3 1345-1364
4 Anderson N L The clinical plasma proteome a survey of clinical assays for proteins in plasma and serum Clin Chem 2010 56 177-185
5 Kim M-R Kim C-W Human blood plasma preparation for two-dimensional gel electrophoresis J Chromatogr B 2007 849 203-210
6 Andrade J D Hlady V Plasma Protein Adsorption The Big Twelvea Ann NY Acad Sci 1987 516 158-172
7 Varlan A Hillebrand M Bovine and human serum albumin interactions with 3-carboxyphenoxathiin studied by fluorescence and circular dichroism spectroscopy Molecules 2010 15 3905-3919
8 httpwwwmanagement-krankenhausdeproduktelabor-diagnostikigy-so-tief-wie-nie-zuvor-ins-plasma-proteom-schauen
9 Vermeer A W Norde W The thermal stability of immunoglobulin unfolding and aggregation of a multi-domain protein Biophys J 2000 78 394-404
10 Gauldie J Richards C Harnish D Lansdorp P Baumann H Interferon beta 2B-cell stimulatory factor type 2 shares identity with monocyte-derived hepatocyte-stimulating factor and regulates the major acute phase protein response in liver cells Proceedings of the National Academy of Sciences 1987 84 7251-7255
11 Marguerie G A Plow E F Edgington T S Human platelets possess an inducible and saturable receptor specific for fibrinogen J Biol Chem 1979 254 5357-5363
12 Furie B Furie B C The molecular basis of blood coagulation Cell 53 505-518
13 Bathen T F Engan T Krane J Axelson D Analysis and classification of proton NMR spectra of lipoprotein fractions from healthy volunteers and patients with cancer or CHD Anticancer Res 1999 20 2393-2408
14 Maeda H Wu J Sawa T Matsumura Y Hori K Tumor vascular permeability and the EPR effect in macromolecular therapeutics a review J Controlled Release 2000 65 271-284
15 Muggia F M Doxorubicin-polymer conjugates further demonstration of the concept of enhanced permeability and retention Clin Cancer Res 1999 5 7-8
16 Fang J Nakamura H Maeda H The EPR effect Unique features of tumor blood vessels for drug delivery factors involved and limitations and augmentation of the effect Adv Drug Deliv Rev 2011 63 136-151
174 17 Byrne J D Betancourt T Brannon-Peppas L Active targeting schemes for nanoparticle systems in cancer therapeutics Adv Drug Deliv Rev 2008 60 1615-1626
18 Maeda H Nakamura H Fang J The EPR effect for macromolecular drug delivery to solid tumors Improvement of tumor uptake lowering of systemic toxicity and distinct tumor imaging in vivo Adv Drug Deliv Rev 2013 65 71-79
19 Betancourt T Brown B Brannon-Peppas L Doxorubicin-loaded PLGA nanoparticles by nanoprecipitation preparation characterization and in vitro evaluation 2007
20 Schroeder A Levins C G Cortez C Langer R Anderson D G Lipid‐based nanotherapeutics for siRNA delivery Journal of internal medicine 2010 267 9-21
21 Mohr K Muumlller S S Muumlller L K Rusitzka K Gietzen S Frey H Schmidt M Evaluation of Multifunctional Liposomes in Human Blood Serum by Light Scattering Langmuir 2014 30 14954-14962
22 Gavrilov K Saltzman W M Therapeutic siRNA principles challenges and strategies The Yale journal of biology and medicine 2012 85 187
23 Jin S Leach J C Ye K Nanoparticle-mediated gene delivery Micro and Nano Technologies in Bioanalysis Methods and Protocols 2009 547-557
24 Patil M L Zhang M Betigeri S Taratula O He H Minko T Surface-modified and internally cationic polyamidoamine dendrimers for efficient siRNA delivery Bioconjugate Chem 2008 19 1396-1403
25 Sutton D Nasongkla N Blanco E Gao J Functionalized micellar systems for cancer targeted drug delivery Pharm Res 2007 24 1029-1046
26 Francis M F Cristea M Winnik F M Polymeric micelles for oral drug delivery why and how Pure Appl Chem 2004 76 1321-1335
27 Moore A Medarova Z Potthast A Dai G In Vivo Targeting of Underglycosylated MUC-1 Tumor Antigen Using a Multimodal Imaging Probe Cancer Res 2004 64 1821-1827
28 Flenniken M L Liepold L O Crowley B E Willits D A Young M J Douglas T Selective attachment and release of a chemotherapeutic agent from the interior of a protein cage architecture Chem Commun 2005 447-449
29 Muumlller L K Landfester K Natural liposomes and synthetic polymeric structures for biomedical applications Biochem Biophys Res Commun 2015
30 Fire A Xu S Montgomery M K Kostas S A Driver S E Mello C C Potent and specific genetic interference by double-stranded RNA in Caenorhabditis elegans Nature 1998 391 806-811
31 Elbashir S M Harborth J Lendeckel W Yalcin A Weber K Tuschl T Duplexes of 21-nucleotide RNAs mediate RNA interference in cultured mammalian cells Nature 2001 411 494-498
32 Elbashir S M Lendeckel W Tuschl T RNA interference is mediated by 21-and 22-nucleotide RNAs Genes Dev 2001 15 188-200
33 Gao Y Liu X-L Li X-R Research progress on siRNA delivery with nonviral carriers Int J Nanomedicine 2011 6 1017-1025
34 Choung S Kim Y J Kim S Park H-O Choi Y-C Chemical modification of siRNAs to improve serum stability without loss of efficacy Biochem Biophys Res Commun 2006 342 919-927
References 175 35 Ghosn B Singh A Li M Vlassov A V Burnett C Puri N Roy K Efficient gene silencing in lungs and liver using imidazole-modified chitosan as a nanocarrier for small interfering RNA Oligonucleotides 2010 20 163-172
36 Howard K A Rahbek U L Liu X Damgaard C K Glud S Z Andersen M Oslash Hovgaard M B Schmitz A Nyengaard J R Besenbacher F RNA interference in vitro and in vivo using a chitosansiRNA nanoparticle system Mol Ther 2006 14 476-484
37 Buyens K De Smedt S C Braeckmans K Demeester J Peeters L van Grunsven L A du Jeu X d M Sawant R Torchilin V Farkasova K Liposome based systems for systemic siRNA delivery stability in blood sets the requirements for optimal carrier design J Controlled Release 2012 158 362-370
38 Gurr M I Harwood J L Frayn K N Index Lipid Biochemistry Blackwell Science Ltd 2008 pp 315-320
39 Heinrich P C Muumlller M Graeve L LoumlfflerPetrides Biochemie und Pathobiochemie Springer-Verlag 2014
40 Israelachvili J N Mitchell D J Ninham B W Theory of self-assembly of hydrocarbon amphiphiles into micelles and bilayers Journal of the Chemical Society Faraday Transactions 2 Molecular and Chemical Physics 1976 72 1525-1568
41 Lasic D D Liposomes from physics to applications Elsevier Science Ltd 1993
42 Lasic D D Needham D The stealth liposome a prototypical biomaterial Chem Rev 1995 95 2601-2628
43 Crommelin D J A Metselaar J M Storm G Liposomes The Science and the Regulatory Landscape Non-Biological Complex Drugs Crommelin D J A de Vlieger J S B Eds Springer International Publishing 2015 Vol 20 pp 77-106
44 Singer S J Nicolson G L The fluid mosaic model of the structure of cell membranes Science 1972 175 720-731
45 Zhang Y Cristofaro P Silbermann R Pusch O Boden D Konkin T Hovanesian V Monfils P R Resnick M Moss S F Engineering mucosal RNA interference in vivo Mol Ther 2006 14 336-342
46 Wu S McMillan N J Lipidic Systems for In Vivo siRNA Delivery The AAPS Journal 2009 11 639-652
47 Moore C C Martin E N Lee G Taylor C Dondero R Reznikov L L Dinarello C Thompson J Scheld W M Eukaryotic Translation Initiation Factor 5A Small Interference RNA-Liposome Complexes Reduce Inflammation and Increase Survival in Murine Models of Severe Sepsis and Acute Lung Injury J Infect Dis 2008 198 1407-1414
48 Ren T Song Y Zhang G Liu D Structural basis of DOTMA for its high intravenous transfection activity in mouse Gene Ther 2000 7 764-768
49 Dokka S Toledo D Shi X Castranova V Rojanasakul Y Oxygen radical-mediated pulmonary toxicity induced by some cationic liposomes Pharm Res 2000 17 521-525
50 Harris T J Green J J Fung P W Langer R Anderson D G Bhatia S N Tissue-specific gene delivery via nanoparticle coating Biomaterials 2010 31 998-1006
176 51 Allen T Chonn A Large unilamellar liposomes with low uptake into the reticuloendothelial system FEBS Lett 1987 223 42-46
52 Love K T Mahon K P Levins C G Whitehead K A Querbes W Dorkin J R Qin J Cantley W Qin L L Racie T Frank-Kamenetsky M Yip K N Alvarez R Sah D W Y de Fougerolles A Fitzgerald K Koteliansky V Akinc A Langer R Anderson D G Lipid-like materials for low-dose in vivo gene silencing Proceedings of the National Academy of Sciences 2010 107 1864-1869
53 Zhang Y Anchordoquy T J The role of lipid charge density in the serum stability of cationic lipidDNA complexes Biochimica et Biophysica Acta (BBA)-Biomembranes 2004 1663 143-157
54 Xu L Anchordoquy T J Cholesterol domains in cationic lipidDNA complexes improve transfection Biochimica et Biophysica Acta (BBA)-Biomembranes 2008 1778 2177-2181
55 Allen T Hansen C Martin F Redemann C Yau-Young A Liposomes containing synthetic lipid derivatives of poly (ethylene glycol) show prolonged circulation half-lives in vivo Biochimica et Biophysica Acta (BBA)-Biomembranes 1991 1066 29-36
56 Allen C Dos Santos N Gallagher R Chiu G Shu Y Li W Johnstone S a Janoff A Mayer L Webb M Controlling the physical behavior and biological performance of liposome formulations through use of surface grafted poly (ethylene glycol) Biosci Rep 2002 22 225-250
57 Woodle M Matthay K Newman M Hidayat J Collins L Redemann C Martin F Papahadjopoulos D Versatility in lipid compositions showing prolonged circulation with sterically stabilized liposomes Biochimica et Biophysica Acta (BBA)-Biomembranes 1992 1105 193-200
58 Torchilin V P Omelyanenko V G Papisov M I Bogdanov A A Trubetskoy V S Herron J N Gentry C A Poly (ethylene glycol) on the liposome surface on the mechanism of polymer-coated liposome longevity Biochimica et Biophysica Acta (BBA)-Biomembranes 1994 1195 11-20
59 Blume G Cevc G Liposomes for the sustained drug release in vivo Biochimica et Biophysica Acta (BBA)-Biomembranes 1990 1029 91-97
60 Immordino M L Dosio F Cattel L Stealth liposomes review of the basic science rationale and clinical applications existing and potential International journal of nanomedicine 2006 1 297
61 Cabanes A Tzemach D Goren D Horowitz A T Gabizon A Comparative study of the antitumor activity of free doxorubicin and polyethylene glycol-coated liposomal doxorubicin in a mouse lymphoma model Clin Cancer Res 1998 4 499-505
62 Torchilin V P Recent advances with liposomes as pharmaceutical carriers Nat Rev Drug Discov 2005 4 145-160
63 Sharma A Sharma U S Liposomes in drug delivery progress and limitations Int J Pharm 1997 154 123-140
64 Muumlller S S Wurm F R Nanovesicles as Drug Delivery Vehicles Liposomes and Polymersomes Encyclopedia of Polymeric Nanomaterials 2015 1372-1377
65 Kremer L C M van Dalen E C Offringa M Ottenkamp J Voucircte P A Anthracycline-Induced Clinical Heart Failure in a Cohort of 607 Children Long-Term Follow-Up Study Journal of Clinical Oncology 2001 19 191-196
References 177 66 Gabizon A Catane R Uziely B Kaufman B Safra T Cohen R Martin F Huang A Barenholz Y Prolonged Circulation Time and Enhanced Accumulation in Malignant Exudates of Doxorubicin Encapsulated in Polyethylene-glycol Coated Liposomes Cancer Res 1994 54 987-992
67 Papahadjopoulos D Allen T Gabizon A Mayhew E Matthay K Huang S Lee K Woodle M Lasic D Redemann C Sterically stabilized liposomes improvements in pharmacokinetics and antitumor therapeutic efficacy Proceedings of the National Academy of Sciences 1991 88 11460-11464
68 Buyens K Demeester J De Smedt S S Sanders N N Elucidating the encapsulation of short interfering RNA in PEGylated cationic liposomes Langmuir 2009 25 4886-4891
69 Kasahara M Hinkle P C Reconstitution and purification of the D-glucose transporter from human erythrocytes J Biol Chem 1977 252 7384-7390
70 Pick U Liposomes with a large trapping capacity prepared by freezing and thawing of sonicated phospholipid mixtures Arch Biochem Biophys 1981 212 186-194
71 Maguire L A Zhang H Shamlou P A Preparation of small unilamellar vesicles (SUV) and biophysical characterization of their complexes with poly‐l‐lysine‐condensed plasmid DNA Biotechnol Appl Biochem 2003 37 73-81
72 Olson F Hunt C A Szoka F C Vail W J Papahadjopoulos D Preparation of liposomes of defined size distribution by extrusion through polycarbonate membranes Biochim Biophys Acta 1979 557 9-23
73 Miller A D Cationic liposomes for gene therapy Angew Chem Int Ed 1998 37 1768-1785
74 Akinc A Zumbuehl A Goldberg M Leshchiner E S Busini V Hossain N Bacallado S A Nguyen D N Fuller J Alvarez R A combinatorial library of lipid-like materials for delivery of RNAi therapeutics Nat Biotechnol 2008 26 561-569
75 Dong Y Eltoukhy A A Alabi C A Khan O F Veiseh O Dorkin J R Sirirungruang S Yin H Tang B C Pelet J M Chen D Gu Z Xue Y Langer R Anderson D G Lipid-Like Nanomaterials for Simultaneous Gene Expression and Silencing In Vivo Advanced Healthcare Materials 2014 3 1392-1397
76 Zhang Y Arrington L Boardman D Davis J Xu Y DiFelice K Stirdivant S Wang W Budzik B Bawiec J The development of an in vitro assay to screen lipid based nanoparticles for siRNA delivery J Controlled Release 2014 174 7-14
77 Ewe A Schaper A Barnert S Schubert R Temme A Bakowsky U Aigner A Storage stability of optimal liposomendashpolyethylenimine complexes (lipopolyplexes) for DNA or siRNA delivery Acta Biomater 2014 10 2663-2673
78 Lerch S Dass M Musyanovych A Landfester K Mailander V Polymeric nanoparticles of different sizes overcome the cell membrane barrier Eur J Pharm Biopharm 2013 84 265-74
79 Florez L Herrmann C Cramer J M Hauser C P Koynov K Landfester K Crespy D Mailander V How Shape Influences Uptake Interactions of Anisotropic Polymer Nanoparticles and Human Mesenchymal Stem Cells Small 2012 8 2222-2230
80 Schrade A Mailander V Ritz S Landfester K Ziener U Surface roughness and charge influence the uptake of nanoparticles fluorescently labeled pickering-type versus surfactant-stabilized nanoparticles Macromol Biosci 2012 12 1459-71
178 81 Monopoli M P Aberg C Salvati A Dawson K A Biomolecular coronas provide the biological identity of nanosized materials Nat Nanotechnol 2012 7 779-86
82 Liu Z H Jiao Y P Wang T Zhang Y M Xue W Interactions between solubilized polymer molecules and blood components J Controlled Release 2012 160 14-24
83 Salvati A Pitek A S Monopoli M P Prapainop K Bombelli F B Hristov D R Kelly P M Aberg C Mahon E Dawson K A Transferrin-functionalized nanoparticles lose their targeting capabilities when a biomolecule corona adsorbs on the surface Nature Nanotechnology 2013 8 137-143
84 Musyanovych A Dausend J Dass M Walther P Mailander V Landfester K Criteria impacting the cellular uptake of nanoparticles a study emphasizing polymer type and surfactant effects Acta Biomater 2011 7 4160-8
85 Baier G Baumann D Siebert J M Musyanovych A Mailander V Landfester K Suppressing Unspecific Cell Uptake for Targeted Delivery Using Hydroxyethyl Starch Nanocapsules Biomacromolecules 2012 13 2704-2715
86 Walkey C D Chan W C Understanding and controlling the interaction of nanomaterials with proteins in a physiological environment Chem Soc Rev 2012 41 2780-2799
87 Monopoli M P Walczyk D Campbell A Elia G Lynch I Baldelli Bombelli F Dawson K A PhysicalminusChemical Aspects of Protein Corona Relevance to in Vitro and in Vivo Biological Impacts of Nanoparticles JACS 2011 133 2525-2534
88 Walczyk D Bombelli F B Monopoli M P Lynch I Dawson K A What the Cell ldquoSeesrdquo in Bionanoscience JACS 2010 132 5761-5768
89 Vroman L Effect of adsorbed proteins on the wettability of hydrophilic and hydrophobic solids 1962
90 Vroman L Adams A Fischer G Munoz P Interaction of high molecular weight kininogen factor XII and fibrinogen in plasma at interfaces Blood 1980 55 156-159
91 Lynch I Dawson K A Linse S Detecting Cryptic Epitopes Created by Nanoparticles Science Signaling 2006 2006 pe14-pe14
92 Cedervall T Lynch I Lindman S Berggaringrd T Thulin E Nilsson H Dawson K A Linse S Understanding the nanoparticlendashprotein corona using methods to quantify exchange rates and affinities of proteins for nanoparticles Proceedings of the National Academy of Sciences 2007 104 2050-2055
93 Patel H Serum opsonins and liposomes Their interaction and opsonophagocytosis Crit Rev Ther Drug Carrier Syst 1991 9 39-90
94 Chonn A Semple S Cullis P Association of blood proteins with large unilamellar liposomes in vivo Relation to circulation lifetimes J Biol Chem 1992 267 18759-18765
95 Lunov O Syrovets T Loos C Beil J Delacher M Tron K Nienhaus G U Musyanovych A Mailander V Landfester K Simmet T Differential uptake of functionalized polystyrene nanoparticles by human macrophages and a monocytic cell line ACS Nano 2011 5 1657-69
96 Aringkesson A Caacuterdenas M Elia G Monopoli M P Dawson K A The protein corona of dendrimers PAMAM binds and activates complement proteins in human plasma in a generation dependent manner Rsc Advances 2012 2 11245-11248
References 179 97 Roser M Fischer D Kissel T Surface-modified biodegradable albumin nano- and microspheres II effect of surface charges on in vitro phagocytosis and biodistribution in rats European Journal of Pharmaceutics and Biopharmaceutics 1998 46 255-263
98 Carrstensen H Muumlller R H Muumlller B W Particle size surface hydrophobicity and interaction with serum of parenteral fat emulsions and model drug carriers as parameters related to RES uptake Clin Nutr 1992 11 289-297
99 Muumlller R H Wallis K H Troester S D Kreuter J In vitro characterization of poly (methyl-methaerylate) nanoparticles and correlation to their in vivo fate J Controlled Release 1992 20 237-246
100 Teichroeb J Forrest J Ngai V Jones L Anomalous thermal denaturing of proteins adsorbed to nanoparticles The European Physical Journal E 2006 21 19-24
101 Karajanagi S S Vertegel A A Kane R S Dordick J S Structure and function of enzymes adsorbed onto single-walled carbon nanotubes Langmuir 2004 20 11594-11599
102 Norde W Giacomelli C E BSA structural changes during homomolecular exchange between the adsorbed and the dissolved states J Biotechnol 2000 79 259-268
103 Wan S Kelly P M Mahon E Stoumlckmann H Rudd P M Caruso F Dawson K A Yan Y Monopoli M P The ldquoSweetrdquo Side of the Protein Corona Effects of Glycosylation on NanoparticlendashCell Interactions ACS Nano 2015 9 2157-2166
104 Gref R Luumlck M Quellec P Marchand M Dellacherie E Harnisch S Blunk T Muumlller R H lsquoStealthrsquo corona-core nanoparticles surface modified by polyethylene glycol (PEG) influences of the corona (PEG chain length and surface density) and of the core composition on phagocytic uptake and plasma protein adsorption Colloids Surf B Biointerfaces 2000 18 301-313
105 Peracchia M Harnisch S Pinto-Alphandary H Gulik A Dedieu J Desmaele D drsquoAngelo J Muumlller R Couvreur P Visualization of in vitro protein-rejecting properties of PEGylated stealthreg polycyanoacrylate nanoparticles Biomaterials 1999 20 1269-1275
106 Kim H R Andrieux K Delomenie C Chacun H Appel M Desmaeumlle D Taran F Georgin D Couvreur P Taverna M Analysis of plasma protein adsorption onto PEGylated nanoparticles by complementary methods 2‐DE CE and Protein Lab‐on‐chipreg system Electrophoresis 2007 28 2252-2261
107 Schoumlttler S Becker G Winzen S Steinbach T Mohr K Landfester K Mailaumlnder V Wurm F R Protein adsorption is required for stealth effect of poly(ethylene glycol)- and poly(phosphoester)-coated nanocarriers Nat Nano 2016 advance online publication
108 Winzen S Schoettler S Baier G Rosenauer C Mailaender V Landfester K Mohr K Complementary analysis of the hard and soft protein corona sample preparation critically effects corona composition Nanoscale 2015 7 2992-3001
109 Bouchemal K New challenges for pharmaceutical formulations and drug delivery systems characterization using isothermal titration calorimetry Drug Discovery Today 2008 13 960-972
110 Lindman S Lynch I Thulin E Nilsson H Dawson K A Linse S Systematic investigation of the thermodynamics of HSA adsorption to N-iso-propylacrylamideN-tert-butylacrylamide copolymer nanoparticles Effects of particle size and hydrophobicity Nano Lett 2007 7 914-920
111 Tsai D-H DelRio F W Keene A M Tyner K M MacCuspie R I Cho T J Zachariah M R Hackley V A Adsorption and Conformation of Serum Albumin Protein on Gold Nanoparticles Investigated Using Dimensional Measurements and in Situ Spectroscopic Methods Langmuir 2011 27 2464-2477
180 112 Siegert A Radiation Laboratory report no 465 Massachusetts Institute of Technology Cambridge 1943
113 Burchard W Richtering W Dynamic light scattering from polymer solutions Relaxation in Polymers Pietralla M Pechhold W Eds Steinkopff Darmstadt 1989 pp 151-163
114 Rausch K Reuter A Fischer K Schmidt M Evaluation of nanoparticle aggregation in human blood serum Biomacromolecules 2010 11 2836-2839
115 Mohr K Sommer M Baier G Schoumlttler S Okwieka P Tenzer S Landfester K Mailaumlnder V Schmidt M Meyer R Aggregation behavior of polystyrene-nanoparticles in human blood serum and its impact on the in vivo distribution in mice J Nanomed Nanotechnol 2014 5
116 Koynov K Butt H-J Fluorescence correlation spectroscopy in colloid and interface science Current Opinion in Colloid amp Interface Science 2012 17 377-387
117 Rocker C Potzl M Zhang F Parak W J Nienhaus G U A quantitative fluorescence study of protein monolayer formation on colloidal nanoparticles Nat Nano 2009 4 577-580
118 Smith P K Krohn R I Hermanson G T Mallia A K Gartner F H Provenzano M D Fujimoto E K Goeke N M Olson B J Klenk D C Measurement of protein using bicinchoninic acid Anal Biochem 1985 150 76-85
119 Reynolds J A Tanford C The gross conformation of protein-sodium dodecyl sulfate complexes J Biol Chem 1970 245 5161-5165
120 Gygi S P Corthals G L Zhang Y Rochon Y Aebersold R Evaluation of two-dimensional gel electrophoresis-based proteome analysis technology Proceedings of the National Academy of Sciences 2000 97 9390-9395
121 Burkhart J M Schumbrutzki C Wortelkamp S Sickmann A Zahedi R P Systematic and quantitative comparison of digest efficiency and specificity reveals the impact of trypsin quality on MS-based proteomics Journal of proteomics 2012 75 1454-1462
122 Tenzer S Docter D Kuharev J Musyanovych A Fetz V Hecht R Schlenk F Fischer D Kiouptsi K Reinhardt C Landfester K Schild H Maskos M Knauer S K Stauber R H Rapid formation of plasma protein corona critically affects nanoparticle pathophysiology Nat Nanotechnol 2013 8 772-81
123 Hunter R J Zeta potential in colloid science principles and applications Academic press 2013 Vol 2
124 Ritz S Schottler S Kotman N Baier G Musyanovych A Kuharev J Landfester K Schild H Jahn O Tenzer S Mailander V Protein corona of nanoparticles distinct proteins regulate the cellular uptake Biomacromolecules 2015 16 1311-21
125 Baier G Costa C Zeller A Baumann D Sayer C Araujo P H H Mailaumlnder V Musyanovych A Landfester K BSA Adsorption on Differently Charged Polystyrene Nanoparticles using Isothermal Titration Calorimetry and the Influence on Cellular Uptake Macromol Biosci 2011 11 628-638
126 Gianazza E Arnaud P Chromatography of plasma proteins on immobilized Cibacron Blue F3-GA Mechanism of the molecular interaction Biochem J 1982 203 637-641
References 181 127 Ghiggeri G M Candiano G Delfino G Queirolo C Highly selective one-step chromatography of serum and urinary albumin on immobilized Cibacron Blue F3GA Studies on normal and glycosyl albumin Clin Chim Acta 1985 145 205-211
128 Armstrong J Wenby R Meiselman H Fisher T The hydrodynamic radii of macromolecules and their effect on red blood cell aggregation Biophys J 2004 87 4259-4270
129 Rausch K Interaktions-und Aggregationsverhalten von Nanopartikeln in Blutserum Universitaumltsbibliothek Mainz 2013
130 Rezaei-Tavirani M Moghaddamnia S H Ranjbar B Amani M Marashi S-A Conformational study of human serum albumin in pre-denaturation temperatures by differential scanning calorimetry circular dichroism and UV spectroscopy BMB Reports 2006 39 530-536
131 Ehrenberg M S Friedman A E Finkelstein J N Oberdoumlrster G McGrath J L The influence of protein adsorption on nanoparticle association with cultured endothelial cells Biomaterials 2009 30 603-610
132 Dutta D Sundaram S K Teeguarden J G Riley B J Fifield L S Jacobs J M Addleman S R Kaysen G A Moudgil B M Weber T J Adsorbed proteins influence the biological activity and molecular targeting of nanomaterials Toxicol Sci 2007 100 303-315
133 Hawkins C L Davies M J Generation and propagation of radical reactions on proteins Biochim Biophys Acta 2001 1504 196-219
134 Honn K V Singley J A Chavin W Fetal bovine serum a multivariate standard Exp Biol Med 1975 149 344-347
135 Walkey C D Olsen J B Guo H Emili A Chan W C Nanoparticle size and surface chemistry determine serum protein adsorption and macrophage uptake JACS 2012 134 2139-2147
136 Pozzi D Caracciolo G Capriotti A L Cavaliere C La Barbera G Anchordoquy T J Laganagrave A Surface chemistry and serum type both determine the nanoparticlendashprotein corona Journal of proteomics 2015 119 209-217
137 Schoumlttler S Klein K Landfester K Mailaumlnder V Protein source and choice of anticoagulant decisively affect nanoparticle protein corona and cellular uptake Nanoscale 2016
138 Hajipour M J Laurent S Aghaie A Rezaee F Mahmoudi M Personalized protein coronas a ldquokeyrdquo factor at the nanobiointerface Biomaterials Science 2014 2 1210-1221
139 Caracciolo G Caputo D Pozzi D Colapicchioni V Coppola R Size and charge of nanoparticles following incubation with human plasma of healthy and pancreatic cancer patients Colloids Surf B Biointerfaces 2014 123 673-678
140 Barone G Giancola C Verdoliva A DSC studies on the denaturation and aggregation of serum albumins Thermochim Acta 1992 199 197-205
141 Vermeer A W Norde W van Amerongen A The UnfoldingDenaturation of Immunogammaglobulin of Isotype 2b and its F ab and F c Fragments Biophys J 2000 79 2150-2154
142 Wagner V Dullaart A Bock A-K Zweck A The emerging nanomedicine landscape Nat Biotech 2006 24 1211-1217
182 143 Prensner J R Chinnaiyan A M Srivastava S Systematic evidence-based discovery of biomarkers at the NCI Clin Exp Metastasis 2012 29 645-652
144 Junod S W FDA and clinical drug trials a short history A Quick Guide to Clinical Trials For People Who May Not Know It All 2014 21-51
145 McGonigle P Ruggeri B Animal models of human disease Challenges in enabling translation Biochem Pharmacol 2014 87 162-171
146 Perel P Roberts I Sena E Wheble P Briscoe C Sandercock P Macleod M Mignini L E Jayaram P Khan K S Comparison of treatment effects between animal experiments and clinical trials systematic review BMJ 2007 334 197
147 Mak I Evaniew N Ghert M Lost in translation animal models and clinical trials in cancer treatment Am J Transl Res 2014 6 114-8
148 Seok J Warren H S Cuenca A G Mindrinos M N Baker H V Xu W Richards D R McDonald-Smith G P Gao H Hennessy L Finnerty C C Loacutepez C M Honari S Moore E E Minei J P Cuschieri J Bankey P E Johnson J L Sperry J Nathens A B Billiar T R West M A Jeschke M G Klein M B Gamelli R L Gibran N S Brownstein B H Miller-Graziano C Calvano S E Mason P H Cobb J P Rahme L G Lowry S F Maier R V Moldawer L L Herndon D N Davis R W Xiao W Tompkins R G Inflammation t Host Response to Injury L S C R P Genomic responses in mouse models poorly mimic human inflammatory diseases Proceedings of the National Academy of Sciences 2013 110 3507-3512
149 Cabib S Orsini C Moal M L Piazza P V Abolition and Reversal of Strain Differences in Behavioral Responses to Drugs of Abuse After a Brief Experience Science 2000 289 463-465
150 Pozzi D Caracciolo G Capriotti A L Cavaliere C La Barbera G Anchordoquy T J Lagana A Surface chemistry and serum type both determine the nanoparticle-protein corona J Proteomics 2015 119 209-17
151 Zhao X B Muthusamy N Byrd J C Lee R J Cholesterol as a bilayer anchor for PEGylation and targeting ligand in folate‐receptor‐targeted liposomes J Pharm Sci 2007 96 2424-2435
152 Nuhn L Gietzen S Mohr K Fischer K Toh K Miyata K Matsumoto Y Kataoka K Schmidt M Zentel R Aggregation behavior of cationic nanohydrogel particles in human blood serum Biomacromolecules 2014 15 1526-1533
153 Chai W Synthese und Charakterisierung von multivalenten kationischen Tensiden und Polymeren Universitaumltsbibliothek Mainz 2012
Appendix 183
7 APPENDIX
71 ABBREVIATIONS
A baseline
a amplitude
AF-FFF asymmetric flow-field flow fractionation
ACF autocorrelation dunction
BNF bionized nanofferite
BSA bovine serum albumin
Chol cholesterol
CD circular dichroism
CMC critical micelle concentration
cp coated particle
D diffusion coefficient
DEX dextran
DOTAP 12-dioleoyl-3-trimethylammoniopropane
DOTMA N-[1-(2 3-dioleyloxy)propyl]-NNN-trimethylammonium chloride
DOX doxorubicin
DLS dynamic light scattering
DSPC distearoyl phosphatodylcholine
E elution fraction
ε dielectric constant
EPC egg phosphatidyl choline
EPR enhanced permeability and retention
f intensity contribution
FBS fetal bovine serum
FCS fluorescence correlation spectroscopy
FT flow through
g1(t) experimental field autocorrelation function
g2(t) intensity autocorrelation function
184 hbPG hyperbranched polyglycerol
HES hydroxyl ethyl starch
HI heat inactivated
HSA human serum albumin
IgG immunoglobulin G
ITC isothermal titration calorimetry
L liposome
LC-MS liquid chromatography-mass spectrometry
η viscosity
NP nanoparticles
PEG poly (ethylene glycol)
PS polystyrene
q scattering angle
p particle
ρ ratio of radius or gyration and hydrodynamic radius
Rg radius of gyration
Rh hydrodynamic radius
RNAi RNA interference
SDS sodium dodecyl sulfate
SDS-PAGE SDS polyacrylamide gel electrophoresis
T temperature
Г correlation time
TF 1-hydroxy-50-amino-3471013161922-octaoxa-374145-triaza-
pentacontane
TLR toll like receptor
TNT 135-triazinine-246-trione
TOF time of flight
uE electrophoretic mobility
ζ zeta potential
Appendix 185
72 SUPPLEMENTARY INFORMATION
721 LC-MS DATA FOR BLOOD PLASMA FRACTIONATION
Pro
tein
nam
e
Average percentage of total protein
IgG
IgG
de
ple
ted
pla
sma
HSA
de
ple
ted
pla
sma
HSA
(A
ffiB
lue
on
ly)
HSA
(co
lum
ns
in s
eri
es)
Alpha-1-acid glycoprotein 1 000 054 419 000 000
Alpha-1-acid glycoprotein 2 000 190 199 000 000
Alpha-1-antichymotrypsin 000 050 101 013 043
Alpha-1-antitrypsin 000 161 1338 000 000
Alpha-2-macroglobulin 000 120 725 003 002
Ceruloplasmin 000 050 254 000 000
Fibronectin 000 021 000 000 002
Haptoglobin 000 105 631 007 004
Haptoglobin-related protein 166 025 141 000 001
Serum amyloid P-component 000 004 000 000 005
Alpha-2-antiplasmin 000 021 059 000 000
Antithrombin-III 000 046 000 011 016
Coagulation factor XII 006 000 000 000 000
Fibrinogen alpha chain 002 062 000 013 048
Fibrinogen beta chain 003 185 000 051 082
Fibrinogen gamma chain 014 155 000 042 121
Heparin cofactor 2 000 018 000 000 000
186
Histidine-rich glycoprotein 010 007 000 000 000
Kininogen-1 000 020 051 015 020
Plasminogen 030 006 000 000 000
Prothrombin 000 016 000 051 006
C4b-binding protein alpha chain 045 015 000 000 000
Complement C1q subcomponent subunit A 014 000 000 000 000
Complement C1q subcomponent subunit B 018 000 000 000 000
Complement C1q subcomponent subunit C 013 000 000 000 000
Complement C1r subcomponent 011 000 000 000 000
Complement C1s subcomponent 007 000 000 000 000
Complement C3 040 061 124 034 074
Complement C4-A 001 008 012 081 016
Complement C4-B 013 035 074 161 000
Complement component C8 gamma chain 004 000 000 000 000
Complement factor B 007 115 000 084 024
Complement factor H 017 044 000 000 000
Complement factor H-related protein 1 002 000 000 000 000
Plasma protease C1 inhibitor 000 015 000 014 015
Ig alpha-1 chain C region 106 098 536 045 033
Ig alpha-2 chain C region 024 041 277 010 007
Ig delta chain C region 002 000 000 002 000
Ig gamma-1 chain C region 3745 008 102 1535 000
Ig gamma-2 chain C region 853 000 280 227 000
Ig gamma-3 chain C region 073 000 002 025 000
Ig gamma-4 chain C region 083 000 041 013 000
Ig heavy chain V-I region HG3 014 000 000 000 000
Appendix 187
Ig heavy chain V-I region V35 005 000 000 000 000
Ig heavy chain V-II region ARH-77 028 000 000 009 000
Ig heavy chain V-II region NEWM 004 000 000 000 000
Ig heavy chain V-II region WAH 005 000 000 000 000
Ig heavy chain V-III region BRO 104 011 032 046 000
Ig heavy chain V-III region BUT 022 000 000 000 000
Ig heavy chain V-III region CAM 003 000 000 000 000
Ig heavy chain V-III region GAL 023 000 000 009 000
Ig heavy chain V-III region JON 013 000 000 000 000
Ig heavy chain V-III region POM 001 000 000 000 000
Ig heavy chain V-III region TIL 000 000 010 013 000
Ig heavy chain V-III region TUR 029 000 000 000 000
Ig heavy chain V-III region VH26 019 000 009 014 000
Ig heavy chain V-III region WEA 008 000 001 005 000
Ig kappa chain C region 1788 127 647 837 131
Ig kappa chain V-I region AG 042 062 011 090 000
Ig kappa chain V-I region AU 004 000 000 000 000
Ig kappa chain V-I region CAR 011 000 000 000 000
Ig kappa chain V-I region EU 015 000 000 010 000
Ig kappa chain V-I region Gal 001 000 000 000 000
Ig kappa chain V-I region Hau 000 000 000 000 000
Ig kappa chain V-I region HK101 (Fragment) 002 000 000 000 000
Ig kappa chain V-I region Lay 013 000 007 000 000
Ig kappa chain V-I region Roy 006 000 000 000 000
Ig kappa chain V-I region Scw 005 000 000 000 000
Ig kappa chain V-I region WEA 004 000 000 001 000
188
Ig kappa chain V-I region Wes 012 000 000 000 000
Ig kappa chain V-II region Cum 009 000 000 002 000
Ig kappa chain V-II region GM607 (Fragment) 001 000 000 000 000
Ig kappa chain V-II region RPMI 6410 007 000 000 000 000
Ig kappa chain V-II region TEW 072 000 026 028 000
Ig kappa chain V-III region GOL 020 000 000 000 004
Ig kappa chain V-III region HIC 016 000 000 000 000
Ig kappa chain V-III region IARCBL41 006 000 000 000 000
Ig kappa chain V-III region NG9 (Fragment) 004 000 000 012 000
Ig kappa chain V-III region SIE 054 011 014 030 000
Ig kappa chain V-III region Ti 078 000 009 000 000
Ig kappa chain V-III region VG (Fragment) 034 000 023 009 000
Ig kappa chain V-IV region JI 005 000 000 000 000
Ig kappa chain V-IV region Len 070 006 019 019 000
Ig kappa chain V-IV region STH (Fragment) 006 000 000 000 000
Ig lambda chain V-I region HA 041 000 000 000 000
Ig lambda chain V-I region WAH 010 000 000 000 000
Ig lambda chain V-III region LOI 007 000 000 000 000
Ig lambda chain V-III region SH 500 000 000 000 000
Ig lambda-1 chain C regions 000 000 136 000 000
Ig lambda-2 chain C regions 132 035 298 158 016
Ig lambda-7 chain C region 268 000 000 000 000
Ig mu chain C region 286 075 139 257 146
Ig mu heavy chain disease protein 316 082 139 000 021
Immunoglobulin J chain 014 000 010 008 000
Immunoglobulin lambda-like polypeptide 5 393 030 000 047 000
Appendix 189
Apolipoprotein A-I 000 010 217 000 000
Apolipoprotein A-II 000 000 028 000 000
Apolipoprotein A-IV 000 000 022 000 000
Apolipoprotein B-100 000 022 000 000 000
Beta-2-glycoprotein 1 065 535 000 196 039
Clusterin 000 023 014 000 000
Phosphatidylcholine-sterol acyltransferase 000 000 005 000 000
Serum paraoxonasearylesterase 1 000 020 025 000 000
Afamin 000 004 027 000 000
Alpha-1B-glycoprotein 000 034 240 000 000
Alpha-2-HS-glycoprotein 000 053 171 000 000
Angiotensinogen 000 008 103 000 000
Attractin 000 000 009 000 000
Beta-Ala-His dipeptidase 000 000 005 000 000
Cholinesterase 000 000 011 000 000
Corticosteroid-binding globulin 000 004 052 000 000
Hemopexin 000 175 336 149 182
Inter-alpha-trypsin inhibitor heavy chain H1 000 049 000 056 012
Inter-alpha-trypsin inhibitor heavy chain H2 000 026 000 132 022
Inter-alpha-trypsin inhibitor heavy chain H4 000 020 000 009 005
Leucine-rich alpha-2-glycoprotein 000 000 092 000 000
N(G)N(G)-dimethylarginine dimethylaminohydrolase 1
000 000 009 000 000
Pregnancy zone protein 000 050 058 000 000
Protein AMBP 000 012 023 018 008
Serotransferrin 004 278 451 165 280
Serum albumin 056 5692 408 4739 8414
190
Thyroxine-binding globulin 000 000 019 000 000
Transthyretin 000 047 285 000 000
Vitamin D-binding protein 000 025 216 000 000
Zinc-alpha-2-glycoprotein 000 125 084 000 000
Acylpyruvase FAHD1 mitochondrial 000 066 000 088 195
Brain and acute leukemia cytoplasmic protein 001 000 000 000 000
BTBPOZ domain-containing protein KCTD12 000 159 000 186 000
BTBPOZ domain-containing protein KCTD2 000 000 066 000 000
CD5 antigen-like 024 006 008 008 000
Coronin-1B 000 009 000 000 000
DDB1- and CUL4-associated factor 8 000 000 014 000 000
Hemoglobin subunit beta 000 000 016 000 000
Lumican 000 000 015 000 000
Lysophospholipid acyltransferase LPCAT4 000 023 000 004 000
Methylglutaconyl-CoA hydratase mitochondrial 000 000 000 000 006
Methylmalonyl-CoA epimerase mitochondrial 000 000 018 000 000
N-acetylmuramoyl-L-alanine amidase 003 000 000 007 000
N-alpha-acetyltransferase 10 000 007 000 000 000
Potassium voltage-gated channel subfamily C member 2
000 185 000 000 000
Protein Njmu-R1 000 121 000 183 000
SHC-transforming protein 1 000 000 032 000 000
Sorting nexin-32 000 000 007 000 000
Tubulin beta-4A chain 000 000 000 021 000
Tubulin beta-4B chain 000 000 017 000 000
Vitronectin 000 018 000 000 000
Appendix 191
Protein name E1 E2 E3 E4
BTBPOZ domain-containing protein KCTD12 000 484 000 182
Kv channel-interacting protein 2 000 000 000 007
Myocyte-specific enhancer factor 2A 000 000 000 004
Ribosomal RNA small subunit methyltransferase NEP1 000 000 000 003
Protein Njmu-R1 000 114 000 000
Thymidine phosphorylase 000 009 000 000
Tubulin beta-4A chain 000 008 000 000
Corticosteroid-binding globulin 000 008 000 000
Transcription factor IIIB 50 kDa subunit 000 004 000 000
Calmodulin-like protein 3 000 002 000 000
Dihydropyrimidinase 000 002 000 000
Ras-related protein Rab-4A 000 002 000 000
Leucine-rich alpha-2-glycoprotein 000 002 000 000
Alpha-16-mannosyl-glycoprotein 2-beta-N-acetylglucosaminyltransferase
033 000 000 000
ADP-ribosylation factor-like protein 8B 011 000 000 000
FERM and PDZ domain-containing protein 2 008 000 000 000
DNA replication factor Cdt1 002 000 000 000
UPF0160 protein MYG1 mitochondrial 002 000 000 000
Paired mesoderm homeobox protein 1 000 000 000 000
Serglycin 000 000 000 000
LysM and putative peptidoglycan-binding domain-containing protein 1
000 000 000 000
Alpha-1-antitrypsin 000 213 218 135
Haptoglobin 000 163 106 114
192
Alpha-2-macroglobulin 000 116 068 086
Ceruloplasmin 000 003 053 065
Alpha-1-antichymotrypsin 000 014 034 037
Fibronectin 000 000 019 031
Alpha-1-acid glycoprotein 1 000 056 047 024
Haptoglobin-related protein 000 037 029 013
Serum amyloid P-component 000 000 000 012
Alpha-1-acid glycoprotein 2 000 110 019 006
Fibrinogen gamma chain 000 113 134 262
Fibrinogen beta chain 000 066 090 177
Fibrinogen alpha chain 000 050 055 097
Prothrombin 000 000 000 089
Kininogen-1 000 015 022 031
Plasminogen 032 020 000 004
Antithrombin-III 000 013 007 003
Alpha-2-antiplasmin 000 011 000 000
Complement C3 000 012 090 147
Complement C4-B 000 000 033 080
Plasma protease C1 inhibitor 000 000 023 029
Complement factor H 000 003 000 016
Complement component C9 000 000 000 009
C4b-binding protein alpha chain 000 000 002 006
Complement factor B 008 028 003 003
Complement component C8 gamma chain 000 001 000 000
Complement C4-A 000 000 000 000
Ig kappa chain C region 2734 441 343 390
Appendix 193
Ig mu chain C region 000 258 309 270
Ig gamma-1 chain C region 3804 294 102 134
Ig alpha-1 chain C region 002 096 088 105
Immunoglobulin lambda-like polypeptide 5 506 000 061 059
Ig heavy chain V-III region BRO 070 034 024 044
Ig lambda-3 chain C regions 000 000 000 033
Ig alpha-2 chain C region 000 037 025 024
Ig gamma-2 chain C region 808 074 023 019
Ig kappa chain V-II region TEW 072 021 015 017
Ig kappa chain V-I region AG 019 006 011 014
Immunoglobulin J chain 000 007 011 013
Ig kappa chain V-III region SIE 062 024 009 009
Ig heavy chain V-III region BUT 000 000 004 000
Ig gamma-3 chain C region 149 021 000 000
Ig heavy chain V-I region HG3 000 002 000 000
Ig lambda-7 chain C region 209 000 000 000
Ig gamma-4 chain C region 081 000 000 000
Ig kappa chain V-I region WEA 023 000 000 000
Ig heavy chain V-II region ARH-77 022 000 000 000
Ig lambda chain V-III region LOI 019 000 000 000
Ig lambda chain V-I region WAH 017 000 000 000
Ig heavy chain V-III region TUR 015 000 000 000
Ig kappa chain V-I region EU 014 000 000 000
Ig heavy chain V-III region GAL 013 000 000 000
Ig heavy chain V-III region VH26 012 000 000 000
Ig kappa chain V-III region NG9 (Fragment) 012 000 000 000
194
Ig kappa chain V-IV region Len 011 000 000 000
Ig lambda chain V-III region SH 010 000 000 000
Ig kappa chain V-IV region STH (Fragment) 010 000 000 000
Ig heavy chain V-III region WEA 009 000 000 000
Apolipoprotein A-I 000 066 052 083
Apolipoprotein A-IV 000 025 000 030
Apolipoprotein B-100 000 026 000 019
Serum paraoxonasearylesterase 1 000 000 000 018
Clusterin 000 030 014 018
Beta-2-glycoprotein 1 181 018 000 000
Apolipoprotein A-II 000 000 000 000
Serum albumin 000 5808 7513 6482
Inter-alpha-trypsin inhibitor heavy chain H2 000 000 009 081
Hemopexin 108 270 114 072
Transthyretin 000 000 018 072
Pregnancy zone protein 000 017 000 058
Inter-alpha-trypsin inhibitor heavy chain H1 000 000 000 054
Protein AMBP 000 000 000 041
Serotransferrin 915 517 095 041
Alpha-2-HS-glycoprotein 000 059 040 036
Vitamin D-binding protein 000 039 019 014
Alpha-1B-glycoprotein 000 029 027 014
Angiotensinogen 000 009 016 012
Retinol-binding protein 4 000 000 000 009
Afamin 000 003 000 002
Zinc-alpha-2-glycoprotein 001 015 006 001
Appendix 195
Inter-alpha-trypsin inhibitor heavy chain H4 000 005 000 000
Vitronectin 000 000 000 021
CD5 antigen-like 000 008 000 009
Lumican 000 000 000 005
Keratin type II cytoskeletal 1 000 028 000 000
Keratin type I cytoskeletal 9 000 018 000 000
Keratin type II cytoskeletal 2 epidermal 000 006 000 000
Keratin type I cytoskeletal 14 000 003 000 000
Keratin type I cytoskeletal 10 000 003 000 000
Keratin type II cytoskeletal 6B 000 001 000 000
Keratin type I cytoskeletal 16 000 001 000 000
Keratin type I cytoskeletal 15 000 000 000 000
196
722 OVERVIEW OF SOFT CORONA ANALYSIS CHAPTER 621
DLS soft corona analysis with duplicates of all particles without pre-coating
Appendix 197
723 OVERVIEW OF HARD PROTEIN CORONA ANALYSIS CHAPTER 631
De
scri
pti
on
average
Hu
man
Pla
sma
PS
PS-
Lut-
CO
OH
PS-
Lut-
NH
2
Ceruloplasmin 034 000 000 000
Haptoglobin 170 000 000 000
Haptoglobin-related protein 007 009 000 008
Alpha-1-antitrypsin 157 025 000 038
Alpha-1-antichymotrypsin 035 000 000 000
Alpha-2-macroglobulin 089 000 000 000
Serum amyloid P-component 006 000 000 000
Fibronectin 029 012 000 000
Alpha-1-acid glycoprotein 1 005 000 000 000
Serum amyloid A-1 protein 000 000 022 009
Lipopolysaccharide-binding protein 000 000 053 005
Alpha-1-acid glycoprotein 2 002 000 000 000
Alpha-2-antiplasmin 007 000 000 000
Antithrombin-III 016 000 000 005
Coagulation factor V 000 000 037 000
Coagulation factor XI 000 000 036 000
Fibrinogen alpha chain 085 028 785 032
Fibrinogen beta chain 100 051 623 042
Fibrinogen gamma chain 146 057 605 054
Heparin cofactor 2 037 000 000 000
198
Histidine-rich glycoprotein 008 000 582 000
Hyaluronan-binding protein 2 000 000 021 000
Kininogen-1 120 000 499 000
Plasma kallikrein 004 000 029 000
Plasminogen 016 000 000 000
Prothrombin 021 000 000 000
C4b-binding protein alpha chain 015 011 000 000
Complement C1q subcomponent subunit A 002 000 000 000
Complement C1q subcomponent subunit B 011 000 000 000
Complement C1q subcomponent subunit C 007 000 000 000
Complement C1r subcomponent 001 025 000 033
Complement C1s subcomponent 006 018 000 032
Complement C3 072 073 000 145
Complement C4-A 007 029 000 012
Complement C4-B 012 020 000 010
Complement component C8 alpha chain 003 000 000 000
Complement component C8 gamma chain 002 000 000 000
Complement component C9 005 000 000 000
Complement factor B 018 000 000 000
Complement factor H 027 000 020 000
Complement factor H-related protein 1 000 000 021 000
Plasma protease C1 inhibitor 015 028 008 037
Immunoglobulin lambda-like polypeptide 5 119 000 000 000
Immunoglobulin J chain 012 000 000 000
Ig kappa chain V-I region AG 032 000 000 000
Ig kappa chain V-I region EU 018 000 000 000
Appendix 199
Ig kappa chain V-I region HK102 (Fragment) 002 000 000 000
Ig kappa chain V-I region Lay 011 000 000 000
Ig kappa chain V-II region TEW 027 000 000 000
Ig kappa chain V-III region SIE 058 000 000 000
Ig kappa chain V-IV region Len 028 000 000 000
Ig heavy chain V-I region HG3 013 000 000 000
Ig heavy chain V-III region WEA 004 000 000 000
Ig heavy chain V-III region VH26 016 000 000 000
Ig heavy chain V-III region TIL 013 000 000 000
Ig heavy chain V-III region BRO 054 000 000 000
Ig heavy chain V-III region GAL 012 000 000 000
Ig kappa chain C region 863 108 013 047
Ig gamma-1 chain C region 830 000 000 026
Ig gamma-2 chain C region 269 000 000 000
Ig gamma-2 chain C region 000 012 000 013
Ig gamma-3 chain C region 038 000 000 000
Ig gamma-4 chain C region 014 000 000 000
Ig mu chain C region 245 000 000 000
Ig mu chain C region 000 115 000 031
Ig alpha-1 chain C region 111 000 000 000
Ig alpha-1 chain C region 000 025 000 020
Ig alpha-2 chain C region 011 000 000 000
Ig delta chain C region 001 000 000 000
Ig mu heavy chain disease protein 003 000 000 000
Ig kappa chain V-III region VG (Fragment) 015 000 000 000
Ig heavy chain V-II region ARH-77 011 000 000 000
200
Ig lambda-6 chain C region 000 000 000 018
Ig lambda-2 chain C regions 252 000 000 000
Ig heavy chain V-I region V35 003 000 000 000
Ig lambda chain V-III region LOI 011 000 000 000
Bcl-2-related protein A1 011 000 000 000
Apolipoprotein A-I 123 1669 522 1483
Apolipoprotein A-II 000 000 000 025
Apolipoprotein A-IV 013 1154 010 1503
Apolipoprotein B-100 017 066 000 065
Apolipoprotein C-III 000 306 164 924
Apolipoprotein D 000 023 000 089
Apolipoprotein E 003 377 225 315
Beta-2-glycoprotein 1 145 000 968 000
Clusterin 034 5181 1444 4280
Ig alpha-1 chain C region 000 025 000 020
Phospholipid transfer protein 000 016 000 065
Serum paraoxonasearylesterase 1 006 037 000 049
Afamin 015 000 000 000
Alpha-1B-glycoprotein 013 000 000 000
Alpha-2-HS-glycoprotein 033 000 000 000
Angiotensinogen 027 000 000 000
Hemoglobin subunit alpha 001 000 000 000
Hemoglobin subunit beta 003 000 000 000
Hemopexin 082 000 000 000
Ig lambda-3 chain C regions 000 031 000 000
Inter-alpha-trypsin inhibitor heavy chain H1 018 000 000 000
Appendix 201
Inter-alpha-trypsin inhibitor heavy chain H2 017 007 000 008
Inter-alpha-trypsin inhibitor heavy chain H4 010 000 598 000
Leucine-rich alpha-2-glycoprotein 002 000 000 000
Pregnancy zone protein 008 000 000 000
Probable ATP-dependent RNA helicase DDX46 000 000 000 006
Protein AMBP 011 000 000 000
Protein Njmu-R1 005 000 000 000
Putative protein ZNF815 000 000 000 011
Selenoprotein P 000 000 018 000
Serotransferrin 218 000 000 000
Serum albumin 4559 089 047 080
Synaptosomal-associated protein 23 015 000 000 000
Transthyretin 039 040 048 051
UBX domain-containing protein 4 007 000 000 000
Vitamin D-binding protein 035 000 000 000
Zinc-alpha-2-glycoprotein 009 000 000 000
A-kinase anchor protein 8 000 017 000 000
CD5 antigen-like 013 007 000 000
Corticosteroid-binding globulin 004 000 000 000
Cysteine protease ATG4C 070 000 000 000
Cytoplasmic protein NCK2 008 000 000 000
Gelsolin 012 000 000 000
Ig gamma-1 chain C region 000 028 000 000
N-acetylmuramoyl-L-alanine amidase 003 000 000 000
Vitronectin 016 281 2601 405
202
724 CHARACTERIZATION OF INDIVIDUAL AND POOLED HUMAN SERUM
Determined hydrodynamic radii of individual as well as pooled human serum via DLS
Zusammenfassung 203
8 ZUSAMMENFASSUNG
Die Entwicklung von Nanomaterialien fuumlr die biomedizinische Anwendung hat in den
letzten Jahren an enormer Bedeutung gewonnen Besonders in der Therapie von
Krebserkrankungen bietet das Verpacken von Wirkstoffen in einem Traumlger viele Vorteile
gegenuumlber der Administration des Wirkstoffes alleine Nanomaterialen sind aufgrund ihrer
speziellen Eigenschaften dazu geschaffen den Wirkstoff gezielt an den Wirkort zu
transportieren Auf diese Weise koumlnnen die zytotoxischen Nebenwirkungen die waumlhrend
einer Chemotherapie auftreten reduziert werden Daruumlber hinaus wird durch das
Verpacken auch der Wirkstoff an sich vor Abbau geschuumltzt
Nichts desto trotz ist die Anwendung von Nanomaterialien in der Krebstherapie limitiert
da die physiologischen Prozesse die ein Nanotransporter nach Administration hervorruft
nur schwer prognostiziert werden koumlnnen Bisher werden Nanotransporter uumlblicherweise
intravenoumls verabreicht Das bedeutet dass diese sofort mit dem menschlichen Blut und
den darin befindlichen Proteinen in Beruumlhrung kommen Dies fuumlhrt zur raschen
Ausbildung einer Proteinhuumllle auf der Oberflaumlche der Nanomaterialien welche deren
chemischen und physikalischen Eigenschaften stark veraumlndert
Diese Studie untersucht den Einfluss einzelner Proteine sowie Proteinmischungen auf die
physikochemischen Eigenschaften von Polystyrrol-Partikeln als Modellsystem Die
Einzelproteine sowie Proteinmischungen die Albumin- bzw IgG-frei sind wurden durch
die Fraktionierung von menschlichem Blutplasma gewonnen Die Inkubation der
genannten Partikel in klar definierten Proteinmischungen wurde genutzt um eine
vorherbestimmte Proteinhuumllle auf der Partikeloberflaumlche auszubilden Diese bdquokuumlnstlicheldquo
Proteinhuumllle wurde im Anschluss untersucht im Hinblick auf stabilisierende bzw
destabilisierende Wirkung auf die Nanopartikel unter in vivo-Bedingungen mittels
dynamischer Lichtstreuung Zusaumltzlich wurde der Effekt der gegebenen Proteinhuumllle auf
die Zellaufnahme in Makrophagen uumlberpruumlft Es konnte gezeigt werden dass eine
Stabilisierung von Partikeln im Hinblick auf das Aggregationsverhalten moumlglich ist indem
man Partikel mit bestimmten Proteinen vorbeschichtet
204 Das Konzept der Partikelbeschichtung zur Stabilisierung gegenuumlber Aggregation wurde
ausgedehnt um die Schwierigkeiten zu uumlberwinden die die unterschiedliche
Blutserumzusammensetzung von verschiedenen Individuen birgt
Ein naumlchster Fokus wurde auf die Uumlbertragbarkeit verschiedener in vivo-Modelle auf den
Menschen gelegt Es zeigte sich dass sowohl das Aggregationsverhalten von
Polystyrrolpartikeln als auch jenes von Dextran- und Staumlrke-umhuumlllten Partikeln sehr stark
von der Proteinquelle abhaumlngt
Nachdem einzelne Aspekte die Einfluss auf die Proteinadsorption auf Partikeln ausuumlben
untersucht wurden wurde das Modellsystem ausgetauscht gegen liposomale Systeme die
dem siRNA-Transport dienen Das Aggregationsverhalten der Liposomen bzw Lipoplexe
wurde mittels dynamischer Lichtstreuung untersucht und optimiert
Zusammenfassend kann festgehalten werden dass verschiedene Einflussfaktoren fuumlr die
physikochemischen Eigenschaften von Nanomaterialien nach Exposition ins menschliche
Blut gezielt untersucht wurden So wurden viele Moumlglichkeiten aufgezeigt welche zur
Evaluation eines Nanomaterials vor in vivo-Versuchen herangezogen werden koumlnnen
Zusaumltzlich wurden Optionen aufgezeigt wie die Wechselwirkung von Proteinen mit
Nanomaterialien gezielt zur Stabilisierung genutzt werden kann

Dekan
1 Berichterstatter
2 Berichterstatter
Tag der muumlndlichen Pruumlfung
Contents I 1 ABSTRACT 1
2 INTRODUCTION 3
21 BLOOD 3
22 NANOMATERIALS AS DRUG DELIVERY SYSTEMS 5
221 Liposomes for SIRNA DELIVERY 6
23 PROTEIN CORONA 11
231 THE STEALTH EFFECT 14
24 PROTEIN CORONA ANALYSIS 15
241 IN SITU ANALYSIS 16
242 HARD CORONA ANALYSIS 21
25 AIM OF THIS WORK 25
3 RESULTS AND DISCUSSION 27
31 FRACTIONATION OF HUMAN BLOOD PLASMA 27
32 FRACTIONS OF PROTEIN MIXTURES DIFFERENTIALLY AGGREGATE NANOPARTICLES AND INFLUENCE THE
CELLULAR UPTAKE 36
321 THE PARTICLES UNDER INVESTIGATION 37
322 SOFT PROTEIN CORONA ANALYSIS 38
323 HARD PROTEIN CORONA ANALYSIS 46
324 TAILORING THE HARD CORONA 48
325 THE IMPACT OF PROTEIN CONCENTRATION ON PARTICLE AGGREGATION AND STABILIZATION
VIA PRE-COATING 59
326 USING PROTEIN MIXTURES AS SURFACTANTS FOR PARTICLE STABILIZATION 67
327 Summary 72
33 HUMAN BLOOD PLASMA VERSUS SERUM 74
34 EVALUATION OF NANOPARTICLE STABILITY IN HUMAN BLOOD SERUM BY DYNAMIC LIGHT SCATTERING
THE IMPACT OF PERSONALIZED HUMAN BLOOD SERUM COMPOSITION 79
341 ANALYSIS OF INDIVIDUAL AND POOLED HUMAN BLOOD SERUM 80
342 STABILITY EVALUATION OF NANOPARTICLES IN HUMAN BLOOD SERUM BY DYNAMIC LIGHT
SCATTERING 83
343 TAKING ADVANTAGE OF THE INFLUENCE OF PERSONALIZED SERUM ON PARTICLES STABILITY
85
344 HEAT INACTIVATION OF HUMAN BLOOD SERUM 90
345 DILUTION AS A TOOL FOR PRE-COATING OF NANOPARTICLES 97
346 Summary 100
35 THE TRANSFER OF A PROTEIN CORONA 101
351 THE STEALTH NANOCARRIER 101
II
352 CORONA TRANSFER 106
36 EVALUATION OF DIFFERENT IN VIVO MODELS FOR BIOMEDICAL APPLICATION 111
361 CHARACTERIZATION OF DIFFERENT BLOOD PLASMA SOURCES 111
362 INVESTIGATION OF PROTEIN-PARTICLE INTERACTIONS 116
37 FROM THE MODEL SYSTEM TOWARDS LIPOSOMES FOR BIOMEDICAL APPLICATION 124
371 EVALUATION OF MULTIFUNCTIONAL LIPOSOMES IN HUMAN BLOOD SERUM BY DYNAMIC
LIGHT SCATTERING 124
372 MULTICOMPONENT LIPOSOMES FOR SIRNA DELIVERY TO THE LIVER 131
4 SUMMARY AND OUTLOOK 147
5 EXPERIMENTAL SECTION 149
51 LIST OF EQUIPMENT 149
52 METHODS 151
521 Fractionation of human blood plasma 151
522 Fractions of protein mixture differentially aggregate nanoparticles and influence the cellular
uptake 154
523 Human Blood Plasma versus Serum 159
524 Evaluation of NP stability in human blood serum 159
525 The transfer of a protein corona 161
526 Evaluation of different in vivo models 162
527 Evaluation of multifunctional liposomes in human blood serum by dynamic light scattering 163
528 Multicomponent liposomes for siRNA delivery to the liver 163
6 REFERENCES 173
7 APPENDIX 183
71 ABBREVIATIONS 183
72 SUPPLEMENTARY INFORMATION 185
721 LC-MS DATA FOR BLOOD PLASMA FRACTIONATION 185
722 OVERVIEW OF SOFT CORONA ANALYSIS CHAPTER 621 196
723 OVERVIEW OF HARD PROTEIN CORONA ANALYSIS CHAPTER 631 197
724 CHARACTERIZATION OF INDIVIDUAL AND POOLED HUMAN SERUM 202
8 ZUSAMMENFASSUNG 203
Contents III LIST OF FIGURES
Figure 1 The human plasma proteome8 4
Figure 2 Passive18
(1) versus active (2) targeting The defect architecture of tumor tissue allows the
penetration with nutrients and macromolecules By conjugating antibodies to macromolecules the
accumulation can be increased by specific antibody-receptor interactions on the surface of tumor
cells Figure 2 (1) Reprinted from Advanced Drug Delivery Reviews Volume 65 Issue 1 Hirashi Maeda
Hideaki Nakamura Jun Fang ldquoThe EPR effect for macromolecular drug delivery to solid tumors
Improvement of tumor uptake lowering of systemic toxicity and distinct tumor imaging in vivordquo
Pages 71-79 Copyright copy (2012) with permission from Elsevier Elsevier 6
Figure 3 a) Schematic structure of left) phosphoglycerides and right) sphingophospholipids with the polar
head (orange) and the apolar tail (blue) b) schematic 3D structure of self-assembled lipids with A)
micelle B) bilayer and C) vesicle c) PEG modification of liposomes with high density (left) and low
density (right) reprinted from Biochemical and Biophysical Research Communications Volume 468
Issue 3 Laura K Muumlller Katharina Landfester ldquoNatural liposomes and synthetic polymeric structures
for biomedical applicationsrdquo Pages 411-418 Copyright copy (2015) with permission from Elsevier 8
Figure 4 Chemical versus biological identity of a nanomaterial after intravenous injection86
Adapted from
ldquoWalkey C D Chan W C Understanding and controlling the interaction of nanomaterials with
proteins in a physiological environment Chem Soc Rev 2012 41 2780-2799rdquo with permission of The
Royal Society of Chemistry 12
Figure 5 Protein adsorption on stealth-materials (right) is reduced in comparison to non-modified NPs (left)
15
Figure 6 Soft vs hard corona obtained by the removal of free proteins using for instance centrifugation or
magnetic separation 16
Figure 7 Chromatogram of IgG separation via Protein A column and the corresponding protein amount in
the fractions according to a BCA Assay 28
Figure 8 A) Protein patterns obtained by SDS-PAGE of plasma and the protein fractions obtained by Protein
A affinity chromatography with FT1 = flow through Protein A column B) LC-MS analysis of the
respective protein fractions (LC-MS measurements performed by Dr Susanne Schoumlttler) 29
Figure 9 Chemical structure of Cibacron Blue 29
Figure 10 Chromatogram of HSA separation via AffiGel-Blue column and the corresponding protein amount
in the fractions according to a BCA Assay 30
Figure 11 A) Protein patterns obtained by SDS-PAGE of plasma and the protein fractions obtained by series
connection of Protein A affinity chromatography and AffiGel Blue affinity chromatography with FT1 =
flow through Protein A column and FT2 = FT1 with subsequent HSA removal B) LC-MS analysis of the
respective protein fractions with FT = flow through AffiGel Blue column (LC-MS measurements
performed by Dr Susanne Schoumlttler) 31
Figure 12 A) Angular dependency of the inverse hydrodynamic radii of the different protein fractions B)
ACF of FPlasma-wo-HSA-IgG with the distribution of the 3 different size fractions at Θ = 30deg 33
Figure 13 Chromatogram of DEAE anion exchange chromatography 34
IV Figure 14 LC-MS analysis of elution fraction 1 ndash 4 (LC-MS performed by Dr Susanne Schoumlttler AK
Landfester Max Planck Institute for Polymer Research Mainz 2015) and SDS-PAGE of the respective
protein fractions 35
Figure 15 SDS-PAGE of series connection of Protein A column AffiGel Blue column and DEAE column with
FT1-3 = flow through after each column and E1-4 elution fraction 1-4 of DEAE column 35
Figure 16 Angular dependency of the inverse hydrodynamic radii of PS PS-COOH and PS-NH2 obtained by
DLS 37
Figure 17 TEM images and physicochemical characterization of polystyrene nanoparticles with different
surface functionalization 38
Figure 18 Size increase of respective PS-particles in dependence of the protein amount 39
Figure 19 A) ACFs of the different particles in isolated FPlasma-wo-IgG-HSA at Θ = 60deg including data points (bull) and
the forced fit as the sum of the individual components (red) with the corresponding residuals resulting
from the difference between data and fit B) ACFs of the different particles in human plasma at Θ = 60deg
including data points (bull) forced fit (red) and fit with additional aggregate function (blue) with the
corresponding residuals resulting from the difference between data and the two fits 40
Figure 20 A) Angular dependency of the inverse hydrodynamic radii as well as ACF at Θ = 30deg including data
points (O) force fit (red) and fit including aggregate formation (blue) of PS in IgG and running buffer
as medium B) Angular dependency of the inverse hydrodynamic radii as well as ACF at Θ = 30deg
including data points (O) force fit (red) and fit including aggregate formation (blue) of PS in IgG and
PBS buffer as medium 44
Figure 21 A) Angular dependency of the inverse hydrodynamic radii as well as ACF at Θ = 30deg including data
points (O) force fit (red) and fit including aggregate formation (blue) of PS in HSA and running buffer
as medium B) Angular dependency of the inverse hydrodynamic radii as well as ACF at Θ = 30deg
including data points (O) force fit (red) and fit including aggregate formation (blue) of PS in HSA and
PBS buffer as medium 45
Figure 22 A) CD spectrum of IgG in PBS and running buffer at 37 degC with c = 1 gL B) CD spectrum of HSA in
PBS and running buffer at 37 degC with c = 1 gL 46
Figure 23 A) SDS-PAGE of protein coronas that were formed upon incubation of the different PS-particles in
concentrated human blood plasma B) Hard corona analysis by protein quantification and ζ-potential
measurement 47
Figure 24 Plasma composition in comparison to the hard corona composition of each particle analyzed via
LC-MS (LC-MS measurements performed by Johanna Simon) 48
Figure 25 A) Angular dependency of the inverse hydrodynamic radius of PS-COOH (bull) and centrifuged PS-
COOH (bull) B) Angular dependency of the inverse hydrodynamic of PS (bull) PS after incubation in human
plasma and one centrifugation step (bull) two (bull) three (bull) and four centrifugation steps (bull) 50
Figure 26 Flow cytometry analysis of RAW 2647 cells incubated with uncoated or pre-coated nanoparticles
for 2 h in DMEM without additional proteins Nanoparticles were pre-incubated with individual
proteins (A) or different protein fractions (B) separated from unbound proteins via centrifugation and
added to the cells with a nanoparticle concentration of 75 microgmL Relative median fluorescence
Contents V
intensity (rMFI) values are shown as mean plusmn SD of triplicates The red line serves as a reference for
cellular uptake of uncoated nanoparticles (rMFI = 1) A studentacutes t-test was performed to demonstrate
the difference in uptake behavior of uncoated and pre-coated nanoparticles (indicated by p values lt
001 or p lt 0001) (all cell experiments were performed by Johanna Simon) 51
Figure 27 cLSM images of RAW2647 cells after incubation with pre-coated nanoparticles for 2h in DMEM
without additional proteins Exemplary shown for PS pre-coated with HSA (A) PS-COOH pre-coated
with IgG (B) PS-NH2 pre-coated with IgG (C) Scale bars = 10 microm 52
Figure 28 Flow cytometry analysis of RAW 2647 cells incubated with nanoparticles pre-coated with varying
amounts of Ig depleted plasma for 2 h in DMEM without additional proteins Different pre-coating
ratios between the amount of proteins (in mg) and the defined surface of nanoparticles (510-3
m2)
were chosen The pre-coated nanoparticles were isolated via centrifugation and added to the cells
with a nanoparticle concentration of 75 microgmL Relative median fluorescence intensity (rMFI) values
are shown as mean plusmn SD of triplicates The red line serves as a reference for cellular uptake of
uncoated nanoparticles (rMFI = 1) A studentacutes t-test was performed to demonstrate the difference in
uptake behavior of uncoated and pre-coated nanoparticles (indicated by p values lt 001 or p lt
0001) (all cell experiments were performed by Johanna Simon) 53
Figure 29 Pre-coating of nanoparticles (Rh(cp)) with distinct low abundant protein fractions stabilizes
nanoparticles against aggregation in human plasma A) DLS analysis demonstrates aggregation
formation (Rh(agg)) of PS particles (Rh(p)) in human plasma ACF of PS particles in human plasma at Θ =
30deg is shown B) Pre-coating of PS particles with FPlasma-wo-IgG-HSA prevents the formation of aggregates
ACFs of the PS particles in isolated FPlasma-wo-IgG-HSA at Θ = 30deg is illustrated 55
Figure 30 A+B) Angular dependency of the inverse hydrodynamic radii as well as ACF at Θ = 30deg including
data points (bull) force fit (red) and fit including aggregate formation (blue) of naked as well as coated
PS particles in concentrated human plasma (comparable to in vivo conditions) 57
Figure 31 Protein patterns of formed hard coronas with single (S) as well as double incubation with
subsequent plasma incubation (D) of PS particles in A) IgG B) HSA C) FPlasma-wo-IgG and D) FPlasma-wo-IgG-
HSA 58
Figure 32 Autocorrelation function at Θ = 60deg of PS-COOH in FPlasma-wo-IgG including data points (bull) force fit
(red) and fit with aggregate formation (blue) From A to D the protein amount per surface area was
increased by a factor of 16 61
Figure 33 Size increase of PS-COOH in FPlasma-wo-IgG with increasing amount of proteins per given surface area
of nanomaterial The intensity contribution at Θ = 30deg to the overall scattered light of aggregates is
illustrated in green the one of particles in red 62
Figure 34 ACF at Θ = 30deg including data points force fit and fit with aggregation in concentrated human
plasma of A) PS-COOH B) PS-COOH coated with 1 mg FPlasma-wo-IgG C) PS-COOH coated with 2 mg
FPlasma-wo-IgG D) PS-COOH coated with 3 mg FPlasma-wo-IgG E) PS-COOH coated with 4 mg FPlasma-wo-IgG F)
Observed aggregated sizes in concentrated human plasma of samples A ndash E 65
Figure 35 Surface tension of a solution of FPlasma-wo-IgG in water in dependence to the protein concentration
68
VI Figure 36 Chemical structure of V59 (left) and V70 (right) 69
Figure 37 TEM images as well as DLS results of polystyrene with FPlasma-wo-IgG as stabilizer 70
Figure 38 Angular dependency of the inverse hydrodynamic radii as well as ACF at Θ = 30deg including
data points (O) force fit (red) and fit including aggregate formation (blue) of protein stabilized particle
in human blood plasma 70
Figure 39 A) CellTiter-Glo Assay of PS with proteins as surfactant B) CellTiter-Glo Assay of Lutensol
stabilized PS-particles (data in B provided by Johanna Simon) 71
Figure 40 SDS-PAGE of A) PS stabilized with FPlasma-wo-IgG B) plasma and C) FPlasma-wo-IgG 72
Figure 41 Angular dependency of the inverse hydrodynamic radii of A) PS-NH2 and B) the different protein
sources 75
Figure 42 Size increase of PS-NH2 in the respective protein sources (Θ = 30deg) 75
Figure 43 ACF at Θ = 30deg of PS-NH2 including data points (O) force fit (red) and fit regarding aggregate
formation (blue) in A) serum B) citrate plasma C) heparin plasma D) FBS + heparin and E) FBS D)
Aggregate sizes and intensity contribution at Θ = 30deg determined by DLS 76
Figure 44 Structure of A) Heparin- and B) Citrate-anion 77
Figure 45 A) Autocorrelation function of serum pool at scattering angle 30deg with the distribution of the
three different size fractions B) Fluctuation of the three different size fractions between different
probands 80
Figure 46 ACF at Θ = 30deg for serum P4 (red) P5 (blue) and pooled human serum (green) 81
Figure 47 ACF of PS-COOH in pooled human serum (left) and in serum P4 (right) at Θ = 30deg including data
points (bull) force fit (red) and fit including aggregate formation (blue) of protein stabilized particle in
human blood plasma 84
Figure 48 Protein patterns of the protein coronas formed on the different functionalized PS particles upon
incubation in the different protein sources 85
Figure 49 ACF of a respective coated particle in pooled human serum at Θ = 30deg including data points (bull)
and force fit (red) with A) PS coated in P4 B) PS-COOH coated in P4 C) PS-NH2 coated in P2 and D) PS-
NH2 coated in P7 86
Figure 50 Angular dependency of the inverse hydrodynamic radius of the particles itself (red) the
corresponding aggregates (blue) formed in pooled human serum (black) in comparison with the ones
of the coated particles (magenta) 87
Figure 51 Angular dependency of the inverse hydrodynamic radii as well as the z-averaged value obtained in
native human serum pool (A) and heat inactivated human serum pool (B) 91
Figure 52 ACF at Θ = 30deg of native human serum (black) and heat inactivated human serum (red) 91
Figure 53 SDS-PAGE of the different polystyrene particlesacute protein coronas formed upon incubation in
native human serum pool (A) as well as in heat inactivated human serum pool (B) (SDS-PAGE
performed by Johanna Simon) 92
Figure 54 Fluorescence at 350 nm determined by nanoDSF of fibrinogen (A) HSA (B) IgG (C) and clusterin
(C) in PBS (clusterin was measured by Julius Muumlller PhD student AK Landfester MPIP) 94
Contents VII Figure 55 Size increase of the polystyrene particles in native or heat inactivated human serum pool
obtained by DLS in comparison with the size increase in native human serum pool after coating with
inactive human serum pool 96
Figure 56 A) Size increase of PS-COOH in concentrated as well as diluted human serum obtained by DLS
together with the scattering intensity of particle or rather aggregate at Θ = 30deg B) Size increase of PS-
NH2 in concentrated as well as diluted human serum obtained by DLS together with the scattering
intensity of particle or rather aggregate at Θ = 30deg 98
Figure 57 ACF at Θ = 30deg of A) PS-COOH in serum pool as concentrated mixture B) PS-COOH in serum
pool as diluted mixture 12 C) PS-COOH in serum pool as diluted mixture 15 D) PS-NH2 in serum pool
as concentrated mixture and E) PS-NH2 in serum pool as diluted mixture 12 obtained by dynamic light
scattering D) Summary of determined aggregate radii and the corresponding size increase 99
Figure 58 Illustration of protein corona transfer 101
Figure 59 A) Angular dependency of the inverse hydrodynamic radius of PS-PEG5000 obtained by DLS B) ACF
at Θ = 30deg of PS-PEG5000 in concentrated human plasma including data points and force fit 103
Figure 60 A) SDS-PAGE of human plasma with subsequent silver staining (1) the protein corona formed on
PS-PEG5000 after incubation in human plasma with (2) and without (3) SDS the protein corona formed
on the second use of PS-PEG5000 after incubation in human plasma with (4) and without (5) SDS and
the protein corona formed on the third use of PS-PEG5000 after incubation in human plasma with (6)
and without (7) SDS B) Zeta potential of uncoated PS-PEG5000 as well as of the coated ones after first
and third use 105
Figure 61 A) Fluorescence at 350 nm determined by nanoDSF of ldquostealthrdquo proteins B) Fluorescence at 330
nm determined by nanoDSF and C) the 350330 nm ratio determined by nanoDSF 106
Figure 62 A) SDS-PAGE of human plasma (1) the protein corona of PS-NH2 formed in human plasma (2) the
protein corona of PS-NH2 formed in the ldquostealthrdquo proteins (3) and the ldquostealthrdquo proteins (4) B) Zeta
potential of uncoated PS-NH2 as well as of coated PS-NH2 with ldquostealthrdquo proteins 108
Figure 63 A) ACF at Θ = 30deg of PS-NH2 in concentrated human plasma including data points (O) force fit
(red) and fit with aggregate formation (blue) with the angular dependency of their inverse
hydrodynamic radii B) ACF at Θ = 30deg of coated PS-NH2 in concentrated human plasma with the
angular dependency of the obtained inverse hydrodynamic radii 109
Figure 64 Flow cytometry analysis of RAW 2647 cells incubated with nanoparticles 2 h in DMEM without
additional proteins The pre-coated nanoparticles were isolated via centrifugation and added to the
cells with a nanoparticle concentration of 20 microgmL Relative median fluorescence intensity (rMFI)
values are shown as mean plusmn SD of triplicates (cell experiments were performed by Johanna Simon)110
Figure 65 A) Fluctuation of the different size fractions for the different plasma sources B) The corresponding
ACF at Θ = 30deg C) Obtained values for the different size fractions from DLS 112
Figure 66 SDS-PAGE of human rabbit sheep and mouse plasma 113
Figure 67 A) Observed size increases in of the different PS-particles after exposure to human mouse
rabbit and sheep plasma B) Zeta potential of uncoated PS-particles as well as coated particles in the
different plasma sources under investigation 117
VIII Figure 68 A) SDS-PAGE of the protein coronas formed on PS PS-COOH and PS-NH2 during incubation in
human or mouse plasma B) SDS-PAGE of the protein coronas formed on the respective particles
during incubation in sheep or rabbit plasma 118
Figure 69 Schematic structure of BNF-Starch and BNF-Dextran 119
Figure 70 ACF at Θ = 30deg for BNF-DEX in human mouse sheep and rabbit plasma 120
Figure 71 ACF at Θ = 30deg for BNF-HES in human mouse sheep and rabbit plasma 121
Figure 72 A) SDS-PAGE of protein coronas formed on BNF-HES and ndashDEX during incubation in human
mouse sheep and rabbit plasma (performed by Johanna Simon) B) Zeta potential of uncoated as well
as coated particles in the different plasma sources under investigation 122
Figure 73 Molecular structures of the cholesterol-based amphiphilic lipid ananlogues Reprinted (adapted)
with permission from (ldquoEvaluation of Multifunctional Liposomes in Human Blood Serum by Light
Scatteringrdquo Mohr et al Langmuir 2014 30 14954-14962) Copyright copy 2014 American Chemical
Society 125
Figure 74 Cartoon of PEGylated liposomes Reprinted (adapted) with permission from (ldquoEvaluation of
Multifunctional Liposomes in Human Blood Serum by Light Scatteringrdquo Mohr et al Langmuir 2014 30
14954-14962) Copyright copy 2014 American Chemical Society 126
Figure 75 Cryo-Tem images of three different liposomes Reprinted (adapted) with permission from
(ldquoEvaluation of Multifunctional Liposomes in Human Blood Serum by Light Scatteringrdquo Mohr et al
Langmuir 2014 30 14954-14962) Copyright copy 2014 American Chemical Society (performed by
Kristiane Rusitzka Biology Department Johannes Gutenberg University Mainz) 128
Figure 76 Liposomes containing Ch-PEG44 in human serum A) L10-PEG B) L15-PEG C) L20-PEG and D) L30-
PEG ACF at Θ = 30deg including data points force fit (red) and aggregate fit (blue) Reprinted (adapted)
with permission from (ldquoEvaluation of Multifunctional Liposomes in Human Blood Serum by Light
Scatteringrdquo Mohr et al Langmuir 2014 30 14954-14962) Copyright copy 2014 American Chemical
Society (measurements performed by Dr Kristin Mohr Max Planck Institute for Polymer Research
Mainz) 129
Figure 77 Liposomes containing Ch-PEG33-hbPG23 in human serum A) L10-hbPG B) L15-hbPG C) L20-hbPG
and D) L30-hbPG ACF at Θ = 30deg including data points force fit (red) and aggregate fit (blue)
Reprinted (adapted) with permission from (ldquoEvaluation of Multifunctional Liposomes in Human Blood
Serum by Light Scatteringrdquo Mohr et al Langmuir 2014 30 14954-14962) Copyright copy 2014
American Chemical Society 130
Figure 78 Chemical structure of surfactant TF 131
Figure 79 A) 1H NMR of surfactant TF in CD3OD B) HPLC of dye cationic lipid TF and TF-dye conjugate MN-
HD8-column 12545microml T=20degC 10 min 595-1000 (THFwater+01TFA) (performed by Beate
Muumlller AK Landfester MPIP) 132
Figure 80 Cryo-TEM images of A) L-111 loaded with siRNA and B) unloaded L-114-hbPG (performed by Dr
Max Bernhard) 133
Figure 81 Angular dependency of the inverse hydrodynamic radius (A) and Guinier-plots (B) of liposomes
134
Contents IX Figure 82 Autocorrelation functions of the different liposomal systems in human serum at 30deg and the
respective aggregate size with its impact on the scattering intensity Red lines Force fit with the pure
component correlation blue lines Fit with an additional aggregate term Residues of the respective
fits are shown in the lower part of the graphs 136
Figure 83 A) Angular dependency of the inverse hydrodynamic radius of siRNA loaded liposomes B)
Guinier-plots of siRNA-loaded liposomes 137
Figure 84 Zeta potential of L-111 in comparison to the zeta potential of L-111 loaded with different types
of siRNA 138
Figure 85 Comparison of two different work-up procedures for L-111 138
Figure 86 Correlation functions (recorded 30deg scattering angle) of liposomes and siRNA loaded liposomes in
50 human plasma A) liposome consisting of DSPC Chol and lipid TF B) liposome in A loaded with
siRNA (NP = 34) C) liposome consisting of Chol DSPC TF and hb-PG D) liposome in C loaded with
siRNA (NP = 34) Red lines Force fit with the pure component correlation function blue lines Fit with
an additional aggregate ter Residues of the respective fits are shown in the lower part of the graphs
139
Figure 87 a) Viability of MHS macrophages in response to increasing amounts of L-114 lipoplex loaded with
scrambled siRNA normalized to PBS incubation time 24 h (n = 3) MEAN plusmn SD b) In vitro knockdown
by L-114 (NP) loaded with anti-CD68 siRNA after 24 h scsiRNA negative control p lt 005 (n =3)
MEAN plusmn SD (measurements performed by Leonard Kaps Medical department of the Johannes
Gutenberg University Mainz) 140
Figure 88 Top) In vivo knockdown outline Mice received two retroorbital injections of 1 or 2 anti-CD68
siRNA encapsulated in L-114 or L-114-hbPG in vivo imaging period indicated above timeline
Bottom) In vivo images system (IVIS) pictures of mice injected with 1 mgkg or 2 mgkg antiCD68
siRNA loaded in L-114 lipoplexes (left) or L-1-14-hbPG hbPG stabilized lipoplexe (right) labeled with
CW800 near infrared dye at 0 1 3 24 and 48h (measurements performed by Leonard Kaps) 142
Figure 89 Ex vivo organ quantification of L-114 lipolplex (blue) and L-1-14-hbPG (red) labeled with near
infrared dye 48 h after the second injection p lt 0001 MEAN plusmn SD (measurements performed by
Leonard Kaps) 143
Figure 90 IVIS pictures of ex vivo organs from mice that were injected with 1 mgkg or 2 mgkg antiCD68
siRNA loaded in L-114 or L-1-14-hbPG respectively labeled with near infrared dye 48h after injection
(measurements performed by Leonard Kaps) 144
Figure 91 In vivo liver resident macrophage uptake of L-114 lipoplex (blue) and L-1-14-hbPG lipoplex (red)
labeled with NIR dye 48 h after the second injection MEAN plusmn SD (measurements performed by
Leonard Kaps) 145
Figure 92 In vivo knockdown of the macrophage specific gene CD68 in the liver of mice that were injected
twice with 1 mgkg or 2 mgkg anti-CD68 siRNA loaded into L-114 (blue) or L-1-14-hbPG lipoplexe
(red) plt001 for anti-CD68 siRNA vs negative controls MEAN plusmn SD (measurements performed by
Leonard Kaps) 145
Figure 93 Synthesis of surfactant TF according to [153] 164
X LIST OF TABLES
Table 1 ρ-ratios and their corresponding geometry for macromolecules113
19
Table 2 Obtained protein fractions (c = 1 gL) with their hydrodynamic radius and composition according to
LC-MS 32
Table 3 Size changes of the uncoated nanoparticles after direct exposure to human plasma or the obtained
protein fractions was measured by DLS Size increase of nanoparticles incubated in the respective
protein fraction is calculated based on the size value for the uncoated nanoparticles measured in PBS
(Reference value Figure 15) 42
Table 4 Size changes of the uncoated nanoparticles after direct exposure to human plasma or the obtained
protein fractions was measured by DLS Size increase of nanoparticles incubated in the respective
protein fraction is calculated based on the size value for the uncoated nanoparticles measured in PBS
(Reference value Figure 15) 43
Table 5 Physiochemical parameters of nanoparticles pre-coated with different protein fractions or
individual proteins 49
Table 6 Size changes of pre-coated particles after direct exposure to human plasma Intensity fractions of
the aggregate I(30deg) are exemplified for a scattering angle of 30deg Size increase is calculated based on
the values for uncoated nanoparticles (see Figure 17) or pre-coated nanoparticles in PBS (see Table 5)
54
Table 7 Physicochemical parameters of coated PS-COOH particles in FPlasma-wo-IgG 64
Table 8 Top 20 identified proteins in the protein corona formed on PS-COOH particles after incubation in
concentrated human plasma (1) IgG-depleted plasma (2) and IgG-depleted plasma with subsequent
incubation in concentrated human plasma (3) determined via LC-MS (LC-MS measurements were
performed by Johanna Simon) 67
Table 9 Top 20 identified proteins in individual sera P2-P9 as well as serum pool determined via LC-MS (LC-
MS measurements were performed by Johanna Simon) 82
Table 10 Stability evaluation of the different polystyrene particles in the respective sera or serum pool (in
red) 83
Table 11 TOP 20 identified proteins of the protein coronas (values in ) formed on PS-COOH particles
after incubation with pooled human serum individual serum P4 and double incubation obtained by
LC-MS in douplicates A and B (LC-MS measurements performed by Johanna Simon) 88
Table 12 TOP 20 identified proteins of the protein coronas (values in ) formed on PS-NH2 nanoparticles
after incubation with pooled human serum individual serum P7 and double incubation obtained by
LC-MS in douplicates A and B (LC-MS measurements performed by Johanna Simon) 89
Table 13 TOP 20 identified proteins of the protein coronas (values in ) formed on PS-NH2 nanoparticles
after incubation with native pooled human serum (A) and heat inactivated human serum (B) obtained
by LC-MS (LC-MS measurements performed by Johanna Simon) 93
Table 14 Zeta potential of the different polystyrene particles without incubation and after incubation in
native or heat inactivated pooled human serum 95
Table 15 Physicochemical characterization of PS-NH2 (top) and purified PS-PEG5000 (bottom) 102
Contents XI Table 16 Top 20 identified proteins of the protein corona formed on PS-PEG5000 upon incubation in human
plasma (LC-MS measurement was performed by Johanna Simon) 104
Table 17 Top 20 identified proteins in human and mouse plasma (LC-MS measurement was performed by
Johanna Simon) 114
Table 18 Top 20 identified proteins in rabbit and sheep plasma (LC-MS measurement was performed by
Johanna Simon) 115
Table 19 Aggregate sizes formed in the different blood plasma sources obtained by DLS 120
Table 20 Different molar ratios used for the preparation of sterically stabilized liposomes with L =
liposomes Reprinted (adapted) with permission from (ldquoEvaluation of Multifunctional Liposomes in
Human Blood Serum by Light Scatteringrdquo Mohr et al Langmuir 2014 30 14954-14962) Copyright copy
2014 American Chemical Society 126
Table 21 Summary of the z-averaged hydrodynamic radii of all investigated liposomes Reprinted (adapted)
with permission from (ldquoEvaluation of Multifunctional Liposomes in Human Blood Serum by Light
Scatteringrdquo Mohr et al Langmuir 2014 30 14954-14962) Copyright copy 2014 American Chemical
Society 127
Table 22 Composition of investigated liposomes 132
Table 23 Zeta potential DLS- and SLS-results of liposomes 134
Table 24 Zeta potential DLS - SLS results and encapsulated amount of siRNA of loaded liposomes 137
XII
Abstract 1
1 ABSTRACT
The development of nanomaterials for biomedical application has become of great
interest in the last decades Especially in cancer therapy the encapsulation of drugs in a
carrier provides many advantages over administering active ingredients only The
nanomaterials are designed to guide the anti-cancer drug specifically to the tumor tissue
This way the cytotoxic side effects that occur during chemotherapy can be reduced In
addition the active compound itself can be protected from degradation
But still the application of nanomaterials in cancer treatment is limited due to some
drawbacks in understanding and foreseeing the physiological responses a nanocarrier
induces upon administration So far nanocarriers are usually applied intravenously This
means that the carrier system immediately comes into contact with the human blood and
the therein dissolved proteins This results in the rapid formation of a protein corona on
the nanomaterialacutes surface that alters its chemical and physical properties in a significant
manner
In this study the influence of single proteins as well as protein mixtures on the
physicochemical properties of polystyrene particles as a model system is investigated The
single proteins as well as protein mixtures that are exempted from the most abundant
proteins albumin and immunoglobulin G were obtained from the fractionation of human
blood plasma Incubation of the respective particles in defined protein fractions was used
to form predetermined protein coronas that were further investigated in regards of
stabilizing or destabilizing effects on a particle under in vivo conditions using dynamic light
scattering In addition the effect of a given protein corona on cellular uptake by
macrophages was monitored This way the possibility of stabilizing particles against
aggregation via pre-coating was introduced
The concept of pre-coating nanomaterials for tailoring their stability against aggregation
was broadened in order to overcome the difficulties that occur because of a fluctuation in
the blood serum proteome composition among different individuals
2 Next the focus was put on the transferability of different in vivo animal models to
humans It turned out that the stability of polystyrene as well as dextran- and starch-
coated particles against aggregation strongly depends on the protein source
After screening the mentioned factors that influence the protein corona formation by the
use of polystyrene particles as a model system liposomes for siRNA delivery to the liver
have been investigated and optimized regarding their stability against aggregation
In summary the closer look that is taken on the different factors that influence the
physicochemical properties of a nanomaterial after exposure to human blood offers
several opportunities of pre-in vivo screening methods for novel nanomaterials In
addition it introduces possible ways of how the interactions between nanomaterials and
proteins can be used for stabilization against aggregation
Introduction 3
2 INTRODUCTION
In the last decades designing nanomaterials for biomedical applications has become of
great interest1 These systems are designed for specific targeting of for example tumor
cells and by this reduce cytotoxic side-effects2 So far most drug delivery systems are
given parenterally meaning intramuscular or intravenously2 In consequence
nanomaterials come into contact with biological media like cytosol or blood and interact
with present proteins and cells
21 BLOOD
Blood also ldquoliquid tissuerdquo has the main task of ensuring the functionality of different
body-tissues by transporting oxygen and nutrients It consists of 45 cellular components
and 55 blood plasma The cellular fraction contains erythrocytes for oxygen transport
leucocytes for immune defense and thrombocytes as part of blood coagulation The liquid
blood fraction plasma contains numerous proteins3 4 In order to recover plasma from
blood an anti-coagulant has to be added in order to prevent the blood from clotting As
anti-coagulants ethylene diamine tetra acetic acid (EDTA) heparin or citrate come into
operation5 The cellular fraction can afterwards be removed via centrifugation The
effectiveness of EDTA and citrate is based on complexation of ions that are needed for
enzymes as part of the coagulation process Heparin on the other hand activates anti-
thrombin and by this inhibits the coagulation cascade When the blood is allowed to clot
prior to centrifugation human blood serum is obtained as liquid fraction5 In
consequence proteins that are part of the coagulation process are removed during
centrifugation
The overall concentration of proteins in human blood plasma is about 60-80 gL The two
most abundant proteins namely human serum albumin (HSA) and immunoglobulin G
(IgG) count about ~75 of the overall protein amount The composition of the human
plasma proteome is illustrated in Figure 1 Albumin which belongs to the class of globular
proteins is the highest abundant plasma protein with 606 Its molecular weight is
4 66 kDa and the structure is predominantly alpha-helical7 The main function of albumin is
the maintenance of the colloid-osmotic pressure
Figure 1 The human plasma proteome8
IgG makes up about 16 of the overall plasma proteome It is like albumin a globular
protein9 with a molecular weight of 150 kDa6 that belongs to the class of anti-bodies In
general anti-bodies are built up of two heavy and two light chains Immunoglobulins
comprise five classes (IgG IgA IgM IgD IgE) They are distinguished by their type of heavy
chain IgG can bind to a specific antigen and by this mark material that is foreign to the
body With this the protein plays an important role in the activation of the immune
system
α2-Macroglobulin haptoglobulin and α1-antitrypsin belong to the protein class of the
acute phase These proteins are synthesized in an increased manner upon injury10
Introduction 5 Fibrinogen which also plays an important role in the hemostatic process is part of the
coagulation process of blood11 Clotting occurs when the protein is converted to fibrin by
thrombin12
Apolipoprotein A-I and A-II belong to the class of lipoproteins Lipoproteins are aggregates
that are build-up of proteins lipids and cholesterol Their main function is the transport of
lipids According to their density lipoproteins can be divided in chylomicrons high density
lipoprotein (HDL) intermediate density lipoproteins (IDL) low density lipoprotein (LDL)
and very low density lipoprotein (VLDL)13
22 NANOMATERIALS AS DRUG DELIVERY SYSTEMS
Nanoparticles (NPs) for biomedical applications are a very promising and exciting research
field Especially when it comes to cancer treatment the idea of incorporating drugs into
nano-sized drug carriers is very attractive since the so far used chemotherapeutics cause
several cytotoxic side-effects On the one hand the encapsulation of drugs offers the
opportunity of targeting to the desired cells and by this increasing the mentioned
specificity On the other hand the loading of drugs into nanomaterials protects the drug
itself from degradation
In general two mechanisms for guiding a nanoparticle to the desired body tissue are
possible The first one relies on the so-called enhanced permeability and retention (EPR)
effect14 15 The basis of this passive mechanism is a defect of architecture in most tumor
blood vessels16 This results in an enhanced permeability for oxygen and nutrients but in
addition offers the possibility of transporting macromolecules into the tumor tissue with
subsequent accumulation The second possible guiding strategy is a form of active
targeting Targeting moieties such as antibodies are conjugated to the drug delivery
systems in order to increase the effectiveness17
6
Figure 2 Passive18 (1) versus active (2) targeting The defect architecture of tumor tissue allows the penetration with nutrients and macromolecules By conjugating antibodies to macromolecules the accumulation can be increased by specific antibody-receptor interactions on the surface of tumor cells Figure 2 (1) Reprinted from Advanced Drug Delivery Reviews Volume 65 Issue 1 Hirashi Maeda Hideaki Nakamura Jun Fang ldquoThe EPR effect for macromolecular drug delivery to solid tumors Improvement of tumor uptake lowering of systemic toxicity and distinct tumor imaging in vivordquo Pages 71-79 Copyright copy (2012) with permission from Elsevier Elsevier
A variety of nano-particular systems are investigated for cancer therapy They include
polymeric nanoparticles19 liposomes20 21 metallic core nanoparticles22 23 dendrimers24
polymeric micelles25-27 and viral nanoparticles28 Each system bears several advantages
but also limitations Liposomes are a very prominent strategy to incorporate siRNA for
delivery and are therefore discussed in detail within this introduction22
221 LIPOSOMES FOR SIRNA DELIVERY
This chapter has already been published and is reprinted from Biochemical and
Biophysical Research Communications Volume 468 Issue 3 Laura K Muumlller Katharina
Landfester ldquoNatural liposomes and synthetic polymeric structures for biomedical
applicationsrdquo Pages 411-418 Copyright copy (2015) with permission from Elsevier29
Since the discovery of RNA interference (RNAi) as novel therapeutic strategy for gene
silencing by Fire et al in 199830 and Elbashir et al in 200131 32 the development of
suitable carrier systems for (synthetic) siRNA targeted towards specific disease relevant
Introduction 7 genes became of great interest Despite their high efficiency for siRNA delivery viral
vectors are limited in application due to possible inflammatory and immunogenic
responses33 Therefore the design of novel non-viral delivery strategies is a rapidly
growing field Among them the direct chemical modification of siRNA34 as well as loading
the cargo into carrier systems such as nanoparticles have been widely studied Polymeric
nanoparticles consisting of biodegradable or biocompatible polymers like chitosan have
been successfully used for the delivery of siRNA into the lungs of mice in order to silence
GAPDH or EGFP35 36 Another approach for the development of non-viral siRNA delivery
vectors is inspired by naturally occurring structures such as eukaryotic membranes
Systems based on self-assembled structures out of amphiphilic molecules are the most
prominent and well-studied siRNA carriers37
An important example for such amphiphilic molecules are natural occurring lipids38 Up to
a certain concentration these lipids are soluble on a molecular level in water but above a
critical concentration aggregates are formed39 In order to minimize the repelling
interactions with water the hydrophobic tails cluster together while the hydrophilic heads
repel each other due to sterical and electrostatical hindrance This way three dimensional
assembled structures like micelles bilayers or vesicles are formed (Figure 3b)40
If composed of (phospho-)lipids (Figure 3a) the latter ones are also usually called
liposomes41-43 and can be both single-component systems and multi-component systems
which means that other molecules like for example cholesterol are also incorporated This
is also the case for the natural cell membrane where cholesterol plays an important role
for the membranes viscosity according to the fluid mosaic model from Singer and
Nicholson44
8 a)
b) c)
Figure 3 a) Schematic structure of left) phosphoglycerides and right) sphingophospholipids with the polar head (orange) and the apolar tail (blue) b) schematic 3D structure of self-assembled lipids with A) micelle B) bilayer and C) vesicle c) PEG modification of liposomes with high density (left) and low density (right) reprinted from
Biochemical and Biophysical Research Communications Volume 468 Issue 3 Laura K Muumlller Katharina Landfester ldquoNatural liposomes and synthetic polymeric structures for biomedical applicationsrdquo Pages 411-418 Copyright copy (2015) with permission from Elsevier
Due to their structure shown in Figure 3b liposomes allow the encapsulation of a high
variety of drugs such as hydrophilic (inside the core) hydrophobic (in the hydrophobic
part of the membrane) as well as amphiphilic molecules (as part of the membrane) The
loading of siRNA cargo into ldquoman-maderdquo liposomes is a very prominent strategy22 due to
the biocompatibility of the constituents and the simple preparation by only mixing the
different components ldquoLipoplexesrdquo which are formed due to electrostatic interactions
between positively charged lipids and the negatively charged siRNA20 were identified to
enhance the efficiency of siRNA delivery in contrast to using naked siRNA45 Numerous
studies on cationic lipidic vectors have been reported46 among them 1-oleoyl-2-[6-[(7-
nitro-2-13-benzoxadiazol-4-yl)amino[hexanoyl]-3-trimethylammonium propane
Introduction 9 (DOTAP)47 or N-[1-(2 3-dioleyloxy)propyl]-NNN-trimethylammonium chloride
(DOTMA)48 A major drawback of using cationic lipids is the potential undesired
interaction with negatively charged serum proteins as well as possible inflammation
response49-51 The addition of cholesterol or other neutral lipids such as distearoyl
phosphatidylcholine (DSPC)52 to lipoplexes in order to form multi-component liposomes is
a successful method to overcome the above mentioned problems53 54 In addition
cholesterol offers the opportunity of simple modification strategies with for example
ligands Another approach to circumvent the described drawbacks is the surface
modification of liposomes with poly(ethylene glycol) (PEG) (see Figure 2c)55 The
conformation of PEG on a liposomesacute surface is dependent on many factors such as
density of the grafted polymer mirroring the available space the polymer chains can
capture56 In case of low grafting density each PEG chain has enough space to be in
coiled-structures but when the grafting density is increased the chains are forced to
elongate due to the steric hindrance between two chains In the presence of this highly
biocompatible polymer reduced aggregation as well as prolonged blood circulation time
of liposomes was obtained57-59 The so-called ldquostealth-liposomesrdquo60 already found their
way into clinical use61 62 The most prominent and commercially available among them is
DoxilTM which is a liposomal formulation with doxorubicin (DOX) as drug for anticancer
treatment63 64 Doxorubicin belongs to the group of anthracylines that have an
antineoplastic effect but also cause several side effects like for example cardiotoxicity65
Encapsulation of DOX in liposomes was found to reduce the drug accumulation in heart
and to increase its localization in tumor cells66 The latter feature was contributed mainly
to the prolonged half-life in blood circulation of the PEGylated liposomal system66 67
According to the fact that neutral lipids and PEG-modified ones are limited in electrostatic
interactions with siRNA the formulation of more complex systems needs a little more
effort than just mixing the components Among the several approaches the lipid film
method is the most prominent one in order to synthesize highly PEGylated liposomes37 In
principle a dried thin lipid film with all liposomal components is dissolved with a
concentrated siRNA solution68 Downsizing and size-control can further be done by
sonication69-71 or by extrusion through a polycarbonate membrane with defined pore
sizes72
10 The synthesis of lipids often requires multiple steps and several purification methods73
Therefore Langer and Anderson developed a new class of ldquolipidoidsrdquo74 which are lipid-like
materials that can be synthesized rapidly A combinatorial library was provided and the
new components screened in animal models regarding efficiency and safety for siRNA
delivery By this a formulation was identified that allows low-dose gene silencing in the
liver of mice52 According to Langer and Anderson the advantage of low-dose gene-
silencing would be the reduced amount of carrier material injected intravenously or the
possibility of multiple gene-silencing with only one intravenous administration within the
tolerability of the carrier materials It was shown that simultaneous silencing of five
hepatocellular gene targets in C57BL6 mice is possible The fact that low-dose gene-
silencing could also be achieved in non-human primates (Cynomolgus monkeys) paves the
way for safe and effective siRNA delivery52 In recent studies the lipid-like materials were
advanced to co-deliver siRNA and pDNA for the combined application of gene silencing
and expression75 135-Triazinine-246-trione (TNT) lipid derivatives were identified that
encapsulated more than 99 of siRNA as well as pDNA Injection of luciferase pDNA and
Tie2 siRNA in C57BL6 mice resulted in simultaneous gene expression and silencing This
could be of great interest for future treatment of diseases that are related to the
disordered function of several genes
An approach towards understanding and ranking the efficiency of lipid-based siRNA
delivery systems was made by Zhang et al who developed an in vitro assay that is based
on the delivery pathway liposomal systems are believed to undergo after intravenous
injection76 including distribution cell uptake ending in endosomes and siRNA release The
different stages in vivo were mimicked by for example incubating the lipidic systems with
anionic liposomes mirroring endosomal escape and the amount of released siRNA was
quantified It turned out that with increasing amount of anionic liposome add-on to the
cationic liposomes under investigation the siRNA release was increased drastically at
pH=6 (mimicking endosomal environment) whereas the siRNA release only slightly
increased at pH=7576 16 liposomal systems were investigated with the introduced in vitro
assay regarding the siRNA release The percentage of siRNA release out of the different
liposomal systems after incubation in rat serum correlated nicely with the effectiveness of
the respective system regarding the in vivo knockdown of ApoB at mRNA level in Sprague-
Introduction 11 Dawley female rats offering the possibility of identifying promising systems prior to in
vivo evaluation
The interaction of cationic liposomes for siRNA delivery with anionic liposomes at
physiological pH points towards a well-known problem of liposomal drug delivery in
general The composition of the lipid shell varies due to interactions and exchange with
other lipids This phenomenon is originated in the highly dynamic equilibrium between
lipids in solution and lipids incorporated in the designed liposomes as well as the high
similarity of the designed liposomes to naturally occurring systems like for example LDL
and HDL also containing for instance cholesterol
Effort towards solving this and enhancing the stability of the described delivery systems
was taken by Aigner and coworkers who combined liposomal systems with polymers in
order to design ldquolipopolyplexesrdquo for DNA or siRNA delivery77
23 PROTEIN CORONA
Many approaches have been made towards the use of nanoparticles for biomedical
applications The synthetic identity of a nanomaterial designed in the lab plays an
important role when it comes to the cellular uptake of the system Lerch et al
investigated the correlation between the size of NPs and the effectiveness of overcoming
the cell membrane barrier78 But also the materialacutes shape79 as well as surface charge80
influence the cellular uptake
As already mentioned most drug delivery systems are applied intravenously This means
that they come into contact with blood and its components in the first place As soon as a
nanoparticle enters the blood stream it is rapidly covered with surrounding proteins that
adsorb onto the materialacutes surface This protein layer is called protein corona and it has
become more and more clear that it defines the biological identity of a given material
significantly81-85
The transformation of a nanomaterialacutes chemical identity into its biological identity is
illustrated in Figure 4
12
Figure 4 Chemical versus biological identity of a nanomaterial after intravenous injection86 Adapted from ldquoWalkey C D Chan W C Understanding and controlling the interaction of nanomaterials with proteins in a physiological environment Chem Soc Rev 2012 41 2780-2799rdquo with permission of The Royal Society of Chemistry
The protein corona can be divided up into two parts the so-called ldquohardrdquo and ldquosoftrdquo
corona87 Both differ in the binding strength of proteins and thus their exchange times
between the adsorbed and dissolved state88 High abundance proteins adsorb onto a
nanomaterialacutes surface rapidly due to their availability But it is already known that those
proteins are more and more replaced by proteins with a higher affinity This effect is
known in literature as Vroman effect who studied the subsequent replacement of
fibrinogen by other proteins on flat surfaces89 90
Introduction 13 The change from flat surfaces towards curved surfaces as in the case for nanoparticles
leads also to changes in protein interactions91 Cedervall et al investigated the adsorption
of HSA on N-isopropylacrylamideN-tert-butylacrylaminde copolymer nanoparticles with
different sizes representing different surface curvatures92 It turned out that the
equilibrium association constant of HSA is independent of the nanoparticlesacute size but the
amount of protein that is needed to reach saturation differs in relation to the particle size
and with this the surface curvature The more hydrophobic surface is available for protein
interactions the number of bound protein molecules increases
As a nanomaterial is body-foreign material macrophages as part of the immune system
play a critical role in the blood circulation time of the carrier system Proteins within a
nanomaterialacutes protein corona that enhance the uptake of the reticuloendothelial system
are referred to as ldquoopsoninsrdquo93 94 One example for opsonins is IgG Lunov et al showed
that IgG-adsorption onto polystyrene particles (PS) initiates phagocytosis by human
macrophages95 HSA and apolipoproteins on the other hand are often referred to as
dysopsonins that enhance the circulation time of a nano carrier96
The type of interactions between nanoparticles and proteins can be electrostatic as well
as hydrophobic Roser et al investigated the interactions of surface-modified albumin
spheres with human serum in regards of phagocytosis and bio-distribution97 With this a
direct correlation of surface charge and protein adsorption was shown But more and
more it became clear that the main driving forces for protein adsorption are hydrophobic
interactions In general hydrophobic particles show increased protein coverage compared
to hydrophilic particles98 99
It is already known that the adsorption of proteins on a nanomaterials surfaces can
induce conformal changes100 With this their enzymatic activity can be lost101 or binding
sites for other proteins can be hidden Norde et al monitored the structural changes of
bovine serum albumin (BSA) between the adsorbed and dissolved state102 Structural
changes of the protein during adsorption on hydrophilic silica particles haven been found
to be reversible meaning it regained its native structure when dissolved again On the
other hand the adsorption of BSA onto hydrophobic polystyrene nanoparticles has been
found to be irreversible leading to changes in the secondary structure of the respective
protein
14 The proteins present in biological fluids are in consequence of enzymatic or chemical
reactions glycosylated in high amounts This means that carbohydrates are covalently
attached to them Recently Wan et al analyzed the role of glycans present in a protein
corona on nanoparticle-cell interactions103 The removal of carbohydrates from a given
protein corona was found to increase cell membrane adhesion as well as cell uptake of
SiO2 NPs
As already mentioned particle size and surface charge influence a nanomaterialacutes body-
distribution and cellular uptake The adsorption of proteins leads to an increase in size and
a coverage of initial particle surface charge Thus it is obvious that the protein
composition on a NP strongly influences its body-distribution Taken this together with the
concept of opsonization many efforts have been made towards surface modification of
nanomaterials in order to reduce protein adsorption
231 THE STEALTH EFFECT
The surface modification with protein repellent substances is a wide-spread method in
order to decrease the degree of opsonization and to increase the time in blood-circulation
of nanoparticles As opsonization and adsorption of proteins is increased on hydrophobic
nanomaterials hydrophilic molecules have been used for modification The most
prominent example is poly (ethylene glycol) (PEG) By PEGylation a nanomaterial is
masked against rapid immunological responses104 The resulting materials are therefore
also termed ldquostealthrdquo materials105 The modification can be done either by covalently
attaching PEG or also by adsorption of polymer chains onto the nanomaterialacutes surface106
As already described for liposomes the degree or surface density of PEG has
consequences on its 3D structure and with this also on protein corona formation104 With
increasing density of PEG chains the protein adsorption was found to be reduced but not
completely prevented
Schoumlttler et al recently showed that the presence of distinct proteins within the protein
corona of stealth materials is even required and necessary in order to prevent un-specific
cellular uptake of nanomaterials107 Clusterin which is also termed apolipoprotein J was
Introduction 15 identified to play a major role in the stealth effect PEGylated stealth particles were found
to be taken up by macrophages in similar range as non-PEGylated particles when no
proteins were present Only in the presence of plasma the unwanted uptake of stealth
materials could be completely inhibited while the non-PEGylated control-particles
showed no significant change in cellular uptake behavior This opens new possibilities
when it comes to surface modification of nanomaterials Not only the attachment of
polymers but also the modification with specific proteins could be promising candidates
in order to make ldquostealthrdquo materials
Figure 5 Protein adsorption on stealth-materials (right) is reduced in comparison to non-modified NPs (left)
24 PROTEIN CORONA ANALYSIS
Due to the fact that the protein corona can be divided up into the soft and the hard
corona which differ in the binding strength of present proteins the analysis of protein-
particle interactions strongly depends on prior sample preparation108
In general the protein corona formation is usually carried out by introducing a certain
surface area of nanomaterial into a respective protein source like human blood plasma or
serum After incubation some methods like isothermal titration calorimetry (ITC)
dynamic light scattering (DLS) or asymmetric flow ndash field flow fractionation (AF-FFF) are
suitable methods to analyze the soft corona as no washing steps are needed prior to
16 analysis On the other hand methods like liquid chromatography-mass spectrometry (LC-
MS) SDS polyacrylamide gel electrophoresis (SDS-PAGE) or protein quantification within
the corona require the removal of unbound proteins This can either be done by
centrifugation of the particle protein mixture or by separation via a magnetic field The
latter one is limited to magnetic particles Depending on the binding strength of proteins
within the corona the shear forces applied for separation of unbound proteins lead also
to a removal of weakly bound proteins of the soft corona and with this to an altering of
corona composition This is illustrated in Figure 6
Figure 6 Soft vs hard corona obtained by the removal of free proteins using for instance
centrifugation or magnetic separation
241 IN SITU ANALYSIS
2411 ISOTHERMANL TITRATION CALORIMETRY
Isothermal titration calorimetry is a technique that monitors heat changes that occur
during adsorption of proteins on a nanomaterials surface109 110 In principle two
measurement cells are isolated by a mantle in order to keep the temperature constant
One cell the measurement cell is equipped with one component like the nanomaterial
under investigation while the second cell serves as reference cell The temperature of
both cells is kept constant during the whole measurement When a second component
under investigation like a protein solution is added stepwise in the measurement cell a
Introduction 17 temperature change occurs in case there is some interaction between both components
This temperature change can be detected and adjusted ITC is a method that therefore
allows to determine binding thermodynamics between proteins and nanomaterials
2412 FIELD FLOW FRACTIONATION
Asymmetric flow ndash field flow fractionation (AF-FFF) is a chromatography like technique
This method is suitable for the separation and size determination of polymers and colloids
in solution In principle a laminar flow is applied between two parallel plates in a thin
channel This leads to a parabolic flow profile Is now a cross flow applied that acts
perpendicular to this flow particles or molecules introduced into the channel are pushed
against the so called accumulation wall This leads to a higher local concentration of
particles at the wall and thus induces diffusion of particles in the opposite direction
According to their diffusion coefficients particles with different sizes are located with
different distances from the accumulation wall and can therefore be separated
Tsai et al used AF-FFF together with complementary techniques in order to investigate
the adsorption and conformation of bovine serum albumin (BSA) on gold nanoparticles
(AuNP) Here the method was applied in order to fractionate possible agglomerates after
BSA and AuNP conjugation The size-determination of every fraction could be correlated
with results obtained from dynamic light scattering111
2413 DYNAMIC LIGHT SCATTERING
As dynamic light scattering (DLS) is an often used method within this work it will be
described in more detail
Dynamic light scattering in general is a method that determines the size of a given species
by using the diffusion of molecules in solution At each scattering angle during the
measurement a given scattering volume is under investigation Due to the already
mentioned diffusion of molecules they diffuse in and out of the observation volume This
18 leads to a fluctuation in scattering intensity over time which is the detected measurand
An auto-correlator converts the signal into an autocorrelation function (ACF) of scattering
intensity
1198922(119902 119905) =lt119868(119902119905)119868(119902119905+120591)gt
lt119868(119902119905)2gt (1)
I(qt) is the time dependent scattering intensity that gets multiplied with the scattering
intensity I(qt+ τ ) that is shifted by the time τ With the Siegert equation112 that gives the
relation between equation (1) and the experimentally measurable field autocorrelation
function g1(qt) equation (2) is valid for a given scattering vector q
1198921(119905) = radic1198922(119905)minus119860
119860 (2)
In equation (2) A describes the experimentally determined baseline For monodisperse
particles the autocorrelation function g2(qt) can be described as a simple exponential
decay
1198922(119902 119905) = 119860 times 119890(minus1199022119863119905) (3)
The diffusion coefficient D is related to the inverse correlation time Γ
120548 = 1
120591= 1199022119863 (4)
For disperse samples an averaged diffusion coefficient is determined that is dependent
on the scattering angle q Therefore the true value has to be calculated by extrapolating
q 0 With the use of the Stokes-Einstein equation the z-averaged hydrodynamic radius
Rh can be obtained from the extrapolated diffusion coefficient Dz
lt1
119877ℎgt119911
minus1=119896119879
6120587120578119863119911 (5)
When the temperature T and the solventacutes viscosity η are known the hydrodynamic
radius can be obtained The ratio of radius of gyration obtained from static light scattering
Introduction 19 and the hydrodynamic radius obtained from dynamic light scattering gives information
about the geometry of the system under investigation
120588 =radiclt119877119892
2gt119911
lt1
119877ℎgt119911
minus1 (6)
Table 1 sums up the geometry for different ρ-ratios
Table 1 ρ-ratios and their corresponding geometry for macromolecules113
ρ-ratio geometry
0778 Homogeneous sphere
100 Monodisperse vesicle
150 Monodisperse Gaussian coil Θ condition
178 Monodisperse Gaussian coil in good solvent
173 Polydisperse Gaussian coil Θ condition
205 Polydisperse Gaussian coil in good solvent
gt2 Rigid rod
24131 LIGHT SCATTERING OF MULTICOMPONENT SYSTEMS
In this work the software HDRC was used for the evaluation of dynamic light scattering
data obtained from multicomponent analysis The software from Oliver Nirschl1 uses the
1 Oliver Nirschl Diploma Student of Professor Dr Manfred Schmidt Mainz 2007
20 simplex algorithm (downhill-simplex) in order to describe non-linear functions that
depend on several parameters
HDRC was used in this work in order to evaluate light scattering data from a mixture that
contains two components namely nanoparticles and proteins in form of serumplasma
Data were evaluated by applying the method according to Rausch et al114 Briefly the
autocorrelation function of the particles under investigation can be described by a sum of
two exponentials (7) whereas the autocorrelation function (ACF) in the case of human
plasmaserum can be perfectly fitted by a sum of three exponentials (8) with the
amplitude ai the Brownian diffusion coefficient Di and the decay times ti=1(q2Di)
1198921119899119901(119905) = 1198861119899119901 lowast exp (minus119905
1205911119899119901) + 1198862119899119901 lowast exp (minus
119905
1205912119899119901) (7)
1198921p(119905) = 1198861p lowast exp (minus119905
1205911p) + 1198862p lowast exp (minus
119905
1205912p) + 1198863p lowast exp (minus
119905
τ3p) (8)
If the ACF of human plasma or the protein mixture (8) and the one of the respective
particle (1) are known the mixture of both can be studied If no aggregation occurs both
components in the resulting mixture co-exist and the corresponding ACF can be described
as the sum of the two individual ACFs with known parameters for the two mixture-
components (9) named as force fit
1198921m(119905) = 119891p1198921p(119905) + 119891np1198921np(119905) (9)
fp represents the intensity contribution of plasmaprotein mixture while fnp describes the
one of the nanoparticle If the interactions of plasma proteins with particles result in
larger sizes the resulting mixture can no longer be described as a co-existence of the
individual compounds and an additional term to describe the ACF (10) is needed with the
intensity contribution fagg of the newly formed species within the mixture under
investigation and the unknown relaxation t1agg (11)
1198921m(119905) = 119891p1198921p(119905) + 119891np1198921np(119905) + 119891agg1198921agg(119905) (10)
g1agg = a1agg lowast exp (minust
τ1agg) (11)
Introduction 21 The above described method was first introduced by Rausch et al in 2010114 In 2014 a
work was presented that correlates the results obtained from dynamic light scattering
with the in vivo body distribution of polystyrene nanoparticles in mice115 Nanoparticles
that formed aggregates accumulated in the liver of mice while stable particles with no
significant size increase were distributed over the whole mice body due to their blood
circulation
2414 FLUORESCENT CORRELATION SPECTROSCOPY
Fluorescent correlation spectroscopy (FCS)116 is in principal very similar to DLS but in
contrast the intensity fluctuation of a fluorescence signal is detected Roumlcker et al used
this technique in order to analyze the adsorption of HSA on small polymer-coated
nanoparticles117 The limitation of this method is obvious While with dynamic light
scattering every species within a mixture can be detected FCS only observes fluorescence
labelled species
242 HARD CORONA ANALYSIS
The methods described in the following have the requirement of removing unbound
proteins and can therefore not be performed in situ Thus only the hard corona with
strongly bound proteins is under investigation
For analysis the proteins have to be detached from the particle surface via add-on of
anionic detergents like sodium dodecyl sulfate (SDS) urea or thiourea
The amount of proteins present in a nanomaterialacutes hard corona can be determined
afterwards by using assays that are based on calorimetric quantification like the BCA
protein assay The assay is based on the protein quantification with bichinonic acid (BCA)
and is a combination of biuret reaction and complexation of copper (l) ions with BCA118
The BCA complex has an adsorption maximum at 562 nm and can therefore be used for
protein quantification as its amount is directly proportional to a present protein amount
22
2421 SDS POLYACRYLAMIDE GEL ELECTROPHORESIS
A first idea of the composition of a protein corona under investigation can be obtained by
using SDS polyacrylamide gel electrophoresis (SDS-PAGE) The method is based on the
separation of proteins according to their molecular weight when an electrical field is
applied To ensure the separation of proteins only according to their molecular weight
other factors that may interfere have to be reduced Therefore the tertiary structure of
proteins is destroyed prior to analyzing them via gel-electrophoresis This is done by the
adding of SDS119 and a reducing agent for the reduction of disulphide bonds In addition
SDS guarantees the coverage of protein charges resulting in a negative charge that is
directly proportional to the peptide chain length The denaturated proteins are deposited
onto a polyacrylamide gel When voltage is applied the proteins migrate through the gel
in the direction of the anode according to their negative charge The gel acts like a filter
allowing small molecules to diffuse faster than big molecules
After the successful separation of proteins the protein pattern that has been formed on
the gel can be visualized by different staining procedures The most common ones are the
silver staining and the staining with Commassie brilliant blue
The drawback of the described method is the limited resolution Proteins with similar
molecular weights co-migrate through the gel and can therefore not be separated That
makes it very difficult to identify single proteins Nevertheless it is a suitable method for
the comparison of different protein patterns
In order to increase the separating capacity the SDS-gel electrophoresis can be done in
two dimensions120 or extended to western blotting But the most powerful tool to identify
proteins within a certain corona so far is the combination of liquid chromatography with
mass spectrometry
2422 LIQUID CHROMATOGRAPHY-MASS SPECTROMETRY
As already said this method is a combination of liquid chromatography (LC) and mass
spectrometry (MS) Prior to analysis the proteins need to be digested into smaller
Introduction 23 fragments This can be done by adding the protein trypsin121 The peptide-mixture can
afterwards be separated in a first step by liquid chromatography This chromatography
method is based on the dissolving of analytes in a liquid phase The liquid phase
afterwards passes a stationary phase that can either be hydrophilic or hydrophobic
(reversed phase) The separation principle is based on the adjustment of an equilibrium in
interactions of the analytes with both mobile and stationary phase The analytes are
therefore separated according to their hydrophobic or rather hydrophilic character After
a first separation the analytes in this case peptide fractions can be transferred into a
mass-spectrometer for further separation Mass spectrometry is a powerful tool in order
to separate analytes according to their mass to charge ratio This indicates that the
analytes have to be ionized prior to separation For proteins the electro-spray ionization
(ESI) is a widely used method as it is a suitable tool to ionize macromolecules In principle
a solution of analytes passes a capillary on whose end an electric field is applied Ions
within the analyte solution are attracted by the counter-electrode A so-called Tylor-cone
forms at the end of the capillary in which ions repel each other Due to the repulsion an
aerosol of ions in solvent is formed While the solvent evaporates the droplets are scaled
down which again leads to repulsion between single ions within one droplet This leads to
a decay into smaller droplets At the end of the cascade single ions are obtained in the
gas phase that can afterwards be analyzed according to their mass to charge ratio There
are different types of analyzers like a time of flight (TOF) analyzer or a quadrupole The
first one accelerates ions by an electric field of known strength This acceleration results in
the same kinetic energy for ions with the same charge The velocity of the ions depend on
the mass-to-charge ratio meaning that the time a particle needs to reach the detector
gives the mass to charge ratio of the ion when the experimental parameters like distance
are known Quadrupoles consists of four rod-electrodes that are ordered parallel while
each opposing rod pair is connected together electrically In addition a superimposed
high frequency alternating current voltage is applied leading ions to travel down the
quadrupole between the rods Only ions with a specific mass to charge ratio can reach the
detector as the trajectory of every other mz-ratio is unstable and thus the ions collidate
with the electrodes By varying the potentials of the electrodes and the superimposed
high frequency alternating current voltage the ions are consecutively guided through the
quadrupole according to their mass to charge ratio The combination of three quadrupoles
in series allows the detection of MSMS spectra which means that ions that are
24 separated in a first quadrupole can be fragmented further on and again be separated
according to their mass to charge ratio with the third quadrupole The second
quadrupoles serves for the fragmentation When the third quadrupole is replaced by a
TOF analyzer the system is called Q-TOF and is part of the setup that was used to perform
LC-MS measurements shown in this work
The detected mass to charge ratios can be compared to a database that allows the
identification of distinct proteins or protein fragments
Tenzer et al used label-free quantitative LC-MS in order to obtain time-resolved profiles
of corona formation on silica and polystyrene nanoparticles122 Nanoparticle-specific
coronas were found to form rapidly that change only in the amount of adsorbed protein
but not in the protein composition
LC-MS also allowed the already mentioned determination of distinct proteins that play a
critical role in the stealth effect107
2423 ZETA-POTENTIAL
The zeta potential or electric potential of a diffusing particle in solution mirrors the
surface charge of the respective particle under investigation and can thus also provide
information about possible protein adsorption
When charged particles are in solution ions with the opposite charge present in the
suspension medium attach at the particlesacute surface Further ions arrange loosely around
the first ion layer and form a diffuse layer When an electrical field is applied the particles
will move according to their charge Ions in the diffuse layer are sheared off building up a
potential that is called zeta potential ζ Under similar conditions the zeta potential can be
used as measurand for a particleacutes surface potential 1 mM potassium chloride solution is
usually used as suspension medium When an electrical field is applied ions in suspension
diffuse according to their charge while the diffusion speed is depending on the particle
size The so-called electrophoretic mobility can be transferred into the zeta potential by
using the Smoluchowsky123 equation
Introduction 25
119906119864 = 41205871205760 times119863120577
4120587120578=
120576120577
120578 (12)
Here uE stands for the electrophoretic mobility η for the viscosity ε for the dielectric
constant and D for the diffusion coefficient
As the majority of the plasma proteins is negatively charged the adsorption of proteins
onto a nanomaterialacutes surface results in a change of the zetapotential to negative values
even if the particle itself is positively charged124 For example Baier et al monitored the
BSA adsorption on differentially charged polystyrene nanoparticles via zeta potential
measurements125
25 AIM OF THIS WORK
The aim of this work is to get a better understanding of nanoparticle protein interactions
and how these interactions can be useful for further biomedical applications Therefore
single proteins as well as low abundant protein mixture were obtained by the
fractionation of human plasma Their influence on nanoparticle stability and effect on
cellular uptake was investigated By the combination of dynamic light scattering under in
vivo conditions and the protein identification via LC-MS single proteins could be
identified that play a role in protein corona formation and stabilization of respective
particles under investigation against aggregation Critical steps in the evaluation of novel
nanomaterials for biomedical application like the universal validation of protein corona
studies when examining single probands as well as the transfer from in vivo animal models
to humans were investigated
In general protein particle interactions are very complex and depend on many factors
Therefore studies are often based on phenomenological observations while a
physicochemical description remains difficult In this work the analysis of protein induced
aggregation of nanoparticles using dynamic light scattering is also based on
phenomenological studies The process of observed aggregation can involve nanoparticle
bridging the adsorption of proteins and protein-protein aggregates on the nanomaterialacutes
surface By combining dynamic light scattering with fluorescent correlation spectroscopy
26 one basic approach towards understanding the processes involved in protein induced
aggregation of nanoparticles was made
Results and Discussion 27
3 RESULTS AND DISCUSSION
The results part of this work is divided up into seven parts After presenting the different
protein mixtures that were obtained by fractionation of human plasma the interactions of
the respective protein fractions with polystyrene particles as model system were
investigated Afterwards a short overview of the impact of different protein sources like
human blood serum or plasma on pre-in vivo studies is given In the fourth and fifth
chapter the difference in blood serum composition of individual probands as well as the
protein composition of the corona of stealth materials were utilized for particle
stabilization against aggregation In chapter six the transferability of different in vivo
models on humans is discussed In the last section the model system of polystyrene
particles is changed towards the investigation of multifunctional liposomes for biomedical
applications
31 FRACTIONATION OF HUMAN BLOOD PLASMA
As already described in the introduction human serum albumin and IgG are very
abundant in human plasma Thus these proteins adsorb onto an introduced
nanomaterialacutes surface in the first place But over time the proteins are replaced by
proteins with higher affinities The interactions of low abundant proteins with
nanoparticles are therefore of great interest in order to get a better understanding of
protein corona formation and particle stability under physiological conditions Plasma
fractionation is a widely used process to enrich specific components from human plasma
like IgG and was utilized in this work in order to deplete human blood plasma from the
two most abundant proteins Highly complex protein mixtures with various low abundant
proteins were created and could be used for the investigation of particle-protein
interactions As already defined in the introduction the human blood proteome can be
either obtained as plasma or serum depending on the preparation method In contrast to
serum plasma contains also the proteins that are part of the coagulation process As the
low abundant proteins play a major role in this study human blood plasma stabilized with
citrate (and not serum) was chosen for the fractionation A detailed study on the different
protein sources for pre-in vivo studies will be given in chapter 33
28 In this work three different columns were used for the isolation of single proteins as well
as various low abundant protein mixtures in order to investigate their influence on protein
nanomaterial interactions Two of them are based on affinity chromatography and were
used for most questions discussed in further chapters The third one is predicated on
anion-exchange chromatography
For the separation of IgG a ToyoSreen AF-rProtein A HC-650F column was used The
column consists of a resin with immobilized Protein A that binds to the heavy chain of IgG
This way IgG similar proteins and IgG-bound proteins are retained while the other ones
flow through the column By the addition of citric acid the interactions of IgG and Protein
A are disrupted and IgG can be eluted from the column Figure 7 shows the chromatogram
of the IgG separation from human plasma According to protein quantification via BCA
Assay 93 of the total amount of injected proteins could be recovered 15 of the total
eluted amount consists of IgG
sample Concentration gL Amount mg Amount
injection 22 11 100
Flow Through 57 86 78
IgG 17 17 15
Figure 7 Chromatogram of IgG separation via Protein A column and the corresponding
protein amount in the fractions according to a BCA Assay
0 5 10 15
00
05
10
15
20
25
ab
so
rba
nce
t min
flow through
IgG elution
Results and Discussion 29 The efficiency of IgG removal was investigated via LC-MS and SDS-PAGE Figure 8 shows
the according results
Figure 8 A) Protein patterns obtained by SDS-PAGE of plasma and the protein fractions obtained by Protein A affinity chromatography with FT1 = flow through Protein A column B) LC-MS analysis of the respective protein fractions (LC-MS measurements performed by Dr Susanne Schoumlttler)
LC-MS data confirmed that an IgG protein fraction was obtained that consists of more
than 94 immunoglobulins The remaining plasma protein mixture contained only about
6 IgG showing a good separating capacity of the Protein A column A comprehensive list
of the LC-MS data will be presented in the supplementary information
By applying a ToyoScreen AF-Blue HC-650M column human serum albumin (HSA) could
be isolated The columnacutes resin exhibits covalently attached Cibacron Blue F3GA dye on its
surface as shown in Figure 9
Figure 9 Chemical structure of Cibacron Blue
30 HSA has a strong binding affinity to the dye that is caused by hydrophobic and
electrostatic interactions Therefore high concentrations of salt are required to detach
the protein126 This was done by the addition of 2 M sodium chloride solution Figure 10
shows the chromatogram of HSA separation
sample Concentration gL Amount mg Amount
injection 57 57
Flow Through 06 13 99
HSA 18 36 56
calculated from the total protein amount in plasma not from the injection
Figure 10 Chromatogram of HSA separation via AffiGel-Blue column and the
corresponding protein amount in the fractions according to a BCA Assay
Again the efficiency of HSA-removal was monitored by applying SDS-PAGE and LC-MS
Figure 11 shows the results The flow through protein fraction contained only 4 of HSA
When looking at the corresponding albumin elution fraction it turned out that it consists
of immunoglobulins and albumin in comparable amounts This phenomenon is already
well-known in literature describing that Cibacron Blue F3GA also has a strong affinity to
IgG and other plasma components126 127
0 5 10 15 20 25 30 35
00
05
10
15
20
25
abso
rba
nce
t min
flow through
albumin elution
Results and Discussion 31 In order to increase the purity of isolated HSA both chromatography techniques were
combined meaning that IgG and HSA removal columns were connected in series (step by
step) This way the amount of Albumin could be increased up to 84 A detailed overview
of LC-MS data is provided in the supplementary information According to protein
quantification via a BCA assay the total HSA amount recovered by the series connection
was 56 of the total protein amount which is in good agreement with literature values
(HSA amount in plasma ~60)6
Figure 11 A) Protein patterns obtained by SDS-PAGE of plasma and the protein fractions obtained by series connection of Protein A affinity chromatography and AffiGel Blue affinity chromatography with FT1 = flow through Protein A column and FT2 = FT1 with subsequent HSA removal B) LC-MS analysis of the respective protein fractions with FT = flow through AffiGel Blue column (LC-MS measurements performed by Dr Susanne Schoumlttler)
The resulting protein fractions were further on characterized with dynamic light scattering
(DLS) in order to determine their hydrodynamic radius lt1Rhgtz-1 In order to simplify the
description and to distinguish them from commercially available proteins the enriched
fractions of isolated proteinsprotein mixtures are named as FProtein whereas the plasma
fractions depleted from certain proteins are denominated as FPlasma-wo-Protein Table 2
summarizes the DLS results
32 Table 2 Obtained protein fractions (c = 1 gL) with their hydrodynamic radius and composition according to LC-MS
Fraction Protein Hydrodynamic radius
FIgG 942 Ig 056 HSA
524 others
lt1Rhgtz-1
= 68 nm
FHSA 8414 HSA 358 Ig
1228 others
lt1Rhgtz-1
= 31 nm
FHSAIgG 4739 HSA 346 Ig
1801 others
lt1Rhgtz-1
= 37 nm
FPlasma-wo-IgG 5692 HSA 587 Ig
185 Fibrinogen 3536 others
lt1Rhgtz-1
= 76 nm
FPlasma-wo-HSA 408 HSA
277 Ig
451 Serotransferin
1338 alpha1-antitrypsin
033 others
lt1Rhgtz-1
= 76 nm
FPlasma-wo-IgG-HSA
154 Haptoglobulin
147 α-1-antitrypsin
123 Serotransferrin
79 α-2-macroglobulin
lt1Rhgtz-1
= 79 nm
c = 06 gL
For IgG a hydrodynamic radius of lt1Rhgtz-1 = 68 nm was found whereas for albumin a
value of lt1Rhgtz-1 = 31 nm was found Both values are in good agreement with the
literature128 For example Rausch et al reported a z-averaged hydrodynamic radius for
albumin (c = 062 gL in DPBS) of lt1Rhgtz-1 = 36 nm129 As FHSAIgG presents a mixture of
both proteins it is obvious that the detected hydrodynamic radius has to be within the
range of the already mentioned radii with a measured value of lt1Rhgtz-1 = 37 nm Figure
12A shows the corresponding angular dependency of the inverse hydrodynamic radii of
each protein fraction In general the detected values are very small This effect can be
traced back to the low protein concentration compared to concentrated plasma When
plasma is diluted 160 the z-averaged hydrodynamic radius decreases from lt1Rhgtz-1 = 19
nm to lt1Rhgtz-1 = 11 nm Also for the individual size fractions Rh1 Rh2 and Rh3 trends can
be observed While the smallest size fraction remains constant in the range of ~ 3 nm the
values for Rh2 and Rh3 are halved upon dilution Another indication that the small values
are only based on dilution and not on removal of bigger protein species during
fractionation is shown in Figure 12B Figure 12B shows the autocorrelation function of
Results and Discussion 33 FPlasma-wo-IgG-HAS and the intensity contribution of the different observed size fractions at a
scattering angle of Θ = 30deg Three fractions were detected Among them the biggest
protein fraction with a radius of Rh3 = 82 nm was present
Figure 12 A) Angular dependency of the inverse hydrodynamic radii of the different protein fractions B) ACF of FPlasma-wo-HSA-IgG with the distribution of the 3 different size fractions at Θ = 30deg
As mentioned in the beginning of this chapter a third type of column was used to perform
human blood plasma fractionation namely ToyoScreen DEAE-650M This column consists
of an immobilized methacrylate matrix with di-ethyl amino groups on its surface that are
positively charged The mostly negatively charged plasma proteins bind to that resin and
can be successively eluted by increasing the ionic strength of the running buffer Again
sodium chloride with different concentrations between 0155-1 M was used Figure 13
shows the resulting chromatogram of anion exchange chromatography
To make sure that nearly all proteins bind to the resin the initial flow through was
reinjected two times Protein quantification confirmed that nearly no remaining protein
could be detected in the flow through afterwards The four elution fractions were
analyzed by LC-MS and SDS-PAGE The results are shown in Figure 14
34
Figure 13 Chromatogram of DEAE anion exchange chromatography
What comes first into mind when looking at both LC-MS data as well as SDS-PAGE (see
Figure 13) is the absence of HSA (in yellow) in elution fraction 1 All other fractions
contain the high abundance protein This underlines the already mentioned fact that a
high ionic strength is needed to overcome the strong binding affinity of the HSA
As a next step all three columns were connected in series meaning sequential removal of
IgG and HSA followed by anion exchange chromatography resulting in very low protein
concentrations in each fraction The success of the overall series connection was
monitored by using SDS-PAGE shown in Figure 15 The SDS-PAGE shows the good
enrichment of single proteins in the elution of IgG and albumin as well as the
corresponding change in relative band intensities in the separation of E1-E4
In conclusion by applying Protein A and AffiGel-Blue affinity chromatography it was
possible to enrich the single proteins FIgG and FHSA with good purity In addition the three
low abundant protein mixtures FPlasma-wo-IgG FPlasma-wo-HSA and FPlasma-wo-IgG-HSA could be
obtained As a second tool for fractionation DEAE anion exchange chromatography was
used to obtain four elution fractions E1-4 Those protein fractions were used for further
investigations on protein-nanoparticle interactions
0 20 40
0
1
2
abso
rban
ce
t min
flow
through
recirculate
E1
E2
E3
E4
Results and Discussion 35
Figure 14 LC-MS analysis of elution fraction 1 ndash 4 (LC-MS performed by Dr Susanne Schoumlttler AK Landfester Max Planck Institute for Polymer Research Mainz 2015) and SDS-PAGE of the respective protein fractions
Figure 15 SDS-PAGE of series connection of Protein A column AffiGel Blue column and DEAE column with FT1-3 = flow through after each column and E1-4 elution fraction 1-4 of DEAE column
36
32 FRACTIONS OF PROTEIN MIXTURES DIFFERENTIALLY AGGREGATE
NANOPARTICLES AND INFLUENCE THE CELLULAR UPTAKE
The formation of a protein corona on a nanomaterialacutes surface is a highly complex process
that is influenced by various factors such as size shape and charge of the nanomaterial In
addition the protein source itself namely blood plasma is very complex and contains
thousands of different proteins Especially the influence of the low abundant proteins on
particle stability and corona formation is of great interest since the high abundant
proteins are partly replaced by them over time upon blood exposure on the surface of
nanomaterials By depletion of HSA and IgG various low abundant protein mixtures could
be obtained and their composition could be determined precisely by using LC-MS as
shown in the previous chapter By introducing nanoparticles into the defined protein
mixtures a monitoring of the effects on particle stability and of the changes in
physicochemical parameters was possible This way the overall process of nanomaterial-
plasma interactions could be fragmented into low abundant and high abundant protein
interactions with a nanomaterial A closer look and deeper understanding of the processes
involved in the protein corona formation could be addressed by this means As already
known in the literature124 and described in the introduction the coating of nanoparticles
in single commercially available proteins can alter the nanomaterialacutes properties With
respect to their influence on the particle stability the protein fractions here could be used
for that approach as well As benefit the fractionation of human plasma into protein
fractions could possibly be performed from the patientacutes own plasma and used as
precoating of the nanocarriers ex vivo The overall procedure therefore qualified as pre-in
vivo screening method for nanomaterials designed for biomedical applications and the
directed adjustment of carrier properties
The different obtained protein fractions were used to investigate the stability of
polystyrene nanoparticles against aggregation using DLS The protein fractions were
further applied to form a predetermined protein corona on differently functionalized
polystyrene nanoparticles (PS) DLS was also used to investigate the stability of the
protein-coated nanoparticles when re-introduced into human plasma In addition the
influence of the artificially created protein corona on cellular uptake of nanomaterials was
studied Cell experiments were carried out by Johanna Simon (Max Planck Institute for
Results and Discussion 37 Polymer Research Mainz) LC-MS measurements were done either by Johanna Simon or
Dr Susanne Schoumlttler
321 THE PARTICLES UNDER INVESTIGATION
Three differently functionalized polystyrene particles were synthesized via direct
miniemulsion copolymerization as already described in literature125 namely without
surface modification (PS) and with amino (PS-NH2) or carboxy-functionalization (PS-
COOH) For stabilization of the different particle dispersions Lutensol AT50 was used as a
non-ionic surfactant Figure 16 shows the angular dependency of the inverse
hydrodynamic radii of the three particles under investigation obtained by DLS and Figure
17 summarizes the physicochemical parameters of the different particles regarding
hydrodynamic radius (Rh) determined by DLS charge obtained by ζ-potential
measurements and number of surface groups per NP quantified by particle charge
titration
Figure 16 Angular dependency of the inverse hydrodynamic radii of PS PS-COOH and PS-NH2 obtained by DLS
00 01 02 03 04 05 06
0010
0015
0020
0025 PS
PS-COOH
PS-NH2
q210E10cm-2
1R
h n
m
38 The 1 mM KCl solution used for zeta potential determination has an approximately neutral
pH Under these conditions the carboxy-groups of PS-COOH are deprotonated resulting in
the detected negative charge while the amine groups in PS-NH2 are extensively
protonated and thus positively charged
Figure 17 TEM images and physicochemical characterization of polystyrene nanoparticles with different surface functionalization
322 SOFT PROTEIN CORONA ANALYSIS
With DLS it was possible to directly monitor the size increase of nanoparticles in the
respective protein fractionsfull plasma The data were evaluated by applying the method
according to Rausch et al114 that was already described in the introduction It has to be
noted that the additional size formed in the respective mixture can be either caused by
nanoparticle bridging the adsorption of proteins or protein-protein aggregates on the
nanomaterialacutes surface
Prior to experiments with the different protein fractions the effect of the protein amount
in relation to a given surface area of NPs on the aggregation behavior of the different
polystyrene particles was monitored using different dilutions of the plasma The surface
area of particles introduced into a given volume of plasmadilution was kept constant at
Results and Discussion 39 5x10⁻⁴ m2 resulting in different ratios of surface area per mg protein The results are
summarized in Figure 18
Figure 18 Size increase of respective PS-particles in dependence of the protein amount
The aggregation behavior in the range between 01 and 12 mg plasma proteins in relation
to the given surface area was comparable Only for very high amounts and thus
concentrations of proteins the size increased dramatically In order to be able to compare
with low abundant proteins a low amount of proteins (1 mg) for the given surface area
was chosen for all experiments with the isolated protein fractions Similar particles have
already been under investigation in a likewise approach by Mohr et al who investigated
the aggregation behavior in concentrated human serum and diluted human serum by a
factor of ten But in contrast to the work presented here the amount of particles was also
reduced by a factor of ten115 Therefore and because of the use of serum instead of
plasma trends can be compared but not the absolute results of the DLS measurements
For the study presented here human plasma was the protein source of choice because of
the great importance of the low abundant proteins (see also page 27) Mohr et al
determined the size increase of non-functionalized PS and PS-NH2 particles to be
independent of the protein concentration while the aggregate formation of PS-COOH
particles was strongly dependent on the surrounding serum concentration115 The results
presented here show a similar trend While the size increase of PS and PS-NH2 particles
was found to be moderate with increasing protein concentration the size of PS-COOH
particles increased significant with increasing protein concentration
40 In Figure 19 the autocorrelation functions (ACFs) of a mixture of the respective PS-particle
and FPlasma-wo-IgG-HSA (A) or concentrated human plasma (B) are shown exemplarily where
g1(t) is the field correlation function and res the residuum between the fits and data
Measurements were performed at 37 degC for better in vivo mimicking The force fit
(indicated by the red line Figure 19A) could perfectly describe the ACF of the mixture of
nanoparticles and FPlasma-wo-IgG-HSA In contrast an additional aggregate fraction (indicated
by the blue line Figure 19B) was observed for the particles and plasma Smaller scattering
angles like eg 30deg or 60deg are more sensitive for the detection of a small amount of
formed bigger species within a mixture under investigation compared to bigger scattering
angles Therefore these angles give the best information about aggregation 30deg
measurements are the most sensitive ones and the corresponding intensity contribution
(I) and ACFs are therefore shown in this work with favor But 30deg measurements are also
most prone to artefacts Thus 60deg data are sometimes shown instead of 30deg ACFs
Figure 19 A) ACFs of the different particles in isolated FPlasma-wo-IgG-HSA at Θ = 60deg including data points (bull) and the forced fit as the sum of the individual components (red) with the corresponding residuals resulting from the difference between data and fit B) ACFs of the different particles in human plasma at Θ = 60deg including data points (bull) forced fit (red) and fit with additional aggregate function (blue) with the corresponding residuals resulting from the difference between data and the two fits
Results and Discussion 41 Table 3 gives an overview of the DLS results of all uncoated particles after direct exposure
to the different protein fractions obtained by affinity chromatography In addition
measurements were also performed in human plasma and commercially available
proteins in buffer IgG was purchased from privigenreg as solution for infusion with a purity
98 The hydrodynamic radius in running buffer was determined to be lt1Rhgtz-1 = 55 nm
which is in good agreement with the value for FIgG (lt1Rhgtz-1 = 68 nm) The small deviation
can be related to the small amount of other ingredients like eg L-prolin Human serum
albumin was purchased from sigma as lyophilized powder with a purity of gt99 With DLS
the radius in the running buffer was determined to be of lt1Rhgtz-1 = 57 nm Small
aggregates were observed that explain the slightly bigger value compared to FHSA (of
lt1Rhgtz-1 = 31 nm) Human plasma was used undiluted in order to be as close as possible
to in vivo conditions
First of all it was noted that all uncoated particles aggregated in human plasma A size
increase with values between Rh(Agg) = 174 nm and Rh(Agg) = 292 nm was measured
Next it was found that the non-functionalized polystyrene particle changes its size in
nearly every protein fraction In contrast the amino-functionalized particle remained
stable except in the presence of IgG This is significant considering that the hard corona
formed around these two nanoparticles in human plasma is very similar as shown in
Figure 20 Therefore the relevant protein probably is part of the soft corona which can so
far only be studied with DLS The absence of a detected size increase does therefore also
not mean that there is no corona present It just cannot be detected due to the sensitivity
of the methods It is only possible to detect additional sizes in the plasma particle
mixture if the intensity fractions (i e amplitudes) of the newly formed complexes surpass
the detection limit for DLS In detail intensity fractions between 3 (for sizes outside the
size range of the original components) and 20 (for sizes in the size range of the original
components) of newly formed particles are necessary to be detected by the described
fitting procedure
42 Table 3 Size changes of the uncoated nanoparticles after direct exposure to human plasma or the obtained protein fractions was measured by DLS Size increase of nanoparticles incubated in the respective protein fraction is calculated based on the size value for the uncoated nanoparticles measured in PBS (Reference value Figure 15)
Concentrated human plasma for in vivo mimicking
For completeness the same procedure was done for the different protein fractions
obtained via anion exchange chromatography Table 4 summarizes the results
Whereas PS-COOH is the only particle that shows no significant size increase in
commercially available HSA it is now the only particle showing a significant increase in
elution E1 that is lacking of HSA This indicates that HSA has some stabilizing effect on PS-
COOH when it comes to aggregation In general the size increases are moderate in the
different elution fractions The sole exception is the non-functionalized polystyrene
particle that shows aggregation behavior in E2 and E3 Both protein fractions are
dominated by albumin which correlates with the observed size increase of PS in FHSA as
well as commercially available HSA in buffer
Results and Discussion 43 Table 4 Size changes of the uncoated nanoparticles after direct exposure to human plasma or the obtained protein fractions was measured by DLS Size increase of nanoparticles incubated in the respective protein fraction is calculated based on the size value for the uncoated nanoparticles measured in PBS (Reference value Figure 15)
In order to monitor the reproducibility or rather the sensitivity of the applied method the
aggregation behavior of the different PS-particles was investigated in a solution of
commercially available albumin as well as IgG in two different solutions On the one hand
the proteins were dissolved in PBS buffer and on the other hand in running buffer as it is
the case for the protein fractions obtained from chromatography Figure 20 exemplarily
shows the results for non-functionalized polystyrene after exposure to IgG
44
Figure 20 A) Angular dependency of the inverse hydrodynamic radii as well as ACF at Θ = 30deg including data points (O) force fit (red) and fit including aggregate formation (blue) of PS in IgG and running buffer as medium B) Angular dependency of the inverse hydrodynamic radii as well as ACF at Θ = 30deg including data points (O) force fit (red) and fit including aggregate formation (blue) of PS in IgG and PBS buffer as medium
Figure 20A shows the angular dependency of the observed hydrodynamic radii as well as
the ACF at a scattering angle of 30deg including data points force fit and fit including
aggregate formation of PS in IgG and running buffer as the medium whereas Figure 20B
shows the corresponding results for PBS as medium under investigation In both cases
aggregates were formed in the size range between 312 and 326 nm in diameter For
human serum albumin in running buffer and PBS also comparable results were obtained
while aggregates in the size range between 352 and 374 nm in diameter were detected
(Figure 21)
Results and Discussion 45
Figure 21 A) Angular dependency of the inverse hydrodynamic radii as well as ACF at Θ = 30deg including data points (O) force fit (red) and fit including aggregate formation (blue) of PS in HSA and running buffer as medium B) Angular dependency of the inverse hydrodynamic radii as well as ACF at Θ = 30deg including data points (O) force fit (red) and fit including aggregate formation (blue) of PS in HSA and PBS buffer as medium
Additionally both proteins were analyzed with circular dichroism (CD) spectroscopy in PBS
as well as running buffer Again no significant change for the different solutions could be
observed The resulting spectra are shown in Figure 22 and are in good agreement with
spectra reported in literature7 9 130 Therefor it can be assumed that both proteins have a
similar secondary structure in both buffers under investigation
46
Figure 22 A) CD spectrum of IgG in PBS and running buffer at 37 degC with c = 1 gL B) CD spectrum of HSA in PBS and running buffer at 37 degC with c = 1 gL
323 HARD PROTEIN CORONA ANALYSIS
To study the hard protein corona the nanoparticles were incubated in human plasma
Particles in complex with proteins were separated from free protein via centrifugation and
redispersed in PBS Zeta potentials the amount of adsorbed protein and the hard protein
corona pattern were analyzed
In agreement with results found in literature124 the surface charge indicated by the zeta-
potential after the incubation in human plasma is the same for all functionalization types
in the range between ζ = - (32-38) mV whereas prior to incubation differences related to
the surface functionalization were measured The change in the detected zeta potentials
to negative values in a similar range makes clear why the different PS particles show
similar aggregation behavior in concentrated human plasma independent of their surface
functionalization When the nanomaterial is introduced into plasma the surface is
covered with proteins and the initial surface charge masked by the protein corona The
amount of bound proteins after incubation in human plasma was quantified via a Pierce
660 nm assay Interestingly the hard corona of all particles formed after exposure to
human plasma contains nearly the same amount of proteins for all particles in the range
between ~ 275 and 326 microg proteins per 005 m2 particle surface area (Figure 23) but
when analyzing the formed hard protein corona profile via SDS-PAGE the differences
between the particles becomes apparent (Figure 23) While the protein pattern of PS and
PS-NH2 are very similar the one of PS-COOH differs a lot The same phenomenon was
Results and Discussion 47 observed via LC-MS and is shown in Figure 24 A detailed list of data is given in the
supplementary information
Figure 23 A) SDS-PAGE of protein coronas that were formed upon incubation of the different PS-particles in concentrated human blood plasma B) Hard corona analysis by protein quantification and ζ-potential measurement
Based on the LC-MS data single protein bands in the patterns obtained from SDS-PAGE
could be related to specific proteins For PS and PS-NH2 nanoparticles intense bands at
~ 38 kDa belonging to clusterin ~ 28 kDa corresponding to apolipoprotein A-I and ~ 9 kDa
corresponding to apolipoprotein C3 can be seen in Figure 21 For PS-COOH nanoparticles
the protein bands at ~ 64 kDa and ~ 47 kDa can be related to the alpha and beta chains of
fibrinogen The two bands at lower molecular ranges at ~ 28 kDa and ~ 9 kDa also
correspond to the already mentioned proteins apolipoprotein A-I and C3
LC-MS data confirmed that the protein coronas formed on PS and PS-NH2 nanoparticles
contain mostly clusterin and apolipoproteins A-I and A-IV that can be summarized
altogether as lipoproteins PS-COOH particles on the other hand also adsorbed a lot of
fibrinogen on its surface upon incubation that is part of the coagulation proteins
illustrated in red in Figure 24 These results are again in good agreement with the
obtained results from Mohr et al after incubation of the already mentioned related
particles in human serum For PS and PS-NH2 particles the reported protein coronas are
48 also very similar and contain mostly lipoproteins while the profile of PS-COOH particles
after serum incubation differs and contains also a high amount of coagulation proteins115
To sum up despite somehow similar formed hard coronas on PS and PS-NH2 the stability
of both in the respective protein mixtures differ a lot This leads to the assumption that
the proteins leading to significant size increases are only present in the soft corona In
addition the masking of particle surface charge by mostly negative plasma proteins
explains the similar aggregation behavior of all particles in concentrated human plasma
Figure 24 Plasma composition in comparison to the hard corona composition of each particle analyzed via LC-MS (LC-MS measurements performed by Johanna Simon)
324 TAILORING THE HARD CORONA
The so far discussed polystyrene particles were modified by coating their surface with the
obtained protein fractions from affinity chromatography This way a predetermined
protein corona was created that will further on be related to as the so called ldquoartificial
protein coronardquo Nanoparticles were incubated with different protein fractions or
individual proteins for 1 h at 37 degC (5x10⁻³ m2 overall surface area mg protein)
Results and Discussion 49 Afterwards unbound and weakly bound proteins were removed via centrifugation The
resulting pre-coated nanoparticles were characterized regarding their zeta potential as
well as their size (Table 5)
Table 5 Physiochemical parameters of nanoparticles pre-coated with different protein fractions or individual proteins
Table 5 shows the resulting size increase of the different PS particles as well as the zeta
potential upon coating with the different protein fractions While the coating in HSA and
the low abundant protein mixtures FPlasma-wo-IgG-HSA and FPlasma-wo-IgG leads to no significant
size increase compared to the values of the uncoated ones (Figure 17) the coating with
HSA-depleted plasma and IgG resulted in slight or distinct increases in the particle size For
example PS-COOH particles formed species with Rh = 374 nm after incubation with IgG
The detected size increases can either be caused by protein adsorption only but also by
forming aggregates upon coating The small size increases can be assumed to be caused
by protein adsorption only In addition the overall negative zeta potentials indicate that
proteins are present on all nanoparticles after coating In order to exclude the influence of
centrifugation on the particle size after redispersion PS-COOH was exemplarily
centrifuged without prior incubation It turned out that the radius of PS-COOH remains
constant within the error margin of DLS (see also Figure 25A) In addition the effect of
centrifugation on the particle stability after incubation with proteins (in this case human
serum) was investigated using DLS After one centrifugation step non-functionalized PS
50 remained stable mirrored by the slope of the angular dependency of the inverse
hydrodynamic radii (see Figure 25B) A size increase of ~ 20 nm (radius) originated in the
formed protein layer was detected But already after the second centrifugation step the
particles precipitated during the DLS measurement indicated by the negative slope of the
angular dependency of the inverse hydrodynamic radii The redispersion after the fourth
centrifugation step was difficult and already formed aggregates bigger species
sedimented The sample taken for DLS is therefore not representative and explains why
the data points are shifted to smaller radii again (but very broad)
Figure 25 A) Angular dependency of the inverse hydrodynamic radius of PS-COOH (bull) and centrifuged PS-COOH (bull) B) Angular dependency of the inverse hydrodynamic of PS (bull) PS after incubation in human plasma and one centrifugation step (bull) two (bull) three (bull) and four centrifugation steps (bull)
According to the above described DLS results the PS particles in Table 5 were only
centrifuged once after incubation in the different protein fractions Those pre-coated
nanoparticles were used to investigate the stability of an ldquoartificial protein coronardquo under
in vivo conditions and its impact on cellular uptake
A murine macrophage-like cell line (RAW 2647) was used to study whether it is possible
to specifically trigger cellular uptake by pre-coating of nanoparticles with different protein
fractions obtained after plasma fractionation Flow cytometry analysis gave quantitative
information about uptake behavior (Figure 26) and confocal laser scanning microscopy
Results and Discussion 51 (cLSM) (Figure 27) was used to visualize the uptake process To ensure the absence of any
additional proteins cellular uptake studies were carried out in medium without plasma or
serum proteins To demonstrate the effect of pre-coating cellular uptake behavior of the
uncoated (ldquonakedrdquo) particles is represented by the red line in Figure 26
Figure 26 Flow cytometry analysis of RAW 2647 cells incubated with uncoated or pre-coated nanoparticles for 2 h in DMEM without additional proteins Nanoparticles were pre-incubated with individual proteins (A) or different protein fractions (B) separated from unbound proteins via centrifugation and added to the cells with a nanoparticle concentration of 75 microgmL Relative median fluorescence intensity (rMFI) values are shown as mean plusmn SD of triplicates The red line serves as a reference for cellular uptake of uncoated nanoparticles (rMFI = 1) A studentacutes t-test was performed to demonstrate the difference in uptake behavior of uncoated and pre-coated nanoparticles (indicated by p values lt 001 or p lt 0001) (all cell experiments were performed by Johanna Simon)
In general non-functionalized and amino-functionalized particles (Figure 26) showed
similar uptake trends after pre-incubation Especially pre-incubation with FHSA (2) and
FIgGHSA (3) caused strongly enhanced cellular uptake (p lt 0001) in comparison to
uncoated (ldquonakedrdquo) particles There was no significant size increase observed for PS and
PS-NH2 particles pre-coated with FHSA As cellular uptake was strongly altered due to pre-
52 incubation with FHSA it illustrates that cellular uptake is triggered by protein adsorption
Confocal laser scanning microscopy (Figure 27) confirmed the intracellular localization of
the pre-coated nanoparticles Analog results were obtained for PS-COOH particles pre-
coated with FHSA (2) and FIgGHSA (3) although this effect was not as significant (p lt 001)
as for PS and PS-NH2 In addition pre-coating with FIgG (4) caused increasing cellular
uptake compared to uncoated particles as well Hence there was a size increase
measured after the particles were pre-incubated with FIgG (Rh values Table 5) Therefore
it was not possible to clearly demonstrate that cellular uptake is triggered by the
adsorption of IgG or if uptake behavior is altered due to the size increase Macrophages
take up nanoparticles by several mechanisms131 132 One of the most interesting uptake
mechanism is called phagocytosis that also enables the uptake of bigger species
Figure 27 cLSM images of RAW2647 cells after incubation with pre-coated nanoparticles for 2h in DMEM without additional proteins Exemplary shown for PS pre-coated with HSA (A) PS-COOH pre-coated with IgG (B) PS-NH2 pre-coated with IgG (C) Scale bars = 10 microm
Going further the influence of pre-coating with various low-abundant protein fractions
(Figure 26B) was studied Here it was found that pre-coating with some protein fractions
resulted in significantly decreased cellular uptake (p lt 0001 ) compared to uncoated
nanoparticles This effect was caused by the low abundant protein fraction FPlasma-wo-HSA-IgG
for PS and PS-NH2 particles In contrast pre-coating of PS-COOH with FPlasma-wo-HSA-IgG
revealed no significant influence on uptake behavior Interestingly pre-coating of PS-
COOH with FPlasma-wo-IgG caused strongly reduced uptake compared to uncoated particles
Results and Discussion 53 Importantly there was only a slight change (Table 5) observed of PSPS-NH2 pre-coated
with FPlasma-wo-HSA-IgG and PS-COOH pre-incubated with FPlasma-wo-IgG This highlights that
cellular uptake is strongly influenced by adsorption of the less abundant plasma proteins
on the nanoparticlesacute surface124
In addition it was analyzed whether the pre-coating ratio between nanoparticles and
proteins had an effect on cellular uptake behavior As exemplary shown in Figure 28 PS-
COOH nanoparticles were pre-coated with varying amounts of IgG depleted plasma
Figure 28 Flow cytometry analysis of RAW 2647 cells incubated with nanoparticles pre-coated with varying amounts of Ig depleted plasma for 2 h in DMEM without additional proteins Different pre-coating ratios between the amount of proteins (in mg) and the defined surface of nanoparticles (510-3 m2) were chosen The pre-coated nanoparticles were isolated via centrifugation and added to the cells with a nanoparticle concentration of 75 microgmL Relative median fluorescence intensity (rMFI) values are shown as mean plusmn SD of triplicates The red line serves as a reference for cellular uptake of uncoated nanoparticles (rMFI = 1) A studentacutes t-test was performed to demonstrate the difference in uptake behavior of uncoated and pre-coated nanoparticles (indicated by p values lt 001 or p lt 0001) (all cell experiments were performed by Johanna Simon)
A strong correlation between the amount of proteins used for pre-coating and cellular
uptake was found (Figure 28) Going down to a pre-coating ratio of 150 microg proteins per of
5x10⁻³ m2 NP surface area (1) there was no significant difference between the uptake
behavior of coated and uncoated NP Clearly the strongest influence on uptake behavior
54 was found for nanoparticles pre-coated with the chosen ratio of 5x10⁻³ m2 overall surface
area per mg protein (described in materialmethods and shown in Figure 26)
Altogether these results demonstrate the great potential to trigger and control uptake
behavior via pre-coating of nanoparticles with specific proteins or protein fractions It was
shown that the uptake behavior is critically altered due to pre-coating of nanoparticles
with distinct protein fractions Proteins were identified (eg HSA) which caused a
significant increase in uptake More interestingly on the other side it was possible to
demonstrate that uptake is significantly decreased if particles are pre-coated with certain
low abundant protein fractions
In order to investigate the stability of the artificial preformed protein corona under
physiological conditions pre-coated nanoparticles were exposed to human plasma and
size changes monitored with DLS The results are summarized in Table 6
Table 6 Size changes of pre-coated particles after direct exposure to human plasma Intensity fractions of the aggregate I(30deg) are exemplified for a scattering angle of 30deg Size increase is calculated based on the values for uncoated nanoparticles (see Figure 17) or pre-coated nanoparticles in PBS (see Table 5)
1compared to values in Figure 17 2compared to values in Table 5
Table 6 shows the detected hydrodynamic radii of formed aggregates upon exposure of PS
particles to concentrated human plasma In order for better comparability these values
were transferred into a corresponding size increase compared to the initial ldquonakedrdquo or
Results and Discussion 55 coated particles In addition the intensity contribution of the newly formed species on the
overall scattered light at a scattering angle Θ = 30 deg is shown This value is proportional to
concentration x molecular weight of the formed aggregates
The amino-functionalized as well as the non-functionalized particle could be stabilized
against aggregation via a pre-coating with FPlasma-wo-IgG-HSA (Table 6) This is of great interest
as the original particles formed aggregates in human plasma in the size range of
Rh(Agg)PS = 292 nm and Rh(Agg)PS-NH2 = 195 nm In contrast the pre-coating of PS-COOH
with FPlasma-wo-IgG-HAS leads to the formation of aggregates in a size range of
Rh(Agg)PS-COOH = 168 nm (Table 6)
The principal method to stabilize nanoparticles against aggregation in human plasma via
pre-coating with an artificial protein corona is illustrated in Figure 29 Furthermore the
ACFs of the uncoated as well as the pre-coated PS particles in human plasma are shown
exemplary
Figure 29 Pre-coating of nanoparticles (Rh(cp)) with distinct low abundant protein fractions stabilizes nanoparticles against aggregation in human plasma A) DLS analysis demonstrates aggregation formation (Rh(agg)) of PS particles (Rh(p)) in human plasma ACF of PS particles in human plasma at Θ = 30deg is shown B) Pre-coating of PS particles with FPlasma-wo-IgG-HSA prevents the formation of aggregates ACFs of the PS particles in isolated FPlasma-wo-IgG-HSA at Θ = 30deg is illustrated
56 Most intriguingly PS-COOH and PS-NH2 pre-coated with IgG remained stable after
exposure to human plasma However those particles showed a size increase after pre-
coating (values see Table 5) in contrast to PS and PS-NH2 particles pre-coated with FPlasma-
wo-IgG-HSA (values see Table 5)
In order for completeness and better illustration all ACFs of naked as well as coated
particles under in vivo conditions are shown in Figure 30 If no additional size could be
detected in regards to all scattering angles no additional force fit was applied
A)
Results and Discussion 57
B)
Figure 30 A+B) Angular dependency of the inverse hydrodynamic radii as well as ACF at Θ
= 30deg including data points (bull) force fit (red) and fit including aggregate formation (blue)
of naked as well as coated PS particles in concentrated human plasma (comparable to in
vivo conditions)
In order to get a better understanding of the obtained DLS results SDS-PAGE was used to
analyze the protein patterns of the different PS particles after incubation in the different
protein fractions as well as after subsequent incubation in human plasma Both
incubations were carried out for 1 h at 37 degC In Figure 31 the protein patterns are shown
ldquoSrdquo describes the single incubation of PS particles in the respective protein fraction
whereas ldquoDrdquo describes the incubation in a protein fraction with subsequent incubation in
human plasma
58
Figure 31 Protein patterns of formed hard coronas with single (S) as well as double incubation with subsequent plasma incubation (D) of PS particles in A) IgG B) HSA C) FPlasma-wo-IgG and D) FPlasma-wo-IgG-HSA
As already shown in Figure 23A the protein patterns of the three different polystyrene
particles show very intense bands in the range between ~35-45 kDa after incubation in
human plasma Figure 31A shows single incubation in FIgG as well as double incubation in
FIgG and human plasma The results of the single incubation show that the protein corona
pattern varies with the pool of proteins present in the incubation medium For the double
incubation the patterns look very similar to the corresponding patterns of the IgG-coated
particles Significant is the absence or very weak presence of proteins in the range
between ~35-45 kDa (marked in red) that are the most abundant ones for single
incubation in human plasma This shows that the once formed protein corona is stable
even after re-introduction in human plasma For the single incubation of PS particles in
Results and Discussion 59 HSA (Figure 31B) the protein patterns also show the absence or very weak presence of
protein bands at the already described molecular weight range Nevertheless after
subsequent incubation in human plasma a protein band at ~ 28 kDa becomes visible for
all particles Figure 31C shows the protein patterns for single and double incubation with
IgG depleted plasma Despite looking very similar for the single as well as double
incubation in the first place differences in the protein patterns could be observed for PS
and PS-NH2 in the higher molecular range between ~ 62 and 98 kDa As requested also for
the incubation in HSA this shows that the protein corona formation continues during the
double incubation This could be an explanation for the detected aggregate formation of
the coated particles that were observed with DLS upon exposure to human plasma Figure
31D shows the protein patterns after single as well as double incubation of the three PS
particles The most intense protein bands at ~ 28 kDa and ~ 50 kDa for the single
incubation remain the most intense bands also after subsequent incubation in human
plasma Despite the appearance of additional protein bands this indicates that the
protein corona formed upon single incubation is somehow solid Again a correlation to
the stabilization of coated PS and PS-NH2 in concentrated human plasma can be drawn
Taken together these results show that an artificially created protein corona can enable
the stabilization of nanoparticles against aggregation in human plasma and moreover
offers the possibility to specifically trigger cellular uptake behavior Once formed an
artificially created protein corona remains stable in particular cases when re-introduced in
human plasma
325 THE IMPACT OF PROTEIN CONCENTRATION ON PARTICLE AGGREGATION AND STABILIZATION VIA PRE-COATING
When inspecting Table 3 (see chapter 324) the three differently functionalized
polystyrene nanoparticles change their size in some protein fractions only very slightly As
already pointed out aggregate formation can in general involve nanoparticle bridging the
adsorption of proteins or protein-protein aggregates on the nanomaterialacutes surface This
chapter addresses the question which processes are involved when DLS detects small size
increases of the particles It is possible that the small size increases can be related solely
60 to the formation of a protein corona around the nanomaterials Another explanation
could also be a small percentage of bridged nanoparticles due to incomplete protein
coverage on the particlesacute surfaces So far the processes cannot be distinguished with
DLS
In order to get a better understanding the aggregation of PS-COOH in FPlasma-wo-IgG was
chosen for further investigations For the conditions discussed in the previous chapter a
size increase of PS-COOH particles in the respective protein fraction of 45 was detected
Theoretically 1 mg protein for the discussed particle surface area of 5x10⁻⁴ m2 would be
enough to cover the entire particle surface area FPlasma-wo-IgG contains mostly HSA As
approximation an overall molecular weight of ~ 70 kDa can therefore be assumed This
means that in 1 mg overall protein amount a number n of 86x1012 single proteins is
present As human serum albumin belongs to the group of globular proteins (see also
introduction part of this work) the overall surface area of proteins can be estimated with
the following equation
119904119906119903119891119886119888119890 119886119903119890119886 119901119903119900119905119890119894119899119904 = 119899 times 119874 (13)
119874 = 41205871199032 (14)
Here n describes the number of proteins and O the surface area of one globular protein
With DLS a radius r of lt1Rhgtz-1 = 76 nm for FPlasma-wo-IgG was determined (see also Table
2 chapter 31) Using equation (14) for the surface area of a sphere a surface area of
726 nm2 for one protein can be calculated When applying equation 13 this leads to an
overall protein surface area of 60 cm2 a value that is 125 times bigger than the particle
surface area of 5 cm2 Nevertheless FPlasma-wo-IgG still represents a mixture of proteins with
different affinities to PS-COOH It is possible that only distinct proteins adsorb onto the
nanomaterialacutes surface and the coverage is not complete In order to investigate this the
amount of present proteins during incubation of PS-COOH was varied and the influence
on particle size investigated via DLS Figure 32 shows the ACFs including data points force
fit and fit considering aggregate formation of each sample at Θ = 60deg
Results and Discussion 61
Figure 32 Autocorrelation function at Θ = 60deg of PS-COOH in FPlasma-wo-IgG including data points (bull) force fit (red) and fit with aggregate formation (blue) From A to D the protein amount per surface area was increased by a factor of 16
Figure 33 shows the respective size increase of formed aggregates in each sample
together with the intensity contribution (I) at Θ = 30deg of aggregate (green) and particle
(red)
62
Figure 33 Size increase of PS-COOH in FPlasma-wo-IgG with increasing amount of proteins per given surface area of nanomaterial The intensity contribution at Θ = 30deg to the overall scattered light of aggregates is illustrated in green the one of particles in red
In general the size of formed aggregates increased with increasing amount of present
proteins during incubation For very low protein concentrations (see Figure 32 and 33 A +
B) a size increase of 24 ndash 27 was observed This corresponds to 12 ndash 17 nm particle
increase in radius and is in good agreement with the observed size increase of PS-COOH in
concentrated human serum after one centrifugation step representing the formed hard
corona under saturated conditions (see Figure 25 size increase ~ 20 nm in radius) In
addition the particle in original size was not detectable anymore within the mixture the
formed small ldquoaggregatesldquo contributed 99 to the overall scattered light at Θ = 30deg
When the amount of proteins was increased to 1 mg (sample C) or 2 mg (sample D) per
given surface area the PS-COOH particles increased ~ 60 in radius For 1 mg the
particles predominated the scattered light at Θ = 30deg with a contribution of I = 75
while for 2 mg the aggregates predominated with I = 62 This indicates that with
increasing amount of proteins the degree of aggregation increases In addition the
overall size increase contradicts the assumption of incomplete surface coverage leading to
bridged nanoparticles for the determined size increase of PS-COOH in FPlasma-wo-IgG that
was observed and discussed in the previous chapter 324
A B C D E F0
50
100
150
200 size increase
I (30deg) aggregate
I (30deg) particle
Results and Discussion 63 The presumption that bridged nanoparticles are not the origin for the observed small size
increases becomes even more likely when looking at sample E and F in Figure 32 and 33
These samples represent the highest amount of proteins during incubation of PS-COOH
particles in FPlasma-wo-IgG The observed size-increase amounts 127 ndash 194 and again the
aggregates predominated the scattered light for very high protein concentrations (sample
F) All in all the DLS results suggest that at very low concentration the proteins adsorb
onto the nanomaterialacutes surface and tend to induce protein-protein aggregation on the
nanoparticles that also involve the accumulation of particles when the protein amount is
increased
In order to tighten these suggestions chosen samples have also been investigated with
FCS performed by Jennifer Schultze (PhD student in the group of Dr Kaloian Koynov AK
Butt Max-Planck-Institute for Polymer Research Mainz) In contrast to DLS FCS only
detects fluorescent species within the sample under investigation namely the particles
An averaged size can be detected and in addition the determined fluorescent brightness
(in counts per fluorescent object) implies information about possible aggregate formation
containing multiple particles In general FCS measurements of the PS particles under
investigation included difficulties The concentration used for DLS measurements is very
low in comparison to the ones than are usually used for FCS measurements (magnitude of
10) Moreover the particles are very hydrophobic and tended to adsorb onto the partially
hydrophobic (due to surface modification) bottom glass slide of the used FCS
measurement chambers (Nuncreg Lab-Tek) Therefore only trends can be observed and
discussed For PS-COOH particles in buffer a hydrodynamic radius of Rh ~ 60 nm was
determined by FCS which is in good agreement with the size determined by DLS The
fluorescent brightness was in the range of 66 kHz for the used excitation laser intensity
When 5x10⁻⁴ m2 surface area of PS-COOH particles were incubated in 1 mg FPlasma-wo-IgG
protein solution (sample C) the averaged hydrodynamic radius increased to Rh ~ 80 nm
Simultaneously the fluorescent brightness increased to 440 kHz This means that the
small size increase that was also detected in DLS includes the formation of aggregates
containing more than one particle When the amount of proteins during incubation was
quadruplicated (sample F) the averaged detected size using FCS was in the range of Rh ~
110 nm and the fluorescent brightness at 250 kHz The trend for increasing size with
increasing protein amount during incubation correlates again with the DLS measurements
64 In addition the formed aggregates contained once more multiple PS-COOH particles
which became apparent in the fluorescent brightness The sample C was measured 1 h
later than sample F which could be one possible explanation for the higher brightness
Still the trend of increasing the fluorescent objectacutes brightness after incubation in FPlasma-
wo-IgG is valid
Altogether the results presented in this chapter lead to the assumption that aggregate
formation includes the formation of species containing multiple particles As the
aggregate size and degree of aggregation increase with increasing protein amount during
incubation the process is supposed to involve protein-protein aggregation on the
nanomaterialacutes surface that lead to the accumulation of particles
Another experimental setup that sheds light on the question whether the PS-COOH
surface area of 5x10⁻⁴ m2 is covered completely when incubated in 1 mg FPlasma-wo-IgG is the
pre-coating procedure (see also chapter 324) with subsequent introduction of coated
particles into concentrated human plasma The amount of proteins per given surface area
during incubation was therefore doubled tripled and quadruplicated Afterwards the
physicochemical parameters like size and zeta potential as well as the stability of coated
particles against aggregation was monitored using DLS The size of the coated particles
determined via DLS and the zeta potential are summed up in Table 7
Table 7 Physicochemical parameters of coated PS-COOH particles in FPlasma-wo-IgG
The size of the coated particles determined by DLS was found to be independent of the
protein amount used for the coating procedure in the range of lt1Rhgtz-1 = 87 ndash 92 nm
Also for the zeta potential no significant trend for varying protein amount was observed
Results and Discussion 65 The coated as well as non-coated particles in Table 7 were introduced into concentrated
human plasma and their stability against aggregation monitored using DLS
Figure 34 ACF at Θ = 30deg including data points force fit and fit with aggregation in concentrated human plasma of A) PS-COOH B) PS-COOH coated with 1 mg FPlasma-wo-IgG C) PS-COOH coated with 2 mg FPlasma-wo-IgG D) PS-COOH coated with 3 mg FPlasma-wo-IgG E) PS-COOH coated with 4 mg FPlasma-wo-IgG F) Observed aggregated sizes in concentrated human plasma of samples A ndash E
66 Figure 34 shows the ACF of ldquonakedrdquo as well as coated PS-COOH with FPlasma-wo-IgG in
concentrated human plasma at Θ = 30deg In general all coated particles formed aggregates
in the size range of lt1Rhgtz-1 (agg) = 207 - 222 nm The observed size increase was
therefore independent of the protein amount used for the pre-coating procedure The
observed results are in good agreement with the already discussed results of chapter 324
with obtained aggregates in the range of lt1Rhgtz-1 = 256 nm for coated PS-COOH particles
with 1 mg FPlasma-wo-IgG (see also Table 6) This underlines the previous discussed
assumption that the coverage of PS-COOH particles in FPlasma-wo-IgG is complete even for the
chosen and in comparison low protein amount of 1 mg 5x10⁻⁴ m2 particle surface area
To make sure that the entire particle surface area is covered LC-MS measurements were
performed 05 mg FPlasma-wo-IgG were used for the incubation of 5x10⁻⁴ m2 overall surface
area of PS-COOH particles The coated particles were afterwards incubated in
concentrated human plasma and the protein corona profile determined after single and
double incubation via LC-MS Table 8 presents the top 20 identified proteins of the protein
coronas formed on PS-COOH particles after incubation in concentrated human plasma (1)
IgG-depleted plasma (2) and IgG-depleted plasma with subsequent incubation in
concentrated human plasma (3) Especially the three highest abundant proteins after
incubation in IgG-depleted plasma namely fibrinogen gamma chain fibrinogen beta chain
and fibrinogen alpha chain remain the most abundant proteins present in the particlesacute
protein corona even when reintroduced in concentrated human plasma For single
incubation in concentrated human plasma the most abundant protein within the particleacutes
hard corona was vitronectin In addition to the enrichment of fibrinogen the amount of
apolipoprotein A-I is significantly reduced for single and double incubation (see sample 2
and 3 in Table 8)
Altogether the presented results confirm that the chosen ratio for the pre-coating
procedure introduced in the previous chapter is sufficient for complete surface coverage
The elevation of protein amount did not lead to a change in particle stability against
protein induced aggregation
Results and Discussion 67 Table 8 Top 20 identified proteins in the protein corona formed on PS-COOH particles after incubation in concentrated human plasma (1) IgG-depleted plasma (2) and IgG-depleted plasma with subsequent incubation in concentrated human plasma (3) determined via LC-MS (LC-MS measurements were performed by Johanna Simon)
326 USING PROTEIN MIXTURES AS SURFACTANTS FOR PARTICLE STABILIZATION
Going one step further the question arose whether it is possible to use the obtained
protein fractions for stabilization of particles from the beginning meaning as amphiphilic
stabilizer (ldquosurfactantrdquo) during synthesis FPlasma-wo-IgG was chosen as the most suitable
protein mixture as it is the protein mixture with the highest concentration of proteins
after removal of one high abundance protein The critical aggregation or micelle
concentration (CMC) determination of the respective protein solution is shown in Figure
35
68
Figure 35 Surface tension of a solution of FPlasma-wo-IgG in water in dependence to the
protein concentration
As FPlasma-wo-IgG represents a mixture of proteins no distinct CMC or critical aggregation
concentration could be determined Moreover the trend of surface tension at the
airwater interface shown in Figure 29 shows approximately two plateaus This indicates
that micelle (or aggregate) formation takes place subsequent when reaching a CMC of a
protein component in the still very complex mixture In addition the values for
amphiphile (ldquosurfactantrdquo) concentration are very low compared to conventional ones such
as sodium dodecyl sulfate (SDS) SDS has a CMC in water of 82 mM As IgG depleted
plasma contains mostly albumin a molecular weight of the protein mixture can be
assumed in the range of 70 kDa 02 gL of proteins would therefore correspond to a 0003
mM solution This would correlate to a reduction of amphiphile amount with a factor of
2500 compared to SDS As the surface tension in emulsion is much bigger than for the
airwater interface only and the surfactant under investigation very complex an amount
of 1 gL for the polymerization of styrene was chosen (~4 w)
Polystyrene was synthesized via direct mini-emulsion using either V59 or V70 as initiator
V59 was chosen because it is the standard initiator of the so far discussed particles V70
was chosen in addition because it has a lower half-life decomposition temperature than
V59 (67 degC) in fact 30 degC which is lower than the denaturation temperature of proteins
00 01 02 03 04 0545
50
55
60
65
70
75
SF
T [
mN
m]
conc [gl]
Results and Discussion 69 Both structures are shown in Figure 36 The exact sample composition will be given in the
experimental part
Figure 36 Chemical structure of V59 (left) and V70 (right)
After sonication and stirring over night at 30 degC or rather 67 degC the sample with V70 at 30
degC did not lead to particle formation which is probable due to an inefficient radical
formation or capture of the formed radicals by presence of the proteins amino groups133
However for the sample with V59 as initiator particles with a diameter of 230 nm could
be obtained The corresponding DLS results as well as TEM images are shown in Figure 37
The molar ratio of monomersurfactant was calculated to ~ 137001 This is compared to
the lutensol stabilized particles discussed in this chapter very high (MS = 2901) and
underlines again the low protein amount needed for stabilization compared to low
molecular surfactants (see page 68) and also polymeric surfactants as lutensol
DLS measurements were repeated after four months in order to investigate the stability of
the respective dispersion No size change could be detected meaning that the dispersion
remained stable
When looking at the TEM images in Figure 37 the particles seem to be smaller than the
values determined by DLS The latter method is very sensitive towards bigger species
within the mixture and could therefore lead to bigger values By TEM imaging an average
radius in the range between 75 and 100 nm was observed
70
Figure 37 TEM images as well as DLS results of polystyrene with FPlasma-wo-IgG as stabilizer
For the evaluation of stability against aggregation the particle was introduced into
concentrated human plasma Figure 38A shows the ACF at 30deg Figure 38B the angular
dependency of the observed hydrodynamic radii
In the presence of concentrated human plasma aggregates were formed that are about
19 times bigger than the original particles The intensity contribution of formed
aggregates at Θ = 30 deg was determined to 41 This is comparable to the behavior of the
three different Lutensol stabilized polystyrene particles in plasma as discussed in chapter
322 But in contrast no additional chemical surfactant is needed
Figure 38 Angular dependency of the inverse hydrodynamic radii as well as ACF at Θ = 30deg including data points (O) force fit (red) and fit including aggregate formation (blue) of protein stabilized particle in human blood plasma
Results and Discussion 71 The protein stabilized particles were investigated via CellTiter-Glo Assay regarding their
cytotoxicity (Figure 39) For a concentration of 75 microgmL protein stabilized particles
reduced the metabolic activity of the RAW 2647 cells in an acceptable range of only
~10 This would be important for in vitro experiments that are typically performed under
these conditions Even when the amount of particles was doubled the majority of cells
kept their metabolic activity Lutensol stabilized particles showed almost no effect on the
metabolic activity of the cells
Figure 39 A) CellTiter-Glo Assay of PS with proteins as surfactant B) CellTiter-Glo Assay of Lutensol stabilized PS-particles (data in B provided by Johanna Simon)
SDS-PAGE was used to analyze the protein pattern of the particle itself and compared to
the one of IgG-depleted plasma as discussed previously The patterns are shown in Figure
40 The most abundant protein on the polystyrene particle is albumin that is also most
abundant in FPlasma-wo-IgG But in contrast to the mixture itself a second protein of ~ 98 kDa
is enriched on the nanomaterialacutes surface As already shown in Figure 31C the protein
corona patterns of PS PS-NH2 and PS-COOH stabilized with Lutensol also show more than
one intense protein band after incubation in FPlasma-wo-IgG Only PS-COOH shows protein
bands in the higher molecular range and there is only a very weak band at ~ 98 kDa On
the one hand this shows again that the most abundant proteins present in a mixture like
albumin are not necessarily most abundant in a particleacutes protein corona or have the
highest affinity to it As Lutensol AT50 is a nonionic surfactant with the molecular formula
C(16-18)O(CH2CH2O)50H and contains a PEG chain of about 50 monomers it plays an strong
role in the protein adsorption As shown in the literature PEGylated polystyrene particles
72 adsorb a lot of clusterin on their surface107 A corresponding protein band at 38 kDa can
be observed for non-functionalized PS in IgG depleted plasma as shown in Figure 31 as
well
In conclusion it is possible to stabilize PS particles with IgG depleted plasma without the
need of an additional low molecular weight surfactant The effect on the metabolic
activity of cells is suitable for in vitro experiments while the aggregation behavior in
concentrated human plasma is similar to the previously discussed Lutensol stabilized
polystyrene particles As a benefit the impact of Lutensol on protein adsorption can be
excluded
Figure 40 SDS-PAGE of A) PS stabilized with FPlasma-wo-IgG B) plasma and C) FPlasma-wo-IgG
327 SUMMARY
In this chapter the very complex overall process of nanomaterial-plasma interactions was
fragmented in low abundance protein and high abundance protein interaction Single
proteins or mixtures could be identified that play a major role in particle stability against
aggregation With respect to that polystyrene particles were coated with protein fractions
Results and Discussion 73 and decorated with a predetermined ldquoartificialrdquo protein corona Their effect on cellular
uptake in macrophages as well as stabilization against aggregation in concentrated human
plasma was demonstrated The protein fraction FPlasma-wo-IgG could be also used for the
stabilization of particles as ldquosurfactantrdquo during synthesis
Altogether this shows that the interactions between plasma proteins and nanomaterials
designed for biomedicine can not only limit their application but can in fact be used as
tool for the adjustment and fine tuning of the nanocarrieracutes physicochemical properties
The stability of predetermined hard coronas upon exposure to concentrated human blood
plasma opens the possibility of defining not only the chemical identity of nanomaterials in
the laboratory but moreover also the biological identity to a certain extend
74
33 HUMAN BLOOD PLASMA VERSUS SERUM
When looking in the literature many different protein sources are used for pre-in vivo
studies on nanomaterials Fetal bovine serum (FBS) is found as cell culture media
supplement and commercially available In 1975 Honn Singley and Chavin already
pointed out that a high variability of serum could be observed depending on charge and
supplier134 But also human serum or plasma comes into operation for pre-in vivo studies
Dawson and coworkers used human plasma to evaluate the differences in protein corona
formation on silica and polystyrene nanoparticles depending on the protein concentration
during incubation87 In contrast Walkey et al used human serum in order to investigate
the impact of size and surface chemistry on protein adsorption onto gold nanoparticles135
As already pointed out in the introduction part of this work human blood serum and
human blood plasma can be both obtained after blood withdrawal from probands But
they differ in their protein composition depending on the preparation method For the
recovery of plasma from blood an anti-coagulant has to be added in order to prevent the
blood from clotting The cellular fraction of blood can afterwards be removed via
centrifugation When the blood is allowed to clot prior to centrifugation human blood
serum is obtained that lacks of proteins that are part of the coagulation process The
situation becomes even more complex as different anti-coagulants can be used for
plasma stabilization Pozzi et al136 and Monopoli et al87 both used EDTA stabilized human
plasma for protein corona studies whereas Winzen et al used heparin stabilized plasma
for the same108 The effectiveness of EDTA is based on the complexation of ions that are
needed for enzymes as part of the coagulation process Heparin on the other hand
activates anti-thrombin and by this inhibits the coagulation cascade Very recently
Schoumlttler et al showed that the protein source as well as the added anti-coagulant affect
nanoparticle protein corona and cellular uptake137
In this chapter the influence of protein source and anti-coagulant on particle aggregation
is discussed CTMA-Cl stabilized polystyrene particles with amino groups on the surface
that are already published107 137 were introduced in human blood serum citrate stabilized
plasma heparin plasma FBS and FBS with additional heparin The aggregation behavior
was monitored using DLS Figure 41 42 and 43 show the corresponding results
Results and Discussion 75
Figure 41 Angular dependency of the inverse hydrodynamic radii of A) PS-NH2 and B) the
different protein sources
Arising from Figure 41B the z-averaged inverse hydrodynamic radii of the protein sources
differ a lot While human serum and citrate stabilized plasma show values between
lt1Rhgtz-1 = 18 nm (serum) and lt1Rhgtz
-1 = 21 nm (citrate plasma) the sizes of the other
three protein sources were determined to be in a smaller range of lt1Rhgtz-1 = 13-14 nm
The influence of the different protein sources on particle stability against aggregation is
shown in Figure 42 and 43
Figure 42 Size increase of PS-NH2 in the respective protein sources (Θ = 30deg)
0
200
400
600
800
siz
e incre
ase
FBS FBS +
heparin
heparin
plasma
citrate
plasma
serum
76
Figure 43 ACF at Θ = 30deg of PS-NH2 including data points (O) force fit (red) and fit
regarding aggregate formation (blue) in A) serum B) citrate plasma C) heparin plasma D)
FBS + heparin and E) FBS D) Aggregate sizes and intensity contribution at Θ = 30deg
determined by DLS
First of all all protein sources induce significant aggregate formation when PS-NH2 is
introduced into a respective solution When the amino-functionalized PS particle was
introduced into FBS aggregates were detected with a radius of Rh = 250 nm at Θ = 30deg
that corresponds to a size increase of ~ 380 compared to the initial particle When
heparin was added to FBS prior to the incubation with particles particle aggregates were
Results and Discussion 77 formed that are about 200 nm bigger in diameter than compared to the aggregate
formation of PS-NH2 in FBS solely This means that the anti-coagulant heparin has a
significant influence on particle-protein interactions
Figure 44 Structure of A) Heparin- and B) Citrate-anion
As shown in Figure 44A heparin is a polyanion with a disaccharide as repeating unit It
activates antithrombin and by this inhibits the coagulation cascade Due to the high
negative charge density in heparin it is supposed to strongly interact with a naomaterialacutes
surface The adsorption of heparin on the latter one could lead to interactions with mostly
negative plasma proteins resulting in aggregation
Next the formed aggregates in human serum or rather citrate stabilized plasma were
determined to be in the range between Rh (Θ = 30deg) = 466 nm and Rh (Θ = 30deg) = 486 nm
which is much bigger than the formed aggregates in all other protein sources On the one
hand these results indicate that human serum and human citrate plasma induce
aggregation with size increases that are in a comparable range On the other hand the
difference between heparin stabilized plasma and citrate stabilized plasma again points
out that the choice of anti-coagulant plays a major role for the outcome of pre-in vivo
experiments In contrast to heparin citrate is a threefold negatively charged anion (see
Figure 44B) that complexes ions that are needed for enzymes as part of the coagulation
process Citrate as anion may have an influence on the diffuse Stern layer around the
nanoparticles that possibly leads to aggregation
78 The impact of the protein source and anti-coagulant on protein corona formation and
cellular uptake of PS-NH2 has already been investigated and published by Schoumlttler et
al137 For RAW2647 macrophages that were already discussed in the previous chapter
32 a strong dependence of uptake-behavior and protein source used for incubation was
observed While the incubation of PS-NH2 in FBS or heparin plasma led to a strong uptake
in RAW2647 macrophages there was only a very weak uptake detectable after
incubation in citrate plasma or human serum The anti-coagulant therefore also plays a
critical role in the outcome of in vitro studies Additionally the cell experiments
strengthen the assumption that citrate plasma and serum lead to comparable results
under the mentioned conditions137
Altogether protein source as well as anti-coagulant play a critical role in protein-particle
interactions and therefore influence the outcome of pre-in vivo experiments As the
effectiveness of heparin as anticoagulant is based on interactions with proteins citrate
was chosen as anti-coagulant for plasma experiments that complexes ions needed for the
coagulation cascade DLS together with cellular uptake studies from Schoumlttler et al137
indicate that protein induced aggregation of nanoparticles as well as uptake in RAW2647
macrophages after incubation in serum or rather citrate plasma do not differ in a
significant manner
Results and Discussion 79
34 EVALUATION OF NANOPARTICLE STABILITY IN HUMAN BLOOD SERUM BY DYNAMIC LIGHT SCATTERING THE IMPACT OF PERSONALIZED HUMAN BLOOD SERUM COMPOSITION
In the previous chapter the influence of distinct protein fractions obtained from human
blood plasma on particle stability against aggregation as well as protein corona formation
was investigated From literature it is already known that the human blood plasma
composition is related to the genetic background or geographical origin of healthy
individuals138 As the stability of polystyrene particles has been demonstrated to be
strongly dependant on the proteins present during incubation their stability and
interactions with proteins were assumed to be in addition strongly dependent on the
composition of individual human blood proteomes The following chapter addresses the
questions of how big the differences of blood composition are between diverse probands
and how this can influence the stability of nanocarriers against aggregation After analysis
of six individual sera and one serum pool the stability of PS particles in the respective
protein solution was investigated using dynamic light scattering In addition protein
corona formation was analyzed using LC-MS The LC-MS measurements were performed
by Johanna Simon By combining DLS and LC-MS data a correlation between particle
stability under in vivo conditions and protein corona composition was evaluated The
already described coating of nanoparticles in order to stabilize them was applied to
overcome the limitations arising from personalized blood serum composition It will be
shown within the next chapter that a once formed protein corona on a nanomaterialacutes
surface remains stable even when re-introducing it into another serum source This could
also be of great interest for nanomaterials that are designed to treat special diseases
meaning that the protein composition of target subject differs from the one of healthy
individuals138 139
Human blood serum was used for the investigations in this case as the highest number of
individual probands was available This way the best statistical representation could be
obtained In addition the influence of anti-coagulant mentioned in chapter 33 could be
excluded
80
341 ANALYSIS OF INDIVIDUAL AND POOLED HUMAN BLOOD SERUM
As already described in the introduction the ACF of human serum determined by dynamic
light scattering can be described by the sum of three exponentials Each of them
represents one size fraction of serum proteins Figure 45A exemplarily shows the ACF of a
serum pool from nine different blood donators
Figure 45 A) Autocorrelation function of serum pool at scattering angle 30deg with the distribution of the three different size fractions B) Fluctuation of the three different size fractions between different probands
The first size fraction represents smaller proteins such as human serum albumin or IgG
The intermediate fraction comprises slightly bigger proteins like IgM or LDL The third size
fraction is the biggest one and represents mostly lipoproteins for example big
chylomicrons Depending on the serum composition and the concentration of individual
proteins the hydrodynamic radii of each size fraction can vary Addressing this question
dynamic light scattering was used to investigate 6 individual sera and one pool regarding
their size distribution Figure 45B shows the result For the first size fraction
hydrodynamic radii in the range between Rh1 = 3-6 nm were detected For the second
one bigger differences between the sera under investigations were measured For
example the second protein fraction of P7 was determined to be Rh2 = 14 nm while the
one of P4 was much bigger with Rh2 = 52 nm The biggest size fraction showed values
between Rh3 = 83-211 nm The variation in sizes of each protein group in consequence
leads to a fluctuation of the z-averaged hydrodynamic radii This fluctuation becomes also
Results and Discussion 81 apparent in Figure 46 showing exemplarily the ACFs at Θ = 30deg for individual sera P4 and
P5 and the one of pooled human serum
Figure 46 ACF at Θ = 30deg for serum P4 (red) P5 (blue) and pooled human serum (green)
In addition to dynamic light scattering the different protein sources were analyzed with
LC-MS Table 9 shows the top 20 identified proteins of each serum and the serum pool in
percent The captions of individual sera as proband P2 P4 etc were adapted as initially
defined after receiving them from the blood transfusion center of the medical department
of the Johannes Gutenberg University Mainz All of them are part of the serum pool
consisting of 9 probands The individual sera of proband 1 3 and 8 were not part of this
work due to a lack in availability
The amount of the most abundant protein human serum albumin differs a lot depending
on the protein source For example P9 contains only 35 HSA while the pooled human
serum consists of more than 50 of the respective protein For all other proteins the
fluctuation is not that strong due to their lower abundance in human blood serum But
still big differences between the different probands can be observed For instance serum
10-4
10-3
10-2
10-1
100
101
102
103
104
-02
00
02
04
06
08
10 P4 lt1Rhgtz
-1 = 66 nm
P5 lt1Rhgtz-1 = 20 nm
pool lt1Rhgtz-1 = 33 nm
g1
(t)
t ms
82 P4 contains only 007 of Inter-alpha-trypsin inhibitor heavy chain while serum P2
contains a 24-fold amount of it
These results show that there is a strong dependency of the blood donator on serum
protein composition Due to the results discussed in chapter 32 it can be assumed that
nanoparticles introduced into each protein source show different responses in regards of
aggregate or protein corona formation This would in consequence limit the applicability
of nanocarriers designed for biomedical applications for a very diverse group of receivers
In addition it also limits the transferability of in vitro and in vivo experiments to the actual
situation in clinical studies
Table 9 Top 20 identified proteins in individual sera P2-P9 as well as serum pool determined via LC-MS (LC-MS measurements were performed by Johanna Simon)
Results and Discussion 83
342 STABILITY EVALUATION OF NANOPARTICLES IN HUMAN BLOOD SERUM BY DYNAMIC LIGHT SCATTERING
In the next step the influence of blood serum composition on particle stability against
aggregation was investigated via DLS As in previous studies non-functionalized as well as
amino- and carboxy-functionalized polystyrene particles were used as a model system
First it has to be noted that all three particles show aggregation in the pooled human
serum (see Table 10) The size of the formed aggregates were determined to be in a range
between Rh = 150 - 250 nm This is still very small and in comparison to the initial particles
corresponds to a size increase of 100 (for PS) to 200 (for PS-NH2) meaning that no
bigger agglomerates were formed Nevertheless individual sera could be determined that
caused no size increase of the respective particle For example PS-COOH showed
aggregate formation in pooled human serum resulting in aggregates that were about 26
times bigger than the particles itself while PS-COOH showed no change of size in serum
P4 The corresponding ACFs including data points force fit and fit regarding aggregate
formation are shown in Figure 47 exemplarily Similar results were found for PS and PS-
NH2 nanoparticles
Table 10 Stability evaluation of the different polystyrene particles in the respective sera or serum pool (in red)
84
Figure 47 ACF of PS-COOH in pooled human serum (left) and in serum P4 (right) at Θ = 30deg including data points (bull) force fit (red) and fit including aggregate formation (blue) of protein stabilized particle in human blood plasma
These results indicate that the behavior and with this the biodistribution of a nanocarrier
designed for biomedical application could possibly be dependent on the proband himself
The relation between particle aggregation determined by DLS and the biodistribution in
mice is already known in literature115
The disparity in particle interactions with the different protein sources was also monitored
by applying SDS-PAGE The corresponding protein patterns are shown in Figure 48 Due to
the sensitivity of SDS-PAGE the protein patterns of the coronas formed on the PS particles
upon incubation in the different protein sources in general look very similar Nevertheless
small differences can be observed For example the protein coronas formed on PS as well
as PS-NH2 particles in the pooled human serum show the existence of a protein band
between 38 and 49 kDa corresponding to apolipoprotein A-IV (marked in red) The same
bands can also be seen very weakly for PS particles in the corresponding protein coronas
formed in individual serum P2 and for PS-NH2 particles in P2 P4 and P6 In the protein
patterns of the coronas formed in P7 and P9 these bands are completely absent Of
course these differences can also occur due to small fluctuations in the applied protein
amount onto the gel but the intensity of the other bands in the protein patterns formed
for example after incubation in P7 show that the differences in protein corona patterns
can be related to the differences in the composition of the protein sources
Results and Discussion 85
Figure 48 Protein patterns of the protein coronas formed on the different functionalized
PS particles upon incubation in the different protein sources
343 TAKING ADVANTAGE OF THE INFLUENCE OF PERSONALIZED SERUM ON PARTICLES STABILITY
As was shown in chapter 32 the pre-coating of PS-particles with certain protein mixtures
can stabilize them against aggregation in human blood plasma The question was
addressed whether this approach could be adapted in order to stabilize particles under
investigation and by this overcome the limitations that arise from the fluctuation in
personalized human blood serum composition and the corresponding particle-protein
interactions When combining DLS with LC-MS data the impact of single proteins within a
given protein corona on particle aggregation can be monitored Therefore the three
86 different Lutensol-stabilized polystyrene particles were incubated in individual sera that
were determined to cause no size increase of the respective particle Afterwards the
coated particles were introduced into the human serum pool and the stability was
evaluated using DLS (see Figure 49)
Figure 49 ACF of a respective coated particle in pooled human serum at Θ = 30deg including data points (bull) and force fit (red) with A) PS coated in P4 B) PS-COOH coated in P4 C) PS-NH2 coated in P2 and D) PS-NH2 coated in P7
For each particle no size increase in pooled human serum could be detected after pre-
coating in individual sera Due to the formation of a protein corona the particlesacute size
itself was increased but for PS-COOH and PS-NH2 the resulting size was much smaller
compared to the ones of the primary detected aggregates (see Figure 50) This means
that the size increase of the respective PS particles in pooled human serum can be limited
and pre-determined by the formation of a protein corona in individual sera that did not
lead to a destabilization This would be of great interest when a given nanomedicine
Results and Discussion 87 should be applied to a proband whose serum composition leads to intense aggregation
and the formation of big agglomerates
Figure 50 Angular dependency of the inverse hydrodynamic radius of the particles itself (red) the corresponding aggregates (blue) formed in pooled human serum (black) in comparison with the ones of the coated particles (magenta)
It can be summarized that the pre-coating of a PS-particle in individual serum can
stabilize it against aggregation in pooled human serum
88 Further the stability of the pre-formed protein corona after introduction in the human
serum pool was investigated via LC-MS for chosen samples PS-COOH particles pre-coated
with serum P4 and PS-NH2 particles pre-coated with serum P7 have been studied Table 11
shows the results for PS-COOH particles
Table 11 TOP 20 identified proteins of the protein coronas (values in ) formed on PS-COOH particles after incubation with pooled human serum individual serum P4 and double incubation obtained by LC-MS in douplicates A and B (LC-MS measurements performed by Johanna Simon)
In general the protein coronas of PS-COOH formed in serum P4 and pooled human serum
are very similar However one difference becomes obvious (marked in red see Table 11)
The amount of Apolipoprotein E in the protein corona formed in the serum pool is much
smaller than the one in the corona formed in serum P4 When PS-COOH was pre-coated
Results and Discussion 89 with the respective protein source the amount of Apolipoprotein E remains constant
even after re-introduction in the serum pool Similar results were found for PS-NH2
particles as Table 12 shows
Table 12 TOP 20 identified proteins of the protein coronas (values in ) formed on PS-NH2 nanoparticles after incubation with pooled human serum individual serum P7 and double incubation obtained by LC-MS in douplicates A and B (LC-MS measurements performed by Johanna Simon)
This time four different proteins could be detected whose amount in the protein coronas
of PS-NH2 particles formed in serum P7 and pooled human serum differ namely clusterin
apolipoproteins A-I A-IV and E (marked in red see Table 12) Again the amount of
Apolipoprotein E in the protein corona formed in individual serum P7 is bigger compared
to the one formed in pooled human serum This remains constant even after
reintroduction in the latter one A similar phenomenon was found for Apolipoprotein A-I
while the amount of Apolipoprotein A-IV was decreased by the pre-incubation process
90 The results presented in Table 11 and 12 show that a once formed protein corona on
polystyrene particles in distinct protein sources is stable when it is re-introduced into
another protein source Together with the previously described dynamic light scattering
results it can be assumed that the mentioned proteins play an important role in serum
protein induced aggregation or rather stability against aggregation
344 HEAT INACTIVATION OF HUMAN BLOOD SERUM
In the last chapter 333 it was demonstrated that the incubation of polystyrene particles
in sera with individual protein composition can lead to a stable protein corona on the
respective particles when they were introduced into pooled human serum that initially
induced slight aggregation This pointed out once again that the composition of a protein
source critically affects the protein adsorption onto a nanomaterialacutes surface and with this
the stability against aggregation This led to the assumption that a change in serum
preparation with involved changes in protein composition prior to incubation with
nanoparticles also effects the interaction with the latter ones The inactivation of human
serum proteins is a widely used method for protein sample preparation in order to
denaturate the complement system For example fetal bovine serum (FBS) that is used in
vitro is heated up to 56 degC for 30 min prior to cell experimental use Therefore the effect
of heat inactivation on protein corona formation on PS-particles was investigated First
the effect of heating serum up to 56 degC for 30 min was monitored by dynamic light
scattering Afterwards the effect on the particle stability and protein corona formation of
polystyrene particles was monitored The observed changes in regards of stability and
protein corona formation were evaluated as additional tool for the stabilization of the
particles under investigation when introduced into native pooled human serum Figure 51
shows the angular dependency of every size fraction and the z-averaged inverse
hydrodynamic radius of the native serum pool (Figure 51A) and the heat-inactivated
serum pool (Figure 51B) The z-averaged values for both are very similar but the heating
has an influence on the distribution of the single protein size fractions
Results and Discussion 91
Figure 51 Angular dependency of the inverse hydrodynamic radii as well as the z-averaged value obtained in native human serum pool (A) and heat inactivated human serum pool (B)
The similarity for the z-averaged inverse hydrodynamic radius becomes also apparent
when looking at Figure 52 The ACFs at Θ = 30deg of native human serum (black) and heat
inactivated human serum (red) are shown and are more or less identical
Figure 52 ACF at Θ = 30deg of native human serum (black) and heat inactivated human
serum (red)
10-4
10-3
10-2
10-1
100
101
102
103
104
-02
00
02
04
06
08
10 nativ serum
heat inactivated serum
g1
(t)
t ms
92 The previously described polystyrene particles were incubated in the human serum pool
as well as in the heat inactivated serum pool in order to investigate the above described
effect on protein corona formation on the respective particles The protein pattern was
analyzed using SDS-PAGE (see Figure 53)
Figure 53 SDS-PAGE of the different polystyrene particlesacute protein coronas formed upon incubation in native human serum pool (A) as well as in heat inactivated human serum pool (B) (SDS-PAGE performed by Johanna Simon)
Figure 53A shows the protein patterns of PS PS-COOH and PS-NH2 after incubation in
native pooled human serum Figure 53B shows the respective patterns after incubation in
heat inactivated pooled human serum As was already shown in Table 12 the protein
corona of the amino-functionalized polystyrene particle formed in pooled human serum
Results and Discussion 93 contains mostly clusterin (averaged amount ~ 54) The same is valid for the non-
functionalized one Interestingly the corresponding protein band at 38 kDa disappears in
the corona pattern when the serum pool was heat-inactivated prior to use One possible
explanation could be the denaturation of clusterin during the heat inactivation of pooled
human serum The difference in the protein corona composition depending on serum
treatment prior to incubation is also shown in Table 13 that summarizes the TOP 20
identified proteins in the protein coronas formed on PS-NH2 after incubation in nativ and
heat inactivated human serum
Table 13 TOP 20 identified proteins of the protein coronas (values in ) formed on PS-NH2 nanoparticles after incubation with native pooled human serum (A) and heat inactivated human serum (B) obtained by LC-MS (LC-MS measurements performed by Johanna Simon)
Emanated from Table 13 the amount of clusterin in the protein corona of amino-
functionalized PS particles is dramatically reduced after incubation in heat inactivated
94 serum while human serum albumin is enriched The same is valid for the Ig kappa chain C
region (marked in green)
To study this effect the melting points (and with this denaturation temperature) of
clusterin HSA IgG and fibrinogen (fibrinogen only for completeness and further
discussion) were determined using Differential Scanning Fluorimetry (DSF) A solution of
each protein with c = 1 gL in DPBS (clusterin c = 014 gL) was heated from 20 degC up to 95
degC with a heating rate of 1 degCmin The auto fluorescence at 350 nm as well at 330 nm was
measured Figure 54 shows the detected fluorescence at 350 nm in dependency of the
temperature
Figure 54 Fluorescence at 350 nm determined by nanoDSF of fibrinogen (A) HSA (B) IgG (C) and clusterin (C) in PBS (clusterin was measured by Julius Muumlller PhD student AK Landfester MPIP)
For fibrinogen a denaturation point of T = 496 degC was determined for HSA a value of T =
617 degC for IgG a temperature of T = 716 degC and for clusterin a melting point of T = 467
degC This means that the denaturation temperature of clusterin is below the temperature
Results and Discussion 95 that is used for heat inactivation of serum while the corresponding points of HSA and IgG
are above The unfolding point for human serum albumin is in good agreement with the
literature Barone at al determined the mid-point denaturation temperature of HSA in 02
M Tris-HCl (pH = 73) using differential scanning calorimetry (DSC) to be at Td = 337 K
(6385 degC)140 Vermeer et al reported two transition temperatures for IgG A lower
transition temperature of the Fab segments at T = 61 degC and a higher transition state at T =
71 degC for the Fc segment of IgG141 The second transition temperature is in good
agreement with the detected denaturation temperature of T = 716 degC using DSF Arising
from Figure 54C the denaturation or unfolding of IgG starts at ~ 65 degC which is in good
agreement with the unfolding temperature of Fab This indicates that both processes
merge Nevertheless both transition temperatures are above the used temperature of 56
degC for serum inactivation As no precipitation occurs during heat inactivation the
compositions of native and inactivated serum should be identical Only the degree of
distinct protein denaturation differs This leads to the assumption that the absence of
clusterin in the protein pattern in Figure 53 is originated only in the lack of interactions
between unfolded protein and particle while clusterin in the native state has a high
affinity to the same nanomaterial The observed denaturation temperatures for HSA and
IgG are also in good agreement with the results observed from LC-MS Both proteins are
not unfolded during heat inactivation of serum and are enriched in the corona of PS-NH2
(Table 13B)
The difference in protein-corona formation with or without heat inactivation is also
mirrored by the zeta potential of the coated particles (see Table 14)
Table 14 Zeta potential of the different polystyrene particles without incubation and after incubation in native or heat inactivated pooled human serum
96 For all coated particles after incubation in native pooled human serum a more negative
surface charge could be detected than for the ones incubated in heat inactivated pooled
human serum In addition the zeta potentials of the coated particles in inactive human
serum differ while the ones of coated particles in native serum are similar in a range
between ζ = - (210 ndash 235) mV After incubation in inactive human serum the zeta
potentials of PS and PS-NH2 particles show values of ζ = -141 mV for PS or rather ζ = - 157
mV for PS-NH2 that are significant higher than the value for PS-COOH particles (ζ = - 203
mV) There are two possible explanations for the observed phenomenon On the one
hand the differences in zetapotential could be originated in a stronger impact of initial
surface change of the ldquonakedrdquo particles on protein adsorption On the other hand it is also
possible that the formed protein coronas on the polystyrene particles are not able to
mask the initial surface charge completely
These interesting results lead to the question whether this causes a change of stability
against aggregation of the PS particles in the serum pool as well Figure 55 compares the
observed size increases determined by DLS of the three particles under investigation when
introduced into native or rather heat inactivated pooled human serum
Figure 55 Size increase of the polystyrene particles in native or heat inactivated human serum pool obtained by DLS in comparison with the size increase in native human serum pool after coating with inactive human serum pool
All three particles under investigation showed a difference in aggregation behavior While
non-functionalized polystyrene showed a slightly pronounced size increase in heat
inactivated serum compared to the one in native serum PS-COOH and PS-NH2 formed
Results and Discussion 97 smaller species with size increases in the range between + 78 (PS-COOH) and + 65 (PS-
NH2) This lead to the question whether a pre-coating with heat inactivated serum pool
could lead to stabilization against aggregation of the functionalized PS-particles when
introduced into native serum The results are also shown in Figure 55 (denoted as ldquoin +
activerdquo) Interestingly the pre-coating lead to a size increase that is even bigger than for
the uncoated particles This effect was most obvious for PS-COOH
In conclusion the protein corona of the PS-particles under investigation strongly depends
on the preparation of pooled human serum prior to use Clusterin which is high abundant
in the protein corona of PS and PS-NH2 after incubation in native human serum pool
completely disappears when the serum pool is heat inactivated prior to incubation The
denaturation of proteins upon heat inactivation leads to conformal changes of the
proteins that also cause changes in their properties This results in a change of stability
against aggregation of the particles under investigation but pre-coating cannot stabilize
the particles against the same when re-introduced in native serum The results presented
in this chapter underline the already discussed strong dependency between serum
composition and the interactions of nanomaterials exposed to them Despite not leading
to full stability against aggregation in pooled human serum of polystyrene particles when
precoated with inactivated serum the data presented in this chapter demonstrate that
the heat inactivation of a given protein source alters its interactions with nanomaterials
This way the heat inactivation is another suitable tool for the adjustment of a
nanomaterialacutes physicochemical properties
345 DILUTION AS A TOOL FOR PRE-COATING OF NANOPARTICLES
As already shown in chapter 322 the amount of proteins per given surface area of
nanomaterial plays a critical role when looking at stability against aggregation The
amount of present proteins in chapter 322 was varied by the dilution of plasma The
question arose whether the dilution of proteins plays a role even when the amount of
proteins per m2 surface area is kept constant With this the equilibrium between
associated proteins on the particle surface and dissociated proteins in solution is
influenced It was monitored whether this shift critically affects the stability against
98 aggregation and the resulting size increase of polystyrene particles In addition the
resulting spatial separation of particles upon dilution was assumed to decrease
interactions with each other like clotting As the precoating procedure already qualified
for particle stabilization the approach was adapted to the coating of PS particles under
diluted conditions DLS was used to investigate whether this precoating also leads to a
stabilization of particles under investigation under physiological conditions To address
this question Lutensol stabilized PS-COOH and PS-NH2 were introduced in pooled human
serum at a constant ratio of 5x10⁻³ m2 per mg serum The overall mixture was diluted 12
15 and 110 The results for stability evaluation against aggregation of each nanoparticle
are shown In Figure 56
Figure 56 A) Size increase of PS-COOH in concentrated as well as diluted human serum obtained by DLS together with the scattering intensity of particle or rather aggregate at Θ = 30deg B) Size increase of PS-NH2 in concentrated as well as diluted human serum obtained by DLS together with the scattering intensity of particle or rather aggregate at Θ = 30deg
For PS-COOH nanoparticles an aggregate formation could be detected in the
concentrated particleserum-mixture and dilution up to 15 For a tenfold dilution no
aggregates could be detected anymore The size of the formed aggregates does not
diversify that much but the intensity contribution of the different species within the
respective mixture to the overall scattered light shows a trend With stronger dilution the
intensity contribution of aggregates declines while the ones of the particles increase The
Results and Discussion 99 same phenomenon was observed for PS-NH2 nanoparticles In addition no aggregate
formation could be observed for a fivefold dilution The absence of aggregation for diluted
samples was utilized for coating of the respective particles PS-COOH nanoparticles were
incubated in serum pool in tenfold dilution PS-NH2 nanoparticles in five- and tenfold
dilution Afterwards the coated particles were introduced into concentrated pooled
serum and investigated in regards of stability against aggregation
Figure 57 shows the ACFs at Θ = 30deg of uncoated PS-COOH and PS-NH2 nanoparticles in
the concentrated human serum pool in comparison to the coated ones For all samples
aggregates were observed that represent as significant size increases Therefore it can be
reasoned that dilution is not a suitable tool for pre-coating of polystyrene particles when
it comes to stability against aggregation
Figure 57 ACF at Θ = 30deg of A) PS-COOH in serum pool as concentrated mixture B) PS-COOH in serum pool as diluted mixture 12 C) PS-COOH in serum pool as diluted mixture 15 D) PS-NH2 in serum pool as concentrated mixture and E) PS-NH2 in serum pool as diluted mixture 12 obtained by dynamic light scattering D) Summary of determined aggregate radii and the corresponding size increase
100 By dilution the equilibrium between associated and dissociated proteins at the particle
surface is shifted In addition the particles in higher dilution are in bigger distances to
each other This way the possibility of interaction that leads to agglomeration is
decreased The results presented show that with increasing distance of PS particles to
each other the dimension of aggregate formation decreases Although a pre-coating did
not lead to stabilization of PS-COOH and PS-NH2 nanoparticles under concentrated
conditions the dependence of aggregation and dilution could be of great interest for
experiments that strongly depend on particle size like cellular uptake studies
346 SUMMARY
This chapter focussed on the consequences on particle stability and protein corona
formation upon a fluctuation in blood serum composition Many approaches were
introduced that should overcome the aggregation or size increase of particles in pooled
human serum In the style of pre-coating nanoparticles with certain stabilizing protein
mixtures that was already introduced in chapter 32 the incubation in individual sera
causing no size increases was utilized for the stabilization of polystyrene particles in
human serum pool Even though the same goal could not be achieved by pre-coating in
heat inactivated serum the method also demonstrated the strong correlation between a
protein sourceacutes composition and the interactions with particles Again new opportunities
for the adjustment of physicochemical parameters of nanomaterials were introduced
Results and Discussion 101
35 THE TRANSFER OF A PROTEIN CORONA
In order to increase the blood circulation time of a nanocarrier designed for biomedical
application protein-repellent polymers have been used for surface modification Recently
it has been shown that materials like poly (ethylene glycol) (PEG) show reduced protein
adsorption but that the presence of distinct proteins is necessary to prevent non-specific
cellular uptake107 These so-called ldquostealthrdquo materials possess prolonged blood-circulation
time and avoid activation of the immune system This chapter focuses on the question
whether a formed protein corona on PEGylated materials can be transferred onto a
nanomaterial without PEG modification in order to stabilize it against aggregation and to
retain its cell uptake The principle of corona transfer is illustrated in Figure 58 A
nanomaterial A is used for the formation of a protein corona The protein corona
afterwards can be dissolved by the use surfactants like SDS for instance After removal of
particles A and surfactant the proteins can further be used in order to coat a
nanomaterial B
Figure 58 Illustration of protein corona transfer
351 THE STEALTH NANOCARRIER
A requirement for this study is a PEGylated nanomaterial that is stable against aggregation
in concentrated human plasma For that purpose PEG5000-NHS ester was used to modify
102 CTMA-Cl stabilized PS-NH2 particles via covalent attachment of the PEG molecules
Particle functionalization was performed by Thomas Wolf (PhD student AK Landfester
MPIP Mainz) After functionalization the particles were purified by subsequent
centrifugation (20000 g 1 h) and redispersion of the particle pellet thrice In addition the
dispersion was afterwards dialyzed against water with a cut off of MW = 50 kDa The
physicochemical parameters of the PEGylated nanoparticles as well as original PS-NH2
particles are shown in Table 15
Table 15 Physicochemical characterization of PS-NH2 (top) and purified PS-PEG5000
(bottom)
particle parameter PS-NH2
surfactant CTMA-Cl
groups per NP 3500
lt1Rhgtz-1 nm 51
ζ potential mV 334 plusmn 01
particle parameter PS-PEG5000
PEG chains particle 3000
solid content in mgmL 10
lt1Rhgtz-1 nm 67
ζ potential mV 129 plusmn 01
Results and Discussion 103 DLS was used to determine size as well as stability of the purified particles in concentrated
human plasma Figure 59 shows the results
Figure 59 A) Angular dependency of the inverse hydrodynamic radius of PS-PEG5000 obtained by DLS B) ACF at Θ = 30deg of PS-PEG5000 in concentrated human plasma including data points and force fit
The particle itself shows a relatively low polydispersity as indicated by the moderate
angular dependency of the hydrodynamic radius (see Figure 59) and remains stable
against aggregation when introduced in concentrated human plasma
The particle was then incubated in plasma in order to form a ldquostealthrdquo-protein corona
enriched with clusterin as previously described107 Table 16 shows the top 20 identified
proteins by LC-MS that are present in the particlesacute hard corona
As shown in Table 16 the ldquostealthrdquo corona contains mostly lipoproteins Clusterin makes
up over 50 of the total protein composition but also apolipoproteins A-IV A-I and E are
present in a significant manner This is in good agreement with the literature107
104 Table 16 Top 20 identified proteins of the protein corona formed on PS-PEG5000 upon
incubation in human plasma (LC-MS measurement was performed by Johanna Simon)
The protein corona was detached via SDS-addition and the surfactant removed via
subsequent use of the Piercereg Detergent Removal Spin Column The protein amount
before and after column use was determined In addition it was analyzed whether the
PEGylated particle can be recycled and reused for corona preparation Three cycles of
incubation and corona-detachment were carried out and the process monitored via SDS-
PAGE The particle recycling would offer the possibility of using the particles as a resin in
HPLC chromatography like the Protein A- or AF-Blue-column introduced in chapter 31
Figure 60 sums up the results
Results and Discussion 105 The zeta potential of PS-PEG5000 mirroring the surface charge changed significantly from
(+129 plusmn 01) mV to (-145 plusmn 01) mV after incubation in human plasma due to adsorption
of mostly negatively charged plasma proteins The protein patterns before and after
application of the Piercereg Detergent Removal Spin Column look similar In addition all
patterns exhibit the intense clusterin band at ~38 kDa (marked in red) and seem to be
largely identical Thus the desired protein corona pattern with the enrichment of clusterin
leading to potentially ldquostealthrdquo properties is achieved Also visible in the protein patterns
shown in Figure 60A are protein bands in the low molecular range between 6 and 14 kDa
These protein bands correspond amongst others to apolipoprotein C3 (~ 9 kDa)
Protein quantification determined 20 protein loss by removing SDS but according to
SDS-PAGE without significantly changing the protein composition The zeta potential of
coated PS-PEG5000 after the third cycle with a value of ζ = - (151 plusmn 07) mV is similar to the
one after the first cycle This means that protein adsorption takes place in a comparable
manner and offers the possibility of particle recycling
Figure 60 A) SDS-PAGE of human plasma with subsequent silver staining (1) the protein corona formed on PS-PEG5000 after incubation in human plasma with (2) and without (3) SDS the protein corona formed on the second use of PS-PEG5000 after incubation in human plasma with (4) and without (5) SDS and the protein corona formed on the third use of PS-PEG5000 after incubation in human plasma with (6) and without (7) SDS B) Zeta potential of uncoated PS-PEG5000 as well as of the coated ones after first and third use
106 NanoDSF was utilized in regards of protein denaturation for the investigation of the
ldquostealthrdquo corona after detachment from PS-PEG5000 and SDS removal Figure 61A shows
the auto fluorescence measured at 350nm Figure 61B the auto fluorescence measured at
330 nm and Figure 61C the ratio of both For all three examinations no protein unfolding
could be obtained This means that the proteins are fully denaturated after detaching
them from PS-PEG5000 using SDS
Figure 61 A) Fluorescence at 350 nm determined by nanoDSF of ldquostealthrdquo proteins B)
Fluorescence at 330 nm determined by nanoDSF and C) the 350330 nm ratio
determined by nanoDSF
352 CORONA TRANSFER
Especially for nanomaterials designed for biomedical applications a long blood circulation
time and stability against aggregation are desired The surface modification with protein
repellent polymers such as PEG is a time consuming process that needs several
purification steps subsequent to the particle synthesis itself In addition functional groups
at the nanomaterialacutes surface are needed for the covalent attachment of polymers that
limits the applicability In chapter 32 and 34 it was shown that the adsorption of
proteins on a nanomaterialacutes surface also alters its physiochemical properties The
adsorption takes place upon an (in comparison) simple incubation process of particles in
protein solution No functional groups for a covalent modification are needed during this
process what makes this approach applicable for a diverse and broad range of different
nanomaterials Since the ldquostealthrdquo properties of PEGylated polystyrene has recently been
shown to be depending on the presence of distinct proteins the question arose whether a
Results and Discussion 107 transfer of a formed ldquostealth coronardquo onto a foreign nanomaterial by adsorption is
possible and whether this adsorption changes the physicochemical properties of a
nanomaterial towards stability against aggregation and reduced non-specific cellular
uptake of macrophages As shown in chapter 344 the denaturation of proteins can lead
to changes in their interactions with nanomaterials This leads also to a change in
properties The question was addressed whether this has an impact on the ldquostealth
properties regarding cellular uptake as well
As transfer particle CTMA-chloride stabilized PS-NH2 particles (see Table 15 top) were
chosen as they were used for PEG modification as well Particles with a surface area of
005 m2 were introduced in 200 microg of protein dissolved in PBS After one hour free and
weakly bound proteins were removed via centrifugation and washing of the particle
pellet First it had to be analyzed whether protein adsorption on the transfer particle took
place at all This was done by using SDS-PAGE as well zeta potential measurement in order
to monitor changes in the particleacutes surface charge SDS-PAGE was used to study whether
proteins could be detected in the particlesacute hard corona and whether the pattern looks
similar to the one of PS-PEG5000 In addition zeta potential measurements were utilized
for detection of changes on the nanomaterials surface after incubation in protein solution
Figure 62 gives an overview of the results
First of all it has to be noted that proteins could be detected after incubation of PS-NH2 in
the proteins detached from PS-PEG5000 This means that despite of losing their tertiary
structure when SDS was used to detach the proteins from PEGylated polystyrene they
adsorb to amino-functionalized PS when being exposed to it This is also mirrored in the
significant change of the zeta potential of the respective particle after incubation The
protein pattern formed on PS-NH2 after incubation in corona proteins differs from the one
formed in full plasma The most abundant protein in the higher molecular range after
incubation in full plasma is albumin at 66 kDa (see Figure 62 band marked yellow in Lane
2) whereas the hard corona after incubation in ldquostealth-proteinsrdquo shows the most intense
band at ~38 kDa (see Figure 62 marked in red in Lane 3 and 4) in the higher molecular
range This is similar to the pattern of PS-PEG5000
108
Figure 62 A) SDS-PAGE of human plasma (1) the protein corona of PS-NH2 formed in human plasma (2) the protein corona of PS-NH2 formed in the ldquostealthrdquo proteins (3) and the ldquostealthrdquo proteins (4) B) Zeta potential of uncoated PS-NH2 as well as of coated PS-NH2 with ldquostealthrdquo proteins
The results so far show that the transfer of a protein corona in general is possible Going
one step further it was analyzed whether this artificially created protein corona can
enhance a particleacutes stability against aggregation when introduced in concentrated human
plasma
Figure 63A shows the DLS results for PS-NH2 (CTMA-Cl) introduced in concentrated
human plasma Strong aggregate formation could be observed with aggregates in the
microscopic size range Figure 63B shows the DLS results for PS-NH2 after coating with
ldquostealth proteinsrdquo Aggregate formation could not be completely prevented but the
dimension could be dramatically decreased and thus the particles were stabilized By pre-
coating the size increase of the respective particle when introduced into concentrated
human plasma could be decreased from 1300 to 120
Results and Discussion 109
Figure 63 A) ACF at Θ = 30deg of PS-NH2 in concentrated human plasma including data points (O) force fit (red) and fit with aggregate formation (blue) with the angular dependency of their inverse hydrodynamic radii B) ACF at Θ = 30deg of coated PS-NH2 in concentrated human plasma with the angular dependency of the obtained inverse hydrodynamic radii
The effect of the transferred protein corona was additionally investigated via cellular
uptake studies RAW 2647 macrophages were incubated with PS-NH2 (CTMA-Cl) with and
without prior pre-coating and compared to the uptake of PS-PEG Figure 64 gives the
results
While the protein corona formed on PS-PEG5000 leads to a reduced uptake compared to a
uncoated one (Figure 64 sample 1 vs sample 4) the inverse effect was observed for PS-
NH2 coated with the transferred protein mixture This leads to the conclusion that the
denaturation of proteins during SDS-treatment in order to detach them from the stealth
material plays a critical role during macrophage uptake The role of macrophages as part
of the immune system is to detect foreign or damaged material with subsequent cell
uptake in order to remove foreign material This could be an explanation for the increased
uptake of PS-NH2 decorated with the transferred protein mixture
110
Figure 64 Flow cytometry analysis of RAW 2647 cells incubated with nanoparticles 2 h in DMEM without additional proteins The pre-coated nanoparticles were isolated via centrifugation and added to the cells with a nanoparticle concentration of 20 microgmL Relative median fluorescence intensity (rMFI) values are shown as mean plusmn SD of triplicates (cell experiments were performed by Johanna Simon)
As a conclusion the transfer of a protein corona from stealth-materials to particles
without stealth modification is possible With this the stability of a particle against
aggregation in concentrated human plasma can be increased In addition the stealth
material can be recycled and reused opening new possibilities for protein purification via
chromatography However the correct protein folding is necessary for achieving a
ldquostealth effectrdquo in regards of reducing the cellular uptake while it is not needed for
stability against aggregation By this the chapter underlines again the importance of
protein structure on interactions with particles as was already demonstrated in chapter
344
Results and Discussion 111
36 EVALUATION OF DIFFERENT IN VIVO MODELS FOR BIOMEDICAL APPLICATION
The increasing interest on nanocarriers for biomedical applications becomes apparent in
the number of publications on nanomedicine that rose from ten (~1990) to more than
1200 per year (2004)142 Compared to that the number of nanotechnology-enabled
products currently on the market is very small (~38 in 2006)142 The evaluation process
that a nanomaterial has to undergo prior to becoming an accepted pharmacy-medicament
is very time consuming and includes several critical steps Animal models are often used
as non-human source in order to evaluate the potential nanomaterial prior to clinical trials
with humans143 These animal tests are even required before exposure to humans144
Nevertheless the transfer from in vivo to humans bears several challenges and
limitations145 146 Mak et al refers to that problem as ldquoLost in translationrdquo147 The murine
model is the most commonly used one for testing drug candidates prior to clinical trials148
Despite the very different morphology of mice compared to humans many factors
influence the outcome of in vivo trials For example Cabib et al showed that the outcome
of experimental results is also depending on background variables like the period of food
shortage149 Very recently Laganagrave and coworkers used LC-MS to investigate the protein
corona formed on different liposomal formulations after incubation in mouse or rather
human plasma Their findings reported suggest that results from in vivo animal models are
not mandatory conferrable to humans150
This chapter focusses on the transferability of different in vivo animal models to humans
Citrate stabilized plasma from different animals was analyzed and compared to human
plasma In addition protein particle interactions were studied via DLS and SDS-PAGE The
so far developed pre-in vivo screening methods should further be modified to increase the
understanding of possible differences between the outcome of in vitro in vivo
experiments and clinical trials
361 CHARACTERIZATION OF DIFFERENT BLOOD PLASMA SOURCES
Plasma from three typical in vivo models namely rabbit mouse and sheep was chosen
and compared to human plasma As a first step DLS was used to determine the three
different size fractions for each plasma source Figure 65 summarizes the results
112
Figure 65 A) Fluctuation of the different size fractions for the different plasma sources B) The corresponding ACF at Θ = 30deg C) Obtained values for the different size fractions from DLS
Each plasma source contains the already described three different size fractions The sizes
of each fraction as well as their relative intensity amplitude in vary a lot
Mouse plasma for example contains a lot of the biggest size fraction that is in addition
very large in size This results in the biggest inverse hydrodynamic radius
lt1Rhgtz-1 = 35 nm while sheep plasma has only a determined value of lt1Rhgtz
-1 = 12 nm
which is less than half of the size compared to the mouse plasma proteome One
explanation for this phenomenon can be the different nutrition of animals Cholesterol
and lipids for instance can be taken up with food and are part of the lipoproteins present
in plasma These lipoproteins can form big agglomerates like chylomicrons that are part of
the biggest size fraction Rh3 As DLS is very sensitive towards bigger species this can lead
to significant differences in observed size fractions and intensity contributions
The difference between each plasma proteome becomes also apparent by SDS-PAGE
Figure 66 gives the corresponding protein patterns Especially in the high molecular range
but also between 28 ndash 49 kDa differences in the protein patterns can be seen
Results and Discussion 113 Classification is possible for the most abundant protein bands that belong to serum
albumin at ~ 66 kDa (marked in red see Figure 66) and IgG at ~ 50 kDa for the heavy chain
or rather ~ 22 kDa for the light chain (marked in green see Figure 66) They can be found
in every plasma source In 2015 Pozzi et al investigated the plasma composition of
mouse and EDTA stabilized human plasma via LC-MS150 For human plasma 234 proteins
were identified for mouse plasma 354 As already indicated in the introduction SDS-PAGE
is limited in resolution Proteins with similar molecular weights co-migrate through the gel
and can therefore not be separated That makes it very difficult to identify single proteins
Nevertheless it is a suitable method for the comparison of different protein patterns
Figure 66 SDS-PAGE of human rabbit sheep and mouse plasma
For better resolution LC-MS was performed of the different plasma sources For human
as well as mouse plasma 100 proteins in total could be easily identified by our setup For
114 rabbit plasma 35 and for sheep plasma 15 proteins in total could be identified due to
smaller databases Therefore the percentaged amount of the TOP 20 identified proteins
does not mirror the actual plasma composition of rabbit and sheep Nevertheless the
most abundant proteins could be identified Table 17 shows the TOP 20 identified proteins
obtained by LC-MS in human and mouse plasma Table 18 the corresponding results for
sheep and rabbit plasma
Table 17 Top 20 identified proteins in human and mouse plasma (LC-MS measurement
was performed by Johanna Simon)
Results and Discussion 115 In comparison to human plasma the mouse plasma under investigation contains less
albumin (~ 7 marked in red Table 17) and much less immunoglobulins (marked in
yellow Table 17) Both protein classes belong to the smaller globular proteins that make
up the three different size fractions DLS can detect The described deviation between
human and murine plasma therefore is amongst others one factor that leads to the shift
of the mouse ACF to longer correlation times (see red data points Figure 64)
Table 18 Top 20 identified proteins in rabbit and sheep plasma (LC-MS measurement was
performed by Johanna Simon)
Due to the smaller numbers of identified proteins in sheep as well as rabbit plasma the
detected amount of the most abundant protein albumin is very high in both plasma
116 sources according to LC-MS (see Table 18) For rabbit plasma the very high amount of
~ 70 is somehow traceable and fits the protein pattern obtained with SDS-PAGE (see
also Figure 65) But for sheep plasma a high variety of protein bands were obtained by
SDS-PAGE (see Figure 65) Therefore it can be assumed that the high percentaged amount
of albumin obtained via LC-MS is mostly originated in the small amount of only 15
identified proteins
The differences in blood plasma composition can have many origins Next to the apparent
different genotype the protein composition in blood is also influenced by outer terms and
conditions This can be physical stress during welfare or the nutrition but also injuries
Proteins of the acute phase are for example expressed in an increased manner in the
latter case
The impact of these different plasma proteome compositions on particle stability was
addressed in the next steps
362 INVESTIGATION OF PROTEIN-PARTICLE INTERACTIONS
The three different and already described Lutensol stabilized polystyrene nanoparticles
(see chapter 322) were introduced in each plasma source and their stability against
aggregation investigated by using DLS Figure 67A summarizes the observed size increase
of PS PS-COOH and PS-NH2 in human mouse rabbit and sheep plasma
Results and Discussion 117
Figure 67 A) Observed size increases in of the different PS-particles after exposure to human mouse rabbit and sheep plasma B) Zeta potential of uncoated PS-particles as well as coated particles in the different plasma sources under investigation
In general the size increase of each particle depends a lot on the plasma source it is
introduced into Non-functionalized PS nanoparticles for example forms aggregates in
sheep plasma that are 166 bigger than the original species while the same particle
increases only 14 in size when introduced into mouse plasma A second direct
observation can be made from Figure 67A Independent of the functionalization of the
three different polystyrene particles under investigation their size increases in rabbit
plasma are very similar and in comparison to the ones in other plasma sources low This
indicates on the one hand that the protein corona formation in rabbit plasma is not
depending on the surface charge of the polystyrene particles under investigation in a
strong manner On the other hand it also means that proteins present in the corona
formed in rabbit plasma do not lead to a pronounced aggregation behavior
In addition the change of surface charge of each particle after incubation in every plasma
source was monitored (Figure 67B) Due to the fact that most plasma proteins are
negatively charged the measured zeta potential again becomes negative after hard-
corona formation Small differences between the animal models can be observed
After incubation in human plasma the values for zeta potential are most negative in the
range between -32 and -38 mV while the values after incubation in sheep plasma are
around -26 mV This could be relevant for cellular uptake and hence the body distribution
118 SDS-PAGE was used in order to identify the protein patterns of the particlesacute hard corona
that were formed after incubation in the plasma sources under investigation Figure 68
shows the corresponding SDS-PAGE patterns
Figure 68 A) SDS-PAGE of the protein coronas formed on PS PS-COOH and PS-NH2 during incubation in human or mouse plasma B) SDS-PAGE of the protein coronas formed on the respective particles during incubation in sheep or rabbit plasma
For each particle specific protein patterns can be identified that are present in the
respective hard-corona independent of the plasma source used for incubation Two of
these examples are marked in blue One very abundant protein band is visible at ~66 kDa
that probably corresponds to albumin A second abundant protein band is detected
between 38 and 48 kDa But also very significant differences can be observed These
differences concern all particles or only one particle when comparing the different animal
models Relevant for all particles is the presence or absence of clusterin at ~38 kDa This is
marked with horizontal red arrows This protein is highly abundant for the protein coronas
formed in human or sheep plasma but absent or only low abundant after incubation in
mouse and rabbit plasma Two additional differences only concern PS-COOH These ones
Results and Discussion 119 are marked with vertical red arrows While the protein patterns have abundant bands at ~
28 kDa in mouse human and rabbit plasma the band is absent after incubation in sheep
plasma This is interesting as the existence of the corresponding protein can be seen in
the patterns of PS and PS-NH2 after incubation in the latter plasma source The second big
difference is a protein band at ~ 98 kDa that is very weak in the protein pattern of PS-
COOH after exposure to rabbit plasma while it is intense in all other animal models
From Figure 68 it becomes clear that there are big differences when comparing different
animal models for in vivo application These differences can not only be related to the
animal model itself as the example of PS-COOH shows
Secondary the type of particles for this study was broadened Bionized nanoferrite (BNF)
particles with a shell of either crosslinked hydroxyethyl starch (HES) or dextran (DEX) were
investigated in terms of transferability from the different in vivo models to humans
Figure 69 Schematic structure of BNF-Starch and BNF-Dextran
120 The validated method of DLS was used to investigate the stability of both particles against
aggregation when introduced into the different plasma sources Table 19 summarizes the
results and Figure 70 or rather 71 show the corresponding ACFs of particleprotein
mixtures The differences are significant Both particles show distinct aggregate formation
in human and sheep plasma with sizes in the micrometer range In direct comparison the
formed aggregates in mouse and rabbit plasma are much smaller
Table 19 Aggregate sizes formed in the different blood plasma sources obtained by DLS
Figure 70 ACF at Θ = 30deg for BNF-DEX in human mouse sheep and rabbit plasma
Results and Discussion 121
Figure 71 ACF at Θ = 30deg for BNF-HES in human mouse sheep and rabbit plasma
Figures 70 and 71 show that huge differences for aggregate formation can be observed
within the discussed in vivo models Especially the significant discrepancy between mouse
and human plasma implies difficulties as the mouse model is often chosen for
experiments that depend on particleaggregate size like body distribution or cellular
uptake
The hard corona formation of BNF-DEX and ndashHES was analyzed by SDS-PAGE and zeta
potential measurements Figure 71A shows the respective protein patterns and Figure
71B gives an overview of particle surface charge
122
Figure 72 A) SDS-PAGE of protein coronas formed on BNF-HES and ndashDEX during incubation in human mouse sheep and rabbit plasma (performed by Johanna Simon) B) Zeta potential of uncoated as well as coated particles in the different plasma sources under investigation
Arising from Figure 72A the protein patterns of BNF-DEX and BNF-HES are very similar
after incubation in a respective protein source This can be related to the fact that both
surfaces are composed of related sugar structures and do not differ much in polarity The
polarity of surfaces is of great importance when it comes to protein adsorption as already
described in the introduction part But again differences between the different animal
models can be observed The protein patterns formed during incubation in mouse and
rabbit plasma look very similar This is interesting concerning the less distinct aggregate
formation of BNF-DEX and ndashHES in both The marked protein bands in Figure 72A are
typically observed in many protein patterns and can therefore possibly be related to
distinct proteins The protein band at ~ 45 kDa (marked in light blue see Figure 72A)
could correspond to apolipoprotein A-IV The protein band at ~66 kDa (marked in green
see Figure 72A) is typical for albumin adsorption In the lower molecular range at ~ 9 kDa
(marked in purple see Figure 72A) and ~ 28 kDa (marked in yellow see Figure 72A)
protein bands related to potential apolipoprotein C3 or rather apolipoprotein A-I can be
observed The protein band marked in red (see Figure 72A) at a molecular weight of ~ 56
kDa might correspond to the gamma chain of fibrinogen Like in the previously discussed
Results and Discussion 123 chapter 34 the composition of protein source used for corona formation critically
determines its compostion
The differences observed for the particlesacute surface charge before and after incubation
mirrored by the zeta potential in Figure 72B are smaller than the so far described ones for
polystyrene particles One explanation could be the reduced amount of adsorbed proteins
calculated from Pierce 660 nm Assay For the surface area of 005 m2 only 13-43 microg of
proteins adsorbed Compared to the values in chapter 623 this corresponds to only
~ 10 of the amount found for PS-NPs This can be related to the surface character as
well HES and DEX are rather hydrophilic while polystyrene is hydrophobic As the main
driving forces for protein adsorption are hydrophobic interactions more proteins adsorb
onto the latter ones
In conclusion the different plasma composition of the investigated in vivo models leads to
differences in plasma protein induced aggregation of nanoparticles These differences
vary from one to another model system and cannot be generalized but at least for BNF-
HES and ndashDEX similar trends have been evaluated
This means that for ideal characterization of particles used in vivo or rather in vitro their
stability against aggregation should be evaluated in the plasma of the used animal model
and in addition in human plasma Only when investigating the protein corona formation in
both animal model as well as human plasma a transfer is possible
Together with the results presented in chapters 32 and 33 an extensive evaluation
process for nanocarriers designed for biomedical applications prior to in vivo experiments
was demonstrated Light was shed on different aspects that could critically affect the
success of designed nanomedicines With this the biological identity a nanomaterial
adapts upon application can be predicted in an improved manner and also adjusted by
different coating procedures
124
37 FROM THE MODEL SYSTEM TOWARDS LIPOSOMES FOR BIOMEDICAL APPLICATION
So far the interactions of polystyrene particles as a model system with human blood
plasmaserum proteins has been investigated in order to obtain a better understanding of
the various factors that have an impact on protein-corona formation In addition the
transferability from in vivo models towards the human plasma was analyzed The next
study changes from the model system of PS-lattices towards liposomal formulations for
biomedical application
In chapter 371 the development of stealth liposomes is focused A novel hyperbranched
polyglycerol was evaluated as alternative for PEG Despite the prolonged blood circulation
times that are usually achieved with PEGylation of nanocarriers there are still some
drawbacks Due to its linear structure the polymer contains only one terminal hydroxyl
groups that can be used for modification with for instance antibodies It will be
demonstrated that the novel hyperbranched structure outplays PEG in terms of liposome
stabilization against aggregation
In chapter 372 the gained insights into liposome stabilization from chapter 361 will be
utilized for the development of liposomes containing a novel cationic spermine derivative
The novel compound was investigated in regards of complexation properties for siRNA
The liposomal formulations were optimized regarding their stability and investigated in
vitro as well as in vivo for the delivery of siRNA to the liver of mice It will be demonstrated
that the system showed promising results in vitro and in vivo for liver accumulation and
knockdown efficiency
371 EVALUATION OF MULTIFUNCTIONAL LIPOSOMES IN HUMAN BLOOD SERUM BY DYNAMIC LIGHT SCATTERING
This chapter focusses on the development and characterization of ldquostealthrdquo liposomes
modified with a novel hyperbranched polyglycerol lipid (Cholesterol-PEG30-hbPG23) An
emphasis was placed on the stability of these liposomes in comparison to those containing
a linear PEG derivative (Cholesterol-PEG44) directly in human blood serum characterized
via dynamic light scattering (DLS) The results presented have already been published and
are reprinted (adapted) with permission from (ldquoEvaluation of Multifunctional Liposomes in
Results and Discussion 125 Human Blood Serum by Light Scatteringrdquo Mohr et al Langmuir 2014 30 14954-14962)
Copyright copy 2014 American Chemical Society
Cholesterol as a natural membrane component has been widely used for the preparation
of liposomes and as an anchor for polymeric lipids in lipid bilayers151 Here cholesterol
was used as the initiator for the oxyanionic polymerization of various epoxides leading to
Ch-PEG44 and Ch-PEG30-hbPG23 because standard phospholipids could not be used due to
their instability to extreme reaction conditions during the reaction This technique allows
for the synthesis of well-defined amphiphilic polyether-lipids with molecular weights in
the range of conventional PEG-lipids used in sterically stabilized liposomes (2300 g mol-1
and 3400 g mol-1) and low polydispersities (MwMn 11 and 116 respectively) The
structures of Ch-PEG44 and Ch-PEG30-hbPG23 are shown in Figure 73 The synthesis of Ch-
PEG and Ch-PEG-hbPG was done by Dr Sophie Muumlller (AK Frey Johannes Gutenberg
University Mainz 2014)
Figure 73 Molecular structures of the cholesterol-based amphiphilic lipid ananlogues Reprinted (adapted) with permission from (ldquoEvaluation of Multifunctional Liposomes in Human Blood Serum by Light Scatteringrdquo Mohr et al Langmuir 2014 30 14954-14962) Copyright copy 2014 American Chemical Society
The red PEG-part (left) represents the linear architecture of the Ch-PEG44 amphiphile The
blue hydrophilic part (right) is the hyperbranched (hb) structure of the linear-hbPG lipid
which exhibits higher steric hindrance than its linear PEG analogue due to the globular
structure of the hyperbranched block
126
Figure 74 Cartoon of PEGylated liposomes Reprinted (adapted) with permission from (ldquoEvaluation of Multifunctional Liposomes in Human Blood Serum by Light Scatteringrdquo Mohr et al Langmuir 2014 30 14954-14962) Copyright copy 2014 American Chemical Society
Liposomes based on cholesterol and egg phosphatidylcholine (ECC) with variable content
of either the linear of hyperbranched PEG-derivative (see Figure 73) were prepared via the
thin film hydration method and extrusion technology (400 and 100 nm membranes) Table
20 gives the exact compositions of the liposomes that were under investigation
Table 20 Different molar ratios used for the preparation of sterically stabilized liposomes with L = liposomes Reprinted (adapted) with permission from (ldquoEvaluation of Multifunctional Liposomes in Human Blood Serum by Light Scatteringrdquo Mohr et al Langmuir 2014 30 14954-14962) Copyright copy 2014 American Chemical Society
L0
L10
-hb
PG
L10
-PEG
L15
-hb
PG
L15
-PEG
L20
-hb
PG
L20
-PEG
L30
-hb
PG
L30
-PEG
Ch-PEG44mol 0 0 10 0 15 0 20 0 30
Ch-PEG30-hbPG23mol 0 10 0 15 0 20 0 30 0
EPCmol 55 55 55 55 55 55 55 55 55
Results and Discussion 127 All liposomes were characterized via DLS in isotonic salt solution The z-averaged
hydrodynamic radii are summarized in Table 21 The angular dependency of the inverse
apparent hydrodynamic radius for all liposomal systems is shown in the literature21
Conventional liposomes (L0) without a polymer shell showed a radius of lt1Rhgtz -1 = 115
nm PEGylated liposomes with polymer contents between 10-30 mol had radii between
144 nm (L10-PEG) and 92 nm (L30-PEG) indicating that increasing the polymer content
resulted in a slight decrease in the size of the structures Liposomes containing Ch-PEG30-
hbPG23 exhibited radii between 81 nm (L15-hbPG) and 102 nm (L30-hbPG) and a
correlation between the radii and polymer content was not observed However the
detected sizes of the liposomes are generally smaller than those with linear Ch-PEG44
which may be attributed to a stronger effect on the liposome curvature by the bulky
hyperbranched segments
Table 21 Summary of the z-averaged hydrodynamic radii of all investigated liposomes Reprinted (adapted) with permission from (ldquoEvaluation of Multifunctional Liposomes in Human Blood Serum by Light Scatteringrdquo Mohr et al Langmuir 2014 30 14954-14962) Copyright copy 2014 American Chemical Society
L0
L10
-hb
PG
L10
-PEG
L15
-hb
PG
L15
-PEG
L20
-hb
PG
L20
-PEG
L30
-hb
PG
L30
-PEG
lt1Rhgtz
-1 nm 115 97 144 81 120 96 112 102 92
128
Figure 75 Cryo-Tem images of three different liposomes Reprinted (adapted) with permission from (ldquoEvaluation of Multifunctional Liposomes in Human Blood Serum by Light Scatteringrdquo Mohr et al Langmuir 2014 30 14954-14962) Copyright copy 2014 American Chemical Society (performed by Kristiane Rusitzka Biology Department Johannes Gutenberg University Mainz)
Cryo-TEM measurements of liposomes with the different polymers incorporated showed
the existence of vesicular structures and the successful formation of primarily unilamellar
assemblies As an example Figure 75 depicts the respective images for EPCcholesterol
liposomes with (15 mol Ch-PEG44 (B) or Ch-PEG30-hbPG23 (C)) or without polymer (A) The
non-stabilized (conventional) liposomes formed both spherical and non-spherical vesicles
whereas sterically stabilized liposomes predominantly showed spherical vesicles with a
narrower size distribution Additionally it was observed that the conventional liposomes
tended to overlap possibly aggregate whereas those that were stabilized by polymers
maintained spatial separation
It is imperative to characterize the aggregation behavior of any potential drug carrier in
human blood serum so the functionalized liposomes were analyzed by DLS Size changes
can be either caused by liposome-liposome bridging or by the formation of a protein
(multi-)layer at the liposome surface Since the investigation of L0 resulted in macroscopic
precipitation it was not possible to investigate these interactions with dynamic light
scattering Figure 76 gives an overview of the multicomponent analysis of the different
PEGylated liposomes in human blood serum
Results and Discussion 129
Figure 76 Liposomes containing Ch-PEG44 in human serum A) L10-PEG B) L15-PEG C) L20-PEG and D) L30-PEG ACF at Θ = 30deg including data points force fit (red) and aggregate fit (blue) Reprinted (adapted) with permission from (ldquoEvaluation of Multifunctional Liposomes in Human Blood Serum by Light Scatteringrdquo Mohr et al Langmuir 2014 30 14954-14962) Copyright copy 2014 American Chemical Society (measurements performed by Dr Kristin Mohr Max Planck Institute for Polymer Research Mainz)
There is aggregation for the PEGylated liposomes when they are introduced into human
blood serum with RhAgg = 330 nm (10 mol lipid) but the size of the aggregates decreased
(170 nm) as the amount of Ch-PEG44 (30 mol) was increased These values are much
smaller than those for unmodified liposomes which formed macroscopic aggregates and
demonstrated the stabilizing and shielding effects of the Ch-PEG44 on the assemblies
Yet liposomes stabilized with Ch-PEG30-hbPG23 showed an even better result when mixed
with human blood serum where the liposomes had no significant increase in their size in
DLS The corresponding ACFs are shown in the Figure below (Figure 77)
130
Figure 77 Liposomes containing Ch-PEG33-hbPG23 in human serum A) L10-hbPG B) L15-hbPG C) L20-hbPG and D) L30-hbPG ACF at Θ = 30deg including data points force fit (red) and aggregate fit (blue) Reprinted (adapted) with permission from (ldquoEvaluation of Multifunctional Liposomes in Human Blood Serum by Light Scatteringrdquo Mohr et al Langmuir 2014 30 14954-14962) Copyright copy 2014 American Chemical Society
To conclude it was the first time that the interaction between sterically stabilized
liposomes and human blood serum was investigated via dynamic light scattering (DLS)
This technique is a very sensitive method for the detection of aggregates and provides an
efficient tool to monitor their formation when polymer drug-delivery systems come into
contact with complex biological media In this work the behavior of two different kinds of
sterically stabilized liposomes was investigated containing either cholesterol-PEG44 or
linear-hyperbranched cholesterol-PEG30-hbPG23 with contents between 10-30 mol EPC
and cholesterol The systems were compared concerning their aggregation profile in blood
serum Liposomes containing Ch-PEG44 led to the formation of aggregates in the size range
between 170 nm to 330 nm (Rh) depending on the polymer amount while the
Ch-PEG30-hbPG23 modified liposomes were stable against aggregation despite the polymer
content Here the adsorption of plasma proteins is assumed to be less likely due to the
dense packing and multiple hydroxyl groups The results show the steric stabilizing effect
Results and Discussion 131 of the novel hyperbranched polyether lipids Thus based on the ability of hyperbranched
polyethers to minimize interactions between lipososomes and human blood serum their
relevance and potential advantages as drug delivery systems was demonstrated From the
data it is obvious that amphiphilic hyperbranched structures constitute a promising
alternative to PEGylated ldquostealthrdquo liposomes while showing favorable behavior in blood
serum and introducing multiple functional groups at the vesiclesrsquo surfaces
372 MULTICOMPONENT LIPOSOMES FOR SIRNA DELIVERY TO THE LIVER
This chapter focusses on the development of a liposomal system for siRNA delivery
consisting of cholesterol (Chol) distearoylphosphatidylcholine (DSPC) and surfactant TF
(1-hydroxy-50-amino-3471013161922-octaoxa-374145-triaza-pentacontane) a
novel spermine derivative (HO-EG8-C12-spermine) for improved siRNA delivery to cells in
vitro and in vivo The in vitro in vivo experiments were performed by Leonard Kaps
University medical center JGU The work presented in this chapter is already submitted as
full article2 The structure of TF is shown in Figure 78 It was synthesized by Dr Chai
Wenquiang (AK Schmidt Johannes Gutenberg University Mainz) It resembles an ABC
structure with A being the non-ionic hydrophilic PEG block B the hydrophobic alkyl middle
block and C the hydrophilic cationic spermine block The light yellow solid was
characterized by 1H NMR and mass spectrometry ESI-MS shows a single peak with a mass
to charge ratio of 73963 The amine groups of the spermine part were used to label the
surfactant TF with CW800-NHS ester The HPLC elugram showed exclusively the mono-
functionalized product (see Figure 79)
Figure 78 Chemical structure of surfactant TF
2 ldquoPhysicochemical and Preclinical Evaluation of Spermine-derived Surfactant Liposomes for in vitro and in
vivo siRNA-Delivery to Liver Macrophagesrdquo Laura K Muumlller Leonard Kaps Detlef Schuppanb Alexander Brose Chai Wenqiang Karl Fischer Sophie Muumlller Holger Frey Manfred Schmidt Kristin Mohr
132
Figure 79 A) 1H NMR of surfactant TF in CD3OD B) HPLC of dye cationic lipid TF and TF-
dye conjugate MN-HD8-column 12545microml T=20degC 10 min 595-1000
(THFwater+01TFA) (performed by Beate Muumlller AK Landfester MPIP)
This novel surfactant contains two hydrophilic head groups a cationic and a non-ionic
one that are interconnected by a C12 linker The surfactant was anticipated to combine
protein repellent characteristics of PEG with cationic charges required for siRNA
complexationencapsulation The surfactant TF was introduced into well-known liposomal
formulations (comprising cholesterol and DSPC) as a novel cationic component Moreover
the previously described hyperbranched lipid hbPG consisting of cholesterol as the
hydrophobic and a hyperbranched polyglycerol as the hydrophilic part was utilized since
it effectively provided steric shielding of liposomes against aggregate formation induced
by serum proteins The composition and absolute concentrations of all investigated
liposomes are given in Table 22
Table 22 Composition of investigated liposomes
Liposome L-110 L-111 L-112 L-114 L-114-hbPG
Weight ratio (CholDSPCTF) 110 111 112 114 114
Molar ratio (CholDSPCTF) 210 211 212 214 214
c(Chol) in EtOH (gL) 20 20 20 20 16
c(DSPC) in EtOH (gL) 20 20 20 20 20
c(TF) in EtOH (gL) 0 20 40 80 80
Ch-PEG22-hbPG35 in EtOH (gL) 0 0 0 0 36
c (total) in EtOH (gL) 40 60 80 120 152
c(total) in DPBS (gL) 087 133 133 133 133
c(TF) in DPBS (gL) 0 044 067 089 089
175 mol of cholesterol was replaced by hbPG corresponding to 5 mol hbPG of total lipid content
Results and Discussion 133 It is known that size and inner structure of liposomes are controllable by extrusion
through membranes ie by the pore diameter of the extrusion membrane72 and by the
extrusion speed Repeated extrusion through 50 nm pore size filters yielded mostly
unilamellar liposomes with a size range of 100-150 nm that is considered to be
appropriate for surpassing the fenestrated endothelium of liver cells All liposomes were
characterized by dynamic (DLS) and static light scattering (SLS) as well as by zeta potential
measurements (see Table 23 Figure 80) For the uncharged liposome L-110 the angular
dependence of both the apparent hydrodynamic radii lt1Rhgtapp and the reduced
scattering intensities ln(KcR) are very pronounced and curved downwards at low q
typically observed for samples with a very broad size distribution In contrast all other
samples exhibit linear dependencies of lt1Rhgtapp as function of q2 the slopes of which are
small but significantly larger than zero (expected for monodisperse spheres) Except for
samples L-110 the normalized second cumulants μ2 were determined to 01 lt μ2 lt 02
indicating moderately broad size distributions in qualitative agreement with the small
slopes of lt1Rhgtapp versus q2 The ρ-ratios defined by the ratio of the radius of gyration
(Rg) and the hydrodynamic radius (Rh) indicate the liposomes to form mostly unilamellar
vesicles that are also proven by cryo-TEM measurements (Figure 80)
Figure 80 Cryo-TEM images of A) L-111 loaded with siRNA and B) unloaded L-114-hbPG
(performed by Dr Max Bernhard3)
3 Dr Max Bernhard Ak Prof Dr Katharina Landfester 2015
134 The zeta potentials of all liposomes (see Table 23) are slightly negative despite the
presence of the cationic component TF Only the hbPG stabilized liposome exhibits neutral
charge At present these data cannot be properly explained It might indicate that the
spermine part of TF is predominantly located at the inner liposome surface although
simple volume considerations of spermine as compared to PEG8 do not necessarily
support this scenario
Table 23 Zeta potential DLS- and SLS-results of liposomes
liposome lt1Rhgtz-1
nm ltRg2gtz
12 nm ρ zeta potential mV
L-110 130 - - -98 plusmn 55
L-111 53 55 104 -53 plusmn 57
L-112 59 58 098 -
L-114 63 63 100 -77 plusmn 53
L-114-hbPG 63 63 100 13 plusmn 44
Could not be determined due to strongly curved Guinier plot
Figure 81 Angular dependency of the inverse hydrodynamic radius (A) and Guinier-plots (B) of liposomes
Results and Discussion 135 For further investigation the liposomal systems were analyzed by DLS regarding their
stability against aggregation in human blood serum by mixing equal volumes of liposome
and serum solution Figure 82 shows the corresponding ACFs including data points force
fit and fit in regards of aggregate formation
The stability of liposomes in serum depends strongly on their composition Liposomes
without incorporated cationic lipid formed aggregates in human serum with a size
Rh = 380 nm (measured at a scattering angle of 30deg) and contributed 56 to the total
scattering intensity From literature it is already known that liposomal formulations only
built up by cholesterol and phosphatidylcholines are not stable in biological environments
due to their similarity to naturally occurring lipoproteins60 When cationic lipid was added
to the liposomal formulation aggregation also took place but the size as well as the
contribution of the formed aggregates to the total scattering intensity decreased with
increasing amount of surfactant TF For example for liposome L-114 the aggregates in
human serum were significantly smaller (Rh = 195 nm) and contributed little to the total
intensity of the scattering (31)
As was shown before for liposomal formulations consisting of egg phosphatidylcholine
(EPC) and cholesterol the steric stabilization of liposomes by incorporation of
hyperbranched polyglycerol structures more effectively prevents aggregate formation in
human blood serum as compared to linear PEG surfactant Liposomes containing
PEGylated surfactant of up to 30 mol still showed aggregate formation in human serum
while those with 10 15 20 and 30 mol hyperbranched surfactant were stable Thus in
the present work 5 mol hyperbranched polyglycerol was added to the lipid mixture in
order to completely prevent aggregate formation in human serum as revealed by Figure
82
136
Figure 82 Autocorrelation functions of the different liposomal systems in human serum at 30deg and the respective aggregate size with its impact on the scattering intensity Red lines Force fit with the pure component correlation blue lines Fit with an additional aggregate term Residues of the respective fits are shown in the lower part of the graphs
When siRNA (anti-CD68) was dissolved in the aqueous phase prior to liposome formation
it was encapsulated to a very large extent by all liposomes ie between 81 and 97 as
proven by a Quant-iTTM RiboGreenreg assay (Table 24) As shown by cryo-TEM (see Figure
80) the siRNA loaded liposomes preserved their unilamellar structure Quantitative light
Results and Discussion 137 scattering results confirmed this observation since the ρ-ratios of liposomes loaded with
siRNA remained at values close to 1 (see Table 24 and Figure 83) Such high encapsulation
efficiencies are usually not achieved if the siRNA is just sterically trapped within the
vesicles Rather electrostatically driven complex formation is required to explain the high
siRNA load The latter scenario was also supported by the large NP ratio calculated from
the liposome composition Thus in the following the siRNA loaded liposomes are termed
lipoplexes
Table 24 Zeta potential DLS - SLS results and encapsulated amount of siRNA of loaded liposomes
liposome lt1Rhgtz-1
nm
ltRg2gtz
12
nm
ρ zeta
potential
mV
encapsulated
siRNA
NP
L-111 siRNA 52 48 092 -63plusmn68 97 17
L-112 siRNA 57 56 098 -37plusmn76 81 25
L-114 siRNA 61 58 095 -52plusmn96 90 34
L-114-hbPG
siRNA
si
62 - - -77plusmn59 90 34
Figure 83 A) Angular dependency of the inverse hydrodynamic radius of siRNA loaded liposomes B) Guinier-plots of siRNA-loaded liposomes
138 As shown in Figure 84 complex size and zeta potential were reproducible and did not
depend on the type of siRNA used
Figure 84 Zeta potential of L-111 in comparison to the zeta potential of L-111 loaded
with different types of siRNA
Prior to biological experiments the small but significant amount of free siRNA needs to be
removed by either dialysis and or by centrifugal filters Both methods were tested for
liposome L-111 and the results are shown in Figure 85 The size of the lipoplexes did not
change significantly during purification by centrifugal filters whereas the sizes decreased
by approximately 20 after dialysis Since application of centrifugal filter devices
decreased the free siRNA concentration to a lower level (01 as compared to 03 by
dialysis) this method was applied to all samples discussed below
Figure 85 Comparison of two different work-up procedures for L-111
Results and Discussion 139 Again the stability of lipoplexes against aggregation was evaluated by using dynamic light
scattering It was recently reported that aggregate formation of cationically charged
nanogels in serum depends on the siRNA loading ie aggregates were observed for bare
nanogels whereas no aggregates could be detected for siRNA loaded nanogels Thus a
direct comparison was made for liposomeslipoplexes L-114 and L-114-hbPG added to
pooled human blood plasma (see Figure 86) In contrast to Nuhn et al152 no significant
differences were observed between the bare liposomes and the lipoplexes loaded with
siRNA Again hbPG stabilized lipoplexes L-114-hbPG did not aggregate in plasma
whereas for L-114 lipoplex aggregates of Rh = 250 nm were detected that were in a
similar size range as those observed in serum
Figure 86 Correlation functions (recorded 30deg scattering angle) of liposomes and siRNA loaded liposomes in 50 human plasma A) liposome consisting of DSPC Chol and lipid TF B) liposome in A loaded with siRNA (NP = 34) C) liposome consisting of Chol DSPC TF and hb-PG D) liposome in C loaded with siRNA (NP = 34) Red lines Force fit with the pure component correlation function blue lines Fit with an additional aggregate ter Residues of the respective fits are shown in the lower part of the graphs
140 Prior to in vivo applications cytotoxicity and in vitro knockdown efficiency of lipoplex
L-114 was evaluated As shown in Figure 867a) L-114 lipoplexes loaded with scrambled
siRNA (scsiRNA) caused no in vitro cytotoxicity in MHS macrophages even at
concentrations corresponding to 600 nM siRNA that are far above the concentrations
required for in vitro or in vivo gene knockdown L-1-14 loaded with 100 nM anti-CD68
siRNA achieved a significant CD68 knockdown (40 vs the PBS control) in MHS cells
whereas L-114 lipoplexes loaded with scrambled siRNA (scsiRNA) revealed no effect
(Figure 87b))
Figure 87 a) Viability of MHS macrophages in response to increasing amounts of L-114 lipoplex loaded with scrambled siRNA normalized to PBS incubation time 24 h (n = 3) MEAN plusmn SD b) In vitro knockdown by L-114 (NP) loaded with anti-CD68 siRNA after 24 h scsiRNA negative control p lt 005 (n =3) MEAN plusmn SD (measurements performed by Leonard Kaps Medical department of the Johannes Gutenberg University Mainz)
Macrophages are a central part of the innate immune system expressing a variety of
danger sensing receptor such as the toll like receptors (TLRs) that are involved in anti-
bacterial and anti-viral immune defense L-114 loaded with antiCD68 siRNA did show a
robust knockdown at a reasonable siRNA concentration of 100 mM without signs of off-
target effects in vitro the liposomal formulations qualified for further investigations Both
lipoplexes L-114 and L-114-hbPG were tested in vivo to assess efficacy in macrophage
Results and Discussion 141 targeting and to elucidate potential effects of serum-induced aggregate formation on in
vivo performance
In vivo particle biodistribution studies require a detectable dye with an emission in the
near infrared (NIR) wavelength spectrum that is being less absorbed by tissue and blood
than emission in the visible range Therefore 5 mol of TF was replaced by CW800-
labeled lipid TF in both liposomal formulations
Mice (n = 3 per group) received two retroorbital injections 48 h apart of 1 or 2 mgkg anti-
CD68 siRNA loaded into L-114 or L-114-hbPG or an equivalent volume of PBS (Figure 88
top)
Figure 88 (bottom) shows the biodistribution of CW800 labeled L-114 and L-114-hbPG
lipoplexes at 0 1 3 6 24 and 48 h after injection At 0 to 6 h after intravenous injection
both lipoplexes displayed some disassembly since free NIR dye was cleared by the kidneys
and further ended up in the bladder However at 48 h the cleared dye accumulated
predominantly in the liver suggesting that stable lipoplexes are sequestered in the liver
while degraded lipoplexes are rapidly cleared via the kidney
142
Figure 88 Top) In vivo knockdown outline Mice received two retroorbital injections of 1 or 2 anti-CD68 siRNA encapsulated in L-114 or L-114-hbPG in vivo imaging period indicated above timeline Bottom) In vivo images system (IVIS) pictures of mice injected with 1 mgkg or 2 mgkg antiCD68 siRNA loaded in L-114 lipoplexes (left) or L-1-14-hbPG hbPG stabilized lipoplexe (right) labeled with CW800 near infrared dye at 0 1 3 24 and 48h (measurements performed by Leonard Kaps)
Results and Discussion 143
Figure 89 Ex vivo organ quantification of L-114 lipolplex (blue) and L-1-14-hbPG (red) labeled with near infrared dye 48 h after the second injection p lt 0001 MEAN plusmn SD (measurements performed by Leonard Kaps)
48 h after the second lipoplex injection organs were imaged ex vivo (see Figure 90) Such
ex vivo organ images allow a more accurate quantification of lipoplex biodistribution Both
the simple lipoplex L-114 and the hbPG derivatized L-114-hbPG lipoplex accumulated in
the liver in a dose-dependent manner with L-114-hbPG showing a higher signal (Figure
89) which may be due to their longer blood circulation time originating from better
stealth properties against in vivo serum protein interaction
144
Figure 90 IVIS pictures of ex vivo organs from mice that were injected with 1 mgkg or 2 mgkg antiCD68 siRNA loaded in L-114 or L-1-14-hbPG respectively labeled with near infrared dye 48h after injection (measurements performed by Leonard Kaps)
After the second injection of the lipoplexes liver macrophages (CD45+ F480+-cells) were
isolated and subjected to FACS analysis to determine the in vivo macrophage-specific
uptake of the lipoplexes 48 h after the second injection approximately 3-6 of both
lipoplexes were taken up to by liver resident macrophages (Figure 91) This dose-
dependent uptake of both lipoplexes is lower than that of siRNA loaded nanogels that
were recently investigated
The two lipoplex formulations loaded with two concentrations of anti-CD68 siRNA (1 and
2 mgkg siRNA) induced a significant in vivo knockdown of up to 70 while lipoplexes
loaded with scrambled siRNA did not show any off target knockdown (Figure 92)
Results and Discussion 145
Figure 91 In vivo liver resident macrophage uptake of L-114 lipoplex (blue) and L-1-14-hbPG lipoplex (red) labeled with NIR dye 48 h after the second injection MEAN plusmn SD (measurements performed by Leonard Kaps)
Figure 92 In vivo knockdown of the macrophage specific gene CD68 in the liver of mice that were injected twice with 1 mgkg or 2 mgkg anti-CD68 siRNA loaded into L-114 (blue) or L-1-14-hbPG lipoplexe (red) plt001 for anti-CD68 siRNA vs negative controls MEAN plusmn SD (measurements performed by Leonard Kaps)
146 The successful in vivo knockdown demonstrates a functional siRNA delivery of both
liposomal formulations in liver macrophages in vitro and notably in vivo Interestingly the
applied 1 mgkg dose appears to be equally potent as the 2 mgkg siRNA dose and lower
concentrations may still be effective
In conclusion it could be demonstrated that serum or blood plasma induced aggregate
formation of liposomes and liposome-siRNA complexes (lipoplexes) may be avoided if the
surface is sterically shielded by incorporation of appropriate lipids that contain a short
polymer chain In the present work aggregate formation could be completely suppressed
by introduction of a novel lipid consisting of a cholesterol anchor and hyperbranched
polyglycerol Simple and sterically shielded liposomes almost quantitatively encapsulated
siRNA at NP = 34 The resulting lipoplexes showed promising results in in vitro and in vivo
studies of liver accumulation and knockdown efficiency towards the macrophage-specific
CD68 mRNA Another important conclusion is that for the investigated lipoplexes
serumplasma induced aggregates of as large as 500 nm in size (Rh = 250 nm) increase
cellular uptake and have no detectable effect on knockdown efficiency Likewise no
obvious side effects were observed for mice during the experimental time of up to 96
hours
summary and outlook 147
4 SUMMARY AND OUTLOOK
Within this work effort was taken towards a better understanding of the interactions
between nanomaterials and proteins of the human plasma proteome A closer look was
taken on the gap between the synthetic and biological identity of nanomaterials that
limits the biomedical application of nanocarriers so far
The most abundant proteins HSA and IgG were removed from human blood plasma
effectively This allowed the investigation of the single proteins but more importantly also
of various low abundant protein mixtures Plain polystyrene as well as amino-
functionalized polystyrene particles have been coated with FPlasma-wo-IgG-HSA in order to
successfully prevent the particles from aggregation under in vivo conditions In addition it
turned out that those decorated particles also were taken up by macrophages very
weakly meaning that the introduced pre-coating could also prolong blood circulation time
when it comes to administration For carboxy-functionalized polystyrene particles the
stabilizating against aggregation was possible with IgG but the coating and subsequent
redispersion lead to an increase in size
FPlasma-wo-IgG that was also obtained by plasma fractionation could be used for particle
stabilization when used as surfactant during polystyrene synthesis While the aggregation
behaviour was comparable to Lutensol-stabilzed particles this offers the possibility of
passing on chemical surfactants completely
The concept of pre-coating nanoparticles in order to tune their stability against
aggregation was also utilized to overcome the fluctuation in the blood proteome
composition when looking at different individuals Once formed protein coronas on the
polystyrene particles under investigation remained stable even when re-introduced into
another protein source (in this case pooled human serum) This could be of special
interest for drug carrier preparation prior to administration
The above mentioned transfer of a protein corona was not only limited to the change
from one protein medium into another It was also possible to transfer the protein corona
that was formed on ldquostealthrdquo nanocarriers onto non-modified nanoparticles The transfer
was successful in order to stabilize a respective particle against aggregation but the
148 reduced cellular uptake that is characteristic for the ldquostealthrdquo effect could not be
achieved This could have originated in the denaturation of proteins when detaching them
from the particles with SDS The introduced method offers new possibilities for blood
plasma fractionation by resins that can be inserted into an HPLC system In addition the
possibility of corona transfer could be useful for nanocarriers that are not suitable for
surface modification with ldquostealthrdquo polymers
Light was shed on the gap between different in vivo models and humans The protein
corona formation and the stability of particles under investigation strongly depends on
the protein source that is used as a model Results shown in this work suggest that the
investigation of particles regarding their stability against aggregation in plasma of the used
in vivo in vitro model as well as in human plasma is necessary to obtain a full
understanding of the protein particle interactions
Liposomes for siRNA delivery in vivo were optimized regarding their stability in human
serum plasma by modifying their surface with a novel hyperbranched polyglycerol The
encapsulation efficiency for siRNA of the liposomal structures was excellent The resulting
lipoplexes showed promising results in knockdown efficiency towards the macrophage
specific CD-68 mRNA in vivo
Altogether this study throws light on different parameters effecting the protein corona
formation as well as protein-induced aggregation of nanoparticles Moreover suggestions
were introduced of how these interactions could be used in order to control a particles
response upon introduction in biological media
Experimental section 149
5 EXPERIMENTAL SECTION
51 LIST OF EQUIPMENT
Equipment Purchaser
ToyoScreen AF-rProtein A HC-650F tosohbioscience DE
ToyoScreen AF-Blue HC-650M tosohbioscience DE
ToyoScreen DEAE-650M tosohbioscience DE
Agilent Technologies 1200 series Agilent Technologies USA
UV-detector Agilent Technologies USA
Diode Array Detector Agilent Technologies USA
MN HD8 12545microm column Macherey-Nagel DE
Evaporative Lightscattering Detector 385-LC Varian USA
ALVCGS 3 ALV GmbH DE
ALV-5004 multiple tau full digital correlator ALV GmbH DE
ALV-CGS 8F SLSDLS 5022F goniometer ALV GmbH DE
ALV-7004 correlators ALV GmbH DE
QEAPD Avalanche photodiode detector ALV GmbH DE
ALV-5000 multiple tau full digital correlator ALV GmbH DE
Prometheus NT48 Nanotemper Technologies DE
HeNe-Laser JDS Uniphase USA
Liposofast Extruder Avestin Europe GmbH DE
Liposofast Stabilizer Avestin Europe GmbH DE
Polycarbonate membranes Avestin Europe GmbH DE
150
Gas tight syringe Avestin Europe GmbH DE
Branson W450 digital sonifier GHEINEMANN DE
JEM-1400 electron microscope JEOL DE
Zetasizer Nano Z Malvern Instruments GmbH DE
Muumltek particle charge detector BTG DE
Titrino Automatic Titrator Metrohm AG CHE
cLSM Leica SP5 II with CW-STED Leica DE
Flow cytometer CyFlow ML Partec DE
Plate Reader Infinite M1000 Tecan DE
Power Supply Bio-Rad USA
SDS-PAGE Chamber MiniGel Tank Lifetechnologies USA
nanoACQUITY UPLC Waters USA
Synapt G2-Si mass spectrometer Waters USA
Bruker Avance 300 Spectrometer Bruker Corporation USA
Jasco J-815 spectrometer JASCO USA
NuPAGE 10 BisTris Protein Gel Novex ThermoFisher Scientific USA
NuPAGE LDS sample buffer Novex ThermoFisher Scientific USA
NuPAGE sample reducing agent Novex ThermoFisher Scientific USA
NuPAGE MES SDS running buffer Novex ThermoFisher Scientific USA
SeeBlue Plus2 Pre-Stained Standard Invitrogen USA
Simply Blue SafeStain Novex ThermoFisher Scientific USA
SilverQuestTM Silver Staining Kit ThermoFisher Scientific USA
Piercereg 660 nm assay ThermoScientific USA
Experimental section 151
Piercereg Detergent removal Spin Column ThermoScientific USA
Quant-itTM RiboGreen Assay Invitrogen USA
BCA Protein Macro Assay Kit SERVA Electrophoresis DE
Millex-LCR450nm filter Millipore IRL
Millex-GS220nm filter MerckMillipore DE
52 METHODS
521 FRACTIONATION OF HUMAN BLOOD PLASMA
Dulbeccoacutes phosphate buffered saline (DPBS) without calcium and magnesium was
purchased from Gibcolifetechnologies Germany The human blood plasma (citrate
stabilized) was prepared according to standard guidelines was obtained from the blood
transfusion service at the University Clinic of MainzGermany and aliquots stored at -80 degC
before used Human Serum Albumin (HSA) as well as Trizmareg hydrochloride solution was
purchased from Sigma Aldrich USA The protein fibrinogen was purchased from Aventis
Behring and immunoglobulin G from privigenreg (10 solution CSL Behring USA)
For separation of IgG a ToyoScreen AF-rProtein A HC-650F column (1 mL
tosohbioscoience Germany) was used with 001M TrisHCl (pH=74) as running buffer
(RB) The column was run as recommended by the manufacturer at 3 bar which was
achieved with a flow rate of 05 mLmin Before loading a sample the HPLC system was
purged with running buffer for 30 min until the baseline was constant over time
The human plasma was diluted 13 and filtered with LCR 450 nm filters to remove possible
protein-aggregates To avoid overload only 05 mL of sample were loaded on the column
The maximum load was determined prior to use at 07 mL 13 diluted plasma which
corresponds to 23 mg IgG The flow through was collected between 60 s and 270 s After
waiting for several minutes 2 mL of 02 M citric acid were injected One minute after
injection IgG was collected for 2 min and the fraction neutralized with 330 microL 1M tris base
solution
152 For separation of albumin a ToyoScreen AF-Blue HC-650M column (5mL tosohbioscience
Germany) was used with the similar running buffer as described earlier Prior to use the
column was washed with 20 mL deuterium oxide as well as 20 mL 2M guanidine After
running the system for 30 min with running buffer (3 bar 05 mLmin) until the baseline
was constant over time 05 mL of 12 diluted plasma was injected in order to achieve a
concentrated flowthrough The flowthrough was collected between 400 and 1200 min
45 min after the injection of 7 mL 2 M NaCl albumin was collected for 6 min
For anion exchange chromatography a ToyoScreen DEAE-650M column (1 mL
tosohbioscience Germany) was used Plasma was diluted 110 and filtered with LCR 450
nm filters prior to use 05 mL of sample were loaded on the column and the flow through
catched between 1 and 4 min The flow through was recirculated two times The four
elution fractions were obtained by subsequent injection of 0155 M 03 M 05 M and 1 M
NaCl 01 mL each
Protein concentrations in human plasma as well as in different fractions were determined
with a BCA Protein Macro Assay Kit from SERVA electrophoresis Germany according to
manufacturer Absorption at 562 nm was measured with a Tecan infinite M1000
For SDS PAGE 65 microL of the protein sample was mixed with 25 microL NuPAGE LDS Sample
Buffer and 1 microL NuPAGE Sample Reducing Agent and applied onto a NuPAGE 10 Bis Tris
Protein Gel (all Novex Thermo Fisher Scientific USA) The electrophoresis was carried out
in NuPAGE MES SDS Running Buffer at 100 V for 2 h with SeeBlue Plus2 Pre-Stained
Standard (Invitrogen USA) as a molecular marker The gel was stained using SimplyBlue
SafeStain (Novex Thermo Fisher Scientific)
For LC-MS analysis (performed by Susanne Schoumlttler or Johanna Simon) proteins were
digested following the protocol of Tenzer et al122 with following modifications 25 microg of
each protein sample was precipitated and trypsin was used with a 150 ratio
(enzymeprotein) For LC-MS analysis the samples were diluted 10-fold with aqueous 01
formic acid and spiked with 50 fmolmicroL Hi3 EColi Standard (Waters Corporation Germany)
for absolute quantification Quantitative analysis of protein samples was performed using
a nanoACQUITY UPLC system coupled with a Synapt G2-Si mass spectrometer (Waters
Corporation) Tryptic peptides were separated on the nanoACQUITY system equipped
Experimental section 153 with a C18 analytical reversed-phase column (17thinspμm 75 μm x 150 mm Waters
Corporation) and a C18 nanoACQUITY Trap Column (5 microm 180 microm x 20 mm Waters
Corporation) Samples were processed with mobile phase A consisting of 01 (vv) formic
acid in water and mobile phase B consisting of acetonitrile with 01 (vv) formic acid The
separation was performed at a sample flow rate of 03 microLmin using a gradient of 2-37
mobile phase B over 70 min As a reference compound 150 fmolmicroL Glu-Fibrinopeptide
was infused at a flow rate of 05 microLmin
Data-independent acquisition (MSE) experiments were performed on the Synapt G2-Si
operated in resolution mode Electrospray Ionization was performed in positive ion mode
using a NanoLockSpray source Data was acquired over a range of mz 50-2000 Da with a
scan time of 1 s ramped trap collision energy from 20 to 40 V with a total acquisition time
of 90 min All samples were analyzed in two technical replicates Data acquisition and
processing was carried out using MassLynx 41 and TansOmics Informatics software was
used to process data and identify peptides Data were post acquisition lock mass
corrected Noise reduction thresholds for low energy high energy and peptide intensity
were fixed at 120 25 and 750 counts respectively During database searches the protein
false discovery rate was set at 4 The generated peptide masses were searched against a
reviewed human protein sequence database downloaded from Uniprot The following
criteria were used for the search one missed cleavage maximum protein mass 600 kDa
fixed carbamidomethyl modification for cysteine and variable oxidation for methionine
For identification a peptide was required to have at least three assigned fragments and a
protein was required to have at least two assigned peptides and five assigned fragments
Quantitative data were generated based on the TOP3Hi3 approach[32] Quantitative data
were generated based on the TOP3Hi3 approach[32] providing the amount of each
protein in fmol
154
522 FRACTIONS OF PROTEIN MIXTURE DIFFERENTIALLY AGGREGATE NANOPARTICLES AND INFLUENCE THE CELLULAR UPTAKE
5221 SYNTHESIS OF PS PARTICLES ( BY KATJA KLEIN4)
A direct miniemulsion co-polymerization method according to previously published work
was used to synthesize functionalized as well as non-functionalized polystyrene
nanoparticles (NP) Briefly a total monomer amount of 6 g was used for each particle In
case of the non-functionalized NP this means 6 g styrene (Merck Germany) For the
functionalized particles 588 g styrene and 012 g functionalized co-monomer were used
For the preparation of negatively charged polystyrene nanoparticles acrylic acid (Aldrich
USA) 252 mg hexadecane (Aldrich) 5 mg arcBODIPY (for measurements that did not need
a fluorescent dye it was omitted) and 100 mg V59 (Wako chemicals Japan) as initiator
were added to a solution of 06 g Lutensol AT50 (BASF Germany) in 24 mL water under
vigorous stirring to prepare PS-COOH NPs For the synthesis of positively charged
polystyrene nanoparticles 2-aminoethyl methacrylate hydrochloride (AEMH Aldrich
Germany)) was added to the water phase and combined with the disperse phase as
described above to prepare PS-NH2 After combining water and disperse phase each
preparation was stirred for one hour and the emulsions afterwards ultrasonificated for
two minutes at 90 intensity (Branson Sonifier 12rdquo tip 450 W) After polymerization at
72 degC for 12 h the NPs were purified by centrifugation and redispersion in water three
times (13000 rpm 3-4 h)
5222 TRANSMISSION ELECTRON MICROSCOPY (TEM) (PERFORMED BY CHRISTOPH
SIEBERT5)
Transmission electron microscopy was carried out with a JEOL JEM-1400 electron
miscroscope operating at an acceleration voltage of 120 kV The samples were prepared
by diluting the 1 wt dispersion 150 with water One droplet was placed on a 300 mesh
carbon-coated copper grid and dried overnight
4 Katja Klein AK Prof Dr Katharina Landfester MPIP
5 Christoph Siebert AK Prof Dr Katharina Landfester MPIP
Experimental section 155
5223 DYNAMIC LIGHT SCATTERING (DLS)
All light scattering experiments were done on a commercially available instrument from
ALV GmbH (Langen Germany) consisting of an electronically controlled goniometer and
an ALV-5000 multiple tau full-digital correlators with 320 channels equipped with an
HeNe Laser 1 mL protein solutions as well as concentrated human plasma were filtered
through Millex GS 220nm filters into cylindrical quartz cuvettes (20 mm diameter Hellma
Muumlllheim) Particle dispersions were diluted 11000 with PBS running buffer or protein
solution and measured without filtering to avoid changes within the system under
investigation (5x10⁻⁴ m2 particle surface area per mg protein)
5224 PARTICLE CHARGE DETECTION (PCD) (PERFORMED BY ELKE MUTH6)
The amount of amine or carboxyl groups on the particle surface was calculated from
titration performed on a particle charge detector PCD 02 (Muumltek GmbH Germany)
combined with a Titrino Automatic Titrator 702 SM (Metrohm AG Switzerland) Carboxyl
groups were titrated against positively charged poly(diallyl dimethyl ammonium chloride)
(PDADAMC) while amino groups were titrated against negatively charged polyelectrolyte
standard sodium poly(ethylene sulfonate) (Pes-Na) 10 mL of the dispersion under
investigation with a solid content of 1 gL were titrated
5225 ZETA POTENTIAL
For determination of the zeta (ζ) potential of the different polystyrene nanoparticles a
Malvern zetasizer nano series instrument was used 20 microL of the respective dispersion was
diluted in 2 mL 1 mM KCl and filled into appropriate disposable folded capillary cells
5226 PROTEIN CORONA PREPARATION
Each nanoparticle was incubated with human plasma or the obtained protein fractions at
constant ratio of particle surface area to protein amount (5x10⁻³ m2 particle surface area
per mg protein) for one hour at 37 degC Unbound proteins in the supernatant were
separated from particles by centrifugation at 20000g for 30 min The coated particle
6 Elke Muth AK Prof Dr Katharina Landfester MPIP
156 pellet was resuspended in running buffer and in case for SDS-Page washed by three
centrifugation steps at 20000g for 30 min and subsequent redispersion in buffer For LC-
MS and protein quantification proteins were eluted from the nanoparticles by dissolving
the pellet in 300 microL of buffer (7M Urea 2 M Thiourea 4 CHAPS) The amount of proteins
was quantified using Pierce 660nm protein Assay (Thermo Scientific Germany) according
to manufacturers instructions and absortion at 660 nm was measured with a Tecan
infinite M1000
5227 CIRCULAR DICHROISM SPECTROSCOPY
CD spectra were recorded with a Jasco J-815 spectrometer equipped with a PTC-423S
Peltier type temperature-control system Measurements were perfomed at 37 degC in a 10
mm cell from 300 to 190 nm with a band width of 1 nm and a scanning speed of 20 nms
Proteins were dissolved in PBS or running buffer with a concentration of 1 gL
5228 MACROPHAGES
Murine macrophage-like cells (RAW 2647) were kept in Dulbeccoacutes modified eagle
medium (DMEM Invitrogen USA) supplement with 10 fetal bovine serum (FBS Sigma
Aldrich USA) and 1 penicillinstreptomycin (Invitrogen USA) Cells were grown in
humidified incubator at 37 degC and 5 CO2
5229 FLOW CYTOMETRY (PERFORMED BY JOHANNA SIMON)
1 x 10⁵ cellsmL (RAW 2647) were allowed to attach in six-well plates (2 mL per well)
After 12 h the cells were washed with DPBS to remove all proteins from FBS and kept in
DMEM without additional proteins Pre-coated nanoparticles (75 microgmL) were added to
cells and incubated for 2 h For further flow cytometry analysis cells were washed with
DPBS detached with trypsin (Invitrogen USA) centrifuged (4 min 266 g) and
resuspended in DPBS Flow cytometry measurements were performed on a CyFlow ML
cytometer (Partec Germany) with a 488 nm laser to excite the fluorescent labelled
nanoparticles and a 527 nm pass filter for emission detection (fluorescence channel 1
FL1) With FCS Express V4 (DeNovo Software USA) cells were selected on a forward
scattersideward scatter plot thereby excluding cell debris The gated events were further
Experimental section 157 analyzed in the FL1 channels The median in the FL1 channel (MFI) was determined from a
1D histogram as a relative figure for the amount of nanoparticles taken up or associated
with cells
As different nanoparticles contained different amounts of dye the fluorescence intensity
for each particle was measured with a Tecan Infinite R M1000 PRO microplate reader with
standard settings of the software icontrol reg at an excitation and emission wavelengths of
523 nm and 536 nm The fluorescence intensity values of each nanoparticle (FINP) were
further normalized (nFINP) to the fluorescence intensity value for PS particles (FIPS) to
further normalize the median fluorescence intensity (MFI) obtained from flow cytometry
measurements The following equations were used
n(FI)NP= FINP FIPS
nMFI=MFI(n(FI)NP )
For each cell uptake experiment the normalized median fluorescence intensity values
nMFI of uncoated nanoparticles (nMFI_) was determined to compare nMFI values of pre-
coated particles from different cell experiments According to this relative fluorescence
intensity values rMFI were calculated with the equation
rMFI=nMFInMFI_
52210 CONFOCAL LASER SCANNING MICROSCOPY (CLSM) (PERFORMED BY DR ANKE
KALTBEITZEL7)
1 x 10⁵ cellsmL (RAW 2647) were seeded in Ibidi iTreat μ-dishes (IBIDI Germany) for 24
h washed with PBS and kept in DMEM without additional proteins 75 microgmL pre-
incubated nanoparticles were added to cells for 2 h Afterwards cells were washed with
PBS three times and stained with CellMask Orange (CMO stock solution 5 mgmL in
DMSO Invitrogen USA) which labeled the cell membrane red CMO (02 microL) was diluted
with one mL of Hanksacute Balanced Salt solution (HBSS Life technologies USA) After adding
the diluted staining solution (400 microL) to cells live cell images were taken on a Leica TCS
7 Dr Anke Kaltbeitzel AK Prof Dr Katharina Landfester
158 SP5 II microscope with an HC PL APO CS 63x14 oil objective using the software LAS AF
3000 software The fluorescence signals of nanoparticles (excitation 488 nm pseudo
colored green) and CMO (excitation 561 nm pseudo colored red) were detected in a
serial scan mode at 502 ndash 534 nm and 579 ndash 642 nm
52211 SDS-PAGE AND LC-MS
Experiments were performed according to chapter 521
52212 SYNTHESIS OF POLYSTYRENE WITH PROTEINS AS SURFACTANT
The CMC of IgG depleted Plasma at the air water interface was determined using DCAT 21
from DataPhysics with a Du Nouumly-Ring RG11 Protein solution in water was added
dropwise up to a concentration of 05 gL and the change in surface tension detected
A direct miniemulsion co-polymerization method according to previously published work
was used to synthesize non-functionalized polystyrene nanoparticles (NP) Briefly 5 mg of
initiator V59 (Wakoo chemicals Japan) was dissolved in 560 microL styrene (Merck Germany)
with 32 microL hexadecane (gt 99 Sigma Aldrich) as osmotic pressure reagent 59 microL of this
stock solution was added to 2 mL of protein solution in water (c= 1 mgmL) The mixture
was stirred for 1 hour at room temperature and 1000 rpm Afterwards the emulsion was
ultrasonificated for two minutes at 70 intensity (indirect ultrasonifier branson digital
sonifier) and the polymerization carried out at 65 degC for 12 h The dispersion was diluted
and purified by centrifugation at 4000 rpm for 10 minutes The solid content of the
resulting dispersion was determined to be 05
Cell toxicity of the particles was determined by using a CellTiter-Gloreg Assay according to
manufacturer for particle concentrations from 75 up to 1200 microgmL For the SDS-Page the
SilverQuesttrade Silver Staining Kit from ThermoFisher Scientific was used as recommended
by manufacturer
Experimental section 159
52213 FLUORESCENT CORRELATION SPECTROSCOPY (FCS) (PERFORMED BY JENNIFER
SCHULTZE MPIP)
FCS experiments were performed using a commercial setup (Zeiss Germany) consisting of
the module ConfoCor 2 and an inverted microscope model Axiovert 200 with a Zeiss C-
Apochromat 40times12W water immersion objective
Dyes were excited by an argon laser (488 nm) Fluorescence light was filtered (LP 505 long
pass emission filter) and collected by an avalanche photodiode that enables single-photon
counting Eight-well polystyrene-chambered coverglass (Laboratory-Tek Nalge Nunc
International) was used as a sample cell
For each solution a series of 50 measurements (10 s each) were performed
The confocal observation volume was calibrated using AlexaFlour488 as a reference dye
with a known diffusion coefficient
523 HUMAN BLOOD PLASMA VERSUS SERUM
DLS measurements were performed according to chapter 521-2 All protein sources were
centrifuged prior to DLS measurements (20000 g 30 min) The experimental setup of
cited cell experiments as well as the origin of the protein sources and particles is already
published137
524 EVALUATION OF NP STABILITY IN HUMAN BLOOD SERUM
DLS LC-MS SDS-PAGE and zeta potential experiments were performed according to
chapter 521-2 The human serum pool was centrifuged prior to the introduction of
coated particles (20000 g 30 min)
160
5241 PROTEIN CORONA FORMATION
005 m2 or particle surface area were introduced into 500 microL individual serum or pooled
human serum and incubated for 1 h at 37 degC For light scattering experiments the
particles were separated from unbound proteins via centrifugation for 30 min at 20000 g
and the pellet resuspended in PBS For SDS-PAGE LC-MS analysis and zeta potential
determination the pellet was washed thrice with PBS and subsequent centrifugation at
20000 g for 30 min For SDS-Page proteins were eluted from the nanoparticles by
dissolving the pellet in 300 microL of buffer (7M Urea 2 M Thiourea 4 CHAPS) for LC-MS 2
SDS (gt 95 Merck) (solution (wv) in 625 mM TrisbullHCl was used The amount of proteins
was quantified using Pierce 660nm protein Assay (Thermo Scientific Germany) according
to manufacturers instructions and absorption at 660 nm was measured with a Tecan
infinite M1000 The human serum pool was centrifuged prior to the introduction of
coated particles (20000 g 30 min)
5242 HEAT INACTIVATION OF HUMAN SERUM
Serum was heated up to 56 degC for one hour and centrifuged for 30 min at 20000 g prior to
use
5243 NANO-DSF MEASUREMENTS
All proteins were dissolved wit c = 1 gL in PBS Clusterin (recombinant AG Koch-Brandt
JGU Mainz) was an exception and was dissolved with c = 014 gL The samples were
heated up from 20 degC to 95 degC with a heating rate of 1 degC min
5244 DILUTION AS TOOL FOR PRE-COATING
For DLS measurements the particles were introduced into concentrated human plasma
(centrifuged for 30 min at 20000 g and filtered with GS 220 nm filters into the cuvette) at
a constant ratio of 5x10⁻³ m2 per mg serum The overall solution was diluted 12 15 and
110 The dilution was done by diluting the plasma prior to particle introduction
Experimental section 161
525 THE TRANSFER OF A PROTEIN CORONA
LC-MS as well as nanoDSF and DLS measurements were performed as previously
described The protein concentration for nanoDSF measurements in PBS was c = 03 gL
PS-NH2 with CTMA-Cl as surfactant was synthesized by Katja Klein according to
literature107 The NH2-functionalization was determined by a fluorescamine assay The
NHS-coupling was performed by Thomas Wolf 5 mL of 1 particle dispersion (pH = 8)
were stirred at room temperature and 5 eq (in relation to the amine groups) PEG-ester
added in three equivalents with 20 min time lag After additional stirring for one hour the
particles were purified by subsequent centrifugation (20000 g 1 h) and redispersion of
the particle pellet thrice In addition the dispersion was afterwards dialyzed against water
with a cut off of MW = 50 kDa PEG functionalization was determined by NMR
spectroscopy
5251 OBTAINING STEALTH PROTEINS
005 m2 of PS-PEG5000 surface area were incubated in 500 microL human plasma for 1 hour at
37 degC Afterwards unbound and weakly bound proteins were removed via centrifugation
at 20000 g for 30 min The pellet was washed via resuspension in PBS and subsequent
centrifugation thrice After the last centrifugation step the pellet was resuspended in 100
microL of 2 SDS (gt 95 Merck) (solution (wv) in 625 mM TrisbullHCl The particles were
separated from the supernatant by centrifugation at 20000 g for 1 h Afterwards the
protein solution was obtained
5252 REMOVAL OF SDS
SDS was removed from the protein solution via the use of Piercereg Detergent Removal Spin
Column (05 mL ThermoScientific) The centrifugal column was placed in an 2 mL
Eppendorf tube and the storage buffer removed via centrifugation at 1500 g for 1 min
Afterwards the column was washed three times with 04 mL DPBS and centrifugation at
1500 g for 1 min 100 microL of sample were added and incubated at RT for 2 min After
centrifugation at 1500 g for 2 min the detergent free protein solution was obtained
Protein concentrations were determined using Pierce 660 nm protein assay according to
162 manufactureracutes instructions and absorption at 660 nm measured with a Tecan infinite
M1000
5253 PARTICLE RECYCLING
For particle recycling the already used particle pellet was resuspended in 1 mL DPBS and
incubated overnight Afterwards the supernatant was removed via centrifugation at
20000 g for 30 min The pellet was washed additional three times with PBS and
afterwards used again for incubation in human plasma
5254 TRANSFER OF THE PROTEIN CORONA ON PS-NH2
005 m2 of particle surface area were incubated in a solution of 200 microg proteins in PBS
After one hour at 37 degC the supernatant was removed via centrifugation at 20000 g for
30 min The pellet was resuspended in the original amount of MilliQ water For zeta
potential determination and SDS-PAGE the particle pellet was washed with PBS and
subsequent centrifugation at 20000 g for 30 min thrice
5255 CELL UPTAKE (PERFOMED BY JOHANNA SIMON)
Flow cytometry was performed as described in chapter 522 This time pre-coated
nanoparticles were added to cells and incubated for 2 h with a nanoparticle concentration
of 20 microgmL
526 EVALUATION OF DIFFERENT IN VIVO MODELS
BNF-Dextran-redF and BNF-Starch-redF were obtained by MicroMod Germany with a
solid content of 10 mgmL
Rabbit sheep and mouse plasma were purchased from GeneTex distributed by Biozol
Eching Germany In each case citrate was added as anti-coagulant
Protein corona formation as well as analysis was done as described before The proteins
were dissolved from the particles by using the above described urea buffer The only
Experimental section 163 difference was the staining of SDS-PAGEs Instead of commassie brilliant blue the
silverstaining was applied The SilverQuesttrade Silver Staining Kit from ThermoFisher
Scientific was used as recommended by manufacturer
527 EVALUATION OF MULTIFUNCTIONAL LIPOSOMES IN HUMAN BLOOD SERUM BY DYNAMIC LIGHT SCATTERING
The detailed information about materials and methods has already been published and
can be seen in ldquoEvaluation of Multifunctional Liposomes in Human Blood Serum by Light
Scatteringrdquo Mohr et al Langmuir 2014 30 14954-14962)21
528 MULTICOMPONENT LIPOSOMES FOR SIRNA DELIVERY TO THE LIVER
5281 REAGENTS
All solvents and reagents were purchased from Acros and Sigma Aldrich and used as
received unless mentioned otherwise Deuterated methanol-d4 was purchased from
Deutero GmbH Dulbeccoacutes phosphate buffered saline (DPBS) without calcium and
magnesium was purchased from Gibcolifetechnologies Human blood serum and blood
plasma prepared according to standard guidelines was obtained from the blood
transfusion service at the University Clinic of MainzGermany Human plasma was pooled
from 6 patients whereas serum originated from one patient Extruder stabilizer and
polycarbonate membranes were purchased from Avestin Europe GmbH The Quant-itTM
RiboGreenreg assay was obtained from Invitrogen CW800 NHS ester was procured from LI-
COR Biotechnology
5282 SYNTHESIS OF SURFACTANT TF AND DYE LABELING
Surfactant TF was synthesized according to Figure 93 by Dr Chai Wenquiang Detailed
information is provided in the dissertation of Dr Wenquiang153
164
Figure 93 Synthesis of surfactant TF according to [153]
For dye labeling 1 eq CW800 NHS ester (LI-COR Biotechnology) was reacted with 105 eq
surfactant TF in DMSO for 70 h under stirring
5283 SYNTHESIS OF A HYPERBRANCHED POLYGLYCEROL (HBPG) SURFACTANT
The synthesis was conducted by Dr Sophie Muumlller as reported elsewhere21
Experimental section 165
5284 LIPOSOME FORMULATION
The cationic lipid TF as well as cholesterol and DSPC were dissolved in ethanol at room
temperature with different weight ratios The ethanolic solution of lipids was dropped
into an aqueous solution of Dulbeccos phosphate-buffered saline (DPBS) under vigorous
stirring for several minutes The resulting liposomal mixture was extruded through a
polycarbonate membrane with a nominal pore-size of 50 nm In order to achieve
reproducible liposome preparation a semi-automatic controllable extruder was designed
for syringe volumes of 05 and 1 mL The homebuilt mechanical set-up utilizes the
LiposoFast Basic filter housing from AVESTIN Europe GmbH The syringes are electronically
driven by a stepping motor that enables a continuously tunable speed of the syringe
plunger between 7 mms and 04 mms Mostly unilamellar liposomes were obtained at
constant extrusion speed (49 mms corresponding to 52 mLmin) and 30 extrusion
cycles For light scattering measurements the extruded liposomes were filtered through a
Millex LCR 450nm filter into a dust-free Suprasil light scattering cuvette (Hellma
Muumllheim)
5285 LOADING OF LIPOSOMES WITH SIRNA
A desired amount of siRNA was dissolved in aqueous DPBS After adding the ethanolic
solution of lipids under vigorous stirring siRNA loaded liposomes (mass ratio TFsiRNA =
51 751 101 corresponding to NP = 17 25 34) were produced by repeated extrusion
as described before The amount of encapsulated siRNA was determined as described6
using the Quant-itTM RiboGreenreg assay from Invitrogen Purification of non-encapsulated
siRNA was performed using Amicon Ultra-2 mL Centrifugal filter devices (30K) or by
dialysis (MW 20K)
5286 DYNAMIC AND STATIC LIGHT SCATTERING
All dynamic light scattering experiments were performed with an instrument consisting of
HeNe laser (6328 nm 25 mW output power) an ALV-CGS 8F SLSDLS 5022F goniometer
equipped with eight simultaneously working ALV 7004 correlators and eight QEAPD
Avalanche photodiode detectors Static light scattering (SLS) experiments were carried out
on an ALVCGS3 instrument consisting of a HeNe laser a goniometer and an ALV-5004
166 multiple-tau full-digital correlator Measurements were performed at scattering angles
between Θ = 30 ndash 150deg with steps of 10deg
For DLS and SLS the liposomal solutions were diluted 120 vv by aqueous PBS to a total
lipid concentration of 003 gL and subsequently filtered through LCR 450 nm filters
(Millipore) Human serum as well as plasma was filtered through Millex GS filters 220 nm
nominal pore size (Millipore) into cylindrical Suprasil quartz cuvettes (20 mm diameter
Hellma Muumlllheim) in a dust-free flow hood By adding the liposomal solution in PBS the
human serum was diluted 11 resulting in a total protein concentration approximately 3
After incubation for 30 min at room temperature DLS measurements were performed at
20 degC
For the liposomes and lipoplexes in buffer the correlation functions showed a monomodal
decay and were fitted by a sum of two exponentials from which the first cumulant Г was
calculated The z-average diffusion coefficient Dz was obtained by extrapolation of Гq2 for
to q = 0 leading to the inverse z-average hydrodynamic radius Rh equiv lt1Rhgtz-1 by formal
application of Stokes law
For the measurements in serumplasma the correlation functions were analyzed
according to the method introduced by Rausch et al114 which is described in detail in the
introduction
5287 ZETA POTENTIAL
For determination of the zeta potential of the different liposomal systems a Malvern nano
zeta sizer was utilized 20 microL of liposomal solution was diluted in 2 mL 1mM KCl and filled
into disposable folded capillary cells (DTS 1060)
5288 CELL CULTURE (LEONARD KAPS)
Murine MHS alveolar macrophages (ATCC Teddington UK) were cultured in Dulbeccos
modified Eagles medium supplemented with 10 FBS 1 penicillin 1 L-glutamine and
1 streptomycin in 5 CO2 at 37 degC The medium was routinely changed every 2 days and
the cells were separated by cell scraping before reaching confluency
Experimental section 167
5289 IN VITRO CYTOTOXICITY (PERFORMED BY LEONARD KAPS)
The MTT (3-(45-dimethylthiazol-2-yl)-25-diphenyltetrazoliumbromide) assay was used to
assess potential cytotoxicity of the L-114 loaded with control scrambled siRNA (scsiRNA
see below) on MHS macrophages In brief the cells were seeded into 96-well plates at a
density of ~10000 cells per well After a 24 h incubation period supplement (as described
in detail above) containing medium with serial concentrations of L-114 (loaded with
control scsiRNA) corresponding to 5 10 20 50 100 200 400 and 600 nM scsiRNA
formulation was added to replace the cell culture medium After a 48 h incubation time
20 μL of MTT dissolved in PBS (4 mgmL) was added and incubated for another 4 h to
quantify the living cells followed by removal of the medium and addition of 150 μL DMSO
Finally the 96-well plates were read on an Infinite M200Pro spectrofluorometer (TECAN
Maumlnnerdorf Switzerland) at 570 nm
52810 IN VITRO KNOCKDOWN (PERFORMED BY LEONARD KAPS)
Anti-CD68 siRNA with the sequence
5rsquo-G6A 6U8 C6A 8C6 U6G 5U7 U-3rsquo
5rsquo-6G6 A7U 6U8 C5U 8C6 U5U 70-3rsquo
containing the following chemical modifications (methylations) at the 2rsquo position of the
ribose ring
0 3rsquoAmino-C6 5 2rsquoOMe-rU 6 2rsquoOMe-rA 7 2rsquoOMe-rC 8 2rsquoOMe-rG
was purchased from BioSpring (Germany Frankfurt)
As scramble siRNA siGENOME Non-Targeting siRNA 2 with the following sequence
5rsquo-UAAGGCUAUGAAGAGAUACUU-3rsquo
5rsquo-GUAUCUCUUCAUAGCCUUAUU-3rsquo
168 was purchased from Dharmacon (Dharmacon GE Healthcare Germany Freiburg)
Chemical modifications of the scsiRNA as intellectual property of Dharmacon were not
disclosed in the datasheet
As positive in vitro transfection control anti-CD68 siRNA was mixed with INTERFERin from
Polyplus transfection (Illkirch-Graffenstaden France) according to the manufactures
protocol
Before transfection MHS cells were seeded in 12-well culture plates at a density of
~100000 cells per well and allowed to adhere overnight After the plates were washed
three times with PBS the cells were incubated with a final liposomal siRNA concentration
of 25 nM 50 nM 100 nM in 1 mL supplement containing medium for 48 h
52811 QUANTITATIVE RT-PCR (PERFORMED BY LEONARD KAPS)
After transfection cellular RNAs was extracted with GeneMATRIX Universal RNA
Purification Kit from EURX (Berlin Germany) according to the manufactures protocol 1 μg
of total RNA was reverse transcribed into cDNA using the iScript cDNA Synthesis Kit (Bio-
Rad Hercules USA) according to the manufacturerrsquos protocol
The following Primers and probes were obtained from Eurofins (Mannheim Germany)
Glycerinaldehyd-3-phosphat-Dehydrogenase (GAPDH)
forward 5rsquo-AAGGTGAAGGTCGGAGTCAAC-3rsquo
reverse 5rsquo-GGGGTCATTGATGGCAACAATA-3rsquo
Pan macrophages marker CD68
forward 5rsquo-ACCGCCATGTAGTCCAGGTA-3rsquo
reverse 5rsquo-ATCCCCACCTGTCTCTCTCA-3rsquo
were purchased from Applied Biosystems (Carlsbad CA USA)
Experimental section 169 Syber Green reaction mixtures were purchased by Applied Biosystems (Germany
Darmstadt) GAPDH transcript levels were used to normalize data and to control for RNA
integrity The Syber Green reactions were performed using a Step One Plus sequence
amplification system Results are expressed as the ratio of the copy number of the target
gene divided by the number of copies of the housekeeping gene (GAPDH) within a single
PCR run
52812 IN VIVO KNOCKDOWN (PERFORMED BY LEONARD KAPS)
All animal studies were approved by the committee on animal care (Government of
Rhineland Palatinate Germany) 8 week old Balbc mice were kept under 12 h light-dark
cycles treated with human care and sacrificed by cervical dislocation Mice (n=3 per
group) were anaesthetized with isoflurane and injected retroorbitally with 1 mgkg or 2
mgkg anti-CD68 siRNA the scrambled control RNA loaded in L-114 or L-114-hbPG or
received buffer alone (250 microl PBS) All mice were injected twice 48 h apart Liver RNA was
extracted reverse transcribed and analyzed by quantitative RT-PCR as described above
52813 IN VIVO IMAGING (PERFORMED BY LEONARD KAPS)
In vivo near infrared fluorescence imaging of CW-800-labeled liposomes loaded with
siRNA was performed with the IVIS Spectrum Imaging system (Caliper LifeSciences)
Fluorescence source and filters were set for IR-excitation at 745 nm and emission at 800
48 h after the second injection the mice were sacrificed liver spleen lungs heart and
kidneys removed and transferred immediately into the image chamber for ex vivo
imaging Acquisition of images was performed with an integration time of 4 s
52814 ISOLATION OF LIVER NON-PARENCHYMAL CELLS (PERFORMED BY LEONARD
KAPS)
The nonparenchymal liver cell population was isolated and purified from the liver of
female Balbc mice according as described by us19 Briefly mice were anesthetized with
KetamineXylazine the livers were rinsed with PBS and after removal of the gall bladder
carefully homogenized and digested with 5000 U Collagenase IV from Sigma-Aldrich
(Munich Germany) in Krebs-Ringer-Buffer pH 74 for 30 min at 37 degC followed by
170 another homogenization and digestion step The cell suspension was filtered over a 100
microm cell strainer to remove non-digested particles and centrifuged at 17ndash21timesg for 4 min at
4 degC to remove hepatocytes The supernatant suspension was transferred into new tubes
and centrifuged again at 300timesg for 10 min and the cell pellet resuspended in 10 mL 1times Red
Blood Cell Lysis Solution from Milteny (Bergisch-Gladbach Germany) for 5 min at RT
followed by thorough washing with PBS
52815 FACS ANALYSIS (PERFORMED BY LEONARD KAPS)
In vivo macrophage uptake of CW-800-labeled siRNA loaded liposomes was measured by
FACS analysis using antibodies to CD45 (clone 30-F11) F480 (clone BM8) from
eBiolegend (San Diego USA) and Fixable Viability Dye eFluor 506 (eBioscience San Diego
USA) to exclude dead cells Cells were fixed with 4 paraformaldehyde (Histofix Roth
Germany) for 15 min at 37 degC and analyzed on a BD FACSCanto II flow cytometer BD
Bioscience (MississaugaCanada) Compensation was performed automatically with
FACSDiva software using corresponding single stained controls 50000 cells were
measured per staining Further analysis of flow cytometry data was performed with open
source Flowing Software 250 (Pertu Terho Turku Centre for Biotechnology Finland)
52816 STATISTICAL ANALYSIS (PERFORMED BY LEONARD KAPS)
Statistical comparisons were performed with student t-test analysis using the GraphPad
Prism (La Jolla USA) program
52817 1H NMR
1H NMR spectrum of the surfactant F was recorded on a Bruker AVANCE 300
spectrometer As deuterated solvent CD3OD was used For analysis MestReNova 8 from
Mestrelab Research SL was used The spectra were calibrated against the solvent signal
52818 HPLC (BEATE MUumlLLER)
The high pressure liquid chromatograms of dye cationic lipid TF and TF-dye conjugate
were measured by using an Agilent Series 1200 HPLC system with a MN-HD8-column
(12545microml) an evaporative light scattering detector 385-LC (Varian) and a diode array
Experimental section 171 detector (Agilent) The measurement was run at 20degC and a flow-rate of 1 mLmin As
liquid phase a THF water mixture was used (5 THF 95 water + 01 TFA) The THF
amount was increased within 10 minutes to 100
52819 CRYO-TEM (PERFORMED BY MAX BERNHARD)
For cryo-TEM imaging a JEOL 1400 transmission electron microscope equipped with a
cryogenic holder (Gatan USA) was used
172
References 173
6 REFERENCES
1 Zolnik B S Sadrieh N Regulatory perspective on the importance of ADME assessment of nanoscale material containing drugs Adv Drug Deliv Rev 2009 61 422-427
2 Duncan R Polymer conjugates as anticancer nanomedicines Nat Rev Cancer 2006 6 688-701
3 Pieper R Gatlin C L Makusky A J Russo P S Schatz C R Miller S S Su Q McGrath A M Estock M A Parmar P P The human serum proteome Display of nearly 3700 chromatographically separated protein spots on two‐dimensional electrophoresis gels and identification of 325 distinct proteins Proteomics 2003 3 1345-1364
4 Anderson N L The clinical plasma proteome a survey of clinical assays for proteins in plasma and serum Clin Chem 2010 56 177-185
5 Kim M-R Kim C-W Human blood plasma preparation for two-dimensional gel electrophoresis J Chromatogr B 2007 849 203-210
6 Andrade J D Hlady V Plasma Protein Adsorption The Big Twelvea Ann NY Acad Sci 1987 516 158-172
7 Varlan A Hillebrand M Bovine and human serum albumin interactions with 3-carboxyphenoxathiin studied by fluorescence and circular dichroism spectroscopy Molecules 2010 15 3905-3919
8 httpwwwmanagement-krankenhausdeproduktelabor-diagnostikigy-so-tief-wie-nie-zuvor-ins-plasma-proteom-schauen
9 Vermeer A W Norde W The thermal stability of immunoglobulin unfolding and aggregation of a multi-domain protein Biophys J 2000 78 394-404
10 Gauldie J Richards C Harnish D Lansdorp P Baumann H Interferon beta 2B-cell stimulatory factor type 2 shares identity with monocyte-derived hepatocyte-stimulating factor and regulates the major acute phase protein response in liver cells Proceedings of the National Academy of Sciences 1987 84 7251-7255
11 Marguerie G A Plow E F Edgington T S Human platelets possess an inducible and saturable receptor specific for fibrinogen J Biol Chem 1979 254 5357-5363
12 Furie B Furie B C The molecular basis of blood coagulation Cell 53 505-518
13 Bathen T F Engan T Krane J Axelson D Analysis and classification of proton NMR spectra of lipoprotein fractions from healthy volunteers and patients with cancer or CHD Anticancer Res 1999 20 2393-2408
14 Maeda H Wu J Sawa T Matsumura Y Hori K Tumor vascular permeability and the EPR effect in macromolecular therapeutics a review J Controlled Release 2000 65 271-284
15 Muggia F M Doxorubicin-polymer conjugates further demonstration of the concept of enhanced permeability and retention Clin Cancer Res 1999 5 7-8
16 Fang J Nakamura H Maeda H The EPR effect Unique features of tumor blood vessels for drug delivery factors involved and limitations and augmentation of the effect Adv Drug Deliv Rev 2011 63 136-151
174 17 Byrne J D Betancourt T Brannon-Peppas L Active targeting schemes for nanoparticle systems in cancer therapeutics Adv Drug Deliv Rev 2008 60 1615-1626
18 Maeda H Nakamura H Fang J The EPR effect for macromolecular drug delivery to solid tumors Improvement of tumor uptake lowering of systemic toxicity and distinct tumor imaging in vivo Adv Drug Deliv Rev 2013 65 71-79
19 Betancourt T Brown B Brannon-Peppas L Doxorubicin-loaded PLGA nanoparticles by nanoprecipitation preparation characterization and in vitro evaluation 2007
20 Schroeder A Levins C G Cortez C Langer R Anderson D G Lipid‐based nanotherapeutics for siRNA delivery Journal of internal medicine 2010 267 9-21
21 Mohr K Muumlller S S Muumlller L K Rusitzka K Gietzen S Frey H Schmidt M Evaluation of Multifunctional Liposomes in Human Blood Serum by Light Scattering Langmuir 2014 30 14954-14962
22 Gavrilov K Saltzman W M Therapeutic siRNA principles challenges and strategies The Yale journal of biology and medicine 2012 85 187
23 Jin S Leach J C Ye K Nanoparticle-mediated gene delivery Micro and Nano Technologies in Bioanalysis Methods and Protocols 2009 547-557
24 Patil M L Zhang M Betigeri S Taratula O He H Minko T Surface-modified and internally cationic polyamidoamine dendrimers for efficient siRNA delivery Bioconjugate Chem 2008 19 1396-1403
25 Sutton D Nasongkla N Blanco E Gao J Functionalized micellar systems for cancer targeted drug delivery Pharm Res 2007 24 1029-1046
26 Francis M F Cristea M Winnik F M Polymeric micelles for oral drug delivery why and how Pure Appl Chem 2004 76 1321-1335
27 Moore A Medarova Z Potthast A Dai G In Vivo Targeting of Underglycosylated MUC-1 Tumor Antigen Using a Multimodal Imaging Probe Cancer Res 2004 64 1821-1827
28 Flenniken M L Liepold L O Crowley B E Willits D A Young M J Douglas T Selective attachment and release of a chemotherapeutic agent from the interior of a protein cage architecture Chem Commun 2005 447-449
29 Muumlller L K Landfester K Natural liposomes and synthetic polymeric structures for biomedical applications Biochem Biophys Res Commun 2015
30 Fire A Xu S Montgomery M K Kostas S A Driver S E Mello C C Potent and specific genetic interference by double-stranded RNA in Caenorhabditis elegans Nature 1998 391 806-811
31 Elbashir S M Harborth J Lendeckel W Yalcin A Weber K Tuschl T Duplexes of 21-nucleotide RNAs mediate RNA interference in cultured mammalian cells Nature 2001 411 494-498
32 Elbashir S M Lendeckel W Tuschl T RNA interference is mediated by 21-and 22-nucleotide RNAs Genes Dev 2001 15 188-200
33 Gao Y Liu X-L Li X-R Research progress on siRNA delivery with nonviral carriers Int J Nanomedicine 2011 6 1017-1025
34 Choung S Kim Y J Kim S Park H-O Choi Y-C Chemical modification of siRNAs to improve serum stability without loss of efficacy Biochem Biophys Res Commun 2006 342 919-927
References 175 35 Ghosn B Singh A Li M Vlassov A V Burnett C Puri N Roy K Efficient gene silencing in lungs and liver using imidazole-modified chitosan as a nanocarrier for small interfering RNA Oligonucleotides 2010 20 163-172
36 Howard K A Rahbek U L Liu X Damgaard C K Glud S Z Andersen M Oslash Hovgaard M B Schmitz A Nyengaard J R Besenbacher F RNA interference in vitro and in vivo using a chitosansiRNA nanoparticle system Mol Ther 2006 14 476-484
37 Buyens K De Smedt S C Braeckmans K Demeester J Peeters L van Grunsven L A du Jeu X d M Sawant R Torchilin V Farkasova K Liposome based systems for systemic siRNA delivery stability in blood sets the requirements for optimal carrier design J Controlled Release 2012 158 362-370
38 Gurr M I Harwood J L Frayn K N Index Lipid Biochemistry Blackwell Science Ltd 2008 pp 315-320
39 Heinrich P C Muumlller M Graeve L LoumlfflerPetrides Biochemie und Pathobiochemie Springer-Verlag 2014
40 Israelachvili J N Mitchell D J Ninham B W Theory of self-assembly of hydrocarbon amphiphiles into micelles and bilayers Journal of the Chemical Society Faraday Transactions 2 Molecular and Chemical Physics 1976 72 1525-1568
41 Lasic D D Liposomes from physics to applications Elsevier Science Ltd 1993
42 Lasic D D Needham D The stealth liposome a prototypical biomaterial Chem Rev 1995 95 2601-2628
43 Crommelin D J A Metselaar J M Storm G Liposomes The Science and the Regulatory Landscape Non-Biological Complex Drugs Crommelin D J A de Vlieger J S B Eds Springer International Publishing 2015 Vol 20 pp 77-106
44 Singer S J Nicolson G L The fluid mosaic model of the structure of cell membranes Science 1972 175 720-731
45 Zhang Y Cristofaro P Silbermann R Pusch O Boden D Konkin T Hovanesian V Monfils P R Resnick M Moss S F Engineering mucosal RNA interference in vivo Mol Ther 2006 14 336-342
46 Wu S McMillan N J Lipidic Systems for In Vivo siRNA Delivery The AAPS Journal 2009 11 639-652
47 Moore C C Martin E N Lee G Taylor C Dondero R Reznikov L L Dinarello C Thompson J Scheld W M Eukaryotic Translation Initiation Factor 5A Small Interference RNA-Liposome Complexes Reduce Inflammation and Increase Survival in Murine Models of Severe Sepsis and Acute Lung Injury J Infect Dis 2008 198 1407-1414
48 Ren T Song Y Zhang G Liu D Structural basis of DOTMA for its high intravenous transfection activity in mouse Gene Ther 2000 7 764-768
49 Dokka S Toledo D Shi X Castranova V Rojanasakul Y Oxygen radical-mediated pulmonary toxicity induced by some cationic liposomes Pharm Res 2000 17 521-525
50 Harris T J Green J J Fung P W Langer R Anderson D G Bhatia S N Tissue-specific gene delivery via nanoparticle coating Biomaterials 2010 31 998-1006
176 51 Allen T Chonn A Large unilamellar liposomes with low uptake into the reticuloendothelial system FEBS Lett 1987 223 42-46
52 Love K T Mahon K P Levins C G Whitehead K A Querbes W Dorkin J R Qin J Cantley W Qin L L Racie T Frank-Kamenetsky M Yip K N Alvarez R Sah D W Y de Fougerolles A Fitzgerald K Koteliansky V Akinc A Langer R Anderson D G Lipid-like materials for low-dose in vivo gene silencing Proceedings of the National Academy of Sciences 2010 107 1864-1869
53 Zhang Y Anchordoquy T J The role of lipid charge density in the serum stability of cationic lipidDNA complexes Biochimica et Biophysica Acta (BBA)-Biomembranes 2004 1663 143-157
54 Xu L Anchordoquy T J Cholesterol domains in cationic lipidDNA complexes improve transfection Biochimica et Biophysica Acta (BBA)-Biomembranes 2008 1778 2177-2181
55 Allen T Hansen C Martin F Redemann C Yau-Young A Liposomes containing synthetic lipid derivatives of poly (ethylene glycol) show prolonged circulation half-lives in vivo Biochimica et Biophysica Acta (BBA)-Biomembranes 1991 1066 29-36
56 Allen C Dos Santos N Gallagher R Chiu G Shu Y Li W Johnstone S a Janoff A Mayer L Webb M Controlling the physical behavior and biological performance of liposome formulations through use of surface grafted poly (ethylene glycol) Biosci Rep 2002 22 225-250
57 Woodle M Matthay K Newman M Hidayat J Collins L Redemann C Martin F Papahadjopoulos D Versatility in lipid compositions showing prolonged circulation with sterically stabilized liposomes Biochimica et Biophysica Acta (BBA)-Biomembranes 1992 1105 193-200
58 Torchilin V P Omelyanenko V G Papisov M I Bogdanov A A Trubetskoy V S Herron J N Gentry C A Poly (ethylene glycol) on the liposome surface on the mechanism of polymer-coated liposome longevity Biochimica et Biophysica Acta (BBA)-Biomembranes 1994 1195 11-20
59 Blume G Cevc G Liposomes for the sustained drug release in vivo Biochimica et Biophysica Acta (BBA)-Biomembranes 1990 1029 91-97
60 Immordino M L Dosio F Cattel L Stealth liposomes review of the basic science rationale and clinical applications existing and potential International journal of nanomedicine 2006 1 297
61 Cabanes A Tzemach D Goren D Horowitz A T Gabizon A Comparative study of the antitumor activity of free doxorubicin and polyethylene glycol-coated liposomal doxorubicin in a mouse lymphoma model Clin Cancer Res 1998 4 499-505
62 Torchilin V P Recent advances with liposomes as pharmaceutical carriers Nat Rev Drug Discov 2005 4 145-160
63 Sharma A Sharma U S Liposomes in drug delivery progress and limitations Int J Pharm 1997 154 123-140
64 Muumlller S S Wurm F R Nanovesicles as Drug Delivery Vehicles Liposomes and Polymersomes Encyclopedia of Polymeric Nanomaterials 2015 1372-1377
65 Kremer L C M van Dalen E C Offringa M Ottenkamp J Voucircte P A Anthracycline-Induced Clinical Heart Failure in a Cohort of 607 Children Long-Term Follow-Up Study Journal of Clinical Oncology 2001 19 191-196
References 177 66 Gabizon A Catane R Uziely B Kaufman B Safra T Cohen R Martin F Huang A Barenholz Y Prolonged Circulation Time and Enhanced Accumulation in Malignant Exudates of Doxorubicin Encapsulated in Polyethylene-glycol Coated Liposomes Cancer Res 1994 54 987-992
67 Papahadjopoulos D Allen T Gabizon A Mayhew E Matthay K Huang S Lee K Woodle M Lasic D Redemann C Sterically stabilized liposomes improvements in pharmacokinetics and antitumor therapeutic efficacy Proceedings of the National Academy of Sciences 1991 88 11460-11464
68 Buyens K Demeester J De Smedt S S Sanders N N Elucidating the encapsulation of short interfering RNA in PEGylated cationic liposomes Langmuir 2009 25 4886-4891
69 Kasahara M Hinkle P C Reconstitution and purification of the D-glucose transporter from human erythrocytes J Biol Chem 1977 252 7384-7390
70 Pick U Liposomes with a large trapping capacity prepared by freezing and thawing of sonicated phospholipid mixtures Arch Biochem Biophys 1981 212 186-194
71 Maguire L A Zhang H Shamlou P A Preparation of small unilamellar vesicles (SUV) and biophysical characterization of their complexes with poly‐l‐lysine‐condensed plasmid DNA Biotechnol Appl Biochem 2003 37 73-81
72 Olson F Hunt C A Szoka F C Vail W J Papahadjopoulos D Preparation of liposomes of defined size distribution by extrusion through polycarbonate membranes Biochim Biophys Acta 1979 557 9-23
73 Miller A D Cationic liposomes for gene therapy Angew Chem Int Ed 1998 37 1768-1785
74 Akinc A Zumbuehl A Goldberg M Leshchiner E S Busini V Hossain N Bacallado S A Nguyen D N Fuller J Alvarez R A combinatorial library of lipid-like materials for delivery of RNAi therapeutics Nat Biotechnol 2008 26 561-569
75 Dong Y Eltoukhy A A Alabi C A Khan O F Veiseh O Dorkin J R Sirirungruang S Yin H Tang B C Pelet J M Chen D Gu Z Xue Y Langer R Anderson D G Lipid-Like Nanomaterials for Simultaneous Gene Expression and Silencing In Vivo Advanced Healthcare Materials 2014 3 1392-1397
76 Zhang Y Arrington L Boardman D Davis J Xu Y DiFelice K Stirdivant S Wang W Budzik B Bawiec J The development of an in vitro assay to screen lipid based nanoparticles for siRNA delivery J Controlled Release 2014 174 7-14
77 Ewe A Schaper A Barnert S Schubert R Temme A Bakowsky U Aigner A Storage stability of optimal liposomendashpolyethylenimine complexes (lipopolyplexes) for DNA or siRNA delivery Acta Biomater 2014 10 2663-2673
78 Lerch S Dass M Musyanovych A Landfester K Mailander V Polymeric nanoparticles of different sizes overcome the cell membrane barrier Eur J Pharm Biopharm 2013 84 265-74
79 Florez L Herrmann C Cramer J M Hauser C P Koynov K Landfester K Crespy D Mailander V How Shape Influences Uptake Interactions of Anisotropic Polymer Nanoparticles and Human Mesenchymal Stem Cells Small 2012 8 2222-2230
80 Schrade A Mailander V Ritz S Landfester K Ziener U Surface roughness and charge influence the uptake of nanoparticles fluorescently labeled pickering-type versus surfactant-stabilized nanoparticles Macromol Biosci 2012 12 1459-71
178 81 Monopoli M P Aberg C Salvati A Dawson K A Biomolecular coronas provide the biological identity of nanosized materials Nat Nanotechnol 2012 7 779-86
82 Liu Z H Jiao Y P Wang T Zhang Y M Xue W Interactions between solubilized polymer molecules and blood components J Controlled Release 2012 160 14-24
83 Salvati A Pitek A S Monopoli M P Prapainop K Bombelli F B Hristov D R Kelly P M Aberg C Mahon E Dawson K A Transferrin-functionalized nanoparticles lose their targeting capabilities when a biomolecule corona adsorbs on the surface Nature Nanotechnology 2013 8 137-143
84 Musyanovych A Dausend J Dass M Walther P Mailander V Landfester K Criteria impacting the cellular uptake of nanoparticles a study emphasizing polymer type and surfactant effects Acta Biomater 2011 7 4160-8
85 Baier G Baumann D Siebert J M Musyanovych A Mailander V Landfester K Suppressing Unspecific Cell Uptake for Targeted Delivery Using Hydroxyethyl Starch Nanocapsules Biomacromolecules 2012 13 2704-2715
86 Walkey C D Chan W C Understanding and controlling the interaction of nanomaterials with proteins in a physiological environment Chem Soc Rev 2012 41 2780-2799
87 Monopoli M P Walczyk D Campbell A Elia G Lynch I Baldelli Bombelli F Dawson K A PhysicalminusChemical Aspects of Protein Corona Relevance to in Vitro and in Vivo Biological Impacts of Nanoparticles JACS 2011 133 2525-2534
88 Walczyk D Bombelli F B Monopoli M P Lynch I Dawson K A What the Cell ldquoSeesrdquo in Bionanoscience JACS 2010 132 5761-5768
89 Vroman L Effect of adsorbed proteins on the wettability of hydrophilic and hydrophobic solids 1962
90 Vroman L Adams A Fischer G Munoz P Interaction of high molecular weight kininogen factor XII and fibrinogen in plasma at interfaces Blood 1980 55 156-159
91 Lynch I Dawson K A Linse S Detecting Cryptic Epitopes Created by Nanoparticles Science Signaling 2006 2006 pe14-pe14
92 Cedervall T Lynch I Lindman S Berggaringrd T Thulin E Nilsson H Dawson K A Linse S Understanding the nanoparticlendashprotein corona using methods to quantify exchange rates and affinities of proteins for nanoparticles Proceedings of the National Academy of Sciences 2007 104 2050-2055
93 Patel H Serum opsonins and liposomes Their interaction and opsonophagocytosis Crit Rev Ther Drug Carrier Syst 1991 9 39-90
94 Chonn A Semple S Cullis P Association of blood proteins with large unilamellar liposomes in vivo Relation to circulation lifetimes J Biol Chem 1992 267 18759-18765
95 Lunov O Syrovets T Loos C Beil J Delacher M Tron K Nienhaus G U Musyanovych A Mailander V Landfester K Simmet T Differential uptake of functionalized polystyrene nanoparticles by human macrophages and a monocytic cell line ACS Nano 2011 5 1657-69
96 Aringkesson A Caacuterdenas M Elia G Monopoli M P Dawson K A The protein corona of dendrimers PAMAM binds and activates complement proteins in human plasma in a generation dependent manner Rsc Advances 2012 2 11245-11248
References 179 97 Roser M Fischer D Kissel T Surface-modified biodegradable albumin nano- and microspheres II effect of surface charges on in vitro phagocytosis and biodistribution in rats European Journal of Pharmaceutics and Biopharmaceutics 1998 46 255-263
98 Carrstensen H Muumlller R H Muumlller B W Particle size surface hydrophobicity and interaction with serum of parenteral fat emulsions and model drug carriers as parameters related to RES uptake Clin Nutr 1992 11 289-297
99 Muumlller R H Wallis K H Troester S D Kreuter J In vitro characterization of poly (methyl-methaerylate) nanoparticles and correlation to their in vivo fate J Controlled Release 1992 20 237-246
100 Teichroeb J Forrest J Ngai V Jones L Anomalous thermal denaturing of proteins adsorbed to nanoparticles The European Physical Journal E 2006 21 19-24
101 Karajanagi S S Vertegel A A Kane R S Dordick J S Structure and function of enzymes adsorbed onto single-walled carbon nanotubes Langmuir 2004 20 11594-11599
102 Norde W Giacomelli C E BSA structural changes during homomolecular exchange between the adsorbed and the dissolved states J Biotechnol 2000 79 259-268
103 Wan S Kelly P M Mahon E Stoumlckmann H Rudd P M Caruso F Dawson K A Yan Y Monopoli M P The ldquoSweetrdquo Side of the Protein Corona Effects of Glycosylation on NanoparticlendashCell Interactions ACS Nano 2015 9 2157-2166
104 Gref R Luumlck M Quellec P Marchand M Dellacherie E Harnisch S Blunk T Muumlller R H lsquoStealthrsquo corona-core nanoparticles surface modified by polyethylene glycol (PEG) influences of the corona (PEG chain length and surface density) and of the core composition on phagocytic uptake and plasma protein adsorption Colloids Surf B Biointerfaces 2000 18 301-313
105 Peracchia M Harnisch S Pinto-Alphandary H Gulik A Dedieu J Desmaele D drsquoAngelo J Muumlller R Couvreur P Visualization of in vitro protein-rejecting properties of PEGylated stealthreg polycyanoacrylate nanoparticles Biomaterials 1999 20 1269-1275
106 Kim H R Andrieux K Delomenie C Chacun H Appel M Desmaeumlle D Taran F Georgin D Couvreur P Taverna M Analysis of plasma protein adsorption onto PEGylated nanoparticles by complementary methods 2‐DE CE and Protein Lab‐on‐chipreg system Electrophoresis 2007 28 2252-2261
107 Schoumlttler S Becker G Winzen S Steinbach T Mohr K Landfester K Mailaumlnder V Wurm F R Protein adsorption is required for stealth effect of poly(ethylene glycol)- and poly(phosphoester)-coated nanocarriers Nat Nano 2016 advance online publication
108 Winzen S Schoettler S Baier G Rosenauer C Mailaender V Landfester K Mohr K Complementary analysis of the hard and soft protein corona sample preparation critically effects corona composition Nanoscale 2015 7 2992-3001
109 Bouchemal K New challenges for pharmaceutical formulations and drug delivery systems characterization using isothermal titration calorimetry Drug Discovery Today 2008 13 960-972
110 Lindman S Lynch I Thulin E Nilsson H Dawson K A Linse S Systematic investigation of the thermodynamics of HSA adsorption to N-iso-propylacrylamideN-tert-butylacrylamide copolymer nanoparticles Effects of particle size and hydrophobicity Nano Lett 2007 7 914-920
111 Tsai D-H DelRio F W Keene A M Tyner K M MacCuspie R I Cho T J Zachariah M R Hackley V A Adsorption and Conformation of Serum Albumin Protein on Gold Nanoparticles Investigated Using Dimensional Measurements and in Situ Spectroscopic Methods Langmuir 2011 27 2464-2477
180 112 Siegert A Radiation Laboratory report no 465 Massachusetts Institute of Technology Cambridge 1943
113 Burchard W Richtering W Dynamic light scattering from polymer solutions Relaxation in Polymers Pietralla M Pechhold W Eds Steinkopff Darmstadt 1989 pp 151-163
114 Rausch K Reuter A Fischer K Schmidt M Evaluation of nanoparticle aggregation in human blood serum Biomacromolecules 2010 11 2836-2839
115 Mohr K Sommer M Baier G Schoumlttler S Okwieka P Tenzer S Landfester K Mailaumlnder V Schmidt M Meyer R Aggregation behavior of polystyrene-nanoparticles in human blood serum and its impact on the in vivo distribution in mice J Nanomed Nanotechnol 2014 5
116 Koynov K Butt H-J Fluorescence correlation spectroscopy in colloid and interface science Current Opinion in Colloid amp Interface Science 2012 17 377-387
117 Rocker C Potzl M Zhang F Parak W J Nienhaus G U A quantitative fluorescence study of protein monolayer formation on colloidal nanoparticles Nat Nano 2009 4 577-580
118 Smith P K Krohn R I Hermanson G T Mallia A K Gartner F H Provenzano M D Fujimoto E K Goeke N M Olson B J Klenk D C Measurement of protein using bicinchoninic acid Anal Biochem 1985 150 76-85
119 Reynolds J A Tanford C The gross conformation of protein-sodium dodecyl sulfate complexes J Biol Chem 1970 245 5161-5165
120 Gygi S P Corthals G L Zhang Y Rochon Y Aebersold R Evaluation of two-dimensional gel electrophoresis-based proteome analysis technology Proceedings of the National Academy of Sciences 2000 97 9390-9395
121 Burkhart J M Schumbrutzki C Wortelkamp S Sickmann A Zahedi R P Systematic and quantitative comparison of digest efficiency and specificity reveals the impact of trypsin quality on MS-based proteomics Journal of proteomics 2012 75 1454-1462
122 Tenzer S Docter D Kuharev J Musyanovych A Fetz V Hecht R Schlenk F Fischer D Kiouptsi K Reinhardt C Landfester K Schild H Maskos M Knauer S K Stauber R H Rapid formation of plasma protein corona critically affects nanoparticle pathophysiology Nat Nanotechnol 2013 8 772-81
123 Hunter R J Zeta potential in colloid science principles and applications Academic press 2013 Vol 2
124 Ritz S Schottler S Kotman N Baier G Musyanovych A Kuharev J Landfester K Schild H Jahn O Tenzer S Mailander V Protein corona of nanoparticles distinct proteins regulate the cellular uptake Biomacromolecules 2015 16 1311-21
125 Baier G Costa C Zeller A Baumann D Sayer C Araujo P H H Mailaumlnder V Musyanovych A Landfester K BSA Adsorption on Differently Charged Polystyrene Nanoparticles using Isothermal Titration Calorimetry and the Influence on Cellular Uptake Macromol Biosci 2011 11 628-638
126 Gianazza E Arnaud P Chromatography of plasma proteins on immobilized Cibacron Blue F3-GA Mechanism of the molecular interaction Biochem J 1982 203 637-641
References 181 127 Ghiggeri G M Candiano G Delfino G Queirolo C Highly selective one-step chromatography of serum and urinary albumin on immobilized Cibacron Blue F3GA Studies on normal and glycosyl albumin Clin Chim Acta 1985 145 205-211
128 Armstrong J Wenby R Meiselman H Fisher T The hydrodynamic radii of macromolecules and their effect on red blood cell aggregation Biophys J 2004 87 4259-4270
129 Rausch K Interaktions-und Aggregationsverhalten von Nanopartikeln in Blutserum Universitaumltsbibliothek Mainz 2013
130 Rezaei-Tavirani M Moghaddamnia S H Ranjbar B Amani M Marashi S-A Conformational study of human serum albumin in pre-denaturation temperatures by differential scanning calorimetry circular dichroism and UV spectroscopy BMB Reports 2006 39 530-536
131 Ehrenberg M S Friedman A E Finkelstein J N Oberdoumlrster G McGrath J L The influence of protein adsorption on nanoparticle association with cultured endothelial cells Biomaterials 2009 30 603-610
132 Dutta D Sundaram S K Teeguarden J G Riley B J Fifield L S Jacobs J M Addleman S R Kaysen G A Moudgil B M Weber T J Adsorbed proteins influence the biological activity and molecular targeting of nanomaterials Toxicol Sci 2007 100 303-315
133 Hawkins C L Davies M J Generation and propagation of radical reactions on proteins Biochim Biophys Acta 2001 1504 196-219
134 Honn K V Singley J A Chavin W Fetal bovine serum a multivariate standard Exp Biol Med 1975 149 344-347
135 Walkey C D Olsen J B Guo H Emili A Chan W C Nanoparticle size and surface chemistry determine serum protein adsorption and macrophage uptake JACS 2012 134 2139-2147
136 Pozzi D Caracciolo G Capriotti A L Cavaliere C La Barbera G Anchordoquy T J Laganagrave A Surface chemistry and serum type both determine the nanoparticlendashprotein corona Journal of proteomics 2015 119 209-217
137 Schoumlttler S Klein K Landfester K Mailaumlnder V Protein source and choice of anticoagulant decisively affect nanoparticle protein corona and cellular uptake Nanoscale 2016
138 Hajipour M J Laurent S Aghaie A Rezaee F Mahmoudi M Personalized protein coronas a ldquokeyrdquo factor at the nanobiointerface Biomaterials Science 2014 2 1210-1221
139 Caracciolo G Caputo D Pozzi D Colapicchioni V Coppola R Size and charge of nanoparticles following incubation with human plasma of healthy and pancreatic cancer patients Colloids Surf B Biointerfaces 2014 123 673-678
140 Barone G Giancola C Verdoliva A DSC studies on the denaturation and aggregation of serum albumins Thermochim Acta 1992 199 197-205
141 Vermeer A W Norde W van Amerongen A The UnfoldingDenaturation of Immunogammaglobulin of Isotype 2b and its F ab and F c Fragments Biophys J 2000 79 2150-2154
142 Wagner V Dullaart A Bock A-K Zweck A The emerging nanomedicine landscape Nat Biotech 2006 24 1211-1217
182 143 Prensner J R Chinnaiyan A M Srivastava S Systematic evidence-based discovery of biomarkers at the NCI Clin Exp Metastasis 2012 29 645-652
144 Junod S W FDA and clinical drug trials a short history A Quick Guide to Clinical Trials For People Who May Not Know It All 2014 21-51
145 McGonigle P Ruggeri B Animal models of human disease Challenges in enabling translation Biochem Pharmacol 2014 87 162-171
146 Perel P Roberts I Sena E Wheble P Briscoe C Sandercock P Macleod M Mignini L E Jayaram P Khan K S Comparison of treatment effects between animal experiments and clinical trials systematic review BMJ 2007 334 197
147 Mak I Evaniew N Ghert M Lost in translation animal models and clinical trials in cancer treatment Am J Transl Res 2014 6 114-8
148 Seok J Warren H S Cuenca A G Mindrinos M N Baker H V Xu W Richards D R McDonald-Smith G P Gao H Hennessy L Finnerty C C Loacutepez C M Honari S Moore E E Minei J P Cuschieri J Bankey P E Johnson J L Sperry J Nathens A B Billiar T R West M A Jeschke M G Klein M B Gamelli R L Gibran N S Brownstein B H Miller-Graziano C Calvano S E Mason P H Cobb J P Rahme L G Lowry S F Maier R V Moldawer L L Herndon D N Davis R W Xiao W Tompkins R G Inflammation t Host Response to Injury L S C R P Genomic responses in mouse models poorly mimic human inflammatory diseases Proceedings of the National Academy of Sciences 2013 110 3507-3512
149 Cabib S Orsini C Moal M L Piazza P V Abolition and Reversal of Strain Differences in Behavioral Responses to Drugs of Abuse After a Brief Experience Science 2000 289 463-465
150 Pozzi D Caracciolo G Capriotti A L Cavaliere C La Barbera G Anchordoquy T J Lagana A Surface chemistry and serum type both determine the nanoparticle-protein corona J Proteomics 2015 119 209-17
151 Zhao X B Muthusamy N Byrd J C Lee R J Cholesterol as a bilayer anchor for PEGylation and targeting ligand in folate‐receptor‐targeted liposomes J Pharm Sci 2007 96 2424-2435
152 Nuhn L Gietzen S Mohr K Fischer K Toh K Miyata K Matsumoto Y Kataoka K Schmidt M Zentel R Aggregation behavior of cationic nanohydrogel particles in human blood serum Biomacromolecules 2014 15 1526-1533
153 Chai W Synthese und Charakterisierung von multivalenten kationischen Tensiden und Polymeren Universitaumltsbibliothek Mainz 2012
Appendix 183
7 APPENDIX
71 ABBREVIATIONS
A baseline
a amplitude
AF-FFF asymmetric flow-field flow fractionation
ACF autocorrelation dunction
BNF bionized nanofferite
BSA bovine serum albumin
Chol cholesterol
CD circular dichroism
CMC critical micelle concentration
cp coated particle
D diffusion coefficient
DEX dextran
DOTAP 12-dioleoyl-3-trimethylammoniopropane
DOTMA N-[1-(2 3-dioleyloxy)propyl]-NNN-trimethylammonium chloride
DOX doxorubicin
DLS dynamic light scattering
DSPC distearoyl phosphatodylcholine
E elution fraction
ε dielectric constant
EPC egg phosphatidyl choline
EPR enhanced permeability and retention
f intensity contribution
FBS fetal bovine serum
FCS fluorescence correlation spectroscopy
FT flow through
g1(t) experimental field autocorrelation function
g2(t) intensity autocorrelation function
184 hbPG hyperbranched polyglycerol
HES hydroxyl ethyl starch
HI heat inactivated
HSA human serum albumin
IgG immunoglobulin G
ITC isothermal titration calorimetry
L liposome
LC-MS liquid chromatography-mass spectrometry
η viscosity
NP nanoparticles
PEG poly (ethylene glycol)
PS polystyrene
q scattering angle
p particle
ρ ratio of radius or gyration and hydrodynamic radius
Rg radius of gyration
Rh hydrodynamic radius
RNAi RNA interference
SDS sodium dodecyl sulfate
SDS-PAGE SDS polyacrylamide gel electrophoresis
T temperature
Г correlation time
TF 1-hydroxy-50-amino-3471013161922-octaoxa-374145-triaza-
pentacontane
TLR toll like receptor
TNT 135-triazinine-246-trione
TOF time of flight
uE electrophoretic mobility
ζ zeta potential
Appendix 185
72 SUPPLEMENTARY INFORMATION
721 LC-MS DATA FOR BLOOD PLASMA FRACTIONATION
Pro
tein
nam
e
Average percentage of total protein
IgG
IgG
de
ple
ted
pla
sma
HSA
de
ple
ted
pla
sma
HSA
(A
ffiB
lue
on
ly)
HSA
(co
lum
ns
in s
eri
es)
Alpha-1-acid glycoprotein 1 000 054 419 000 000
Alpha-1-acid glycoprotein 2 000 190 199 000 000
Alpha-1-antichymotrypsin 000 050 101 013 043
Alpha-1-antitrypsin 000 161 1338 000 000
Alpha-2-macroglobulin 000 120 725 003 002
Ceruloplasmin 000 050 254 000 000
Fibronectin 000 021 000 000 002
Haptoglobin 000 105 631 007 004
Haptoglobin-related protein 166 025 141 000 001
Serum amyloid P-component 000 004 000 000 005
Alpha-2-antiplasmin 000 021 059 000 000
Antithrombin-III 000 046 000 011 016
Coagulation factor XII 006 000 000 000 000
Fibrinogen alpha chain 002 062 000 013 048
Fibrinogen beta chain 003 185 000 051 082
Fibrinogen gamma chain 014 155 000 042 121
Heparin cofactor 2 000 018 000 000 000
186
Histidine-rich glycoprotein 010 007 000 000 000
Kininogen-1 000 020 051 015 020
Plasminogen 030 006 000 000 000
Prothrombin 000 016 000 051 006
C4b-binding protein alpha chain 045 015 000 000 000
Complement C1q subcomponent subunit A 014 000 000 000 000
Complement C1q subcomponent subunit B 018 000 000 000 000
Complement C1q subcomponent subunit C 013 000 000 000 000
Complement C1r subcomponent 011 000 000 000 000
Complement C1s subcomponent 007 000 000 000 000
Complement C3 040 061 124 034 074
Complement C4-A 001 008 012 081 016
Complement C4-B 013 035 074 161 000
Complement component C8 gamma chain 004 000 000 000 000
Complement factor B 007 115 000 084 024
Complement factor H 017 044 000 000 000
Complement factor H-related protein 1 002 000 000 000 000
Plasma protease C1 inhibitor 000 015 000 014 015
Ig alpha-1 chain C region 106 098 536 045 033
Ig alpha-2 chain C region 024 041 277 010 007
Ig delta chain C region 002 000 000 002 000
Ig gamma-1 chain C region 3745 008 102 1535 000
Ig gamma-2 chain C region 853 000 280 227 000
Ig gamma-3 chain C region 073 000 002 025 000
Ig gamma-4 chain C region 083 000 041 013 000
Ig heavy chain V-I region HG3 014 000 000 000 000
Appendix 187
Ig heavy chain V-I region V35 005 000 000 000 000
Ig heavy chain V-II region ARH-77 028 000 000 009 000
Ig heavy chain V-II region NEWM 004 000 000 000 000
Ig heavy chain V-II region WAH 005 000 000 000 000
Ig heavy chain V-III region BRO 104 011 032 046 000
Ig heavy chain V-III region BUT 022 000 000 000 000
Ig heavy chain V-III region CAM 003 000 000 000 000
Ig heavy chain V-III region GAL 023 000 000 009 000
Ig heavy chain V-III region JON 013 000 000 000 000
Ig heavy chain V-III region POM 001 000 000 000 000
Ig heavy chain V-III region TIL 000 000 010 013 000
Ig heavy chain V-III region TUR 029 000 000 000 000
Ig heavy chain V-III region VH26 019 000 009 014 000
Ig heavy chain V-III region WEA 008 000 001 005 000
Ig kappa chain C region 1788 127 647 837 131
Ig kappa chain V-I region AG 042 062 011 090 000
Ig kappa chain V-I region AU 004 000 000 000 000
Ig kappa chain V-I region CAR 011 000 000 000 000
Ig kappa chain V-I region EU 015 000 000 010 000
Ig kappa chain V-I region Gal 001 000 000 000 000
Ig kappa chain V-I region Hau 000 000 000 000 000
Ig kappa chain V-I region HK101 (Fragment) 002 000 000 000 000
Ig kappa chain V-I region Lay 013 000 007 000 000
Ig kappa chain V-I region Roy 006 000 000 000 000
Ig kappa chain V-I region Scw 005 000 000 000 000
Ig kappa chain V-I region WEA 004 000 000 001 000
188
Ig kappa chain V-I region Wes 012 000 000 000 000
Ig kappa chain V-II region Cum 009 000 000 002 000
Ig kappa chain V-II region GM607 (Fragment) 001 000 000 000 000
Ig kappa chain V-II region RPMI 6410 007 000 000 000 000
Ig kappa chain V-II region TEW 072 000 026 028 000
Ig kappa chain V-III region GOL 020 000 000 000 004
Ig kappa chain V-III region HIC 016 000 000 000 000
Ig kappa chain V-III region IARCBL41 006 000 000 000 000
Ig kappa chain V-III region NG9 (Fragment) 004 000 000 012 000
Ig kappa chain V-III region SIE 054 011 014 030 000
Ig kappa chain V-III region Ti 078 000 009 000 000
Ig kappa chain V-III region VG (Fragment) 034 000 023 009 000
Ig kappa chain V-IV region JI 005 000 000 000 000
Ig kappa chain V-IV region Len 070 006 019 019 000
Ig kappa chain V-IV region STH (Fragment) 006 000 000 000 000
Ig lambda chain V-I region HA 041 000 000 000 000
Ig lambda chain V-I region WAH 010 000 000 000 000
Ig lambda chain V-III region LOI 007 000 000 000 000
Ig lambda chain V-III region SH 500 000 000 000 000
Ig lambda-1 chain C regions 000 000 136 000 000
Ig lambda-2 chain C regions 132 035 298 158 016
Ig lambda-7 chain C region 268 000 000 000 000
Ig mu chain C region 286 075 139 257 146
Ig mu heavy chain disease protein 316 082 139 000 021
Immunoglobulin J chain 014 000 010 008 000
Immunoglobulin lambda-like polypeptide 5 393 030 000 047 000
Appendix 189
Apolipoprotein A-I 000 010 217 000 000
Apolipoprotein A-II 000 000 028 000 000
Apolipoprotein A-IV 000 000 022 000 000
Apolipoprotein B-100 000 022 000 000 000
Beta-2-glycoprotein 1 065 535 000 196 039
Clusterin 000 023 014 000 000
Phosphatidylcholine-sterol acyltransferase 000 000 005 000 000
Serum paraoxonasearylesterase 1 000 020 025 000 000
Afamin 000 004 027 000 000
Alpha-1B-glycoprotein 000 034 240 000 000
Alpha-2-HS-glycoprotein 000 053 171 000 000
Angiotensinogen 000 008 103 000 000
Attractin 000 000 009 000 000
Beta-Ala-His dipeptidase 000 000 005 000 000
Cholinesterase 000 000 011 000 000
Corticosteroid-binding globulin 000 004 052 000 000
Hemopexin 000 175 336 149 182
Inter-alpha-trypsin inhibitor heavy chain H1 000 049 000 056 012
Inter-alpha-trypsin inhibitor heavy chain H2 000 026 000 132 022
Inter-alpha-trypsin inhibitor heavy chain H4 000 020 000 009 005
Leucine-rich alpha-2-glycoprotein 000 000 092 000 000
N(G)N(G)-dimethylarginine dimethylaminohydrolase 1
000 000 009 000 000
Pregnancy zone protein 000 050 058 000 000
Protein AMBP 000 012 023 018 008
Serotransferrin 004 278 451 165 280
Serum albumin 056 5692 408 4739 8414
190
Thyroxine-binding globulin 000 000 019 000 000
Transthyretin 000 047 285 000 000
Vitamin D-binding protein 000 025 216 000 000
Zinc-alpha-2-glycoprotein 000 125 084 000 000
Acylpyruvase FAHD1 mitochondrial 000 066 000 088 195
Brain and acute leukemia cytoplasmic protein 001 000 000 000 000
BTBPOZ domain-containing protein KCTD12 000 159 000 186 000
BTBPOZ domain-containing protein KCTD2 000 000 066 000 000
CD5 antigen-like 024 006 008 008 000
Coronin-1B 000 009 000 000 000
DDB1- and CUL4-associated factor 8 000 000 014 000 000
Hemoglobin subunit beta 000 000 016 000 000
Lumican 000 000 015 000 000
Lysophospholipid acyltransferase LPCAT4 000 023 000 004 000
Methylglutaconyl-CoA hydratase mitochondrial 000 000 000 000 006
Methylmalonyl-CoA epimerase mitochondrial 000 000 018 000 000
N-acetylmuramoyl-L-alanine amidase 003 000 000 007 000
N-alpha-acetyltransferase 10 000 007 000 000 000
Potassium voltage-gated channel subfamily C member 2
000 185 000 000 000
Protein Njmu-R1 000 121 000 183 000
SHC-transforming protein 1 000 000 032 000 000
Sorting nexin-32 000 000 007 000 000
Tubulin beta-4A chain 000 000 000 021 000
Tubulin beta-4B chain 000 000 017 000 000
Vitronectin 000 018 000 000 000
Appendix 191
Protein name E1 E2 E3 E4
BTBPOZ domain-containing protein KCTD12 000 484 000 182
Kv channel-interacting protein 2 000 000 000 007
Myocyte-specific enhancer factor 2A 000 000 000 004
Ribosomal RNA small subunit methyltransferase NEP1 000 000 000 003
Protein Njmu-R1 000 114 000 000
Thymidine phosphorylase 000 009 000 000
Tubulin beta-4A chain 000 008 000 000
Corticosteroid-binding globulin 000 008 000 000
Transcription factor IIIB 50 kDa subunit 000 004 000 000
Calmodulin-like protein 3 000 002 000 000
Dihydropyrimidinase 000 002 000 000
Ras-related protein Rab-4A 000 002 000 000
Leucine-rich alpha-2-glycoprotein 000 002 000 000
Alpha-16-mannosyl-glycoprotein 2-beta-N-acetylglucosaminyltransferase
033 000 000 000
ADP-ribosylation factor-like protein 8B 011 000 000 000
FERM and PDZ domain-containing protein 2 008 000 000 000
DNA replication factor Cdt1 002 000 000 000
UPF0160 protein MYG1 mitochondrial 002 000 000 000
Paired mesoderm homeobox protein 1 000 000 000 000
Serglycin 000 000 000 000
LysM and putative peptidoglycan-binding domain-containing protein 1
000 000 000 000
Alpha-1-antitrypsin 000 213 218 135
Haptoglobin 000 163 106 114
192
Alpha-2-macroglobulin 000 116 068 086
Ceruloplasmin 000 003 053 065
Alpha-1-antichymotrypsin 000 014 034 037
Fibronectin 000 000 019 031
Alpha-1-acid glycoprotein 1 000 056 047 024
Haptoglobin-related protein 000 037 029 013
Serum amyloid P-component 000 000 000 012
Alpha-1-acid glycoprotein 2 000 110 019 006
Fibrinogen gamma chain 000 113 134 262
Fibrinogen beta chain 000 066 090 177
Fibrinogen alpha chain 000 050 055 097
Prothrombin 000 000 000 089
Kininogen-1 000 015 022 031
Plasminogen 032 020 000 004
Antithrombin-III 000 013 007 003
Alpha-2-antiplasmin 000 011 000 000
Complement C3 000 012 090 147
Complement C4-B 000 000 033 080
Plasma protease C1 inhibitor 000 000 023 029
Complement factor H 000 003 000 016
Complement component C9 000 000 000 009
C4b-binding protein alpha chain 000 000 002 006
Complement factor B 008 028 003 003
Complement component C8 gamma chain 000 001 000 000
Complement C4-A 000 000 000 000
Ig kappa chain C region 2734 441 343 390
Appendix 193
Ig mu chain C region 000 258 309 270
Ig gamma-1 chain C region 3804 294 102 134
Ig alpha-1 chain C region 002 096 088 105
Immunoglobulin lambda-like polypeptide 5 506 000 061 059
Ig heavy chain V-III region BRO 070 034 024 044
Ig lambda-3 chain C regions 000 000 000 033
Ig alpha-2 chain C region 000 037 025 024
Ig gamma-2 chain C region 808 074 023 019
Ig kappa chain V-II region TEW 072 021 015 017
Ig kappa chain V-I region AG 019 006 011 014
Immunoglobulin J chain 000 007 011 013
Ig kappa chain V-III region SIE 062 024 009 009
Ig heavy chain V-III region BUT 000 000 004 000
Ig gamma-3 chain C region 149 021 000 000
Ig heavy chain V-I region HG3 000 002 000 000
Ig lambda-7 chain C region 209 000 000 000
Ig gamma-4 chain C region 081 000 000 000
Ig kappa chain V-I region WEA 023 000 000 000
Ig heavy chain V-II region ARH-77 022 000 000 000
Ig lambda chain V-III region LOI 019 000 000 000
Ig lambda chain V-I region WAH 017 000 000 000
Ig heavy chain V-III region TUR 015 000 000 000
Ig kappa chain V-I region EU 014 000 000 000
Ig heavy chain V-III region GAL 013 000 000 000
Ig heavy chain V-III region VH26 012 000 000 000
Ig kappa chain V-III region NG9 (Fragment) 012 000 000 000
194
Ig kappa chain V-IV region Len 011 000 000 000
Ig lambda chain V-III region SH 010 000 000 000
Ig kappa chain V-IV region STH (Fragment) 010 000 000 000
Ig heavy chain V-III region WEA 009 000 000 000
Apolipoprotein A-I 000 066 052 083
Apolipoprotein A-IV 000 025 000 030
Apolipoprotein B-100 000 026 000 019
Serum paraoxonasearylesterase 1 000 000 000 018
Clusterin 000 030 014 018
Beta-2-glycoprotein 1 181 018 000 000
Apolipoprotein A-II 000 000 000 000
Serum albumin 000 5808 7513 6482
Inter-alpha-trypsin inhibitor heavy chain H2 000 000 009 081
Hemopexin 108 270 114 072
Transthyretin 000 000 018 072
Pregnancy zone protein 000 017 000 058
Inter-alpha-trypsin inhibitor heavy chain H1 000 000 000 054
Protein AMBP 000 000 000 041
Serotransferrin 915 517 095 041
Alpha-2-HS-glycoprotein 000 059 040 036
Vitamin D-binding protein 000 039 019 014
Alpha-1B-glycoprotein 000 029 027 014
Angiotensinogen 000 009 016 012
Retinol-binding protein 4 000 000 000 009
Afamin 000 003 000 002
Zinc-alpha-2-glycoprotein 001 015 006 001
Appendix 195
Inter-alpha-trypsin inhibitor heavy chain H4 000 005 000 000
Vitronectin 000 000 000 021
CD5 antigen-like 000 008 000 009
Lumican 000 000 000 005
Keratin type II cytoskeletal 1 000 028 000 000
Keratin type I cytoskeletal 9 000 018 000 000
Keratin type II cytoskeletal 2 epidermal 000 006 000 000
Keratin type I cytoskeletal 14 000 003 000 000
Keratin type I cytoskeletal 10 000 003 000 000
Keratin type II cytoskeletal 6B 000 001 000 000
Keratin type I cytoskeletal 16 000 001 000 000
Keratin type I cytoskeletal 15 000 000 000 000
196
722 OVERVIEW OF SOFT CORONA ANALYSIS CHAPTER 621
DLS soft corona analysis with duplicates of all particles without pre-coating
Appendix 197
723 OVERVIEW OF HARD PROTEIN CORONA ANALYSIS CHAPTER 631
De
scri
pti
on
average
Hu
man
Pla
sma
PS
PS-
Lut-
CO
OH
PS-
Lut-
NH
2
Ceruloplasmin 034 000 000 000
Haptoglobin 170 000 000 000
Haptoglobin-related protein 007 009 000 008
Alpha-1-antitrypsin 157 025 000 038
Alpha-1-antichymotrypsin 035 000 000 000
Alpha-2-macroglobulin 089 000 000 000
Serum amyloid P-component 006 000 000 000
Fibronectin 029 012 000 000
Alpha-1-acid glycoprotein 1 005 000 000 000
Serum amyloid A-1 protein 000 000 022 009
Lipopolysaccharide-binding protein 000 000 053 005
Alpha-1-acid glycoprotein 2 002 000 000 000
Alpha-2-antiplasmin 007 000 000 000
Antithrombin-III 016 000 000 005
Coagulation factor V 000 000 037 000
Coagulation factor XI 000 000 036 000
Fibrinogen alpha chain 085 028 785 032
Fibrinogen beta chain 100 051 623 042
Fibrinogen gamma chain 146 057 605 054
Heparin cofactor 2 037 000 000 000
198
Histidine-rich glycoprotein 008 000 582 000
Hyaluronan-binding protein 2 000 000 021 000
Kininogen-1 120 000 499 000
Plasma kallikrein 004 000 029 000
Plasminogen 016 000 000 000
Prothrombin 021 000 000 000
C4b-binding protein alpha chain 015 011 000 000
Complement C1q subcomponent subunit A 002 000 000 000
Complement C1q subcomponent subunit B 011 000 000 000
Complement C1q subcomponent subunit C 007 000 000 000
Complement C1r subcomponent 001 025 000 033
Complement C1s subcomponent 006 018 000 032
Complement C3 072 073 000 145
Complement C4-A 007 029 000 012
Complement C4-B 012 020 000 010
Complement component C8 alpha chain 003 000 000 000
Complement component C8 gamma chain 002 000 000 000
Complement component C9 005 000 000 000
Complement factor B 018 000 000 000
Complement factor H 027 000 020 000
Complement factor H-related protein 1 000 000 021 000
Plasma protease C1 inhibitor 015 028 008 037
Immunoglobulin lambda-like polypeptide 5 119 000 000 000
Immunoglobulin J chain 012 000 000 000
Ig kappa chain V-I region AG 032 000 000 000
Ig kappa chain V-I region EU 018 000 000 000
Appendix 199
Ig kappa chain V-I region HK102 (Fragment) 002 000 000 000
Ig kappa chain V-I region Lay 011 000 000 000
Ig kappa chain V-II region TEW 027 000 000 000
Ig kappa chain V-III region SIE 058 000 000 000
Ig kappa chain V-IV region Len 028 000 000 000
Ig heavy chain V-I region HG3 013 000 000 000
Ig heavy chain V-III region WEA 004 000 000 000
Ig heavy chain V-III region VH26 016 000 000 000
Ig heavy chain V-III region TIL 013 000 000 000
Ig heavy chain V-III region BRO 054 000 000 000
Ig heavy chain V-III region GAL 012 000 000 000
Ig kappa chain C region 863 108 013 047
Ig gamma-1 chain C region 830 000 000 026
Ig gamma-2 chain C region 269 000 000 000
Ig gamma-2 chain C region 000 012 000 013
Ig gamma-3 chain C region 038 000 000 000
Ig gamma-4 chain C region 014 000 000 000
Ig mu chain C region 245 000 000 000
Ig mu chain C region 000 115 000 031
Ig alpha-1 chain C region 111 000 000 000
Ig alpha-1 chain C region 000 025 000 020
Ig alpha-2 chain C region 011 000 000 000
Ig delta chain C region 001 000 000 000
Ig mu heavy chain disease protein 003 000 000 000
Ig kappa chain V-III region VG (Fragment) 015 000 000 000
Ig heavy chain V-II region ARH-77 011 000 000 000
200
Ig lambda-6 chain C region 000 000 000 018
Ig lambda-2 chain C regions 252 000 000 000
Ig heavy chain V-I region V35 003 000 000 000
Ig lambda chain V-III region LOI 011 000 000 000
Bcl-2-related protein A1 011 000 000 000
Apolipoprotein A-I 123 1669 522 1483
Apolipoprotein A-II 000 000 000 025
Apolipoprotein A-IV 013 1154 010 1503
Apolipoprotein B-100 017 066 000 065
Apolipoprotein C-III 000 306 164 924
Apolipoprotein D 000 023 000 089
Apolipoprotein E 003 377 225 315
Beta-2-glycoprotein 1 145 000 968 000
Clusterin 034 5181 1444 4280
Ig alpha-1 chain C region 000 025 000 020
Phospholipid transfer protein 000 016 000 065
Serum paraoxonasearylesterase 1 006 037 000 049
Afamin 015 000 000 000
Alpha-1B-glycoprotein 013 000 000 000
Alpha-2-HS-glycoprotein 033 000 000 000
Angiotensinogen 027 000 000 000
Hemoglobin subunit alpha 001 000 000 000
Hemoglobin subunit beta 003 000 000 000
Hemopexin 082 000 000 000
Ig lambda-3 chain C regions 000 031 000 000
Inter-alpha-trypsin inhibitor heavy chain H1 018 000 000 000
Appendix 201
Inter-alpha-trypsin inhibitor heavy chain H2 017 007 000 008
Inter-alpha-trypsin inhibitor heavy chain H4 010 000 598 000
Leucine-rich alpha-2-glycoprotein 002 000 000 000
Pregnancy zone protein 008 000 000 000
Probable ATP-dependent RNA helicase DDX46 000 000 000 006
Protein AMBP 011 000 000 000
Protein Njmu-R1 005 000 000 000
Putative protein ZNF815 000 000 000 011
Selenoprotein P 000 000 018 000
Serotransferrin 218 000 000 000
Serum albumin 4559 089 047 080
Synaptosomal-associated protein 23 015 000 000 000
Transthyretin 039 040 048 051
UBX domain-containing protein 4 007 000 000 000
Vitamin D-binding protein 035 000 000 000
Zinc-alpha-2-glycoprotein 009 000 000 000
A-kinase anchor protein 8 000 017 000 000
CD5 antigen-like 013 007 000 000
Corticosteroid-binding globulin 004 000 000 000
Cysteine protease ATG4C 070 000 000 000
Cytoplasmic protein NCK2 008 000 000 000
Gelsolin 012 000 000 000
Ig gamma-1 chain C region 000 028 000 000
N-acetylmuramoyl-L-alanine amidase 003 000 000 000
Vitronectin 016 281 2601 405
202
724 CHARACTERIZATION OF INDIVIDUAL AND POOLED HUMAN SERUM
Determined hydrodynamic radii of individual as well as pooled human serum via DLS
Zusammenfassung 203
8 ZUSAMMENFASSUNG
Die Entwicklung von Nanomaterialien fuumlr die biomedizinische Anwendung hat in den
letzten Jahren an enormer Bedeutung gewonnen Besonders in der Therapie von
Krebserkrankungen bietet das Verpacken von Wirkstoffen in einem Traumlger viele Vorteile
gegenuumlber der Administration des Wirkstoffes alleine Nanomaterialen sind aufgrund ihrer
speziellen Eigenschaften dazu geschaffen den Wirkstoff gezielt an den Wirkort zu
transportieren Auf diese Weise koumlnnen die zytotoxischen Nebenwirkungen die waumlhrend
einer Chemotherapie auftreten reduziert werden Daruumlber hinaus wird durch das
Verpacken auch der Wirkstoff an sich vor Abbau geschuumltzt
Nichts desto trotz ist die Anwendung von Nanomaterialien in der Krebstherapie limitiert
da die physiologischen Prozesse die ein Nanotransporter nach Administration hervorruft
nur schwer prognostiziert werden koumlnnen Bisher werden Nanotransporter uumlblicherweise
intravenoumls verabreicht Das bedeutet dass diese sofort mit dem menschlichen Blut und
den darin befindlichen Proteinen in Beruumlhrung kommen Dies fuumlhrt zur raschen
Ausbildung einer Proteinhuumllle auf der Oberflaumlche der Nanomaterialien welche deren
chemischen und physikalischen Eigenschaften stark veraumlndert
Diese Studie untersucht den Einfluss einzelner Proteine sowie Proteinmischungen auf die
physikochemischen Eigenschaften von Polystyrrol-Partikeln als Modellsystem Die
Einzelproteine sowie Proteinmischungen die Albumin- bzw IgG-frei sind wurden durch
die Fraktionierung von menschlichem Blutplasma gewonnen Die Inkubation der
genannten Partikel in klar definierten Proteinmischungen wurde genutzt um eine
vorherbestimmte Proteinhuumllle auf der Partikeloberflaumlche auszubilden Diese bdquokuumlnstlicheldquo
Proteinhuumllle wurde im Anschluss untersucht im Hinblick auf stabilisierende bzw
destabilisierende Wirkung auf die Nanopartikel unter in vivo-Bedingungen mittels
dynamischer Lichtstreuung Zusaumltzlich wurde der Effekt der gegebenen Proteinhuumllle auf
die Zellaufnahme in Makrophagen uumlberpruumlft Es konnte gezeigt werden dass eine
Stabilisierung von Partikeln im Hinblick auf das Aggregationsverhalten moumlglich ist indem
man Partikel mit bestimmten Proteinen vorbeschichtet
204 Das Konzept der Partikelbeschichtung zur Stabilisierung gegenuumlber Aggregation wurde
ausgedehnt um die Schwierigkeiten zu uumlberwinden die die unterschiedliche
Blutserumzusammensetzung von verschiedenen Individuen birgt
Ein naumlchster Fokus wurde auf die Uumlbertragbarkeit verschiedener in vivo-Modelle auf den
Menschen gelegt Es zeigte sich dass sowohl das Aggregationsverhalten von
Polystyrrolpartikeln als auch jenes von Dextran- und Staumlrke-umhuumlllten Partikeln sehr stark
von der Proteinquelle abhaumlngt
Nachdem einzelne Aspekte die Einfluss auf die Proteinadsorption auf Partikeln ausuumlben
untersucht wurden wurde das Modellsystem ausgetauscht gegen liposomale Systeme die
dem siRNA-Transport dienen Das Aggregationsverhalten der Liposomen bzw Lipoplexe
wurde mittels dynamischer Lichtstreuung untersucht und optimiert
Zusammenfassend kann festgehalten werden dass verschiedene Einflussfaktoren fuumlr die
physikochemischen Eigenschaften von Nanomaterialien nach Exposition ins menschliche
Blut gezielt untersucht wurden So wurden viele Moumlglichkeiten aufgezeigt welche zur
Evaluation eines Nanomaterials vor in vivo-Versuchen herangezogen werden koumlnnen
Zusaumltzlich wurden Optionen aufgezeigt wie die Wechselwirkung von Proteinen mit
Nanomaterialien gezielt zur Stabilisierung genutzt werden kann