using the post mining land under forest stands of pt kitadin east
TRANSCRIPT

Journal of Environment and Earth Science www.iiste.org
ISSN 2224-3216 (Paper) ISSN 2225-0948 (Online)
Vol. 3, No.9, 2013
195
Using the Post Mining Land Under Forest Stands of Pt Kitadin East Kalimantan for Cattle Fodder Conservation
Yusuf Ansori1*, Abubakar M. Lahjie2, Zamruddin Hasid3, B.D.A.S, Simarangkir4
.1. Faculty of Forestry, Mulawarman University, East Kalimantan, Indonesia 2,3,4. Doctorate Program, Faculty of Forestry, Mulawarman University
*E-mail Address of the corresponding author: [email protected] . .
Abstract Coal mining has changed natural landscapes and is more likely to damage the environment. Based on this premise, a research on post-mining land use with respect to fodder conservation in the areas under forest stands was conducted. The purpose of this research was to determine the use or utilization of the post mining land under forest stands of PT Kitadin in East Kalimantan for cattle fodder conservation, which might provide answers for the improved management of post-mining land, as well as for the control and restoration of the natural balance. The results showed that each stand had a different amount of fodder/ forage production. Furthermore, the 4-year-old stands (Acacia Mangium, Enterolobium cyclocarpum, Samanea saman and Hibiscus tiliaceus) had the ability to produce fodder/ forage with the average of 7.62 tons / ha / year with the average intensity of 291,504 lux / hour for the total of 12 hours. The highest production value was found under the hibiscus plant stands, which were 10.5 tons / ha / year and the lowest was under the acacia stands with 5 tons / ha / year. The growth of cattle in the area of post-mining land was 33%, in which the farmers gained a profit of USD 300/ year by raising three cows. If it became the main source of living for the farmers, the number of cattle raised should have been 15 cows. The beef demand insofar reached merely 1.56 kg / ha / year. However, to be able to self-support itself in terms of sufficient beef supply, East Kalimantan province needed 3 kg / capita / year, which required an addition of approximately 3.950 ha land areas and 43.200 cows. Strategic policies needed for this reason were controlling the beef import and increasing domestic production, followed by an improved implementation of forest conservation program by pruning in order to adjust the light settings when the plant canopies covered each other and as well farm business producing an output of zero waste. Moreover, the empowerment of local communities and stakeholders in managing forests as cattle fodder conservation would also be necessary. Keywords: Post-mining land, forest stands, cattle fodder/ forage conservation of PT Kitadin East Kalimantan . 1. BACKGROUND The land use in East Kalimantan has changed rapidly and this change has been inevitably influenced by the global economy. It is widely known that East Kalimantan has abundant natural resources such as petroleum, natural gas, timber, gold, coal and many others. Wood, in particular, has been produced for quite a long period to meet the demands of domestic and international markets, which has resulted in the decrease of its production from year to year. In the past decade, there has been an increase in coal production to meet world market demand, so that its production continues to increase. However, coal is a non-renewable natural resource; therefore if it is not carefully managed, it will have a negative impact for the surrounding community. This is especially concerning the reclamation and re-vegetation activities in post-mining landscapes. Attempts to utilize timber estate by using social approaches focus more on the efforts to provide livelihood and improve the welfare of local communities in order to maintain the conservation of forest resources in the post-mining land. Mining concession areas in East Kalimantan province have reached 1.09 million ha (Anonymous, 2012b). The concession area belonged to PT Kitadin is 2,973 ha, which includes a reclamation area of 475 ha and a re-vegetated area of 507.5 ha. Under the forest stands of Acacia Mangium, Enterolobium cyclocarpum, Samanea saman and Hibiscus tiliaceus, cattle forage/ fodder may still grow.
2. RESEARCH OBJECTIVES The research objectives were formulated as follows: • Investigating the effect of lights on the fodder/ forage production under the stands and on the fodder/ forage
production which was not under the stands. • Knowing the development and production of cows in terms of increasing people's income. • Knowing the types of forage/ fodder which were less favored, favored, and highly favored by cattle raised on
post-mining land.

Journal of Environment and Earth Science www.iiste.org
ISSN 2224-3216 (Paper) ISSN 2225-0948 (Online)
Vol. 3, No.9, 2013
196
• Assessing which strategy would be appropriate for using the post-mining land area under the forest stands for cattle fodder conservation.
• Knowing which programs to implement in terms of raising cattle in a sustainable post-mining land. 3. RESEARCH METHODS 3.1. Research Location and Research Period The research was conducted in the post-mining land of PT Kitadin, starting from September 2011 to November 2012. PT Kitadin mining site was located in Kutai Regency, East Kalimantan Province, Indonesia. Geographically, the area of PT Kitadin mining concession was located between the latitude of 0018'00, 0 "- 0022'30, 0" and 11705'00, 0 "- 11707'49, 9" East Longitude (see Figure 1 below).
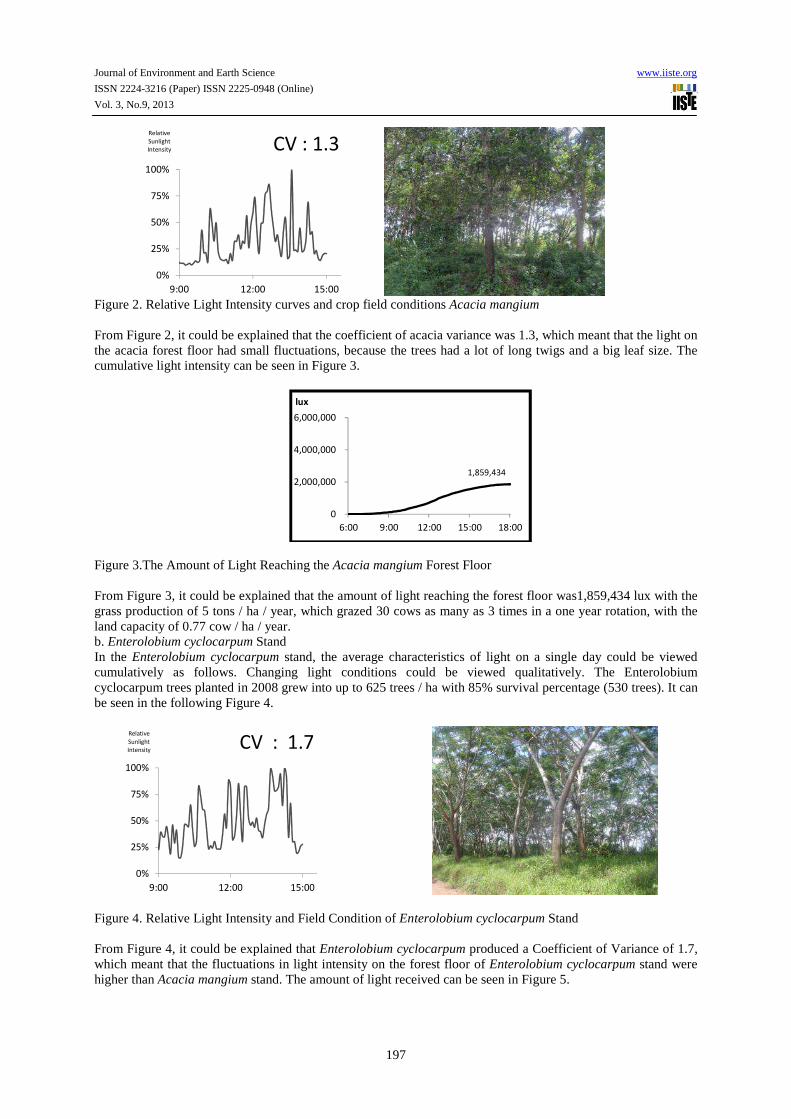
Figure 1. Map of the Research Location 3.2. Research Object and Research Instruments Object in this research was the post-mining land underthe forest stands of Acacia mangium, Enterolobium cyclocarpum, Samanea saman and Hibiscus tiliaceus as cattle fodder conservation. The instruments or tools used in this research were GPS (Global Positioning System), Altimeter, Hobo (tool to determine the light intensity), clinometer, a 50 m-length meter stick and raffia cords, analytic and digital Scales, digital camera, handy cam, calculator and computer as well as laboratory instruments for the proximate test. 3.3. Plot measurement The plots were designed into 8 units, with the size of 20 x 20 m in order to take samples of cattle fodder/ forage every 4 months, hence gaining the total weight in a year. Furthermore, on each plot, the species of grass which was less preferred; preferred, and highly preferred by cattle would be observed. The light intensity under the Acacia mangium, Enterolobium cyclocarpum, Samanea saman and Hibiscus tiliaceus stands as cattle fodder conservation was also observed. 3.4. Weighing of Cattle Fodder under Forest Stands and the Proximate Test Weighing was done after the fodder under the Acacia mangium, Enterolobium cyclocarpum, Samanea saman and Hibiscus tiliaceus stands was cut in order to know the weight which was then converted to tons / ha / year. The proximate test was done to some parts of the sample to determine the content of the nutritional value such as water content (%), crude fiber (%), protein (%) and fat (%). 3.5. Data Processing and Analysis Data concerning cattle fodder which were obtained under the forest stands as well as data on light intensity were processed and analyzed by using allometric statistical program. 4. RESULTS AND DISCUSSION 4.1. The Role of Light for the Cattle Fodder Production The investigation on the cattle fodder/ forage under forest stands can be described as follows: a. Fodder/ forage production under the Acacia mangium Stand The measurement of light intensity under forest stands which was monitored by a 5 minute interval indicated the qualitative change in the light intensity. The number of Acacia mangium trees planted in 2008, with a density of 560 trees/ ha was up to 520 trees in 2012. The relative light intensity graph can be seen in Figure 2 below. Relative Light Intensity Field Condition
Journal of Environment and Earth Science www.iiste.org
ISSN 2224-3216 (Paper) ISSN 2225-0948 (Online)
Vol. 3, No.9, 2013
197
Figure 2. Relative Light Intensity curves and crop field conditions Acacia mangium From Figure 2, it could be explained that the coefficient of acacia variance was 1.3, which meant that the light on the acacia forest floor had small fluctuations, because the trees had a lot of long twigs and a big leaf size. The cumulative light intensity can be seen in Figure 3.
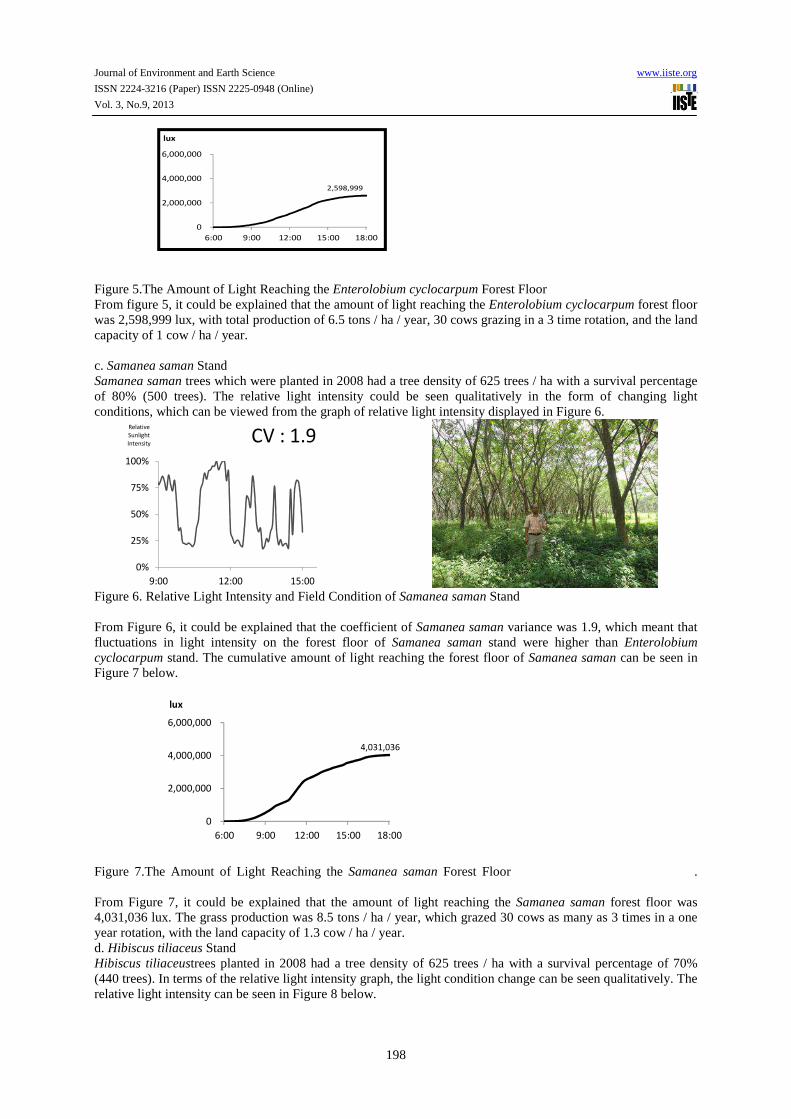
Figure 3.The Amount of Light Reaching the Acacia mangium Forest Floor From Figure 3, it could be explained that the amount of light reaching the forest floor was1,859,434 lux with the grass production of 5 tons / ha / year, which grazed 30 cows as many as 3 times in a one year rotation, with the land capacity of 0.77 cow / ha / year. b. Enterolobium cyclocarpum Stand In the Enterolobium cyclocarpum stand, the average characteristics of light on a single day could be viewed cumulatively as follows. Changing light conditions could be viewed qualitatively. The Enterolobium cyclocarpum trees planted in 2008 grew into up to 625 trees / ha with 85% survival percentage (530 trees). It can be seen in the following Figure 4.
Figure 4. Relative Light Intensity and Field Condition of Enterolobium cyclocarpum Stand From Figure 4, it could be explained that Enterolobium cyclocarpum produced a Coefficient of Variance of 1.7, which meant that the fluctuations in light intensity on the forest floor of Enterolobium cyclocarpum stand were higher than Acacia mangium stand. The amount of light received can be seen in Figure 5.
0%
25%
50%
75%
100%
9:00 12:00 15:00
Relative
Sunlight
Intensity CV : 1.3
1,859,434
0
2,000,000
4,000,000
6,000,000
6:00 9:00 12:00 15:00 18:00
lux
0%
25%
50%
75%
100%
9:00 12:00 15:00
Relative
Sunlight
IntensityCV : 1.7
Journal of Environment and Earth Science www.iiste.org
ISSN 2224-3216 (Paper) ISSN 2225-0948 (Online)
Vol. 3, No.9, 2013
198
Figure 5.The Amount of Light Reaching the Enterolobium cyclocarpum Forest Floor From figure 5, it could be explained that the amount of light reaching the Enterolobium cyclocarpum forest floor was 2,598,999 lux, with total production of 6.5 tons / ha / year, 30 cows grazing in a 3 time rotation, and the land capacity of 1 cow / ha / year. c. Samanea saman Stand Samanea saman trees which were planted in 2008 had a tree density of 625 trees / ha with a survival percentage of 80% (500 trees). The relative light intensity could be seen qualitatively in the form of changing light conditions, which can be viewed from the graph of relative light intensity displayed in Figure 6.
Figure 6. Relative Light Intensity and Field Condition of Samanea saman Stand From Figure 6, it could be explained that the coefficient of Samanea saman variance was 1.9, which meant that fluctuations in light intensity on the forest floor of Samanea saman stand were higher than Enterolobium cyclocarpum stand. The cumulative amount of light reaching the forest floor of Samanea saman can be seen in Figure 7 below.
Figure 7.The Amount of Light Reaching the Samanea saman Forest Floor . From Figure 7, it could be explained that the amount of light reaching the Samanea saman forest floor was 4,031,036 lux. The grass production was 8.5 tons / ha / year, which grazed 30 cows as many as 3 times in a one year rotation, with the land capacity of 1.3 cow / ha / year. d. Hibiscus tiliaceus Stand Hibiscus tiliaceustrees planted in 2008 had a tree density of 625 trees / ha with a survival percentage of 70% (440 trees). In terms of the relative light intensity graph, the light condition change can be seen qualitatively. The relative light intensity can be seen in Figure 8 below.
2,598,999
0
2,000,000
4,000,000
6,000,000
6:00 9:00 12:00 15:00 18:00
lux
0%
25%
50%
75%
100%
9:00 12:00 15:00
Relative
Sunlight
IntensityCV : 1.9
4,031,036
0
2,000,000
4,000,000
6,000,000
6:00 9:00 12:00 15:00 18:00
lux

Journal of Environment and Earth Science www.iiste.org
ISSN 2224-3216 (Paper) ISSN 2225-0948 (Online)
Vol. 3, No.9, 2013
199
Figure 8. Relative Light Intensity and Field Condition of Hibiscus tiliaceus Forest Stand From Figure 8, it could be seen that Hibiscus tiliaceus produced a coefficient of variance of 2.6. It indicated that fluctuations in light intensity on the Hibiscus tiliaceus forest floor were the highest and moreover, the tree had the least number of leaves. The cumulative amount of light that reached the forest floor of hibiscus tiliaceus can be seen in Figure 9.
Figure 9.The Amount of Light Reaching the Hibiscus tiliaceus Forest Floor. From figure 9, it could be seen that the amount of light reaching the Hibiscus tiliaceus forest floor was 5,509,734 lux with grass production of 10.5 tons / ha / year, which grazed 30 cows as many as 3 times in a one year rotation and with the land capacity of 1.6 cow/ ha / year. The Coefficient of Variance (CV) was employed to compare the changes in light intensity fluctuations. The greater the fluctuations in light intensity were, the larger the rate ofCoefficient of Variance would be. The values of coefficient of variance showed the characteristics of leaf numbers and tree shapes. Coefficient of variance could not only be an indicator of success in environmental management, but could also be used as an indicator of economic success. Solar energy is the energy source for photosynthesis. While the relationship between the integrated accumulative light intensity for each type of plant can be seen in Figure 10 below. Accumulative Light Intensity (lux / day)
Figure 10. The Accumulative Sunlight Intensity under Forest Stands
0%
25%
50%
75%
100%
9:00 12:00 15:00
Relative
Sunlight
IntensityCV : 2.6
5,509,734
0
2,000,000
4,000,000
6,000,000
6:00 9:00 12:00 15:00 18:00
lux

Journal of Environment and Earth Science www.iiste.org
ISSN 2224-3216 (Paper) ISSN 2225-0948 (Online)
Vol. 3, No.9, 2013
200
From figure 10, it could be explained that the correlation between sunlight intensity on each type of crop from the highest to the lowest was as follows: Hibiscus tiliaceus, Samanea saman, Enterolobium cyclocarpum and Acacia mangium. The relationship between the light intensity and grass production can be seen in Figure 10. Grass production Ton/ha/year
Picture 10. Relationship between Light Intensity and Grass Production From figure 10, it can be seen that the relationship between grass production and accumulative light intensity produced the following equation: y = 4.181ln (x) -53.27〗 and the value of coefficient of determination was r2 = 0.9842. Based on the obtained formula, the values of tree characteristics toward the productivity of grass could be seen in the following Figure 11.
Picture 11. Production of Grass / Forage in the Acacia mangium, Enterolobium cyclocarpum, Samanea saman and Hibiscus tiliaceus forests Figure 11 displayed the highest number of grass production which was found to grow along with the Hibiscus tiliaceus trees. On the other hand, it could be seen that the smallest number of grass production was found to grow along with acacia mangium trees. The production of fodder/ forage for livestock grazing can be seen in the following Figure 12.
y = 4.181ln(x) - 53.27
R² = 0.9842
0
4
8
12
0 2,000,000 4,000,000 6,000,000
i
Grass Production (kg/ha/year)
Light Intensity (lux/da
y)
Journal of Environment and Earth Science www.iiste.org
ISSN 2224-3216 (Paper) ISSN 2225-0948 (Online)
Vol. 3, No.9, 2013
201
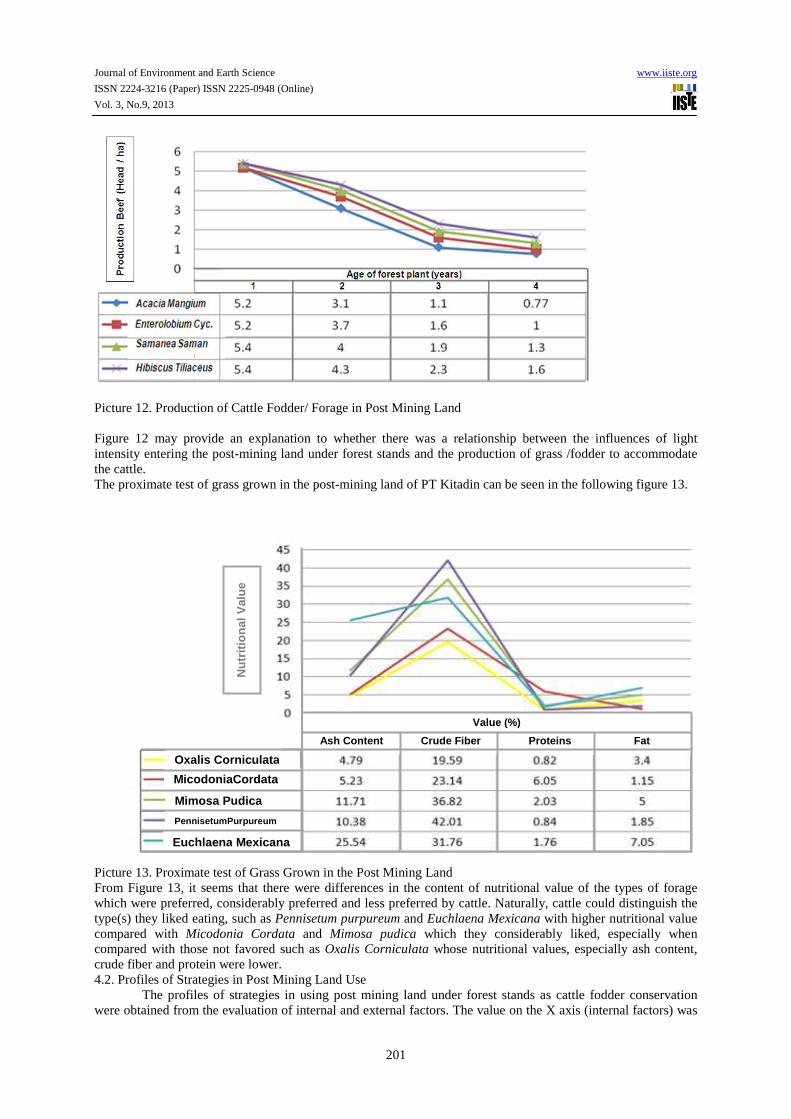
Picture 12. Production of Cattle Fodder/ Forage in Post Mining Land Figure 12 may provide an explanation to whether there was a relationship between the influences of light intensity entering the post-mining land under forest stands and the production of grass /fodder to accommodate the cattle. The proximate test of grass grown in the post-mining land of PT Kitadin can be seen in the following figure 13.
Picture 13. Proximate test of Grass Grown in the Post Mining Land From Figure 13, it seems that there were differences in the content of nutritional value of the types of forage which were preferred, considerably preferred and less preferred by cattle. Naturally, cattle could distinguish the type(s) they liked eating, such as Pennisetum purpureum and Euchlaena Mexicana with higher nutritional value compared with Micodonia Cordata and Mimosa pudica which they considerably liked, especially when compared with those not favored such as Oxalis Corniculata whose nutritional values, especially ash content, crude fiber and protein were lower. 4.2. Profiles of Strategies in Post Mining Land Use
The profiles of strategies in using post mining land under forest stands as cattle fodder conservation were obtained from the evaluation of internal and external factors. The value on the X axis (internal factors) was
Value (%)
Ash Content Crude Fiber Fat Proteins
Oxalis Corniculata
MicodoniaCordata
Mimosa Pudica
PennisetumPurpureum
Euchlaena Mexicana
Nu
trit
ion
al V
alu
e (%
)

Journal of Environment and Earth Science www.iiste.org
ISSN 2224-3216 (Paper) ISSN 2225-0948 (Online)
Vol. 3, No.9, 2013
202
obtained from the difference between the value of the strengths and weaknesses in the matrix of internal factor analysis summary (IFAS). Meanwhile, the Y-axis value (external factors) was the difference between the value of opportunities and threats in the evaluation matrix of external factor analysis summary (EFAS).
The analysis showed that the government, especially the government of Kutai Regency, in utilizing the post mining land under forest stands of PT Kitadin as cattle fodder, belonged to the aggressive quadrant, in which the government was in a good position to use its internal strengths to take advantage of the opportunities that existed and to overcome internal weaknesses and external threats. More details can be seen in Figure 14 below.
Picture 14. Profiles of Strategies In Using Post-Mining Land under the Forest Stands for Cattle Fodder Conservation 4.3. SWOT (Strength, Weakness, Opportunity and Threat) Matrix The SWOT matrix was used to determine some alternative strategies in using Post-Mining Land under Forest Stands of PT Kitadin for cattle fodder conservation. Alternative strategies were obtained from the influencing internal and external conditions, as seen in Table 1.

Journal of Environment and Earth Science www.iiste.org
ISSN 2224-3216 (Paper) ISSN 2225-0948 (Online)
Vol. 3, No.9, 2013
203
Table 1. SWOT Matrix of Post-mining land under forest stands utilization for cattle fodder conservation
1. Experience of cattle breeders 2. Available grass for fodder 3. Potential land 4. Cattle breeding systems 5. Economic value of breeding
1. Production and business
management 2. Limited capital 3.Technology 4.Use of concentrate food 5.Caging
1. The high demand
For meat
2. meat prices
3. Support and policy of local government
4. Capital aid for farmers 5. product development
1. Cattle business development in the
post-mining land as an alternative to improve the local economy
2.Improved implementation of forest conservation programs and farming system with zero waste by actively empowering local communities
1. Increasing the role, functions and
authority of the stakeholders in forest management as a provider of cattle fodder
1. Fluctuations 2. Imported beef products 3. Beef substitute products 4. Diseases 5. Competition
1.Formulate policies and regulations that
support farmers by subsidizing output within the authority of both the Central Government and Local Government.
1. Improving the quality of human resources from local communities to utilize and conserve timber estates.
2. The strengthening and the institutional involvement of local communities in farm activities
4.4. Strategy Prioritization Strategy prioritization was included in the decision making stage of the strategic planning. The method used was Quantitative Strategic Planning Matrix (QSPM). This method was used to formulate prioritized strategies in utilizing the Post Mining Land under Forest Stands of PT Kitadin for cattle fodder conservation. QSPM analysis was done by giving the relative value of the attractiveness (attractive score - U.S.) to each of the internal and external factors. Strategies with the highest total value of relative attractiveness (total attractive score - TAS) became the prioritized strategies. The strategy prioritization can be seen in the following Table 2. Table 2.Strategy Prioritization Using QSPM
KEY FACTOR
ALTERNATIVE STRATEGY
Weight
S-O 1 S-O 2 W-O1 S-T1 W-T 1 W-T 2
AS
TAS
AS
TAS
AS
TAS
AS
TAS
AS
TAS
AS
TAS
INTERNAL
Strengths
Experience of cattle breeders
0.18
4
0.72
4
0.72
3
0.54
4
0.72
3
0.54
3
0.54
Internal Factors
Ext
ern
al F
acto
rs Strengths
Weaknesses
Opportunities
Threats

Journal of Environment and Earth Science www.iiste.org
ISSN 2224-3216 (Paper) ISSN 2225-0948 (Online)
Vol. 3, No.9, 2013
204
Table 2 (continued) Available grass for fodder
0.13 3
0.39
4
0.52
3
0.39
3
0.39
4
0.52
4
0.52
Potential land 0.09
3
0.27
4
0.36
4
0.36
4
0.36
3
0.27
3
0.27
Cattle breeding systems 0.05
4
0.20
3
0.15
3
0.15
3
0.15
3
0.15
3
0.15
Economic value of breeding 0.04
4
0.16
3
0.12
3
0.12
4
0.16
4
0.16
3
0.12
Weaknesses Production and business management
0.19 4
0.76
4
0.76
4
0.76
4
0.76
3
0.57
3
0.57
Limited capital 0.13
3
0.39
4
0.52
4
0.52
3
0.39
4
0.52
3
0.39
Technology 0.09
3
0.27
3
0.27
3
0.27
3
0.27
4
0.36
4
0.36
Use of concentrate food 0.05
3
0.15
4
0.20
4
0.20
4
0.20
3
0.15
3
0.15
Caging 0.04
3 0.12 4 0.16 4 0.16 3 0.12 3 0.12 4 0.16
EXTERNAL Opportunities
The high demand for meat
0.19
4
0.76
4
0.76
3
0.57
3
0.57
4
0.76
3
0.57
meat prices
0.13
3
0.39
4
0.52
4
0.52
4
0.52
3
0.39
3
0.39
Support and policy of local government
0.09
4
0.36
3
0.27
3
0.27
4
0.36
4
0.36
3
0.27
Capital aid for farmers
0.05 4
020
4
0.20
4
0.20
4
0.20
4
0.20
4
0.20
Product development
0.04 4
0.16
4
0.16
3
0.12
3
0.12
3
0.12
3
0.12
Threats
Fluctuations
0.19 3
0.57
4
0.76
3
0.57
3
0.57
3
0.57
3
0.57
Imported beef products
0.13 4
0.52
4
0.52
3
0.39
4
0.52
3
0.39
3
0.39
Beef substitute products
0.09 4
0.36
4
0.36
3
0.27
4
0.36
4
0.36
4
0.36
Diseases
0.05
3
0.15
3
0.15
4
0.20
4
0.20
4
0.20
4
0.20
Competition
0.04 3
0.12
4
0.16
3
0.12
4
0.16
4
0.16
4
0.16
Total 7.20 7.64 6.67 7.10 6.87 6.46 Based on the results of the strategy prioritization using Quantitative Strategic Planning Matrix (QSPM), we obtained an alternative prioritized strategy in using post mining land under forest stands for cattle fodder conservation as seen in Table 3.

Journal of Environment and Earth Science www.iiste.org
ISSN 2224-3216 (Paper) ISSN 2225-0948 (Online)
Vol. 3, No.9, 2013
205
Table 3. QSPM of Using Post Mining Land under Forest Stands for Cattle Fodder
No Alternative Strategy TAS Value
Priority
1 Improved implementation of forest conservation programs and crop farm with zero waste system by actively empowering local communities
7.64 1
2 Cattle business development in timber estates located in the post-mining land as an alternative to improve the local economy
7.20 2
3 Formulate policies and regulations that support farmers by subsidizing output within the authority of both the Central Government and Local Government.
7.10 3
4 Improving the quality of human resources from local communities to utilize and conservetimber estates
6.87 4
5 Increasing the role, functions and authority of the stakeholders in forest management as a provider of cattle fodder
6.67 5
6 The strengthening and the institutional involvement of local communities in farm activities.
6.46 6
From Table 4, it could be seem that the results of Quantitative Strategic Planning Matrix (QSPM) produced six (6) alternatives of prioritized strategy in using the post mining land under the forest stands of PT Kitadin for cattle fodder. The improved implementation of forest conservation programs and crop farm with zero waste system by actively empowering local communities occupied the first priority, with the TAS value of 7.64. The second priority was the cattle business development in timber estates located in the post-mining land as an alternative to improve the local economy, with the TAS value of 7.20. The third priority was in the form of formulating policies and regulations that support farmers by subsidizing output within the authority of both the Central Government and Local Government, with the TAS value of 7.10. The fourth priority was to improve the quality of human resources from local communities to utilize and conserve timber estates, with the TAS value of 6.87. The fifth priority was increasing the role, functions and authority of the stakeholders in forest management as a provider of cattle fodder, with the TAS value of 6.67. The last priority with the TAS value of 6.46 was concerning the strengthening and the institutional involvement of local communities in farm activities 5. CONCLUSIONS AND RECOMMENDATIONS 5.1. Conclusions Based on the research conducted, it can be concluded that: a. Sunlight in the area of post mining land affected the growth of cattle fodder/ forage with the average value of
291,504 lux / hour for the total of 12 hours. b. Fodder/ forage production under the forest stands was very different, with the average of 7.62 tons / ha / year.
The highest production value was found under the stands of hibiscus, amounted to 10.5 tons / ha / year whereas the lowest value was found under the stands of acacia, with 5 tons / ha / year.
c. To optimize fodder/ forage production, canopy trimming (pruning) on stands canopy after the trees reached the age of 4 years was necessary.
d. The growth rate of dairy farms in the post-mining land was 33% with the profits of USD 300/household/year. In order to have a decent living, breeders have to raise approximately 15 cows /household.
e. The current beef demand in East Kalimantan has reached 1.56 kg / capita / year. Thus, to achieve self-sufficiency in meat with the average of 3 kg / capita / year, the number of additional cows required was up to 43,200 out of a total number of 90,000, which was more than the existing number of cows at the moment.
f. Strategic policy that needed to be done was to strengthen the synergy between the government, corporate, community and academia to enhance their roles respectively and to work together in order to maintain the quality of the environment as well as to support sustainable development. 5.2. Recommendation
PT Kitadin and community members are expected to improve the social management in using the post mining land under forest stands for cattle fodder. This is the most important integrated part of the effort to preserve sustainable forest environment in order to improve the welfare of local farmers surrounding the post-mining land. In addition, the government should act as the policy makers that can ensure the appropriate

Journal of Environment and Earth Science www.iiste.org
ISSN 2224-3216 (Paper) ISSN 2225-0948 (Online)
Vol. 3, No.9, 2013
206
implementation of animal husbandry and good animal health. Moreover, the provision of land that meets the technical requirements of farming and animal health is also deemed as necessary. References Anonymous. , 2003. East Kalimantan Governor Decree No.. 07 of 2003 on Guidelines for Assessment Program
Coal Mining Company Performance (Proper Coal).(in Indonesia) Anonymous. 2009b. Mine Closure Plan document PT KitadinEmbalut 2009.(in Indonesia) Anonymous. 2009c. Study of Coal Mining Land Rehabilitation Used For Sustainable Agriculture. Balitbangda
province of East Kalimantan, East Kalimantan province Balitbangda, Samarinda ( in Indonesia) Anonymous. 2011a. Environmental Management and Monitoring Reports First Half PT Kitadin (in Indonesia). Anonymous. 2011b. Annual Report of the Department of Animal Husbandry and Animal Health Kutai regency
in 2010. District Livestock Office and Animal Health District.Kukar in 2011( in Indonesia). Anonymous ..2011c. Final Report and Business Development Activity Zone Ranch. Integration Study jobs Cow
Waste Oil Utilization of Agricultural Fiscal Year 2011. East Kalimantan Provincial Livestock Office( in Indonesia).
Anonymous.2011d. Profile of Department of Animal Husbandry and Animal Health District.Kutai in 2011.( in Indonesia)
Anonymous. 2012b. Report of the Department of Mines and Energy of the Province of East Kalimantan in 2012, Samarinda.(in Indonesia)
Anonymous. 2013. Beef Breeders Sweat. Kompas, 19 February 2013. (in Indonesia) Agang, M.W, Lahjie A.M. and Simarangkir B.D.A.S. 2010.Revitalization of Post-Mine Land Reclamation in
Coal PT Mahakam Sumber Jaya, Separi Village, District TenggarongSeberang.KertanegaraKutai regency.Master of Science Degree Thesis Mulawarman Forestry University, Samarinda. (in Indonesia)
Ansori, Y., A. Syachrumsyah and Suroto. 2010. Determination of Success Criteria Analysis Used Land Reclamation Mining For Sustainable Agriculture in East Kalimantan (PT Berau Coal Case Study Site Binungan), Research Program IPKPP. Ministry of Research and Technology 2010.Research and Ministry of Home Affairs, Jakarta. (in Indonesia)
Buckman, H.O. and N.C. Brady. 1982. Soil Science translated by Soegiman, Jakarta: Bhratara Literacy Works, Jakarta
Ciptatanto, A. , 2011. Biodiversity Checks Results for Mine Land Reclamation Used To Not Deceived, Make as Indicators of Living Things. Kaltim Post, Samarinda (in Indonesia)
Chamid, C., Zainal and B.Sulistiyo. , 2008. Post Mining Land Rehabilitation for Sustainability Mining Industry in Indonesia. Proceedings of the Seminar on Water Acid Mine Land Reclamation and Mine Used in Indonesia, Bandung 1 to 2 July 2008. (in Indonesia)
Dwidjoseputro D. , 1994. Introduction to Plant Physiology.Gramedia, Jakarta (in Indonesia) Dyson, Robert G., 2003. Strategic Development AndSwot Analysis At The University of Warwick, European Journal of Operational Research 152 (3). 631-640
Effendi, H. , 2003. Assessing Water Quality.For the Management of Water Resources and Environment. Publisher Kanasius, Yogyakarta. (in Indonesia)
Erland E. 2012. Harvest Fun Rupiah From Raising Beef Cattle. Library Agro Mandiri, South Tangerang. (in Indonesia)
Fahrul, M.F. 2007. Sampling methods bioecology. Earth Literacy, Jakarta (in Indonesia) Ferianita, F. M. 2007. Sampling methods bioecology, Earth Literacy, Jakarta. (in Indonesia)
Fikar S. and Ruhyadi D. 2010.Cattle breeding and Business.Agromedia Library, Jakarta.(in Indonesia)(in Indonesia)
Foth H.D. , 1984. Basics of Soil Science.Purbayanti translation E.D., D.R. Lukiwati and R. Trimulatsi. Edition I. GadjahMada University Press, Yogyakarta. (in Indonesia)
Gradwohl, J. and R. Greenberg. , 1991. Saving the Tropical Forest Foundation Torch Indonesia, Yogyakarta.(in Indonesia)
Hardjowigeno, S. , 1992. Soil classification and pedogenesis Edition I. Academic Pressindo, Jakarta (in Indonesia)
Hidayati N., T. Juhaeti, F. Sharif. , 1999. Nutrient Status Post-Reclamation.Journal of the Research Center for Biology-LIPI, Bogor. 22-25 (in Indonesia)
Kustiawan, W. and Sutisna M. , 1993. Former Coal Mining Land Rehabilitation, Evaluation of Plant Growth, Frontier 14.(in Indonesia)
Lahjie, A.M. , 2004. Rapid appraisal techniques and methods Field Guide. Mulawarman, Samarinda. 294 h. (in Indonesia)
Journal of Environment and Earth Science www.iiste.org
ISSN 2224-3216 (Paper) ISSN 2225-0948 (Online)
Vol. 3, No.9, 2013
207
Marimin. , 2004. Techniques and Applications Compound Criteria Decision Making. PT. Grasindo, Jakarta. (in Indonesia)
Mooney, Dick., 2001. SWOT Analysis - A Structured Way to Plan, Communicator, Vol. 2 (4) Muhtaman, D.R., and Hopmans P. Siregar M.A 2000. Criteria and Indicators for Sustainable Plantation Forestry in Indonesia.Center for international Forestry Research, Bogor.
Ohta, S., S. Effendi, Tanaka N and Miura S. 1992 Characteristics of Major Soil Under Lowland Dipterocarp Forest in East Kalimantan, Indonesia. Tropical Rain Forest Research Project, JICA and Directorate General of Higher Education Ministry of Education and Culture of the Republic of IndonesiaPusrehut Special Publication 2 September 1992, Samarinda.
Rangkuti F. , 2009. SWOT analysis technique to dissect the Business Case. PT GramediaPustakaUtama, Jakarta. (in Indonesia)
Rinzema, W.T. , 1993. Fertilizers and Fertilization way.H.M. translation Saleh, Bharata Literacy Works, Jakarta. (in Indonesia)
Rismunandar 1984.For the land and the intricacies of Agriculture.SinarBaru, Bandung.(in Indonesia) Ruhiyat, D. , 1992. Nutrient Dynamics of Natural Forest Utilization and Forest Plants, Paper at the Workshop on
Tropical Moist Forests Plants to Increase Productivity Environmental, Samarinda (in Indonesia). Sambas, E.N and Suhardjono, 1999.Structure and Composition of Degraded Forests in Jampang.Sukabumi,
Research Center for Biology-LIPI, 11-14 Bogor.h (in Indonesia) Sarief, S. , 1984. Agricultural Soil Science, CV. BuanaPustaka, Bandung. (in Indonesia) Sarkis, J, .2003. Quantitative Models for Performance Measurement Systems-Alternative Considerations
(Quantitative Strategic Planning Matrix / QSPM). International Journal of Production Economics.86 (1). 81-90
Soepardi, G. 1983. Soil properties and characteristics.Faculty of Agriculture, Bogor Agricultural University Edition II, Bogor. (in Indonesia)
Sudarmadji T., M. Sutisna, RuhiyatMohraga D. Z. , 2005. Used Land Revegetation trials Coal Mine, Jungle Borneo. 10 (01) 38-54 (in Indonesia)
Sukandarrumidi, 2006. Coal and Utilization.GadjahMada University Press, Yogyakarta.(in Indonesia) Susilorini T.E., M.E, Savitri.,Muharlien 2008. 22 Livestock Aquaculture Potential.Self spreader, Jakarta (in
Indonesia) Internet:
http://teknis-budidaya.blokspot.com/2007/10/budidaya-sapi-potong.html http://kaitokid724.multiply.com/journal/item/13/bisnis cattle remain profitable

This academic article was published by The International Institute for Science,
Technology and Education (IISTE). The IISTE is a pioneer in the Open Access
Publishing service based in the U.S. and Europe. The aim of the institute is
Accelerating Global Knowledge Sharing.
More information about the publisher can be found in the IISTE’s homepage:
http://www.iiste.org
CALL FOR JOURNAL PAPERS
The IISTE is currently hosting more than 30 peer-reviewed academic journals and
collaborating with academic institutions around the world. There’s no deadline for
submission. Prospective authors of IISTE journals can find the submission
instruction on the following page: http://www.iiste.org/journals/ The IISTE
editorial team promises to the review and publish all the qualified submissions in a
fast manner. All the journals articles are available online to the readers all over the
world without financial, legal, or technical barriers other than those inseparable from
gaining access to the internet itself. Printed version of the journals is also available
upon request of readers and authors.
MORE RESOURCES
Book publication information: http://www.iiste.org/book/
Recent conferences: http://www.iiste.org/conference/
IISTE Knowledge Sharing Partners
EBSCO, Index Copernicus, Ulrich's Periodicals Directory, JournalTOCS, PKP Open
Archives Harvester, Bielefeld Academic Search Engine, Elektronische
Zeitschriftenbibliothek EZB, Open J-Gate, OCLC WorldCat, Universe Digtial
Library , NewJour, Google Scholar