using the vsdpveg access database · web viewthe software should function for access versions from...
TRANSCRIPT

Using the vpvp Access database
The MS Access database ‘VPVP’ applies the models VSD+, PROPS (or Veg), MetHyd and GrowUp to data in the database, and stores the model results. The software should function for access versions from 2007 onwards and under windows XP and windows 7 for 32-bit computers. This document describes how to use this database, but not the individual models. For more information on the models, please check out the CCE website, at http://wge-cce.org/Methods_Data/The_VSD_suite_of_models
The VSDpVeg (further referred to as VpV) Access database has been built with three ways of usage in mind: (1) importing data of sites for collecting all data in a single database, (2) using regional (GIS derived) databases for dynamic modelling on a regional/national scale and (3) create a submission in reply to the CCE Call for Data. This document describes the database software from these perspectives in the following steps:
- Install the software.- Import data for a single site from a text-file, as used as input for VSDpVeg-Studio- Calibrating sites- Running and calculating biodiversity indices for sites with all data available- Running sites for which not all data is available
o Calculating uptake using GrowUpo Calculating mineralization/nitrification/denitrification modifying factors
using MetHyd- How to deal with available regional datasets
When opening the Access database, a form opens from which you can select to install the software, import site-data from a text-file, or run the ‘wizard’. The software also allows to transfer data from a previous version of the database. The wizard is a sequence of forms that helps you enter site data and run the models in sequence.
Installation
You need Microsoft Access software to be installed on your computer. To start you open the VpV database file.The installation executed by the install-form prepares the software that comes with this Access application (VSD+-, GrowUp-, and MetHyd versions) and helps converting data from previous versions into this database. After opening the form named “Install”, you will see the screen below (or similar).

The Database path is the actual folder of the database file. The binary files that are part of the software are put into the BINpath folder. During the calculations and creation of graphs temporary file are created in the TempPath folder. Normally they are removed after usage. You can empty the folder if remainders are present, except for a single file (e.g. empty.txt) which needs to remain for technical reasons.
Settings, references and PostScript viewer
Be aware that the input files assume decimal point notation, and thus you might have to adjust your settings (commas are considered column separators!)
User-created graphs are PostScript (.eps) files. Viewing these graphs requires a PostScript viewer, like ghostview (or irfanview). Both programs are available on the web, but irfanview needs extending with a plugin for postscript. The path to the viewing software should be entered in the “SettingsTable.” If this setting is an empty string, the default file-association is assumed. If you lack software for viewing PostScript files, you can enter “none” for this setting, this causes the graph to be generated but not shown. You can import the eps-files into other software, like a Word document.
You can change the settings that are stored in “SettingsTable”. Please take note that incorrect settings may disrupt the software and can result in unpredictable errors. The settings, and their purpose, are:
Postview - Path to the PostScript viewer, see description above.VegDrivers - Sets which drivers are considered in VegMetHyd - Path to the MetHyd executableCountry - 2 character country code, input to GrowUpp2prog - Path to p2.exe (line plotting program), normally identical to %bin%\
p2.exe

p2var - Default settings for p2 graphs, as a fixed part of the parameter filelayoutprog - Path to layout.exe, normally identical to %bin%\layout.exeLayVar - Default settings for layout-graphs, as if part of the parameter-fileMetPath - Path to a MetHyd meteo file, initially identical to %bin%\Europe6190.csvTempPath - Path for temporary filesBinPath - Path for binary files of the software; %bin% will be substituted with this
The VpV software uses standard extensions to Access. The list of extensions are listed as “references”, as can be seen from the window below. If any of the references are missing, please contact your system administrator.
Although we do our best, it is nearly impossible to avoid erroneous events. To detect and resolve bugs, error messages are implemented and can be reported. Error trapping (for advanced users) should be set to “Break on unhandled errors.”
Importing a site from a VSDpVeg-Studio input (text) fileWith this feature you can collect the VSDp (input) data of all your sites in a single database, rather than scattered over a lot of text files. Under Forms select ImportVSDfile and activate it (see screen-dumps below).

Then click the […] button, select a VSDpVeg filename from the pop-up window and then press the import button. The variables in the VSDpVeg input-file will be read and stored in the database; also all (time series) files that are referenced in the input-file are imported. The tables in which the data are stored are ecords, plusputs, putstimeseries and observations.
Running sites for which not all data is availableA full sequence of calls to complete a dataset and run VSDpVeg are illustrated in the cascade figure below. To ‘upgrade’ VSD input files to VSDp input files you need additional variables. These additional input variables are written on the left of the cascade in the figure, on the right-hand side of the cascade the outputs are displayed, which are also inputs to the next step.

pedo_rho
thetas
MetHyd
BayCal
GrowUp
VSD+
Veg
indices
clay, silt,orgC rho
ThetaWP, ThetaFCThetaSat
lon, lat,Albedo
temp, Qle, theta, PAR, rfmi, rfni, rfde
Tree cohorts,Management … uptake,
C,N litterfall
lgKAlBC, lgKHBCCpool_0, CNrat_0
soil concentrations
plant composition
Cpool_obs,CNrat_obs
A so-called ‘wizard’, with a sequence of forms in the VpV Access database handles each of the steps. Start the wizard by selecting the “CascadeWizard” or any of the cascade forms, or select the Wizard-button from Form1.

You can navigate through the cascade forms by the [Prev] and [Next] buttons or by the record selector, at the bottom of the ever-present form named “CascadeWizard”.Apply the record selector on the cascade forms to select the ecord for which calculations should be executed. After moving forward or backward in the sequence of cascade forms, the record selector becomes dimmed. The dataset for the form is ‘filtered’, to present the same ecord as before the move. You can switch off the filter, and use the (r)ecord selector again.
Calculating uptake using GrowUp
GrowUp is a simple forest growth and management model for VSDp which calculates uptake and cycling of nitrogen, carbon and base cations. The GrowUp model is also available as a separate program, including help-files and description of the model and included data. For more information on the model, you can download the setup-file from the CCE website. In the Access version (VpV) of GrowUp, all input data are taken from the database. The EUNIS code of the site gives the relation to (the) trees that grow there. This relation can be found in the EUNIStrees table. Tree species available in the database can be browsed and changed in the ‘Tree’ form.The carbon, nitrogen and base cation related parameters are in the tables BioAllocations_branches, BioAllocations_coarse_roots, BioAllocations_fine_roots, BioAllocations_foliage, BioAllocations_stem, CarbonContents, NParams and WoodDens. You are invited to improve upon this data for your sites. If you extend the list of tree species, you need to extend all of these tables. Currently, the growth rate or a tree species in the database is the same for the whole of Europe – not very realistic and an incentive to improve it . If you want to provide the model with data on how your forests are managed and how fast your trees grow, you are welcome to use the Tree-form. The meaning of the StemGrowth and Management are explained in the stand-alone GrowUp model. The variable DefClearCut indicates the period after which the trees are cut. The implementation of the model used in VpV assumes an immediate replanting in the same year, and a repetition of the same management sequence.
First select the tree species that possibly grow on the site with the [Copy from EUNIS] button. All trees expected to grow in the EUNIS class of the site are listed. Delete the species you know are not there and provide the fractions of the species that are there.
Secondly, forwarding the wizard to the next screen, select the appropriate region in the dropdown box, and the period for the calculation. Select natural rejuvenation or managed forests with the appropriate checkbox.

The button [Run GrowUp] will start the calculation. You can choose the option for averaging the uptake values over all years. If you don’t, the resulting time series are stored in the database and used for further calculations, but not shown here. However, the next cascade form shows the uptakes and with a press on the [View Timeseries] button six graphs will show the uptake parameters over the years.
Pressing [Next] again will open the next form of the cascade.
Calculating mineralization/nitrification/denitrification factors using MetHydMetHyd is available as stand-alone program with a user-friendly interface, help and descriptions to calculate modifying factors for mineralization/de/nitrification as well as some hydrological parameters. This program is also called by VpV for calculating
- Bulk density (rho in the cascade figure above)- Soil water contents (at wilting point (ThetaWP), field capacity (ThetaFC) and at
saturation (ThetaSat) and at 1 bar (Theta1bar))- TempC, Qle, Theta, PARtop, rfmi, rfni, rfde (the actual MetHyd calculations)
The plusputs table will be updated with all results from these calculations.

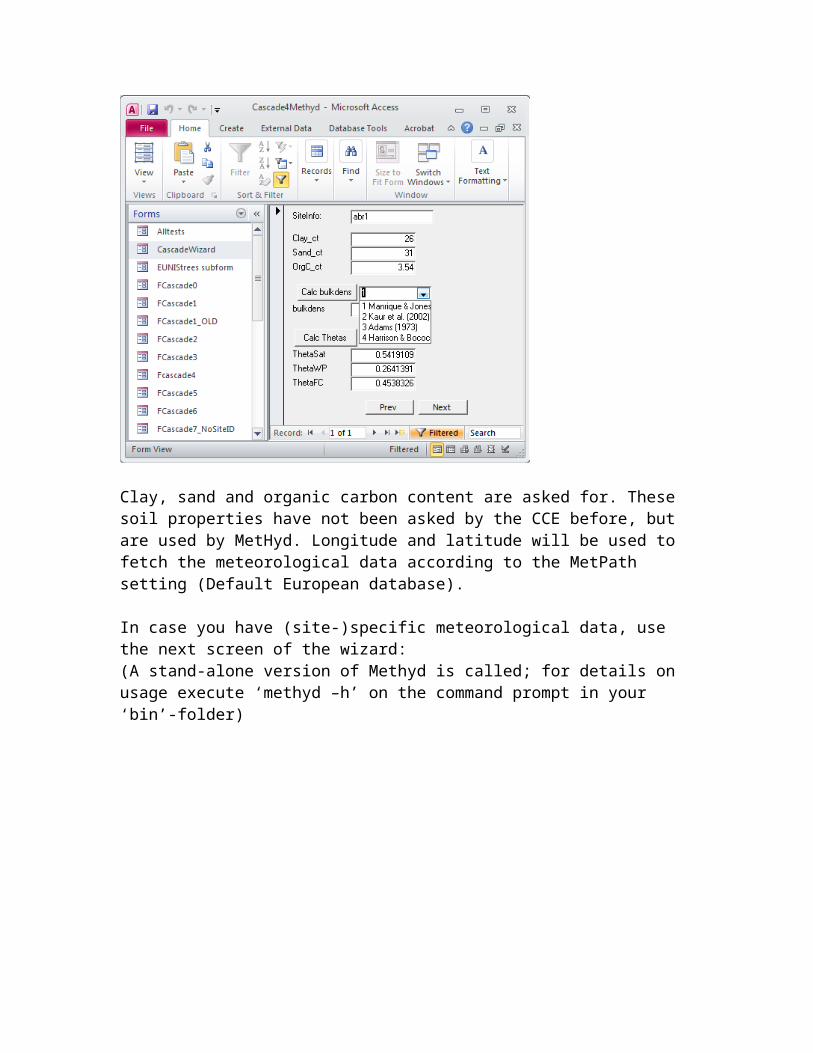
Clay, sand and organic carbon content are asked for. These soil properties have not been asked by the CCE before, but are used by MetHyd. Longitude and latitude will be used to fetch the meteorological data according to the MetPath setting (Default European database).
In case you have (site-)specific meteorological data, use the next screen of the wizard:(A stand-alone version of Methyd is called; for details on usage execute ‘methyd –h’ on the command prompt in your ‘bin’-folder)

With the next form, MetHyd is called and its results are shown. Like the GrowUp results, time series are shown after pressing [Graphs]
Before actually running the VDSp model, you can run tests for screening obvious flaws in your data. The tests look for the presence of reasonable values for all major mandatory parameters and provide feedback on this.
Press [Next…] to open the next screen of the cascade, where you can calibrate the site.
Depositions
The database contains depositions for N and S from 1880 till 2010, in the 50 km EMEP grid. These numbers are used if the coordinates are available, e.g. calculated from earlier provided longitude and latitude. If measured or otherwise more accurate data are imported into the database, these data will supersede the EMEP data. However, the historic trend of depositions can be used to extend the time series back to the future… This is demonstrated in the figure below.
1880 2000 2100
historic
Projecteddeposition
Measureddepositions
Average measureddepositions
Calibrating sitesIf you have observations and want to calibrate the model, like in VSDpVegStudio, you can do so in VpV, too. The parameters to calibrate can be set in the pars_lim table. All rows with an ordernr > 0 in this table are exported to a file used by the calibration routine (‘pars_lim_ext.txt’). [Next] moves you to the next form, with the actual calibration.

Note the text field with all the input data used, including references to the files with time series for this site. This field is for viewing only, there is no point in making changes to it.
Press [Calibrate] and wait a few seconds; if no error occurred, the selected variables given in the previous form will be updated by the calibrated value(s)The calibration process responds more robustly if the uptake variables are not erratic. Therefore, these variables are converted to a trend line that is derived from the given inputs, e.g. from the GrowUp model.
Checking the success of a calibration is not straightforward to automate (and still missing in the software). What you can do to see the result is to plot the soil chemistry, where also the observation is plotted; or test typical sites with VSDpVegStudio.
To see the PostScript (eps) files that are generated by this form you need an ‘eps-viewer’ and the VpV software needs to know the path to the viewer as described earlier.
VSDpVeg Studio is more suited for studying individual sites and viewing outputs. This Access version is for easily running multiple sites, and for exchanging site data, e.g., submitting them to the CCE.
Running a vegetation modelThe latest version of VpV includes also the vegetation model ‘PROPS’. The earlier Veg model can still be run, but especially the selection of plant species to take part in the modelling is geared for PROPS. Only for Veg you need to set drivers.
Setting Veg drivers
Before running Veg, you should check the drivers you want to utilise. The setting ‘VegDrivers’ is a string of length 8 with a value 0 or 1 (press the [Settings] to check it out). The drivers you select by setting the respective position in the string to 1. By default all drivers are set to ‘on’. The meaning of the drivers-sequence is:
- Nitrogen concentration in soil solution- Calcium concentration in soil solution- pH in soil solution- gif = browsing - not used! (setting does not matter)- Temperature- Soil moisture- Light competition (Photosynthetically Active Radiation, PAR)- Shading
Using a fixed reference composition
For calculations of beta-indices, like similarity, a reference composition is used. You can choose to either put a reference composition in the database, or set the composition as

calculated e.g. by the vegetation model under pre-industrial depositions. Do so in the form displayed below.
The table ImportVegRef has two columns, SpeciesName and fraction. Put the composition in the table and press the “Import” button. In the Access manual you can find several ways of importing data into a table. Mind the spelling of the species names; make sure they match with the names in “AnySpecies”.
Selecting plant species, via vegetation units
As mentioned above, two vegetation models can be run from VpV, Veg and PROPS. Both have an own list of species for which model parameters are established. These lists overlap, PROPS contains many more species, but do not cover all Veg-species. Both lists are combined in the database in three tables: “AnySpecies” with “speciesID” referring to “importedPropspecies” and/or “importedVegspecies”.
In order to obtain reasonable result with (any) vegetation model, an appropriate pre-selection of species needed. Which plant species are supposed to grow within a EUNIS class is no longer directly available. The pre-selection is possible by an intermediate step, vegetation units according to the definition of a vegetation map of Europe:http://www.floraweb.de/vegetation/dnld_eurovegmap.html
There is a relation in VpV between EUNIS classes (level 3) and these vegetation units. The form in the wizard that you can use to select the correct vegetation unit looks like:

Select the vegetation unit(s) that is/might be/should be there by the check boxes. The next form narrows the selection further on the level of the actual species:
Note that a selection of species is remembered for subsequent use.
If you press the button [run/plot composition/indices] VDSp and the vegetation model will be run, and graphs for strength/share/probability as well as three biodiversity indices are generated and can be viewed
Saving plant compositions and indices for submission to the CCE
From the initial form – the one you see when you booted the database – you can select the button “prepare for submitting”. This will generate a small database file “Subm2CCE.accdb” which you can zip and send to the CCE.

How to deal with available regional datasets?
A possible starting point for regionalised studies is the dataset earlier used for Dynamic Modelling. As an example, the table inputs4Test2012 is a small subset from the European background database. A sequence of five queries will append the data to the appropriate tables.The queries are the following: App_inp1, App_inp2, app_inp3_bs, app_inp4_C, and app_inp5_CN. Please be aware that you (probably) need additional data – like clay, sand, and organic carbon content – to run MetHyd.
TestingIf you changed the data, or received a (third party) database and want to examine sites, you can. This not further documented feature is for testing purposes only. You can find the SiteID in the ecords and the plusputs tables.