using unmanned aerial vehicles for wireless localization
TRANSCRIPT
Florida International UniversityFIU Digital Commons
FIU Electronic Theses and Dissertations University Graduate School
11-15-2017
Using Unmanned Aerial Vehicles for WirelessLocalization in Search and RescueVirgilio AcunaFlorida International University, [email protected]
DOI: 10.25148/etd.FIDC006591Follow this and additional works at: https://digitalcommons.fiu.edu/etd
Part of the Electrical and Computer Engineering Commons
This work is brought to you for free and open access by the University Graduate School at FIU Digital Commons. It has been accepted for inclusion inFIU Electronic Theses and Dissertations by an authorized administrator of FIU Digital Commons. For more information, please contact [email protected].
Recommended CitationAcuna, Virgilio, "Using Unmanned Aerial Vehicles for Wireless Localization in Search and Rescue" (2017). FIU Electronic Theses andDissertations. 3646.https://digitalcommons.fiu.edu/etd/3646
2018
FLORIDA INTERNATIONAL UNIVERSITY
Miami, Florida
of the requirements for the degree of
MASTER OF SCIENCE
in
ELECTRICAL ENGINEERING
by
Virgilio Acuna
A thesis submitted in partial fulfillment
USING UNMANNED AERIAL VEHICLES FOR WIRELESS LOCALIZATION IN
SEARCH AND RESCUE MISSIONS

To: Dean John L. Volakis College of Engineering and Computing
This thesis, written by Virgilio Acuna, and entitled Using Unmanned Aerial Vehicles for Wireless Localization in Search and Rescue Missions, having been approved in respect to style and intellectual content, is referred to you for judgment.
We have read this thesis and recommend that it be approved.
_______________________________________ Leonardo Bobadilla
_______________________________________
_______________________________________ Ismail Guvenc, Major Professor
Date of Defense: November 15, 2017
The thesis of Virgilio Acuna is approved.
_______________________________________
_______________________________________ Andrés G. Gil
Vice President for Research and Economic Development and Dean of the University Graduate School
Florida International University, 2018
Selcuk Uluagac
Dean John L. VolakisCollege of Engineering and Computing
ii

ABSTRACT OF THE THESIS
USING UNMANNED AERIAL VEHICLES FOR WIRELESS LOCALIZATION IN SEARCH
AND RESCUE MISSIONS
UAV technology has shown limitations in the navigational performance and limited flight time.
Procedures to optimize these limitations are presented. Additionally, how the UAV is maneuvered
during flight is analyzed, considering different SAR flight patterns and Li-Po battery consumption
rates of the UAV. Results show that controlling the UAV by remote-controll detected the most
probes, but it is less power efficient compared to control it autonomously.
by
Virgilio Acuna
Florida International University, 2018
Miami, Florida
Professor Ismail Guvenc, Major Professor
This thesis presents how unmanned aerial vehicles (UAVs) can successfully assist in search and
rescue (SAR) operations using wireless localization. The zone-grid to partition to capture/detect
WiFi probe requests follows the concepts found in Search Theory Method. The UAV has attached
a sensor, e.g., WiFi sniffer, to capture/detect the WiFi probes from victims or lost people’s
smartphones. Applying the Random-Forest based machine learning algorithm, an estimation of the
user's location is determined with a 81.8% accuracy.
iii
TABLE OF CONTENTS
I INTRODUCTION ...............................................................................................................1 II LITERATURE REVIEW ....................................................................................................5
2.1 UAVs as SAR Platforms ..........................................................................................5 2.2 Wireless Localization ...............................................................................................6 2.3 Similar Work ............................................................................................................7
III LOCALIZATION OF WIFI DEVICES USING PROBE REQUESTS CAPTURED AT
UNMANNED AERIAL VEHICLE ....................................................................................9 3.1 Environmental Setup for the Experimentation ........................................................9
3.1.1 Wi-Fi Pineapple ...........................................................................................9 3.1.2 Mission Planner ...........................................................................................9 3.1.3 Virtual Private Network .............................................................................10
3.2 Capturing Data with WIFI Pineapple ....................................................................12 3.2.1 UAV Deployment to Capture Wi-Fi Probe Requests ................................12 3.2.2 UAV Flight Trajectory to Capture Wi-Fi Probe Requests .........................12 3.2.3 Using Wi-Fi Pineapple to Capture Wi-Fi Probe Requests .........................14 3.2.4 Wi-Fi Probe Requests Traffic Capturing using Wireshark ........................14
3.3 Random Forest Algorithm .....................................................................................15 3.4 Numerical and Experimental Results .....................................................................17
3.4.1 Device Localization Using RFA ................................................................18 3.4.2 Confusion Matrix .......................................................................................20 3.4.3 Results Analysis .........................................................................................21
IV UAV PROCEDURRES TO EXTEND FLIGHT TIME FOR SEARCH AND RESCUE OPERATIONS USING WIFI PROBE REQUESTS ...................................................................24
4.1 Environment of Experimental Design ...................................................................24 4.1.1 Sensor to Detect Wi-Fi Probes ...................................................................24 4.1.2 DroneDeploy ..............................................................................................25 4.1.3 FAA Rules and Regulations for UAVs ......................................................25 4.1.4 UAV Used for the Experiment ..................................................................26
4.2 Search Theory Method ...........................................................................................27 4.2.1 Probability of Containment ........................................................................27 4.2.2 Probability of Detection .............................................................................28 4.2.3 Probability of Success ................................................................................29
4.3 Ways to Maximize UAV Flight Time ...................................................................30 4.3.1 Optimization of Propellers .........................................................................30 4.3.2 LiPo Battery Basics ....................................................................................32
4.4 SAR Flight Patterns Follow by UAV Affect Optimization of UAV Flight Times................................................................................................................................38 4.4.1 Parallel Track Search Pattern (PTSP) ........................................................39 4.4.2 Creeping Line Search Pattern (CLSP) .......................................................41
CHAPTER PAGE
iv
4.4.3 Sector Search Pattern (SSP) .......................................................................41 4.5 Results Analysis .....................................................................................................42
V CONCLUDING REMARKS .............................................................................................47
BIBLIOGRAPHY ..............................................................................................................49
v
LIST OF TABLES
1. Example for Captured WiFi probe request packets for a duration of 6 seconds ...............15
Size of the training data for each device ............................................................................19
Confusion matrix constructed using captured data. ...........................................................19
SAR Flight data obtained from DroneDeploy ...................................................................43
Results with an autonomous UAV over different SAR flight patterns ..............................44
Results with a remote-controlled UAV over different SAR flight patterns.......................45
2.
3.
4.
5.
6.
TABLE PAGE
vi
LIST OF FIGURES
1. (a) Experimental setup with WiFi Pineapple mounted on a drone, (b) Model used to
access packets from WiFi Pineapple remotely to localize a WiFi device .........................10 2. UAV flight plan used for WiFi localization ......................................................................11 3. Unique devices identified from different manufacturers based on the WiFi probe requests
captured at the UAV ..........................................................................................................13 4. RFA for aggregating output decision trees .......................................................................17 5. Classification of WiFi device into different zones using the longitude, latitude, altitude,
and RSSI captured at UAVs .............................................................................................18 6. Accelerometer sensors’ threshold to resist vibration [56]. ................................................32 7. Lipo battery functions [57]. ...............................................................................................33 8. Actual LiPo battery discharge curve [58]. .........................................................................34 9. Relationship between flight time and LiPo capacity [59]. .................................................38 10. Parellel Track Search Pattern traveled by the UAV ..........................................................39 11. Creeping Line Search Pattern traveled by the UAV ..........................................................40 12. Sector Search Pattern traveled by the UAV .......................................................................42
FIGURE PAGE
vii
CHAPTER I
Introduction
Search and Rescue Emergency scenarios demand a rapid response from first responders to gather
information about the localization of victims and reach them promptly. A scenario, for example,
can be people who are left trapped inside a building after it collapsed, including unconscious
victims, without the availability of a wireless connection to call for assistance and disclose their
location to the search and rescue personnel [1, 2]. Search and Rescue (SAR) scenarios involved
natural and human-made disasters that can cause damages to the existing cellular infrastructure [3]
and situations in which the victims may have stepped outside the cellular coverage area, as in the
case of lost hikers in national parks [4]. What is the most effective and systematic way of searching
an area of distress to localize lost people or affected victims? According to the national SAR
manual, which is the standard reference document adopted by all the SAR communities, the grid
(zone) searching pattern is defined as the most effective search pattern to localize either lost people
or distressful victims during SAR Emergency scenarios.
SAR operations involve temporal and spatial components that must be considered when
planning and managing a mission. Detecting the location of the victims in the least possible amount
of time is critical since any delays will likely reduce the chances of survival [27]. Obtaining a rapid
overview of the situation becomes crucial, and the sky supplies a mobile vantage position to deploy
assistance at the right time and location. Gathering the maximum data over the affected area or
designated search area provides a wide-area situational awareness for distributing the scarce
resources of time and rescue team/equipment. With many onboard sensors (e.g., thermal and
optical cameras, LIDAR, remote sensing devices, and GPS), an Unmanned Aerial Vehicle (UAV)
can capture data during SAR operations and transfer it to a ground base station in real time [28].
1
Recent advances in hardware and software technology have allowed UAVs to perform a
broad set of tasks and enable their use in many different civilian applications, including SAR,
mapping, and surveillance of a region of interest. UAVs have shown to be a promising and
powerful technology to conduct SAR operations safer, faster, and more efficiently due to their
agility, portability, and aerial advantages. Furthermore, UAVs reduce the likelihood of exposing
SAR members to unnecessary danger during SAR operations and provide access to remote or
difficult-to-reach locations deemed dangerous for the SAR crew or those that take a long time to
reach. The introduction of UAVs will make disaster relief operations faster and safer [29].
As UAVs are becoming more ubiquitous, the SAR communities have capitalized on their
use to assist and supplement in a search procedure or disaster response and relief [30, 31,32]. In
an UAV-based search and rescue operation, a good line of sight and the discretization of the search
area render a high probability of localizing a victim in a given zone [9]. Hence, UAVs can employ
different search strategies to localize victims in a given designated search area. An image
processing technique to locate victims is used by the UAVs in [10, 11].
However, given the limited visibility and cluttering conditions observed during the
emergency, it might not be possible to accurately detect and track individuals using wireless
cameras or real-time video, especially from longer distances. As an alternative to the camera
vision-based localization of victims, Wi-Fi signals from victims’ wireless devices may also be
used by UAVs for SAR operations [12, 13]. Attached to the UAV is the Tetra Wi-Fi Pineapple
sensor to detect Wi-Fi probe requests, which are a ubiquitous feature used in smartphones, enabled
by default and rarely ever disabled by the user. Smartphones use probe request transmissions to
scan and to find Wi-Fi access points (APs) [47, 48, 49]. The smartphones send out probe requests
to connect to previous APs or discover new APs available in the vicinity. Probe request
transmissions, i.e., beacons, take place every few seconds, and the smartphone can be detected if
2
it is within signal range, even if the user does not connect to the APs. By deploying a packet
analyzer tool to sniff Wi-Fi, Tetra Wi-Fi Pineapple [50] detects the probe requests transmitted by
smartphones and can potentially reduce the area of interest to search during SAR operations.
Hence, a machine learning technique is used to localize Wi-Fi devices by capturing/detecting
probes using a UAV.
The use of a UAV as a tool for SAR operations contains limitations. The flight time of a
UAV is limited. The flight performance of the UAV can be affected by the addition of weight to
its overall payload mass. For example, the UAV stability performance controlled by the embedded
navigational sensors found in the flight controller can be reduced, the already limited flight time
can be further lessened, and the climb rate reduced, especially during autonomous flight in altitude
hold and hovering flight mode. Not only the navigational performance of the UAV is reduced, but
also the power consumption of the UAV works harder by drawing more energy from the battery.
The search trajectory set by the SAR crew for the UAV to fly also has an adverse impact on the
flight time, the power consumption of the UAV, and the number of probes detected/collected.
In this thesis, a machine learning algorithm is used to predict the correct occupancy zone of
Wi-Fi devices from a geographical zone grid division. The chosen algorithm for this application
depends on the size and quality of the data and the extracted parameters from the sensor used.
Then, the algorithm classifies the collected observations and predicts an outcome with high
accuracy.
The thesis also addresses the limitations posed by the UAV technology. It presents in-depth
procedures to maximize the flight time of the UAV, improves its flight performance, and how the
sensory operations are affected in detecting probes by the search flight patterns flown by the UAV.
The thesis is organized in the following order:
3
Chapter 2 discusses a literature review about the main issues on Wi-Fi localization and UAV
technology.
Chapter 3 concentrates on the localization of Wi-Fi devices using probe requests captured by
Unmanned Aerial Vehicles.
Chapter 4 presents procedures to extend the flight time of Unmanned Aerial Vehicles and
flight patterns detecting the most probes.
Chapter 5 draws conclusions on Wi-Fi localization captured by Unmanned Aerial Vehicles,
processes to extend their flight time, the effective flight pattern to detect probes, and future studies.
4
CHAPTER II
Literature Review 2.1 UAVs as SAR Platforms
UAV’s platforms have rapidly begun to be adopted for search and rescue operations [5, 6, 8]. The
SAR teams have realized the lifesaving capabilities of UAVs due to their easy deployability and
airborne characteristics that render a good line of sight with the ground entities. Once they are
deployed to conduct a flight mission, UAVs can monitor the designated search areas using various
sensors mounted onto their frames and connected to the flight controller. UAVs can be used as
aerial platforms to collect images to monitor a disaster area [33, 34]; to rescue natural disaster
victims and transport medical samples and supplies [35]; to carry a payload of different visual
sensors and digital image stabilization circuit to stabilize thermal and RGB video to support first
responders in disaster scenarios [36, 37]; to generate fast and actionable 3D maps modeling a
disaster scene for emergency response [38]; to provide orthomosaics images of the data captured
during a SAR flight mission to assist responding agencies [39]; and to use RGB-Depth sensors to
build 3D point cloud models of disaster scenes and import them into a state-of-the-art game engine
for first responders to interact with the simulated environment [40].
Furthermore, an essential role of UAVs in SAR operations has been a combination of aerial
photography, including associated pattern recognition and image processing algorithms [41] and
remote image sensing [42, 43, 44]. Thermal sensitivity and zoom capabilities, enhanced IR
sensors, and a higher heat detection combined with pan tilt zoom capabilities are some of the
advanced features provided by thermal imaging cameras that can be mounted onto the UAV for
SAR operations. With the designed image recognition algorithm captured by the UAV, the
technology has shown levels of success by detecting the search objects or victims. Hence, UAVs
5
are capable and adaptable to be used, as aerial platforms to collect disaster scenes data over
designated search areas that used to be carried out by conventional airborne platforms.
2.2 Wireless Localization
As an alternative to the camera vision-based localization of victims, Wi-Fi signals from victims’
wireless devices may also be used by UAVs for search [12, 13, 14, 15, 16, 17].
This search strategy can help in delivering food and medical packages using UAVs [12], analyzing
pedestrian/vehicular traffic pattern during evacuation [18], and identifying the indoor location of
people stuck in a fire building [19]. Therefore, using a passive sniffer, such as a Wi-Fi Pineapple
[21], it is possible to capture and decode ambient Wi-Fi probe requests broadcasted by Wi-Fi
devices, such as smartphones and tablets [20]. To find a Wi-Fi device’s location, we extract the
received signal strength indicator (RSSI), unique MAC address of the Wi-Fi devices from the Wi-
Fi probe requests, and record them at different locations of a UAV (captured using GPS).
While triangulation based techniques can be used to estimate the location of the Wi-Fi device
from an estimated distance at different locations [19], for localization in 3D scenarios, RSSI no
longer depends monotonically on the distance and can show significant variations, as a function
of the UAV elevation [See Fig. 4].
2.3 Similar Work
In [51], a UAV is used to reliably detect Wi-Fi-enabled mobile phones from relatively long ranges,
giving the sensor’s range capability. From the air, the UAV detects the probes, and on the ground,
the mobile phones have a custom application installed to extend the battery life and to continue
sending Wi-Fi frames, even while the phones’ display is turned off. As long as the phones remain
on, they will continue to broadcast Wi-Fi probe requests scanning for any active Wi-Fi access
point in the vicinity. In [61], a UAV captures Wi-Fi probes in a zone-grid area flying at different
6

heights. Smartphones are placed in each partition of the zone-grid area, and the UAV captures the
Wi-Fi probe requests to determine the localization of each device.
In this thesis, a different approach is taken in that the UAV is kept in the air the longest
possible amount of time by implementing the procedures outlined to extend the flying time of the
UAV. Keeping the UAV longer in the air is crucial for the continuous capture/detection of Wi-Fi
probes to collect more probes and increase the probability of their localization. The more probes,
the better the prediction model, e.g., Random Forest Algorithm, to associate a Wi-Fi device
accurately with the correct zone that provides a coarse location information about the Wi-Fi
devices.
However, UAVs have a downside of additional power consumption to the addition of
sensors and flight maneuvers while conducting SAR operations. Additional weight to the payload
mass of the UAV takes energy away from the battery and affects the duration of the overall flight
time. Similar works [45, 46] have also addressed the effect of weight on the flight duration of a
UAV and have simulated the energy consumption of the UAV battery on various flight scenarios.
The analysis in this thesis uses a different approach by flying in real time a UAV autonomously
and manually to show how flight patterns affect the battery performance. The concepts of
propellers’ calibration and functions of Lithium Polymer (LiPo) batteries are analyzed. These
concepts show either a positive or negative effect on the navigational performance, which is crucial
to have during SAR missions, and either reducing or extending the flight time of the UAV, which
is a significant constraint to the limited time the aircraft has in the air. These concepts have had
limited analysis in real time in the literature. Furthermore, this work differs in that different actual
search patterns are flown, and how each pattern is more efficient at detecting probes. The flight
pattern and search area are determined by understanding the type of terrain and search object, as
outlined by Search Theory Method.
7
CHAPTER III
Localization of Wi-Fi Devices Using Probe Requests Captured at Unmanned Aerial Vehicles
3.1 Environmental Setup for the Experimentation
3.1.1 Wi-Fi Pineapple The Wi-Fi Pineapple Mark V is a wireless network auditing tool [21], which is accessible remotely
via a Wi-Fi interface. It is power up using a rechargeable battery connected to its DC port. The
rechargeable battery is light in weight, making it portable and ideal to use in the experiment. The
Wi-Fi Pineapple has dual Atheros AR9331 system on a chip with integrated radios, including a
400 MHz MIPS processor, a 16 MB ROM, and a 64 MB RAM. The Wi-Fi Pineapple is accessible
through a web interface or an inbuilt Unix machine called BusyBox [22]. In this experiment, the
Wi-Fi Pineapple equipment [23] is mounted onto a Tarot 650 UAV as shown in Fig. 1.
3.1.2 Mission Planner
Mission planner is a ground control station that can be used to remotely control a plane, copter,
UAV, or rover [24]. It is used as a configuration utility or a dynamic control supplement for
autonomous vehicles. Using mission planner, we can analyze the telemetry logs obtained from the
UAV and stored on the SD card. The telemetry log includes the communication messages between
the ground station and the UAV. These messages are known, as the MAVlink command messages,
and they provide information on the UAV flight path, dynamics, and status. The real-time GPS
coordinates of the UAV, needed for this experiment are extracted from the telemetry logs. The
GPS coordinates are expressed
8
Fig. 1. (a) Experimental setup with Wi-Fi Pineapple mounted on a drone, and (b) Model used to access packets from Wi-Fi Pineapple remotely to localize a Wi-Fi device.
as a combination of the latitude, longitude, and altitude. The altitude information enables a 3D
localization of the Wi-Fi devices on the ground.
3.1.3 Virtual Private Network
The experimental setup of the Wi-Fi Pineapple mounted onto the UAV is shown in Fig. 1(a). We
can access the Wi-Fi (a) Google Earth image of the path traveled by the UAV and (b) Processed
path in the coordinate system, as illustrated in Fig. 2. However, the UAV, having the Wi-Fi
Pineapple mounted onto the bottom of the frame, will be flying at different heights and remote
locations. Therefore, a smartphone is mounted onto the UAV
9
Fig. 2. UAV flight plan used for Wi-Fi localization.
to provide Internet connection to the Wi-Fi Pineapple. Alternatively, a USB modem can also be
used, instead of a smartphone, to reduce the payload on the UAV. Through the Internet connection,
we establish a virtual private network (VPN) connection between the Wi-Fi Pineapple and the user
terminal, as illustrated in Fig. 1(b). The experiment used an open-source software application
called OpenVPN that implements VPN. OpenVPN uses the OpenSSL library to provide encryption
of the data and the control channels. The public safety data available captured by the Wi-Fi
Pineapple and the UAV during SAR operations can be critical and sensitive. Therefore, a VPN
connection ensures a secure communication between the UAV and the emergency first responders’
terminal. The VPN connection presents an ability to safeguard the public safety data from any
possible cybersecurity threat.
3.2 Capturing Data with WI-FI Pineapple
3.2.1 UAV Deployment to Capture Wi-Fi Probe Requests
The UAVs fall into two broad categories, as either rotary wings or fixed wings. Given the
application of this experiment, a Tarot 650 rotary-wing UAV is utilized. The Tarot 650 quadcopter,
since it has 4 propellers, is equipped with a Pixhawk autopilot suitable for a rotary wing UAV,
10

having autonomous navigation, a power source, and telemetry. It can communicate to a ground
base station and capable of carrying a payload of 6 lbs. The blueprint for a random flight plan of
the UAV can be obtained from the mission planner ground control station. Furthermore, we also
use the mission planner to create the KML and the GPX files of the UAV flight plan. These files
record the GPS flight data from the very beginning the UAV is connected to the mission planner
via telemetry and generate the map annotation to open with Google Earth, as shown in Fig. 2a, and
view the flight plan in the coordinate system, as shown in Fig. 2b. The telemetry radios are used
to connect wirelessly to the UAV and to communicate with the ground control station from the air,
using the MAVLink protocol. During SAR missions, this interactive communication link allows
the reception of real-time data from the UAV. The telemetry radios are connected to the user’s
laptop or tablet using a USB cable, and the laptop serves as the ground control station. The
approximate range of telemetry radios is about one mile and on a periodic basis provide the UAV
status.
3.2.2 UAV Flight Trajectory to Capture Wi-Fi Probe Requests
The Federal Aviation Administration (FAA) has created the National Airspace System (NAS) to
establish standard operating procedures and regulations for UAV operations in
11
Fig. 3. Unique devices identified from different manufacturers based on the Wi-Fi probe requests captured at the UAV.
the civilian airspace safely and efficiently. The FAA newer provisions to Part 107 integrates the
UAVs into the NAS . The FAA rules prohibit any operators to fly a UAV beyond 400 feet and
beyond the operator's line of sight. Moreover, the flights must not operate within five miles of any
major airports and two miles from any heliports. In our experiment, the UAV operates following
all the FAA regulations. The test cellphones are positioned in the field in the form of a grid. All
the test cellphones are separated from each other a distance of 24 feet, as shown in Fig. 5. In our
experiment, the UAV follows a flight pattern used for mapping missions. In this flight plan, the
UAV flies in a circular pattern at different altitudes over the geographical area of interest to capture
Wi-Fi probe requests.
12
3.2.3 Using Wi-Fi Pineapple to Capture Wi-Fi Probe Requests
In our experimentation, we automate the scripts to control Wi-Fi Pineapple through the
customizable boot modes. Using the Wi-Fi Pineapple web interface, we specify the script to run
on boot up, and on subsequent bootup, the Wi-Fi Pineapple executes the commands listed in the
script. Once the Internet connection is established, the date and time in the Wi-Fi Pineapple are
updated using an NTP server. Upon boot up, the Wi-Fi Pineapple starts capturing Wi-Fi probe
requests in the 2.4 GHz band. The Wi-Fi Pineapple also captures the Wi-Fi packets originating
from the nonexperimental Wi-Fi devices that are within the range of the Wi-Fi Pineapple. The data
obtained by the Wi-Fi Pineapple is time stamped and includes the MAC address, the RSSI, and
the manufacturer’s name of the Wi-Fi enabled devices. Based on the Wi-Fi probe requests
captured, Fig. 3 illustrates the different type of devices detected during the flight trajectory of the
UAV.
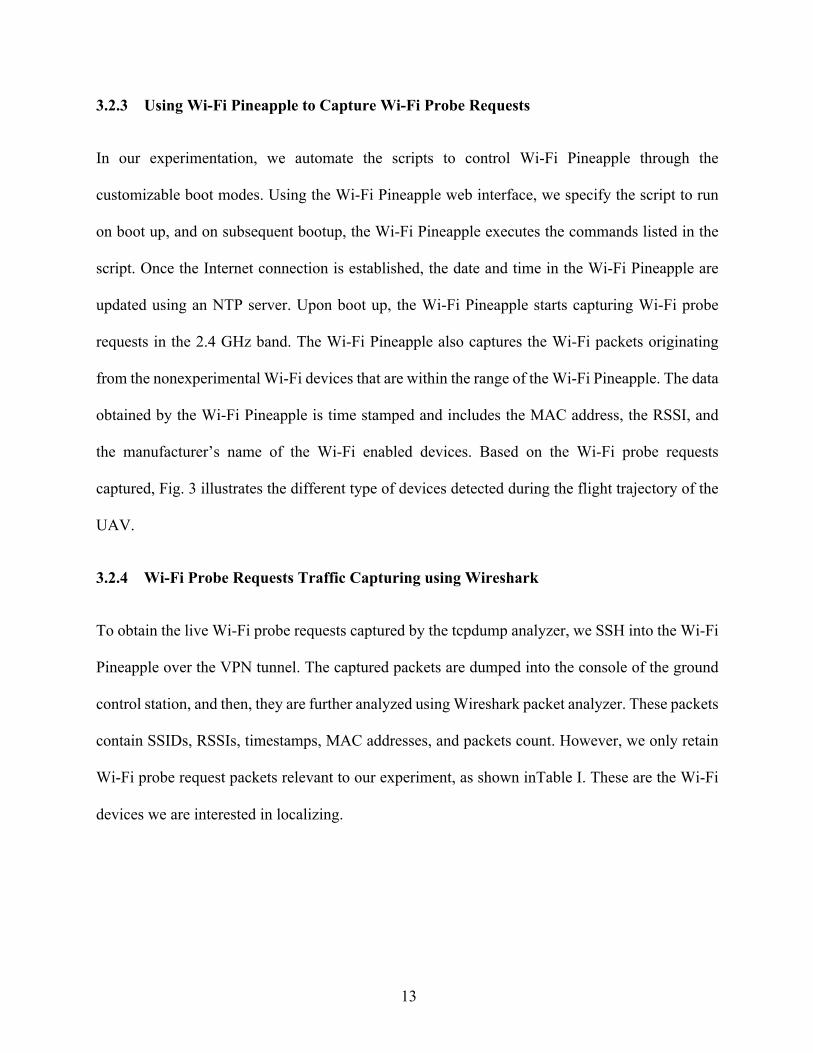
3.2.4 Wi-Fi Probe Requests Traffic Capturing using Wireshark
To obtain the live Wi-Fi probe requests captured by the tcpdump analyzer, we SSH into the Wi-Fi
Pineapple over the VPN tunnel. The captured packets are dumped into the console of the ground
control station, and then, they are further analyzed using Wireshark packet analyzer. These packets
contain SSIDs, RSSIs, timestamps, MAC addresses, and packets count. However, we only retain
Wi-Fi probe request packets relevant to our experiment, as shown inTable I. These are the Wi-Fi
devices we are interested in localizing.
13
Packet number
Time stamp
RSSI
(dBm)
MAC Address
Device number
Latitude Longitude Elevation
(ft.)
857 20:02:55 -65 10:c3:7b 3 25.7491 -80.37400 35.10499
860 20:02:55 -63 10:c3:7b 3 25.7491 -80.37400 35.10499
863 20:02:58 -75 AsustekC 2 25.7491 -80.37403 36.28609
866 20:03:00 -67 SamsungE 4 25.7491 -80.37400 37.86089
870 20:03:01 -56 SamsungE 4 25.7491 -80.37410 39.63255
879 20:03:01 -67 MurataMa 5 25.7491 -80.37412 39.30446
TABLE I. Example for Captured WiFi probe request packets for a duration of 6 seconds.
The GPS coordinates are obtained by synching the time of the Wi-Fi Pineapple and the flight
controller internal clock. The timestamp of each captured Wi-Fi probe request is then mapped to
its corresponding GPS coordinate.
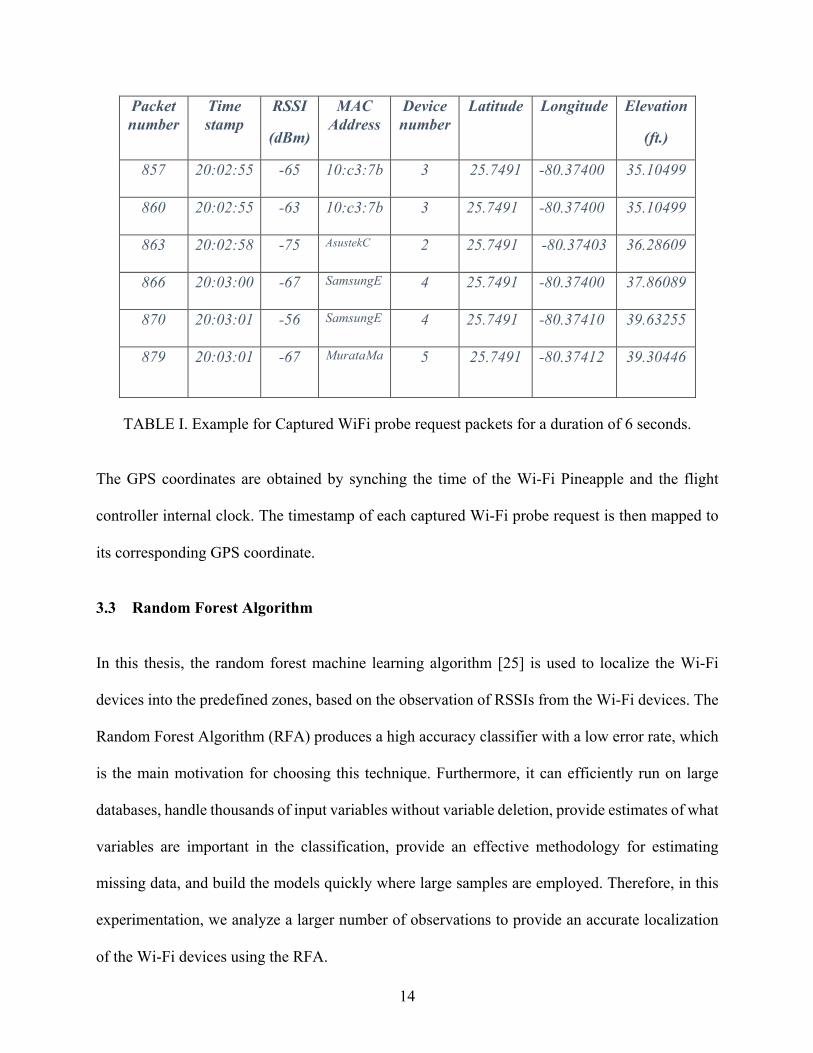
3.3 Random Forest Algorithm
In this thesis, the random forest machine learning algorithm [25] is used to localize the Wi-Fi
devices into the predefined zones, based on the observation of RSSIs from the Wi-Fi devices. The
Random Forest Algorithm (RFA) produces a high accuracy classifier with a low error rate, which
is the main motivation for choosing this technique. Furthermore, it can efficiently run on large
databases, handle thousands of input variables without variable deletion, provide estimates of what
variables are important in the classification, provide an effective methodology for estimating
missing data, and build the models quickly where large samples are employed. Therefore, in this
experimentation, we analyze a larger number of observations to provide an accurate localization
of the Wi-Fi devices using the RFA.
14
The RFA is a combination of machine learning methods, using an ensemble of decision trees
in which each node is split, using the best among a subset of predictors. The main goal is to reduce
the variance of the predictor while the bias remains the same. A randomness is injected into the
forest by applying bagging (bootstrap aggregation), where the labeled training data is randomly
sampled [26]. The variance reduction of bagging the tree-growing process is improved by using a
random selection of the input variables. The intuition behind this approach is to build a strong
classifier utilizing a combination of weak classifiers [26].
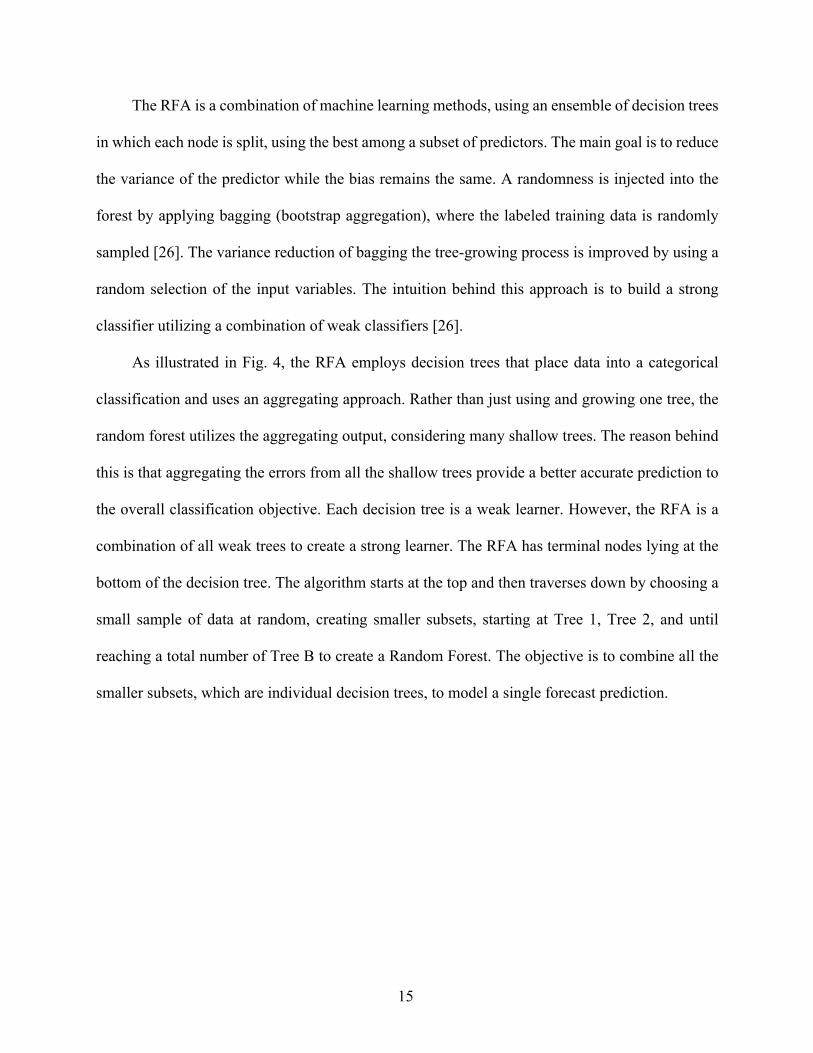
As illustrated in Fig. 4, the RFA employs decision trees that place data into a categorical
classification and uses an aggregating approach. Rather than just using and growing one tree, the
random forest utilizes the aggregating output, considering many shallow trees. The reason behind
this is that aggregating the errors from all the shallow trees provide a better accurate prediction to
the overall classification objective. Each decision tree is a weak learner. However, the RFA is a
combination of all weak trees to create a strong learner. The RFA has terminal nodes lying at the
bottom of the decision tree. The algorithm starts at the top and then traverses down by choosing a
small sample of data at random, creating smaller subsets, starting at Tree 1, Tree 2, and until
reaching a total number of Tree B to create a Random Forest. The objective is to combine all the
smaller subsets, which are individual decision trees, to model a single forecast prediction.
15
Fig. 4. RFA for aggregating output decision trees.
The operation of the RFA classifier can be summarized as follows. Suppose we have the
training set 𝐷 = 𝑥$𝑦$ , 𝑖 = 1,… , 𝑛,with 𝑥$𝜖ℜ.. Then,
1) RFA generates the bootstrap samples 𝐷0 from the training set 𝐷 with replacement where 𝑏 = 1,2, … , 𝐵.
2) For each 𝐷$, RFA constructs a classification tree 𝑇$ and grow it until the minimum node is reached. At each node, the RFA chooses the random subset of features 𝑚 𝑚 < 𝑑 , and only consider splitting at those features.
3) Let 𝐶0 𝑥 denote the class prediction of random forest tree 𝑇0 by 𝑏9: tree. Then, the RFA prediction is given by the following majority vote:
𝐶;<= 𝑥 = 𝑎𝑟𝑔𝑚𝑎𝑥 𝑥 𝛴0BC= 𝐼 𝐶0 𝑥 = 𝑔 .
3.4 Numerical and Experimental Results
In this section, we apply the machine learning technique to the larger amount of data captured from
the Wi-Fi Pineapple and the UAV GPS, and then, present numerical results on the accuracy of the
RFA for the considered scenario.
16
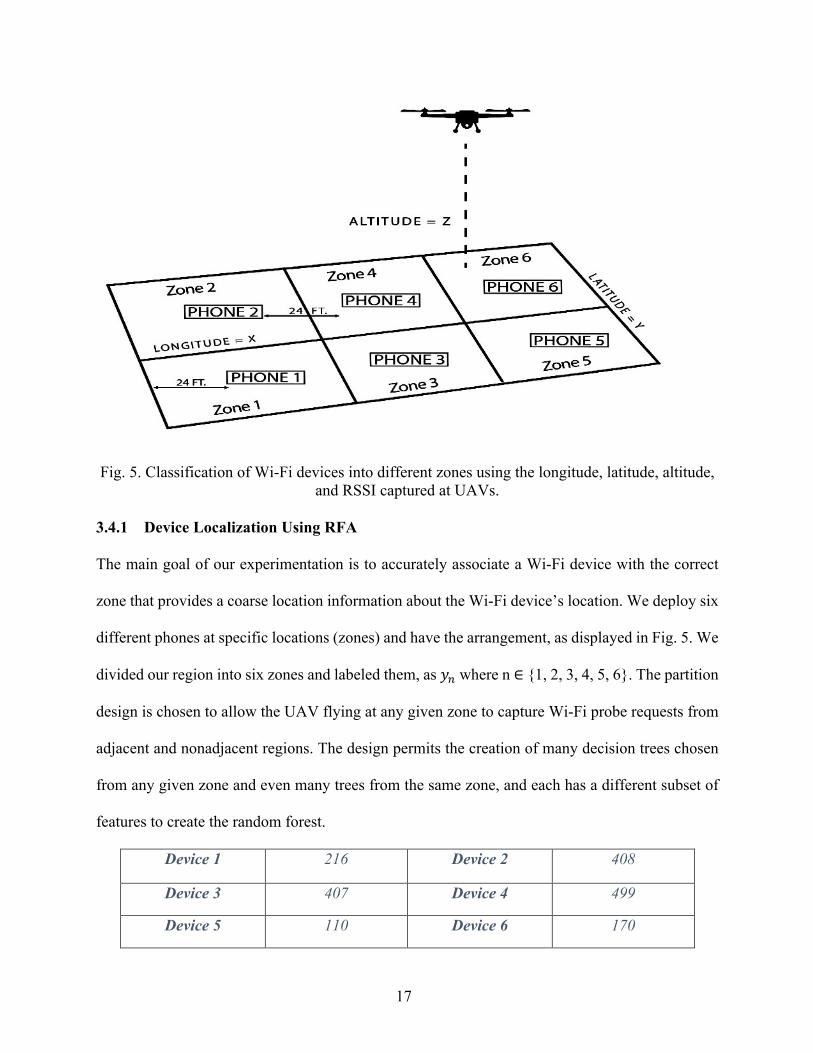
Fig. 5. Classification of Wi-Fi devices into different zones using the longitude, latitude, altitude, and RSSI captured at UAVs.
3.4.1 Device Localization Using RFA
The main goal of our experimentation is to accurately associate a Wi-Fi device with the correct
zone that provides a coarse location information about the Wi-Fi device’s location. We deploy six
different phones at specific locations (zones) and have the arrangement, as displayed in Fig. 5. We
divided our region into six zones and labeled them, as 𝑦E where n ∈ {1, 2, 3, 4, 5, 6}. The partition
design is chosen to allow the UAV flying at any given zone to capture Wi-Fi probe requests from
adjacent and nonadjacent regions. The design permits the creation of many decision trees chosen
from any given zone and even many trees from the same zone, and each has a different subset of
features to create the random forest.
Device 1 216 Device 2 408
Device 3 407 Device 4 499
Device 5 110 Device 6 170
17
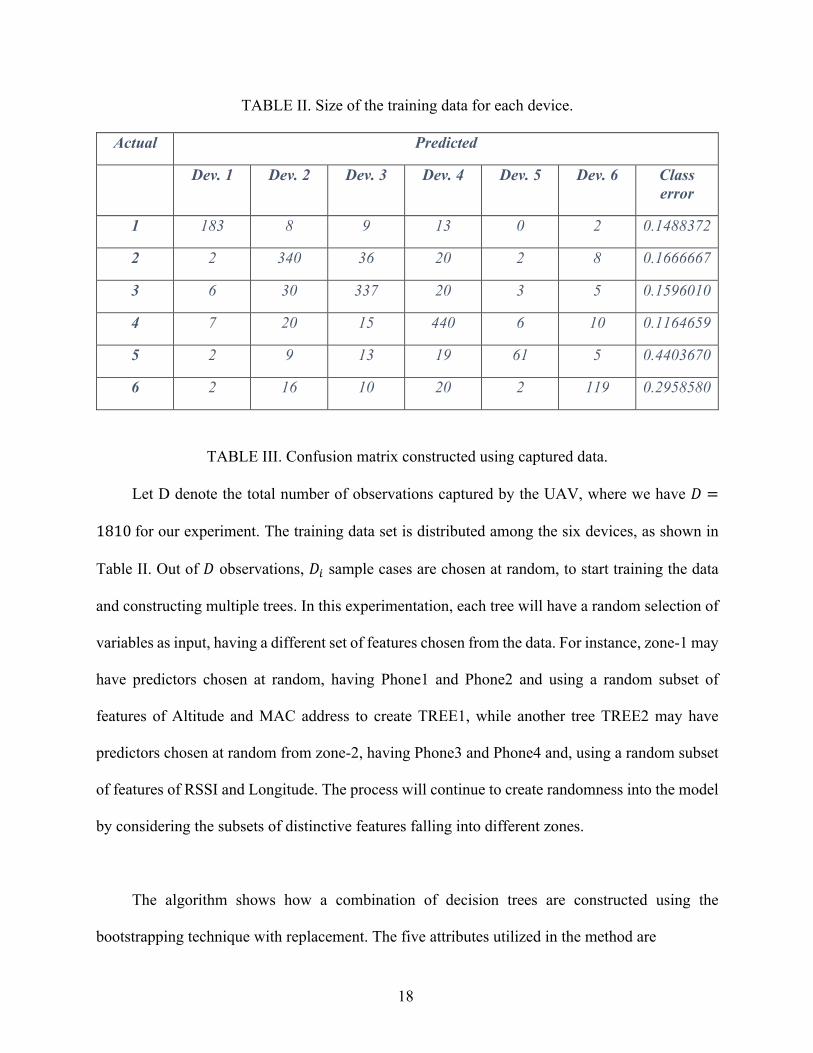
TABLE II. Size of the training data for each device.
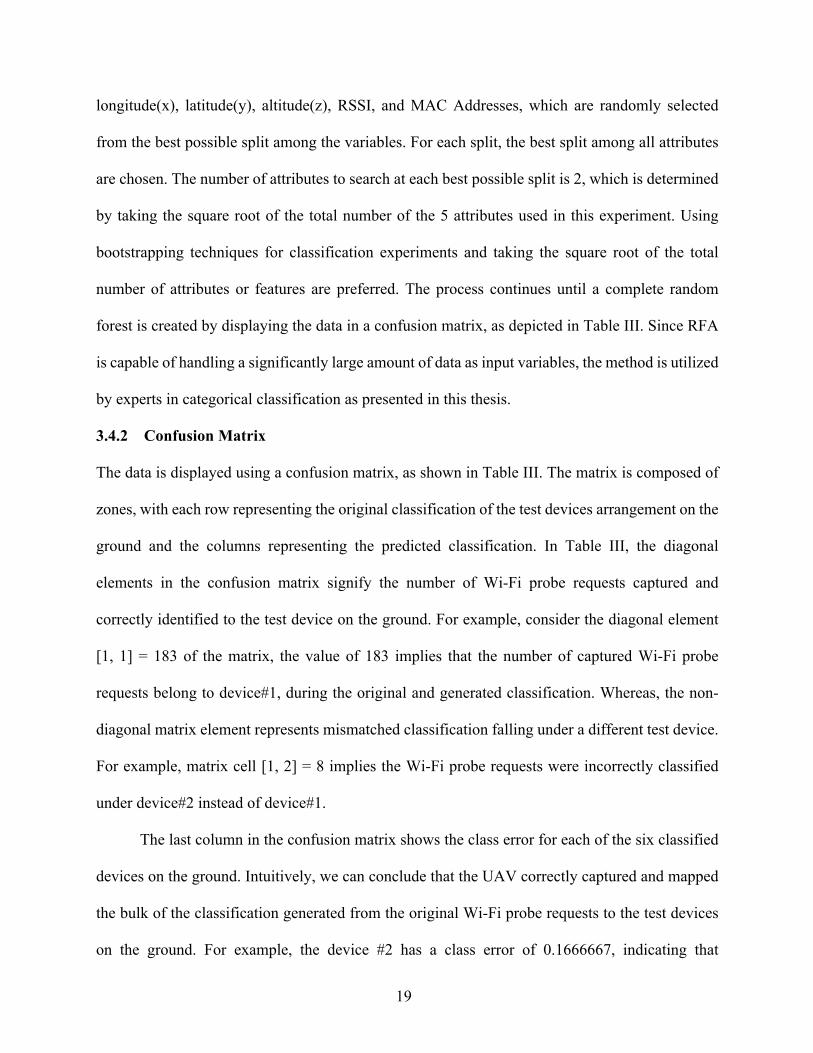
Actual Predicted
Dev. 1 Dev. 2 Dev. 3 Dev. 4 Dev. 5 Dev. 6 Class error
1 183 8 9 13 0 2 0.1488372
2 2 340 36 20 2 8 0.1666667
3 6 30 337 20 3 5 0.1596010
4 7 20 15 440 6 10 0.1164659
5 2 9 13 19 61 5 0.4403670
6 2 16 10 20 2 119 0.2958580
TABLE III. Confusion matrix constructed using captured data.
Let D denote the total number of observations captured by the UAV, where we have 𝐷 =
1810for our experiment. The training data set is distributed among the six devices, as shown in
Table II. Out of 𝐷 observations, 𝐷$ sample cases are chosen at random, to start training the data
and constructing multiple trees. In this experimentation, each tree will have a random selection of
variables as input, having a different set of features chosen from the data. For instance, zone-1 may
have predictors chosen at random, having Phone1 and Phone2 and using a random subset of
features of Altitude and MAC address to create TREE1, while another tree TREE2 may have
predictors chosen at random from zone-2, having Phone3 and Phone4 and, using a random subset
of features of RSSI and Longitude. The process will continue to create randomness into the model
by considering the subsets of distinctive features falling into different zones.
The algorithm shows how a combination of decision trees are constructed using the
bootstrapping technique with replacement. The five attributes utilized in the method are
18
longitude(x), latitude(y), altitude(z), RSSI, and MAC Addresses, which are randomly selected
from the best possible split among the variables. For each split, the best split among all attributes
are chosen. The number of attributes to search at each best possible split is 2, which is determined
by taking the square root of the total number of the 5 attributes used in this experiment. Using
bootstrapping techniques for classification experiments and taking the square root of the total
number of attributes or features are preferred. The process continues until a complete random
forest is created by displaying the data in a confusion matrix, as depicted in Table III. Since RFA
is capable of handling a significantly large amount of data as input variables, the method is utilized
by experts in categorical classification as presented in this thesis.
3.4.2 Confusion Matrix
The data is displayed using a confusion matrix, as shown in Table III. The matrix is composed of
zones, with each row representing the original classification of the test devices arrangement on the
ground and the columns representing the predicted classification. In Table III, the diagonal
elements in the confusion matrix signify the number of Wi-Fi probe requests captured and
correctly identified to the test device on the ground. For example, consider the diagonal element
[1, 1] = 183 of the matrix, the value of 183 implies that the number of captured Wi-Fi probe
requests belong to device#1, during the original and generated classification. Whereas, the non-
diagonal matrix element represents mismatched classification falling under a different test device.
For example, matrix cell [1, 2] = 8 implies the Wi-Fi probe requests were incorrectly classified
under device#2 instead of device#1.
The last column in the confusion matrix shows the class error for each of the six classified
devices on the ground. Intuitively, we can conclude that the UAV correctly captured and mapped
the bulk of the classification generated from the original Wi-Fi probe requests to the test devices
on the ground. For example, the device #2 has a class error of 0.1666667, indicating that
19
approximately 16% of the originally captured Wi-Fi probe requests from the device will not show
up in the classification generated. However, an interesting advantage of having the data tabulated
in a confusion matrix is the overall accuracy of the classification model. In the case of device #5
and #6, a higher class error is obtained, as compared to the other devices due to a smaller size of
the observation data. The smaller size of the observation data is due to the captured probe requests
not being part of the classification generated, negative GPS coordinates recorded for the captured
Wi-Fi probe requests, or the interval at which the device transmits the Wi-Fi probe requests.
3.4.3 Results Analysis
In this experimentation, we observe that the prediction of the random forest has an 81.8% accuracy.
Overall, the accuracy describes how often the performance of the classifier is correct. We use the
following equation to determine the overall accuracy of the method:
𝐴𝑐𝑐𝑢𝑟𝑎𝑐𝑦 =𝑁MN + 𝑁MP𝑁MQ9RS
,
(1)
where the number of true positives (TP) (𝑁MN) is the number of occurrences when the model
predicts the correct probe requests captured in the correct cell, which are found by adding all the
diagonal elements in the confusion matrix, as depicted in Table III. The number of true negatives
(TN) is denoted by 𝑁MP, which predicts correctly the probe requests captured not falling in the
correct cells and are found in the row elements of the confusion matrix, except for the diagonal
elements, as illustrated in Table III. The 𝑁MQ9RS is the number of all observed probe requests
captured during the experiment, as shown in Table II.
This implies that there is an 81.8% chance that the phone location on the ground is correctly
identified in the zone where the Wi-Fi device is located, as illustrated in Fig. 5. However, if
20

precision and recall for the entire classification model are to be computed, the model does show
larger gains. In particular, the precision can be calculated as:
𝑃 =𝑁MN + 𝑁<N𝑁MQ9RS
, (2)
where 𝑁<N is the number of false positives (FP), which classify data in the model, as the Wi-Fi
probe requests captured falling in the correct cell classification generated but falling in the wrong
cell. FPs are the row elements in the Confusion Matrix. For this experiment, the predicted and
generated Wi-Fi probe requests captured by the Wi-Fi Pineapple belong to the same test device on
the ground. The precision model has an 82% precision classification, implying the predicted Wi-
Fi probe requests coming from any of the six test devices is matched correctly to the generating
test device.
On the other hand, the recall for the RFA is calculated as:
𝑅 =
𝑁MN𝑁<P
,
(3)
where 𝑁<P is defined as the number of false negatives, which classify WiFi probe requests
captured, as falling in the wrong cell classification but having actually falling in the correct cell.
The false negatives (FNs) are found in the column elements of the matrix. The model has an 80%
recall classification, implying the predicted Wi-Fi probe requests from any of the six test devices
is matched correctly to the generating test device. This model shows a strong correlation between
precision and recall, demonstrating how accurate the model is in predicting the location of the test
devices on the ground grid, as shown in Table III.
21
CHAPTER IV UAV Procedures to Extend Flight Time for Search and Rescue Operations Using Wi-Fi Probe
Requests
4.1 Environment of Experimental Design
4.1.1 Sensor to Detect Wi-Fi Probes
The sensor used in this research to detect Wi-Fi probe requests is called Wi-Fi Pineapple Tetra,
which is a Wireless Auditing Arsenal [50] that is used for Wireless Penetration Testing. Unlike
the Wi-Fi Pineapple previously discussed in section 3.1.1, the Tetra is bigger. Therefore, it has a
more extensive footprint, and the antennas are upgraded to a 5dBi range, increasing the coverage
area. The Tetra dual-band (2.4/5 GHz) capabilities provide the solution to the continuous detection
of probes in either band. Tetra is powered up by a DC battery, providing its own entirely
independent power and does not strain the battery of the UAV. Due to its design implication for
portability, long-term deployment, and on-the-move auditing, Tetra is ideal for mounting by straps
at the bottom of the UAV frame. The weight difference compared to the Wi-Fi Pineapple, the
architecture of the Tarot 650 is able to handle the added payload of the Tetra when flying over the
designated search area detecting probes. For our research, to establish a secure connection between
the Laptop and Kali Linux to code the Tetra, we used a Virtual Private Connection and PuTTY.
PuTTY is an open source software that is used as an SSH client for the Unix Machine. For
collecting data, we used a virtual machine application Kali Linux VMware to operate the Tetra
relative to the ground base station. The Kali Linux contains pre-install applications, including
Wireshark, an application that analyzes packets [52]. Each probe detected is synced to the UAV
flight controller to obtain the GPS coordinates in a 3-D format from the telemetry logs obtained
from the ground base station.
22

4.1.2 DroneDeploy
DroneDeploy is a software platform for UAVs to create a real-time mapping of an area of interest
and to provide information about the planned flight [53]. The planned flight of the UAV includes
the entire search area, the total time based on the flight pattern, the altitude to fly the mission, and
the number of batteries required to complete the planned flight. DroneDeploy works great in
scanning and creating SAR flight patterns of the search area without having to deploy the UAV.
In this work, DroneDeploy is used to create different search patterns for the UAV to fly
autonomously and compare the results to piloting the UAV remote-control. Each search pattern
takes different total time and has a different effect on the battery consumption of the UAV. The
variation of probes identified is based on the search pattern flown by the UAV.
4.1.3 FAA Rules and Regulations for UAVs
There are a set of rules outlining safety guidelines for operators to follow when flying a UAV that
is set by the Federal Aviation Administration (FAA) [54]. The FAA is the agency responsible for
overseeing the safety of civil aviation. Operators must maintain the UAV within visual line of
sight, i.e., they must be able to see the UAV with their naked eyes, and fly it only in the daylight.
The maximum altitude to keep the UAV is under 400 ft. from the ground, and it cannot be flown
over people or nearby buildings. Due to the UAV flight tests conducted for this thesis in an area
the size of about two acres and without the involvement of any pilot using the fully autonomous
capabilities of the UAV, the operator must fly following the FAA guidelines to keep any damages,
if any were to occur, to a minimum. To assist the operator in determining whether there is any
flight restriction at the location where the UAV is operated, the B4UFLY smartphone app is used.
All FAA safety guidelines are followed during all flight tests conducted for this study.
23
4.1.4 UAV Used for the Experiment
Given the application of this experiment, a rotary-wing UAV is used for its capabilities of vertical
takeoff and landing, capacity to hover at specific locations as set by the autonomous function or
by the pilot when flying in RC mode and perform a variety of flight maneuvering. The UAV is a
quadcopter, having a Tarot 650 frame. The Tarot 650 is a lightweight and sturdy frame made up
of carbon fiber material. The Tarot 650 is equipped with four 620 kV high power brushless motors,
30-amps Electronic Speed Controllers to supply the amperes controlling the speed of the brushless
motors, 13-inch carbon fiber propellers, and a 4S 4000 mAh Lipo-battery, which provides between
15 and to 20 minutes of quality flight time. The payload capacity of the UAV is about 2.5 kg and
a 3-4 kg takeoff weight. The Tarot 650 quadcopter is equipped with a power distribution board
(PDB) to distribute power efficiently to all the components on the UAV. The PDB is a crucial
component of the UAV, and if it is not chosen and configured the right way, the UAV could end
up crashing to the ground. The PDB is a circuit board that connects the LiPo battery to all the ESCs
on the UAV. Furthermore, the Pixhawk autopilot is positioned at the top plate of the frame and
connected to an external GPS module away from the different components of the UAV, avoiding
or keeping to a minimum any interference from the motors, propellers, or sensors. The GPS module
connects to the GPS satellites to receive precise navigational data for Stabilize and Auto flight
mode.
4.2 Search Theory Method
In this paper, we use the search theory method of probability that has been utilized for SAR
operations since WWII [55]. Applying its mathematical foundation to SAR operations, the theory
has shown to be valuable by optimizing the allocation efforts to designated search areas and
increasing the likelihood of detecting the lost subject in the least possible amount of time. This
method is chosen for its practical applications to search planning techniques and for its
24
effectiveness in increasing the probability of the overall search success rate. Moreover, the study
extends the concept of search theory used in the ground to the air, using a UAV and the Wi-Fi
Pineapple Tetra as the sensor to detect the search object(s).
There are uncertainties in any SAR mission, i.e., what areas to begin searching in any given
terrain to maximize any Wi-Fi probe requests detection. Other types of uncertainties include how
the weather may impact the UAV itself, the Wi-Fi Pineapple Tetra sensor mounted onto the UAV
to detect probes, and any foliage, which might be covering the phones on the ground. Considering
and understanding these uncertainties quantitatively using probability theory techniques will
maximize the overall chances of a successful SAR mission.
4.2.1 Probability of Containment
The amount of area to cover during SAR missions is limited to maximize the chances of finding
the search object quickly. After all available facts have been gathered, a search area is determined,
providing the possible location of the search object. This process is known as the probability of
containment (POC). The POC not only determines the possibility area by eliminating the less likely
areas not containing the search object but also divides a larger area into sub-areas since the amount
of area to efficiently cover is limited. Sensor technology is used on UAVs to carry out one or more
tasks during SAR missions, and the measure of how well the sensors performed undertaking the
SAR missions is known as the probability of detection (POD).
4.2.2 Probability of Detection
Factors that affect the probability of detection (POD) are the type of terrain, the type of search
object or the detection of probes, and the type of sensors use. POD performance is measured by
the ability to detect the search object only if the search area includes the object. Based on
probability theory, this concept is known as conditional probability. By definition, conditional
25
probability explains the probability of an event occurring given the previous or other events have
already occurred.
An area can be searched under different circumstances giving a different probability of
detecting the search object. The likelihood of finding the search object is high if the object is in
the area at the time of the search. During the search, the POD predicts how well the sensors perform
or how thoroughly an area has been searched. In some SAR cases, an area may have to be searched
multiple times to increase the likelihood of detecting the search object. Neither the POC nor the
POD stand-alone is a valid measure to predict the chances of success during a search. The
probability of success (POS), however, is an accurate measure to predict the chances of success
during a search.
4.2.3 Probability of Success
The POS is defined as the probability of finding or detecting the search object in the designated
search area. The POC and POD determine the value of POS. The POS can be expanded using
probability theory notation and expressed as:
𝑃 𝐴⋂𝐵 = 𝑃 𝐴 𝑃(𝐵|𝐴), (4)
where event A is the search object in the designated area to be searched; event B is the sensor
used to detect the search object given a designated area to be searched; P(A) is the probability that
the search object is in the designated search area (event A) or POC will be true; P(B|A) is the
conditional probability that the sensor detects the search object in the designated search area (event
B) or POD will be true, given that the search object is in the search area; and P(A ∩ B) is the
probability that during a particular search (POS) the search object is located in the designated
search area.
26
Predicted values for POC and POD are based on factors, such as what are the actual
conditions in the designated search area, what amount of the selected area is covered, and what is
the most up-to-date data analysis from all the gathered information. Then, an estimated value of
the POS can be determined. The POS is only an estimated value for which the actual value cannot
be determined, and the value may have to be adjusted for the POS as newer data comes to light.
When the value of either the POC or the POD is updated, the POS needs to be adjusted. By
searching an area and not detecting the search object, the probability of POD is reduced by an
amount proportional to its predicted value.
4.3 Ways to Maximize UAV Flight Time 4.3.1 Optimization of Propellers
A UAV system integrates many components to optimize its flight performance. However, the
flight controller (FC) or autopilot is considered the most important component of the UAV. The
FC functions as the brain of the UAV, managing all of its functionalities. The FC is not only
composed of hardware but also of the software comprising of advanced programs and
mathematical algorithms. One of the sources connected to the FC is the Inertial Measurement Unit
(IMU).
The IMU hosts the accelerometer and gyroscope sensors. Advanced FCs come with 6-axis
accelerometer/gyroscope. An accelerometer measures the orientation of the UAV relative to the
earth’s surface, while the gyroscope measures the rotational force. The IMU combines these two
measurements for the flight controller to be able to calculate the angle at which the UAV is flying
and performing the necessary adjustments to improve the UAV flight capabilities.
The three principal axes that control the motion of a UAV are Pitch, Yaw, and Roll. The
forward or backward movement of the UAV is the function of Pitch. The forward Pitch makes the
UAV to tilt slightly in the forward direction and to move away from the pilot, and the backward
27
Pitch brings the UAV back to the pilot. Yaw controls the rotation of the UAV either to the left or
the right, while Roll controls the sideward flying of the UAV either to the left or the right.
A UAV will undergo continuous changes in acceleration during a flight trajectory. The IMU
6-axis accelerometer sensor is responsible for detecting changes in the current rate of acceleration
by using one or more of its accelerometers. The IMU also detects changes in Pitch, Yaw, and Roll
making use of one or more of its gyroscopes. The IMU calculates the UAV’s current velocity by
integrating its acceleration and gravity.
UAVs experience natural vibration during flight, and vibration is one of the overlooked
challenges for UAVs. A primary source of vibration in a UAV is due to the propellers being out
of balance. Hence, balancing the UAV’s propellers is essential to have an optimal flight
performance, avoiding inaccurate estimates of the UAV position by disrupting the flight controller
accelerometers/gyroscopes, and preventing the LiPo battery from draining faster. The IMU can
negatively be affected by the excessive vibration from unbalanced propellers.
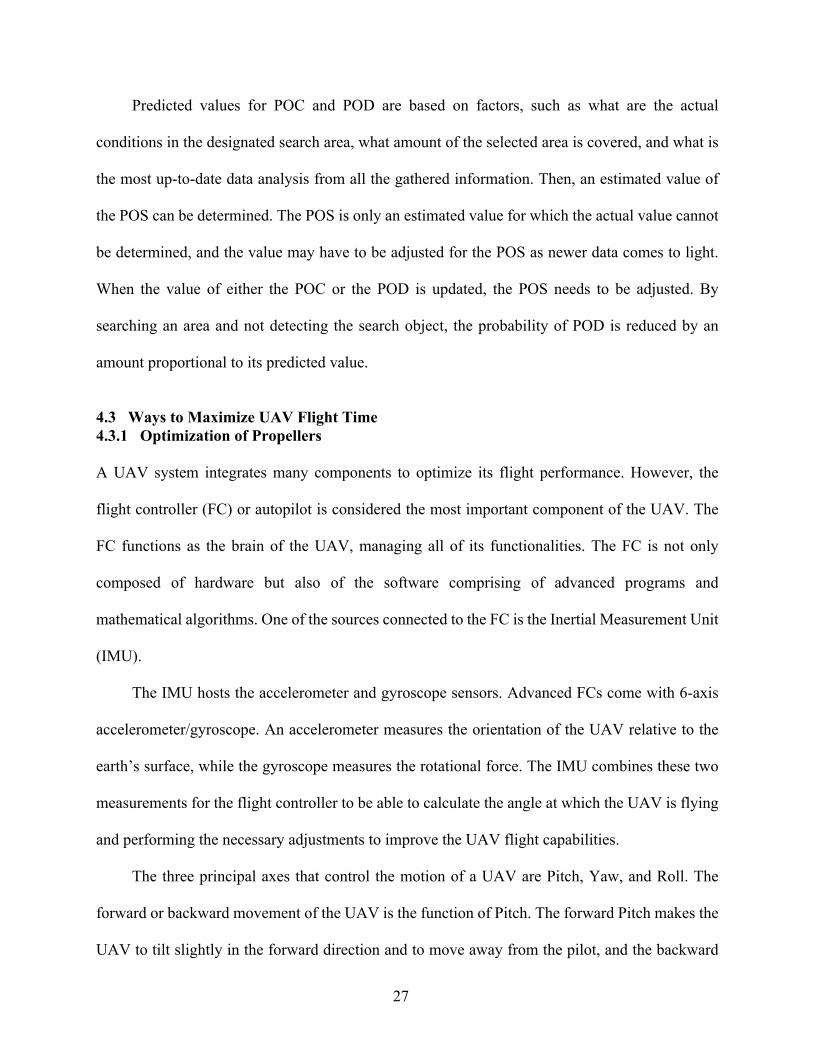
The accelerometer sensors have a threshold to resist vibration frequencies during a flight.
Exceeding the sensor threshold by the frequency of the vibrations is illustrated in Fig. 6. Inside the
sensor’s range, the IMU sends accurate data of the position and the altitude of the UAV. The high-
frequency vibrations produced by the propellers outside the sensor’s range generate discrepancies
between the calculated position and the actual position [30]. As the throttle is applied to increase
the UAV speed, the motors spin faster causing propellers to turn faster and increasing vibration,
which produce a drift or divergence in the attitude estimation of the UAV. The software parameters
to control and
28
Fig. 6. Accelerometer sensors’ threshold to resist vibration [56].
adjust the UAV IMU cannot always fix the vibration problems. The balancing of propellers to
prevent or to minimize vibrations must be performed as a pre-flight UAV safety checklist to
enhance performance and increase the flight time, which are two crucial elements to conduct SAR
operations.
4.3.2 LiPo Battery Basics
The primary source to power up a UAV is the battery. For UAVs, the ideal type of battery is the
Lithium Polymer (LiPo) due to its lighter weight, high power, and fast and high discharge rates.
Extended flight time and performance of the UAV are dependent on the LiPo capacity, while at
the same time not adding scaling problems to the positive correlation between LiPo capacity and
weight. The bigger the LiPo capacity, the heavier the LiPo becomes, which might not be efficient
since a heavier LiPo will require lower motor KV ratings operating at higher voltage ranges. The
addition of weight to the overall
29
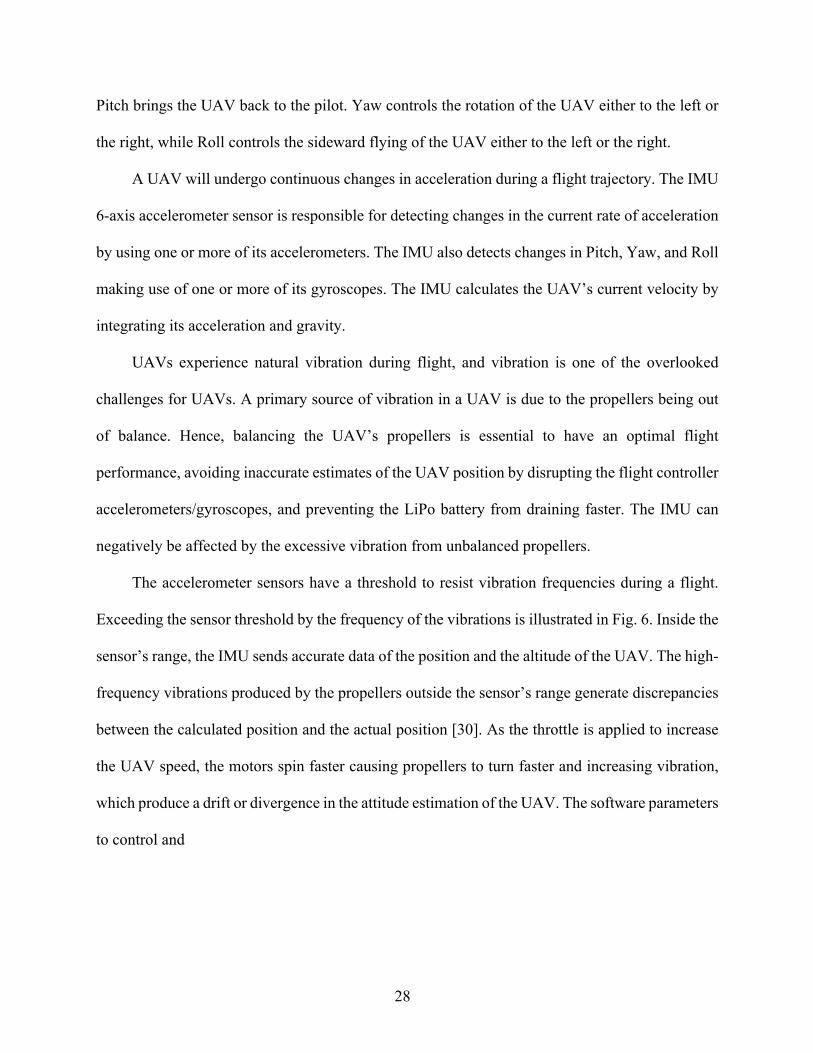
Fig. 7. LiPo battery functions [57].
payload of the UAV affects the duration of the flight time and navigational performance. The LiPo
battery needs to fit within the frame of the UAV. The size of the LiPo will depend on the size,
type, and the number of motors of the UAV. Understanding how to read the specifications on a
LiPo, as illustrated in Fig. 7, means a longer flight time, better maneuverability, and a faster flying.
LiPo batteries are made up of cells in series ranging from 1S to 6S. These cells specify the
LiPo voltage. Each cell is composed of a nominal voltage of 3.7 V. Nominal voltage is a term
manufacturers have come up with to designate a middle safe voltage range. As shown in Fig. 7,
the LiPo has three cells and an 11.1V, which is the nominal voltage calculated by multiplying the
number of cells by 3.7 V. The UAV motors’ RPM is directly
30
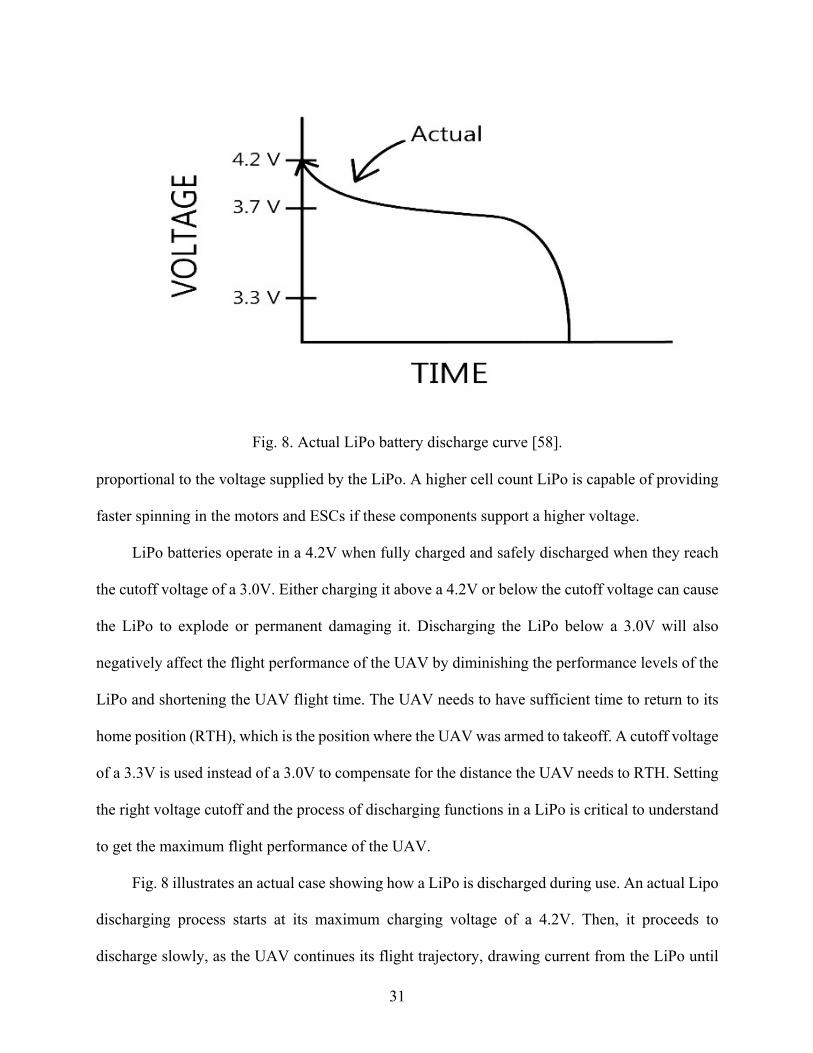
Fig. 8. Actual LiPo battery discharge curve [58].
proportional to the voltage supplied by the LiPo. A higher cell count LiPo is capable of providing
faster spinning in the motors and ESCs if these components support a higher voltage.
LiPo batteries operate in a 4.2V when fully charged and safely discharged when they reach
the cutoff voltage of a 3.0V. Either charging it above a 4.2V or below the cutoff voltage can cause
the LiPo to explode or permanent damaging it. Discharging the LiPo below a 3.0V will also
negatively affect the flight performance of the UAV by diminishing the performance levels of the
LiPo and shortening the UAV flight time. The UAV needs to have sufficient time to return to its
home position (RTH), which is the position where the UAV was armed to takeoff. A cutoff voltage
of a 3.3V is used instead of a 3.0V to compensate for the distance the UAV needs to RTH. Setting
the right voltage cutoff and the process of discharging functions in a LiPo is critical to understand
to get the maximum flight performance of the UAV.
Fig. 8 illustrates an actual case showing how a LiPo is discharged during use. An actual Lipo
discharging process starts at its maximum charging voltage of a 4.2V. Then, it proceeds to
discharge slowly, as the UAV continues its flight trajectory, drawing current from the LiPo until
31

reaching the cutoff point of a 3.3V, which is the safest level of discharging, as previously
explained. In Fig. 8, a cutoff voltage of a 3.3V is used, but not all LiPo batteries are manufactured
the same. Depending on the brand, each LiPo will need to be set at either a 3.0V or a 3.3V as the
cutoff value based on the manufacturer's datasheet or by performing actual flying tests of the UAV
to determine the value.
Another LiPo feature to understand is its capacity. From Fig. 7, capacity is indicated by the
value of 3000mAh or a 3 Amp Hours measured in Amp-hrs or milliamp-hrs. Larger values allow
the LiPo to have a more extensive capacity to store more of its total energy to last longer during a
flight. The 3000 mAh LiPo will take an hour to discharge from the maximum voltage to the cutoff
voltage. The 3 Amp Hours current is provided by the LiPo for one continuous hour if a constant
current of a 3 Amp is drawn for one hour, but it is not the actual case since LiPo batteries do not
discharge at a constant voltage rate, as depicted in Fig. 8.
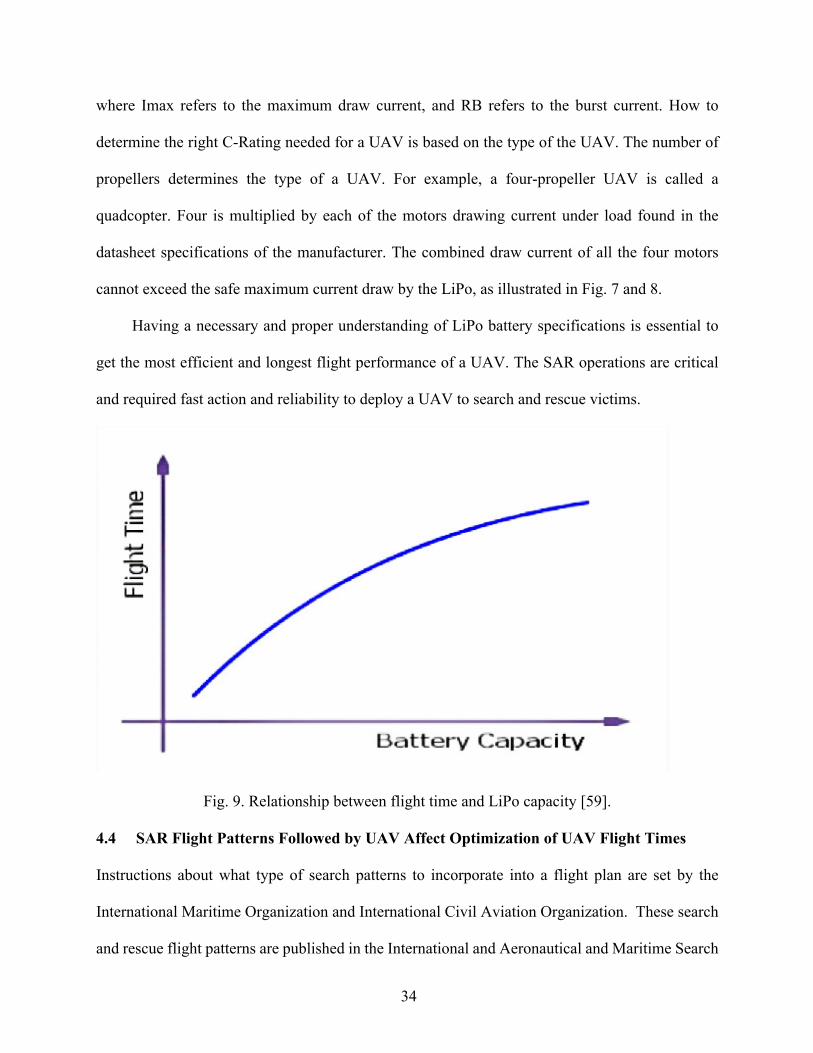
Increasing the capacity of the LiPo makes the LiPo heavier and larger, but a longer flight
time can be attained. This positive correlation is only accurate to the point at which the UAV flight
time becomes ineffective, as depicted in Fig. 9, e.g., and remains constant, even after the LiPo gets
larger and heavier. Choosing a larger LiPo capacity to increase the UAV flight time is not a
practical approach to follow most of the time. The procedure is only adding a more substantial
payload to the UAV. Consequently, the UAV will need to draw more current from the LiPo and
will reduce the amount of flying time. Calculating the estimated flight time of a LiPo can be done
by conducting flights under different conditions, e.g., windy condition and unusual flight pattern,
to get a sense of how much current the battery is drawing or checking the manufacturer’s datasheet
if it is reliable.
Another misconception about capacity is that if the discharged current is double from a 3
Amp Hours to a 6 Amp Hours, flight time, while keeping the cutoff voltage at a 3.3V, will be
32
reduced by half. This capacity only applies if the assumption is made that the UAV is drawing a
constant current from the LiPo based on a steady hover. However, in an actual case, the UAV
experiences different speeds at which the motors spin due to the wind speed. The UAV needs to
make the proper adjustment by using its stability sensors, which will pull current at a non-constant
rate. Consequently, the higher current draw will reduce the flight time by more than a half.
Depending on the LiPo, manufacturers provide datasheets of discharge curves. Most of them are
based on a constant draw current, as in this example of a 3 Amp Hours, for a continuous hour. To
make a better assessment of an estimated discharge rate is to test the aircraft under different
conditions to make sure how the aircraft will perform during a critical SAR operation beforehand.
Higher capacity also gives out higher discharge current, which is known as the C-rating. The
C-rating is another critical feature of a LiPo to understand. It relates to the maximum amount of
Amps a LiPo can safely deliver at a continuous and burst (maximum) discharge rating. In Fig. 7,
20C and 30C are shown, respectively. 20C represents the continuous discharge rating delivered
consistently by the LiPo while maintaining a stable dropping voltage. The safe maximum current
draw is calculated as:
𝐼𝐶 = 𝐶 𝑅𝐶 = 3000𝑚𝐴ℎ 20𝐶 = 60𝐴, (5)
where IC is the continuous current draw, C is the capacity of the battery, and RC denotes the C-
rating. The result of a 60A is the maximum continuous safe load handled by the LiPo. The other
value of a 30C is the burst current, and it is the maximum current a LiPo can push out for about
10 seconds under full throttle and dropping voltage rapidly. The burst current is defined as:
𝐼]R^ = 𝐶 𝑅𝐵 = 3000𝑚𝐴ℎ 30𝐶 = 90𝐴,
(6)
33
where Imax refers to the maximum draw current, and RB refers to the burst current. How to
determine the right C-Rating needed for a UAV is based on the type of the UAV. The number of
propellers determines the type of a UAV. For example, a four-propeller UAV is called a
quadcopter. Four is multiplied by each of the motors drawing current under load found in the
datasheet specifications of the manufacturer. The combined draw current of all the four motors
cannot exceed the safe maximum current draw by the LiPo, as illustrated in Fig. 7 and 8.
Having a necessary and proper understanding of LiPo battery specifications is essential to
get the most efficient and longest flight performance of a UAV. The SAR operations are critical
and required fast action and reliability to deploy a UAV to search and rescue victims.
Fig. 9. Relationship between flight time and LiPo capacity [59].
4.4 SAR Flight Patterns Followed by UAV Affect Optimization of UAV Flight Times
Instructions about what type of search patterns to incorporate into a flight plan are set by the
International Maritime Organization and International Civil Aviation Organization. These search
and rescue flight patterns are published in the International and Aeronautical and Maritime Search
34
and Rescue manual (IAMSR) [60]. As explained in the IAMSR manual, the search and rescue
flight plans have their own characteristics and conditions, under which they are best suited to
perform. One fundamental question for the task forces, specializing in search and rescue to
consider before deploying a UAV, is how to optimally plan the UAV flight path to achieve the
operational goals, considering the search area and sensors’ range limitations. In this section, the
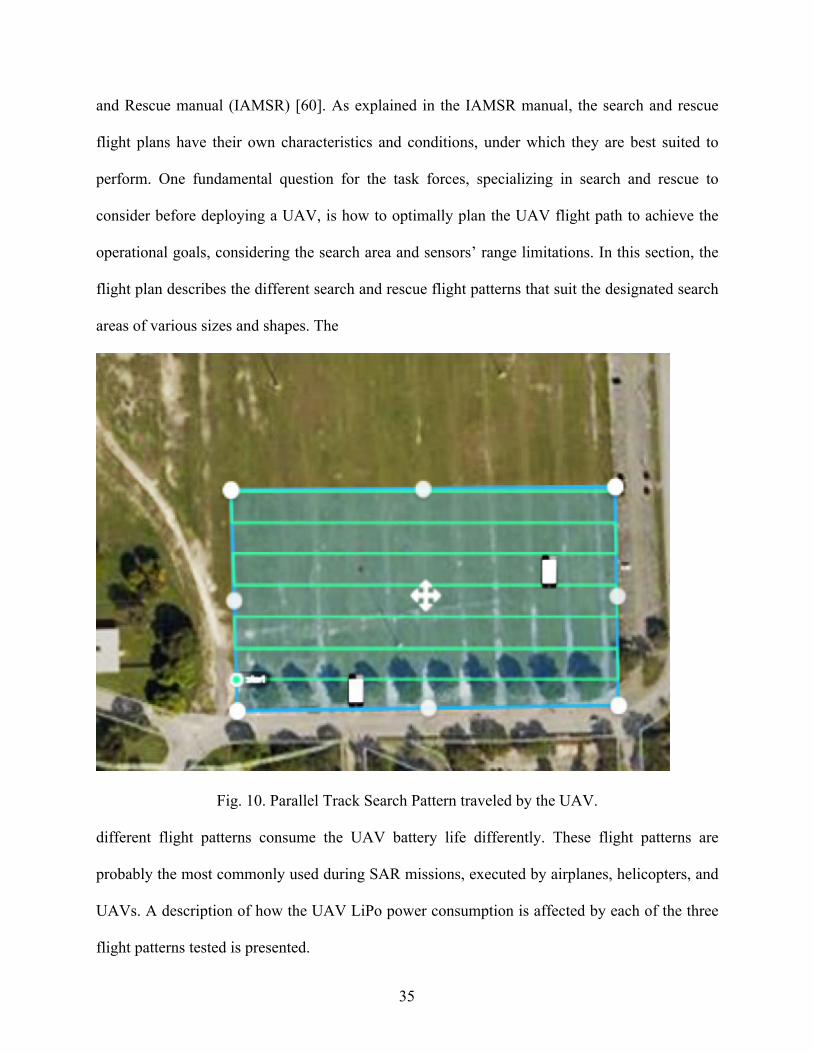
flight plan describes the different search and rescue flight patterns that suit the designated search
areas of various sizes and shapes. The
Fig. 10. Parallel Track Search Pattern traveled by the UAV.
different flight patterns consume the UAV battery life differently. These flight patterns are
probably the most commonly used during SAR missions, executed by airplanes, helicopters, and
UAVs. A description of how the UAV LiPo power consumption is affected by each of the three
flight patterns tested is presented.
35
4.4.1 Parallel Track Search Pattern (PTSP)
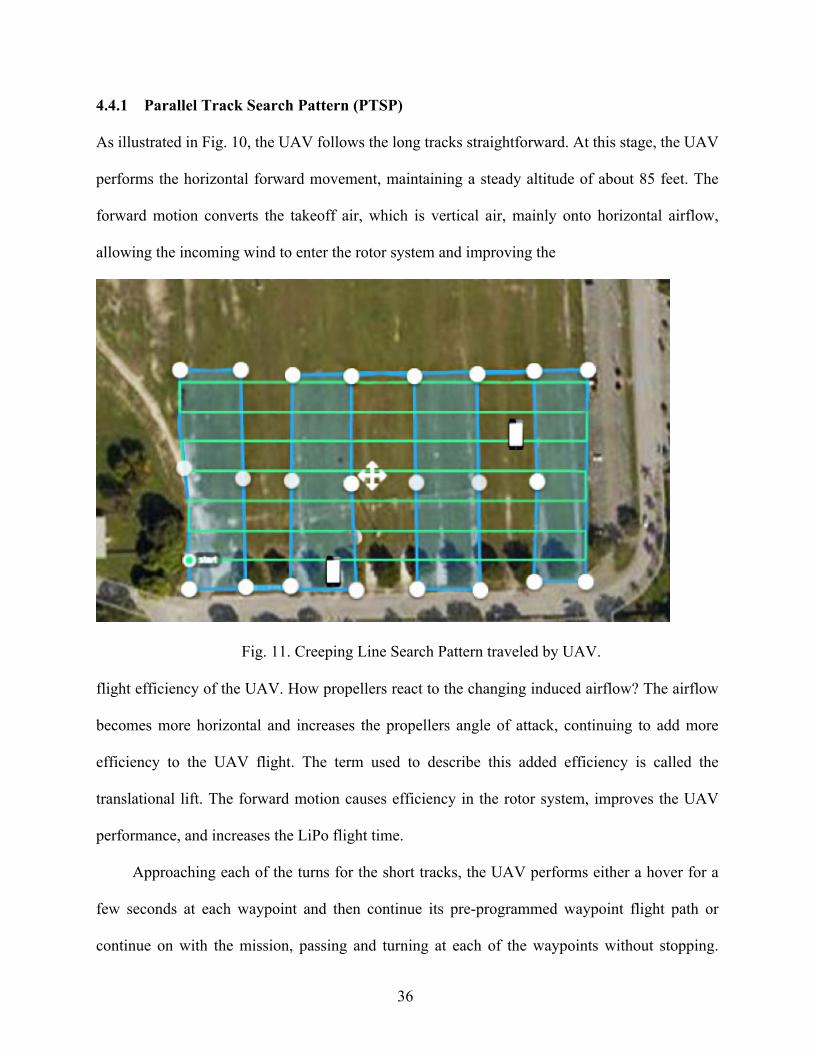
As illustrated in Fig. 10, the UAV follows the long tracks straightforward. At this stage, the UAV
performs the horizontal forward movement, maintaining a steady altitude of about 85 feet. The
forward motion converts the takeoff air, which is vertical air, mainly onto horizontal airflow,
allowing the incoming wind to enter the rotor system and improving the
Fig. 11. Creeping Line Search Pattern traveled by UAV.
flight efficiency of the UAV. How propellers react to the changing induced airflow? The airflow
becomes more horizontal and increases the propellers angle of attack, continuing to add more
efficiency to the UAV flight. The term used to describe this added efficiency is called the
translational lift. The forward motion causes efficiency in the rotor system, improves the UAV
performance, and increases the LiPo flight time.
Approaching each of the turns for the short tracks, the UAV performs either a hover for a
few seconds at each waypoint and then continue its pre-programmed waypoint flight path or
continue on with the mission, passing and turning at each of the waypoints without stopping.
36
Hovering at each waypoint is avoided since it requires the UAV to draw more current from the
LiPo to maintain its thrust stability. The UAV flight plan is to take advantage of translational lift
from the very takeoff to completing the Parallel Track Search Pattern at landing.
4.4.2 Creeping Line Search Pattern (CLSP)
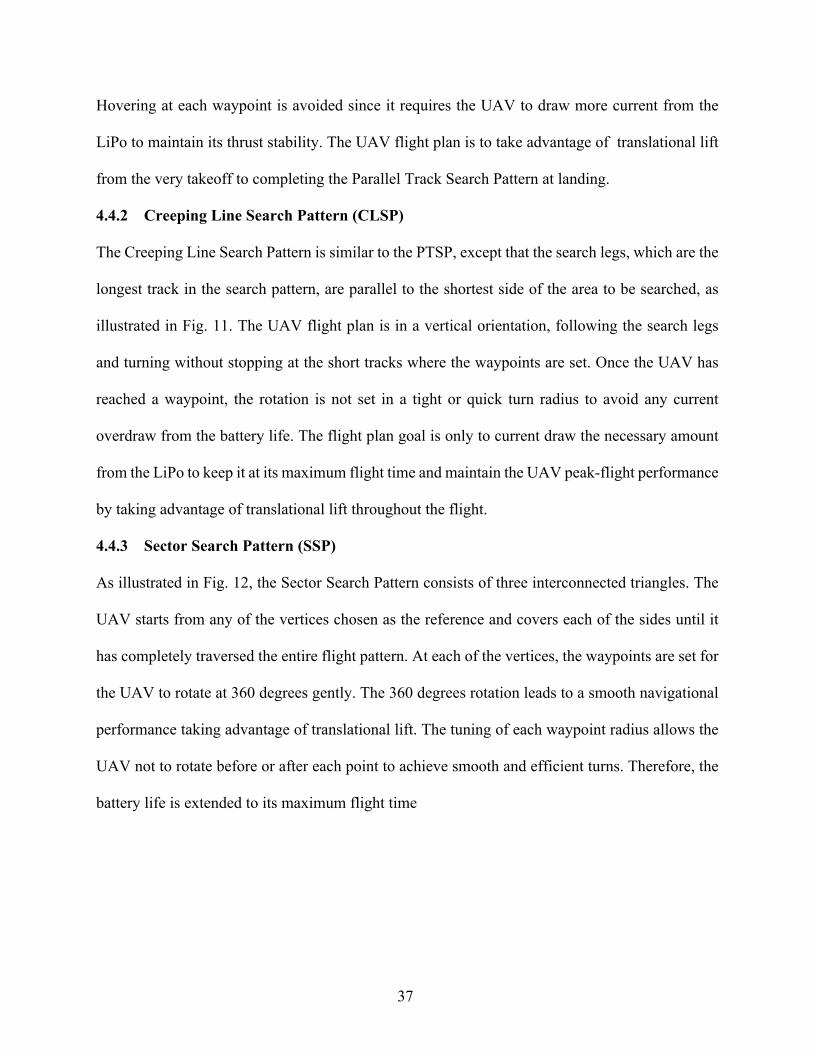
The Creeping Line Search Pattern is similar to the PTSP, except that the search legs, which are the
longest track in the search pattern, are parallel to the shortest side of the area to be searched, as
illustrated in Fig. 11. The UAV flight plan is in a vertical orientation, following the search legs
and turning without stopping at the short tracks where the waypoints are set. Once the UAV has
reached a waypoint, the rotation is not set in a tight or quick turn radius to avoid any current
overdraw from the battery life. The flight plan goal is only to current draw the necessary amount
from the LiPo to keep it at its maximum flight time and maintain the UAV peak-flight performance
by taking advantage of translational lift throughout the flight.
4.4.3 Sector Search Pattern (SSP)
As illustrated in Fig. 12, the Sector Search Pattern consists of three interconnected triangles. The
UAV starts from any of the vertices chosen as the reference and covers each of the sides until it
has completely traversed the entire flight pattern. At each of the vertices, the waypoints are set for
the UAV to rotate at 360 degrees gently. The 360 degrees rotation leads to a smooth navigational
performance taking advantage of translational lift. The tuning of each waypoint radius allows the
UAV not to rotate before or after each point to achieve smooth and efficient turns. Therefore, the
battery life is extended to its maximum flight time
37
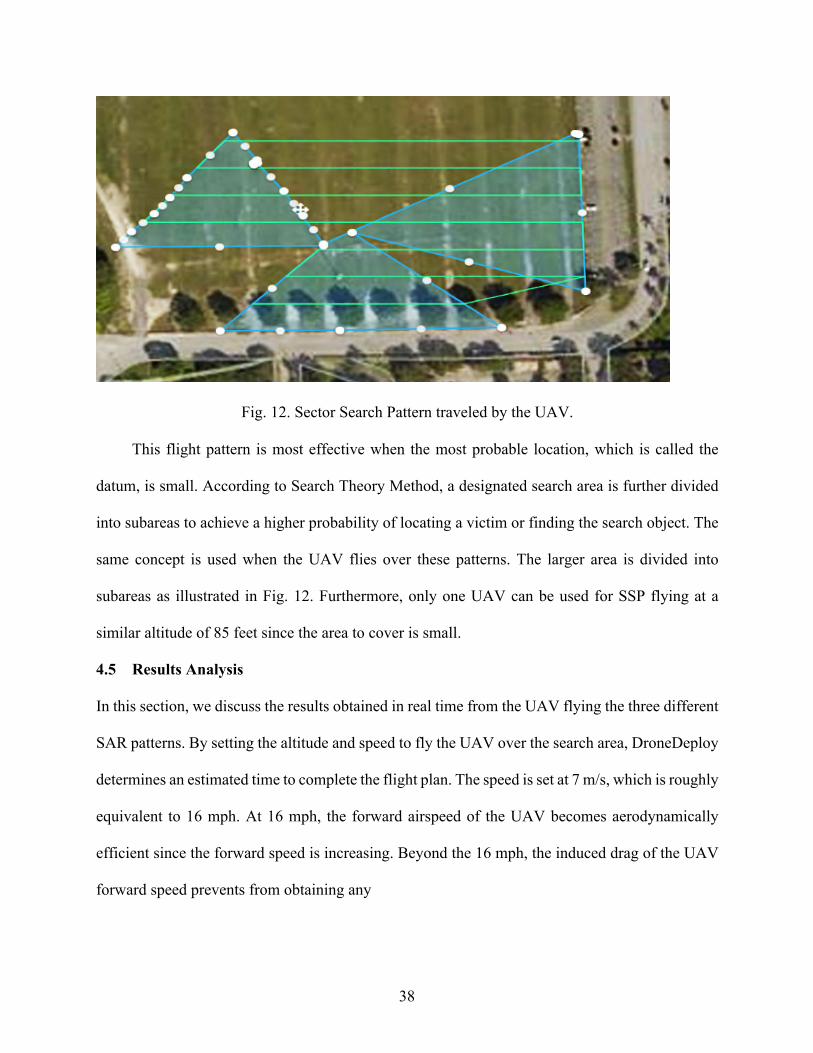
Fig. 12. Sector Search Pattern traveled by the UAV.
This flight pattern is most effective when the most probable location, which is called the
datum, is small. According to Search Theory Method, a designated search area is further divided
into subareas to achieve a higher probability of locating a victim or finding the search object. The
same concept is used when the UAV flies over these patterns. The larger area is divided into
subareas as illustrated in Fig. 12. Furthermore, only one UAV can be used for SSP flying at a
similar altitude of 85 feet since the area to cover is small.
4.5 Results Analysis
In this section, we discuss the results obtained in real time from the UAV flying the three different
SAR patterns. By setting the altitude and speed to fly the UAV over the search area, DroneDeploy
determines an estimated time to complete the flight plan. The speed is set at 7 m/s, which is roughly
equivalent to 16 mph. At 16 mph, the forward airspeed of the UAV becomes aerodynamically
efficient since the forward speed is increasing. Beyond the 16 mph, the induced drag of the UAV
forward speed prevents from obtaining any
38
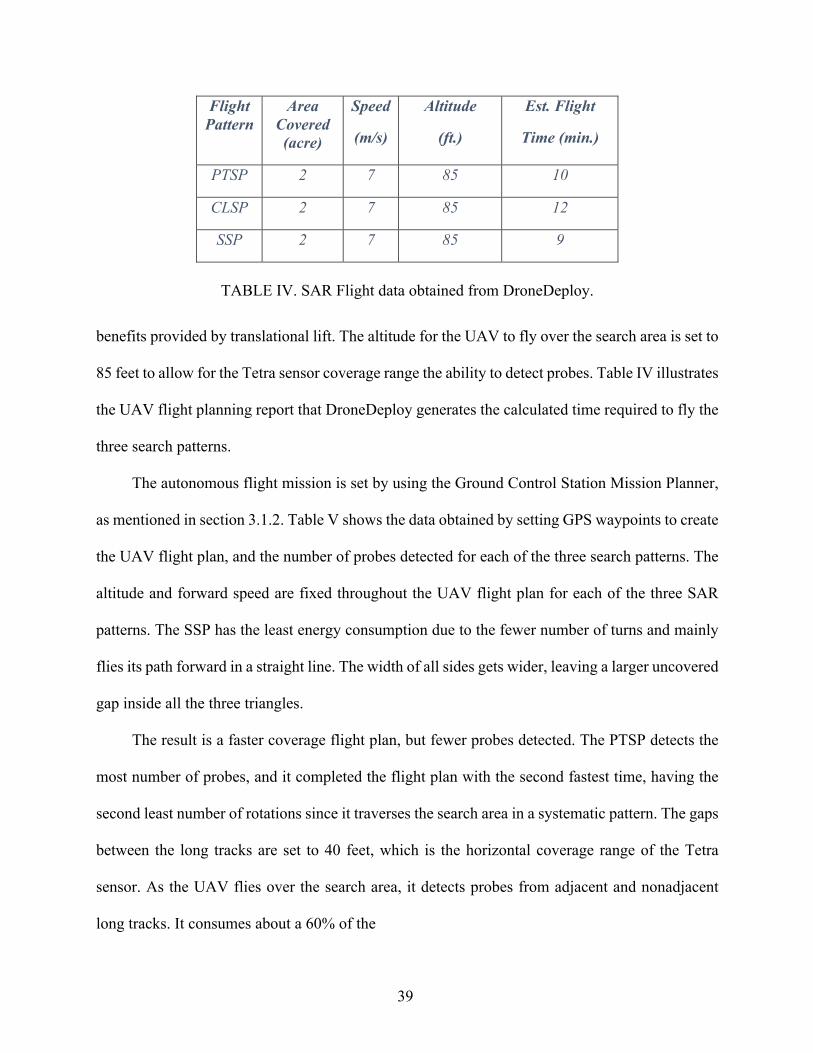
Flight Pattern
Area Covered (acre)
Speed
(m/s)
Altitude
(ft.)
Est. Flight
Time (min.)
PTSP 2 7 85 10
CLSP 2 7 85 12
SSP 2 7 85 9
TABLE IV. SAR Flight data obtained from DroneDeploy.
benefits provided by translational lift. The altitude for the UAV to fly over the search area is set to
85 feet to allow for the Tetra sensor coverage range the ability to detect probes. Table IV illustrates
the UAV flight planning report that DroneDeploy generates the calculated time required to fly the
three search patterns.
The autonomous flight mission is set by using the Ground Control Station Mission Planner,
as mentioned in section 3.1.2. Table V shows the data obtained by setting GPS waypoints to create
the UAV flight plan, and the number of probes detected for each of the three search patterns. The
altitude and forward speed are fixed throughout the UAV flight plan for each of the three SAR
patterns. The SSP has the least energy consumption due to the fewer number of turns and mainly
flies its path forward in a straight line. The width of all sides gets wider, leaving a larger uncovered
gap inside all the three triangles.
The result is a faster coverage flight plan, but fewer probes detected. The PTSP detects the
most number of probes, and it completed the flight plan with the second fastest time, having the
second least number of rotations since it traverses the search area in a systematic pattern. The gaps
between the long tracks are set to 40 feet, which is the horizontal coverage range of the Tetra
sensor. As the UAV flies over the search area, it detects probes from adjacent and nonadjacent
long tracks. It consumes about a 60% of the
39
Flight Pattern
Area Covered (acre)
Speed
(m/s)
Altitude
(ft.)
Time
(min.)
Lipo Cap.
Left (%)
Capt.
Probes
PTSP 2 7 85 12 40 45
CLSP 2 7 85 15 33 29
SSP 2 7 85 11 45 17
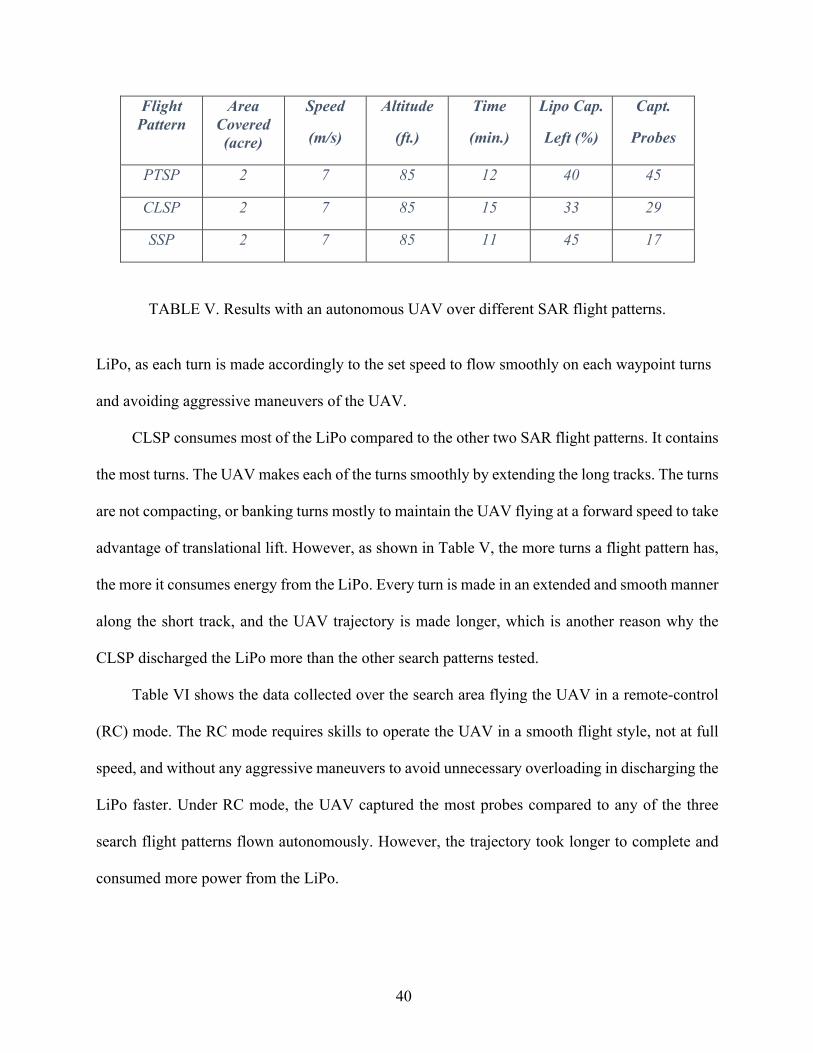
TABLE V. Results with an autonomous UAV over different SAR flight patterns.
LiPo, as each turn is made accordingly to the set speed to flow smoothly on each waypoint turns
and avoiding aggressive maneuvers of the UAV.
CLSP consumes most of the LiPo compared to the other two SAR flight patterns. It contains
the most turns. The UAV makes each of the turns smoothly by extending the long tracks. The turns
are not compacting, or banking turns mostly to maintain the UAV flying at a forward speed to take
advantage of translational lift. However, as shown in Table V, the more turns a flight pattern has,
the more it consumes energy from the LiPo. Every turn is made in an extended and smooth manner
along the short track, and the UAV trajectory is made longer, which is another reason why the
CLSP discharged the LiPo more than the other search patterns tested.
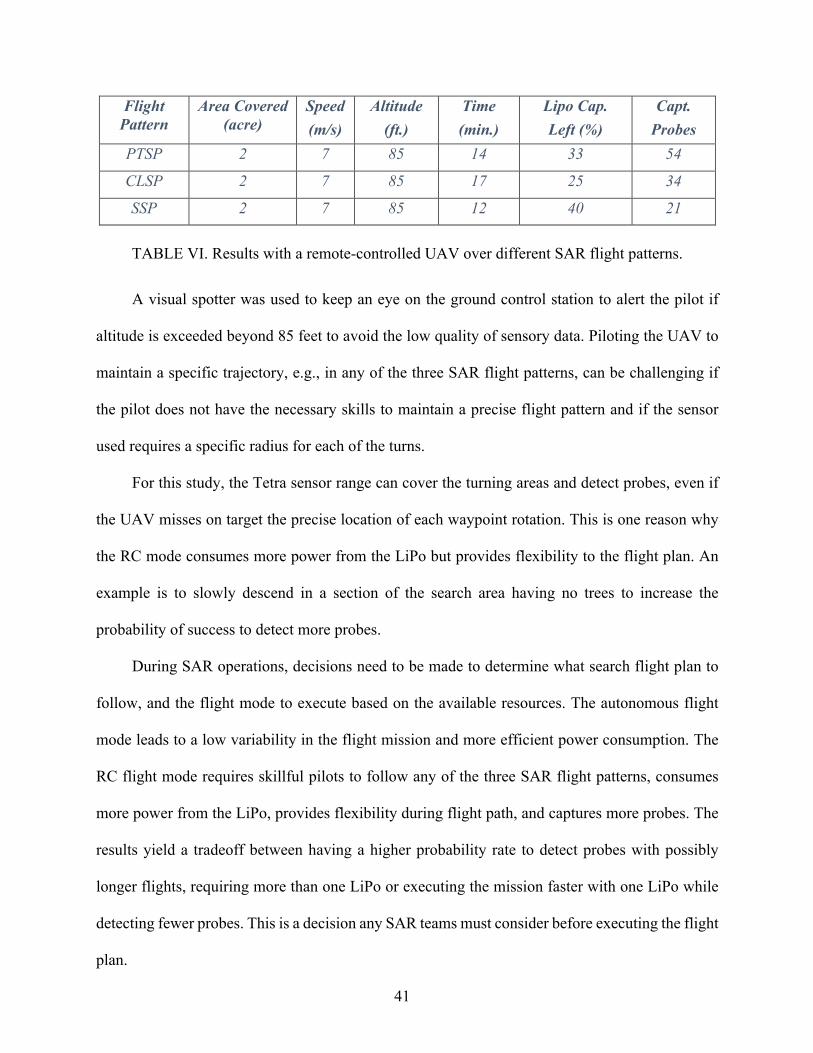
Table VI shows the data collected over the search area flying the UAV in a remote-control
(RC) mode. The RC mode requires skills to operate the UAV in a smooth flight style, not at full
speed, and without any aggressive maneuvers to avoid unnecessary overloading in discharging the
LiPo faster. Under RC mode, the UAV captured the most probes compared to any of the three
search flight patterns flown autonomously. However, the trajectory took longer to complete and
consumed more power from the LiPo.
40
Flight Pattern
Area Covered (acre)
Speed (m/s)
Altitude (ft.)
Time (min.)
Lipo Cap. Left (%)
Capt. Probes
PTSP 2 7 85 14 33 54
CLSP 2 7 85 17 25 34
SSP 2 7 85 12 40 21
TABLE VI. Results with a remote-controlled UAV over different SAR flight patterns.
A visual spotter was used to keep an eye on the ground control station to alert the pilot if
altitude is exceeded beyond 85 feet to avoid the low quality of sensory data. Piloting the UAV to
maintain a specific trajectory, e.g., in any of the three SAR flight patterns, can be challenging if
the pilot does not have the necessary skills to maintain a precise flight pattern and if the sensor
used requires a specific radius for each of the turns.
For this study, the Tetra sensor range can cover the turning areas and detect probes, even if
the UAV misses on target the precise location of each waypoint rotation. This is one reason why
the RC mode consumes more power from the LiPo but provides flexibility to the flight plan. An
example is to slowly descend in a section of the search area having no trees to increase the
probability of success to detect more probes.
During SAR operations, decisions need to be made to determine what search flight plan to
follow, and the flight mode to execute based on the available resources. The autonomous flight
mode leads to a low variability in the flight mission and more efficient power consumption. The
RC flight mode requires skillful pilots to follow any of the three SAR flight patterns, consumes
more power from the LiPo, provides flexibility during flight path, and captures more probes. The
results yield a tradeoff between having a higher probability rate to detect probes with possibly
longer flights, requiring more than one LiPo or executing the mission faster with one LiPo while
detecting fewer probes. This is a decision any SAR teams must consider before executing the flight
plan.
41
CHAPTER V
Concluding Remarks
In this thesis, WiFi probe requests are captured from various cell phones using a Wi-Fi Pineapple
mounted onto the UAV. Subsequently, using the information extracted from the probe requests
captured, the RFA machine learning technique is used to find a coarse estimate (a predefined zone)
for the Wi-Fi device’s whereabouts. The experimental results demonstrate an accuracy of a 81.8%
for finding the true zone location of a Wi-Fi device. The proposed approach is suited for search
and rescue operations where a given area (e.g., different zones in a national forest) can be initially
trained using the RFA method. Then, if a victim needs to be localized, the proposed method can
be applied to find the zone where he/she is located. Our future work includes testing and training
larger sets of data to evaluate the scalability of our proposed approach in larger geographical areas.
Then, the use of UAVs in SAR operations is presented to show its reliable support services.
Vital issues to address and to understand before a UAV is deployed to conduct search and rescue
missions are crucial to achieving a high probability of a successful SAR operation. Some other
issues are aspects that affect the navigational performance of a UAV, how to bypass some of the
flight time limitations of a UAV, and how the sensory operations are affected by the search flight
patterns flown by the UAV. The results demonstrate the importance of correctly configuring the
UAV to obtain the best possible flight performance and the longest flight time. Furthermore,
knowing the flight plan to execute, the UAV can detect more Wi-Fi probe requests, which are
crucial to respond quickly and increase the probability of having more accurate data to locate the
victims.
42
[1] X. Ma, Q.-Y. Huang, and X.-M. Shu, “A New Localization Algorithm of Mobile Phone for Outdoor Emergency Rescue,” in Proc. IEEE Int. Conf. Intelligent Syst. Des. Eng. Appl. (ISDEA), Jan. 2013, pp. 124–127. [2] Q. Hamp, R. Zhang, L. Chen, O. Gorgis, T. Ostertag, M. Loschonsky, and L. Reindl, “New technologies for the search of trapped victims,” Ad Hoc Networks, vol. 13, pp. 69–82, 2014. [3] A. Merwaday and I. Guvenc, “UAV assisted heterogeneous networks for public safety communications,” in Proc. IEEE Wireless Commun. Netw. Conf. Workshops (WCNCW), Mar. 2015, pp. 329–334. [4] E. K. Hung and D. A. Townes, “Search and rescue in Yosemite National Park: a 10-year review,” Wilderness & environmental medicine, vol. 18, no. 2, pp. 111–116, 2007. [5] J. R. Kiran, “Design and implementation of mobile aerial nodes,” Ph.D. dissertation, Birla Inst. Technol. and Science, Pilani, 2013. [6] A. Kumbhar, F. Koohifar, I. Guvenc, and B. Mueller, “A Survey on Legacy and Emerging Technologies for Public Safety Communications,” IEEE Commun. Surveys Tuts., 2016. [7] A. Birk, B. Wiggerich, H. B. Low, M. Pfingsthorn, and S. Schwertfeger, “Safety, Security, and Rescue Missions with an Unmanned Aerial Vehicle (UAV),” Journal of Intelligent & Robotic Systems, vol. 64, no. 1, pp. 57–76, 2011. [8] E. Vattapparamban, I. Guvenc, A. Yurekli, K. Akkaya, and S. Uluagac, “,” in Proc. IEEE Int. Wireless Commun. Mobile Comp. Conf. (IWCMC), Paphos, Cyprus, Sep. 2016. [9] S. Waharte and N. Trigoni, “Supporting search and rescue operations with UAVs,” in Proc. IEEE Int. Conf. Emerging Security Tech.(EST), 2010, pp. 142–147. [10] P. Rudol and P. Doherty, “Human body detection and geolocalization for UAV search and rescue missions using color and thermal imagery,” in Proc. IEEE Aerospace Conf., Mar. 2008, pp. 1–8. [11] P. Doherty and P. Rudol, “A UAV search and rescue scenario with human body detection and geolocalization,” in Australasian Joint Conf. Artificial Intelligence, Dec. 2007, pp. 1–13. [12] M. Carpin, S. Rosati, M. E. Khan, and B. Rimoldi, “UAVs using Bayesian Optimization to Locate WiFi Devices,” Preprint arXiv:1510.03592, 2015. [13] J. Sundqvist, J. Ekskog, B. J. Dil, F. Gustafsson, J. Tordenlid, and M. Petterstedt, “Feasibility study on smartphone localization using mobile anchors in search and rescue operations,” in Proc. IEEE Int. Conf. Inform. Fusion (FUSION), Jul. 2016, pp. 1448–1453. [14] T. Hossmann, D. Schatzmann, P. Carta, and F. Legendre, “Twitter in disaster mode: smart probing for opportunistic peers,” in Proc. ACM Int. Workshop Mobile Opportunistic Netw., 2012, pp. 93–94. [15] Z. Liu, Y. Chen, B. Liu, C. Cao, and X. Fu, “HAWK: an unmanned mini-helicopter-based aerial wireless kit for localization,” IEEE Trans. Mobile Computing, vol. 13, no. 2, pp. 287–298, Feb. 2014. [16] H. Menouar, I. Guvenc, K. Akkaya, A. S. Uluagac, A. Kadri, and A. Tuncer, “UAV-Enabled Intelligent Transportation Systems for the Smart City: Applications and Challenges,” IEEE Commun. Mag., 2016. [17] T. Tomic, K. Schmid, P. Lutz, A. Domel, M. Kassecker, E. Mair, I. L. Grixa, F. Ruess, M. Suppa, and D. Burschka, “Toward a fully autonomous UAV: Research platform for indoor and outdoor urban search and rescue,” IEEE Robot. Autom. Mag., vol. 19, no. 3, pp. 46–56, Sept. 2012. [18] Z. Xu, K. Sandrasegaran, X. Kong, X. Zhu, J. Zhao, B. Hu, and C.-C. Lin, “Pedestrian monitoring system using Wi-Fi technology and RSSI based localization,” Int. J. Wireless & Mobile Netw., vol. 5, no. 4, pp. 17–34, Aug. 2013.
Bibliography
43

[19] E. Vattapparamban, B. S. C¸ iftler, ̇ I. Guvenc¸, K. Akkaya, and A. Kadri, ̈ “Indoor occupancy tracking in smart buildings using passive sniffing of probe requests,” in Proc. IEEE Int. Conf. Commun. Workshops (ICC), May 2016, pp. 38–44. [20] A. B. M. Musa and J. Eriksson, “Tracking Unmodified Smartphones Using Wi-Fi Monitors,” in Proc. ACM Conf. Embedded Netw. Sensor Syst., New York, NY, 2012, pp. 281–294. [21] Wi-fi pineapple by hak5. [Online]. Available: https://www.wifipineapple. com/ [22] Busybox. [Online]. Available: http://www.busybox.net/ [23] Hak5. (2013) Wi-Fi Pineapple Mark V. [Online]. Available: http: //hakshop.myshopify.com/products/wifi-pineapple [24] Mission Planner. [Online]. Available: http://planner.ardupilot.com/ [25] L. Breiman, “Random forests,” Machine Learning, vol. 45, pp. 5–32, 2001. [26] ——, “Bagging Predictors,” Machine Learning, vol. 24 no. 2, pp. 123– 140, 1996. [26] ——, “Bagging Predictors,” Machine Learning, vol. 24 no. 2, pp. 123– 140, 1996. [27] A. Matos, E. Silva, N. Cruz, J. C. Alves, D. Almeida, M. Pinto, A. Martins, J. Almeida, and D. Machado, “Development of an unmanned capsule for large-scale maritime search and rescue,” in Proceedings IEEE OCEANS, Sept. 2013, pp. 1–8. [28] S. Waharte and N. Trigoni, “Supporting search and rescue operations with UAVs,” in Proceedings Emerging Security Technologies (EST), Sept. 2010. [29] G. De Cubber, D. Daniela, S. Daniel, C. Keshav, S. Rui, and O. Stephane, “The eu-icarus project: Developing assistive robotic tools for search and rescue operations,” in Proc. 2013 IEEE International Symposium on Safety, Security, and Rescue Robotics (SSRR), Oct. 2013. [30] Turic, Dujmic, and Papic, “Two-stage segmentation of aerial images for search and rescue,” Information Technology and Control, vol. 39, pp. 138–145, 2010. [31] R. Bloss, “Unmanned Vehicles while becoming smaller and smarter are addressing new applications in medical, agriculture, in addition to military and security,” Industrial Robot: An International Journal, vol. 41, pp. 82–86, 2014. [32] P. Jesper, “Use of UAVs in the NGO world,” in CRS Conference ICT4 Development, March. 2014. [33] G. Lewis and J. Li, “Evaluating the use of a low-cost Unmanned Aerial Vehicle platform in acquiring digital imagery for emergency response,” Geomatics solutions for disaster management, pp. 117–133, 2007. [34] S. M. Adams and F. C.J., “A survey of Unmanned Aerial Vehicle (UAV) usage for imagery collection in disaster research and management,” in 9th Int. Workshop on Remote Sensing for Disaster Response, 2011. [35] T. Smedley. (2015) Drones new mission: saving lives in developing countries. [Online]. Available: https://www.theguardian.com/sustainable-business/2015/jan/09/ drones-tech-natural-disasters-medical-developing-countries [36] R. Hlund. (2017) Search and Rescue (SAR) using UAVs. [Online]. Available: http://smartplanes.se/search-and-rescue-sar-using-uavs/ [37] M. Quaritsch, R. Kuschnig, H. Hellwagner, and B. Rinner, “Fast aerial image acquisition and mosaicking for emergency response operations by collaborative UAVs,” in Int. Conf. on Inform. Syst. for Crisis Response and Manag., May 2011, p. 5. [38] S. Verykokou, A. Doulamis, and G. Athanasiou, “UAV-based 3d modeling of disaster scenes for urban search and rescue,” in Proc. IEEE Int. Conf. Imaging Systems and Techniques (IST), Nov. 2016.
44
[39] Pix4D. (2017) Drone mapping supports search & rescue operations during Colombia landslide. [Online]. Available: http://www.unmannedsystemstechnology.com/2017/05/ drone-mapping-supports-search-rescue-operations-colombia-landslide/ [40] A. Ferworn Ryerson, S. Herman, J. Tran, A. Ufkes, and R. Mcdonald, “Disaster scene reconstruction: modeling and simulating urban building collapse rubble within a game engine,” in Proc. Summer Computer Simulation, July 2013. [41] J. Sokalski, T. P. Breckon, and I. Cowling, “Automatic salient object detection in UAV imagery,” in Proc. Int.Conf. in UAV Systems, April 2010, pp. 11.1–11.12. [42] M. Goodrich, J. Cooper, J. Adams, C. Humphrey, R. Zeeman, and B. Buss, “Using a mini-UAV to support wilderness search and rescue: Practices for human-robot teaming,” in Proc. IEEE Int. Workshop on Safety, Security and Rescue Robotics, Sept. 2007, pp. 11.1–11.12. [43] S. Jingxuan, L. Boyang, J. Yifan, and W. Chih-Yung, “A camera-based target detection and positioning UAV system for search and rescue (SAR) purposes,” Sensors, vol. 16, no. 11, pp. 1–24, 2016. [44] T. Tomic, K. Schmid, P. Lutz, A. Domel, M. Kassecker, E. Mair, I. Grixa, F. Ruess, M. Suppa, and D. Burschka, “Toward a fully autonomous UAV: Research platform for indoor and outdoor urban search and rescue,” IEEE Robot, vol. 19, pp. 46–56, 2012. [45] T. Chien-Ming, C. Chi-Kin, E. Khaled, and K. Majid. (2017) Flight tour planning with recharging optimization for battery-operated autonomous drones. [Online]. Available: http://arxiv.org/abs/1703.10049 [46] B. Saha, C. Quach, and K. Goebel, “Optimizing battery life for electric UAVs using a Bayesian framework,” in Proc. IEEE Aerospace Conference, Mar. 2012, pp. 11.1–11.12. [47] D. Namiot and M. Sneps-Sneppe, “On the analysis of statistics of mobile visitors,” Automatic Control and Computer Sciences, vol. 48, pp. 150– 158, 2014. [48] A. Musa and J. Eriksson, “Tracking unmodified smartphones using WiFi monitors,” in Proc. ACM Conf. on Embedded Networked Sensor Systems (SenSys), Nov. 2012, pp. 281–294. [49] A. Di Luzio, A. Mei, and J. Stefa, “Mind Your Probes: DeAnonymization of Large Crowds Through Smartphone WiFi Probe Requests,” in Proc. IEEE INFOCOM , 2016. [50] Hak5. (2015) Wi-Fi Pineapple Tetra. [Online]. Available: https: //wifipineapple.com/pages/tetra [51] W. Wang, R. Joshi, A. Kulkarni, W. Kay Leong, and B. Leong, “Feasibility study of mobile phone WiFi detection in aerial search and rescue operations,” in Proc. ACM Asia-Pacific Workshop on Systems, July 2013. [52] Wireshark. [Online]. Available: https://www.wireshark.org/ [53] Work smarter with drone date. [Online]. Available: https://www. dronedeploy.com/ [54] FAA. (2017) Fly for Fun under the Special Rule for Model Aircraft. [Online]. Available: https://www.faa.gov/uas/getting started/fly for fun/ [55] S. Benkoski, M. Monticino, and J. Weisinger, “A survey of the search theory literature,” Naval Research Logistics, vol. 38, pp. 469–494, 1991. [56] H. Loewen. (2013) Isolating components from UAV vibration. [Online]. Available: https://www.micropilot.com/pdf/ isolating-components-uav-vibration.pdf [57] Batteries for UAVs. [Online]. Available: http://dronesarefun.com/BatteriesForUAV html. [58] LearningRC. (2017) RC LIPO BATTERY GUIDE: EXPLANATION, SAFETY, AND CARE. [Online]. Available: http://learningrc.com/ lipo-battery/ [59] O. Liang. (2017) HOW TO CHOOSE BATTERY CAPACITY FOR LONGER FLIGHT TIME. [Online]. Available: https://oscarliang.com/ how-to-choose-battery-for-quadcopter-multicopter/
45

[60] IMO/ICAO, International Aeronautical and Maritime Search and Rescue Manual. IAMSR, 2010. [61]V.Acuna,K.Kumbhar,E.Vattapparamban,F.Rajabli,and I.Guvenc,“LocalizationofWiFiDevicesUsingProbeRequestsCapturedatUnmannedAerialVehicles,” inProc. IEEEWirelessCommunicationsandNetworkingConf(WCNC),2017.
46