using volatile composition
TRANSCRIPT

molecules
Article
Differentiation of Fresh and Processed Fruit JuicesUsing Volatile Composition
Rosa Perestrelo 1,*, Catarina Silva 1 , Pedro Silva 1 , Sonia Medina 1 and José S. Câmara 1,2,*1 CQM–Centro de Química da Madeira, Universidade da Madeira, Campus da Penteada, 9020-105 Funchal,
Portugal; [email protected] (C.S.); [email protected] (P.S.); [email protected] (S.M.)2 Departamento de Química, Faculdade de Ciências Exatas e Engenharia, Universidade da Madeira;
Campus da Penteada, 9020-105 Funchal, Portugal* Correspondence: [email protected] (R.P.); [email protected] (J.S.C.); Tel.: +351-291705119 (R.P.); +351-291705112 (J.S.C.)
Received: 15 January 2019; Accepted: 6 March 2019; Published: 10 March 2019�����������������
Abstract: In the current study, a comprehensive approach based on headspace solid-phasemicroextraction (HS-SPME), combined with gas chromatography-quadrupole mass spectrometry(GC-qMS), was used to establish the volatile signature of fresh and processed fruit juices, obtainedfrom the same batch of grapes, red fruits, orange, pear, and apple. This is a powerful tool forevaluating the impact of the production process on the volatomic pattern of fruit juice. A total of 169volatile organic compounds (VOCs) belonging to different chemical groups were identified. Esters,carbonyl compounds, terpenoids, and alcohols are the major chemical groups in the investigated fruitjuices. However, their contribution to the total volatile profile varied. Special attention should bepaid to processed fruit juices to avoid the possible deleterious effects associated with the formationof furanic compounds (e.g., heat treatment), since their furanic content was significantly higherin comparison to that of fresh fruit juices. The knowledge obtained in the current study willallow for the introduction of modifications to the process involved in processing juice, which willimprove the organoleptic characteristics of processed juices, contributing to a better acceptance byconsumers. Furthermore, more assays should be performed to assess the effect of harvests, geography,and agronomy on the volatile profile of juices.
Keywords: volatile pattern; fresh juice; processed juice; HS-SPME; GC-MS
1. Introduction
A balanced diet that includes fruit benefits health. Fruit consumption may contribute to interferencewith cancer mechanisms, assist in ameliorating mutagenic, inflammatory, and neurodegenerativemechanisms, as well as contribute to some antimicrobial effects [1,2]. It represents a rich source ofvitamins (mainly vitamin C), pectin, fibers, organic acids, and secondary metabolites originatingpredominantly from plant metabolism, including volatile organic compounds (VOCs), phenoliccompounds, etc. [3,4]. Furthermore, most of the fruits are used in many foodstuffs, such as jams,liquors, wine, dairy products, and breakfast cereals [3].
The volatile profile of fruits is responsible for their aroma and is constituted by a complexmixture of hundreds of VOCs belonging to different chemical groups. These VOCs are dominatedby four biosynthetic classes: terpenoids, fatty acid derivatives, compounds with aromatic rings(derived from L-phenylalanine), and volatiles derived from amino acid metabolism (methyl-branchedalcohols, ketones, esters, sulfur containing and aromatic compounds) [5,6]. More than 300 VOCshave been identified in the aroma profile of apples [5], esters being the most dominant chemicalgroup detected in different apple cultivars. From this chemical group, 2-methyl butyl acetate, hexylacetate, butyl acetate, 2-methyl butanoate, ethyl butanoate, and ethyl methyl propanoate were the
Molecules 2019, 24, 974; doi:10.3390/molecules24050974 www.mdpi.com/journal/molecules

Molecules 2019, 24, 974 2 of 20
most important esters contributing to the characteristic apple aroma [6–9]. In pear fruit, esters werealso the most significant contributors to aroma [10], being methyl and hexyl esters of decadienoate,the character imparting compounds of the European pear [11]. Other esters, such as hexyl acetate,2-methylpropyl acetate, butyl acetate, and pentyl acetate, as well as butyl butanoate, ethyl hexanoatepossessed strong pear-like odors [12]. In addition, hexanal, 2-methylpropyl acetate, ethyl acetate,hexyl acetate, 3-methylbutyl-2-methyl butanoate, ethyl butanoate, and butanol were identified asimpact volatiles in Conference pears (Pyrus communis L.) [13]. Orange is a large cultivated fruit andstudied worldwide. A total of 58 VOCs, including esters, terpenoids, carbonyl compounds, alcohols,and acids were identified and quantified in Dortyol yerli orange juice. Terpenoids were the mostrepresentative chemical group, limonene being the predominant VOC, followed by valencene, linalool,terpinen-4-ol, and α-terpineol [14]. On the other hand, grapes (Vitis vinifera L.) volatiles include agreat number of VOCs, namely monoterpenoids, sesquiterpenoids, carbonyl compounds, alcohols,C13 norisoprenoids, and acids [15]. Linalool, geraniol, citronellol, nerol, dienol I and II were the mostabundant terpenoids in Muscat grape [16]. Other monoterpenes potentially contributing to Muscataroma were rose oxide, citral, geraniol, nerol, and citronellol [17]. The evolution of terpenic compoundswas evaluated during ripening of four V. vinifera L. grape varieties, Bual, Malvasia, Sercial (whitegrapes), and Tinta Negra (red grapes). Linalool, citronellol, geraniol, α-ylangene, bicyclogermacrene,β-ciclocitral, β-damascenone are common to all grape varieties studied and were detected in allripening stages, whereas others were found only in some ripening stages and in some varieties(e.g., β-ocimene isomer, β-gurjunene, γ-elemene). In addition, for all V. vinifera L. grapes studied,the maximum potential of mono-, sesquiterpenic, and norisoprenoid compounds was achieved atmaturity date, which was established based on the maximum sugar content and minimum titratableacidity [18]. Even at low levels, these VOCs may have a significant impact on the overall flavorof fruits and their corresponding juices due to their lower odor threshold (OT). The levels of theseVOCs are frequently low (typically µg/L) and are influenced by a number of agronomic (e.g., variety,climatological conditions, ripening stage) [19] and technological factors (e.g., harvest, post-harvesttreatments, storage and processing conditions) [20]. During fruit juice processing, the volatile signatureis affected by the addition of additives, preservatives, and chemical or processing treatments thatchange the volatile profile of fresh juices [21].
Temperatures between 85 and 95 ◦C are frequently used to extend the shelf life of fruit juicesHowever, it has been documented that the thermal process may activate the dormant ascospores ofmolds, which subsequently cause deterioration, hence resulting in economic loss [22]. Heat treatmentwith high temperature and long processing time is not recommended, due to quality reasons andconsumer demands for fresh-like fruits. To overcome this problem on fruit juice preservation,non-thermal methods, such as high-pressure processing (HPP), supercritical carbon dioxide technology(SCCD), and power ultrasound in combination with mild heat have been proposed. Yi et al. [23]evaluated the impact of HPP (600 MPa, 3 min) on apple (Pink Lady, Granny Smith, and Jonagold)juice quality changes and compared it to the thermal processing. The overall quality of HPP treatedapple juices was much more comparable to that of the fresh juice, in particular HPP results in loweramounts of thermally induced compounds that are related to cooked notes of pasteurized apple juices.Kebede et al. [24] investigated the volatile changes during the shelf life of pulsed electric fields (PEF)(15.5 kV/cm and specific energy of 158 kJ/L), HPP (600 MPa for 3 min), and thermally (72 ◦C for15 s) pasteurized Jazz apple juices, up to five weeks. The results showed that after pasteurization,PEF processing resulted in a better retention of odor active VOCs, such as 2-hexenal isomer and hexylacetate, whereas thermal processing lowered their amount. Gao et al. [25] evaluated the effects ofHPP (550 MPa/10 min) and high-temperature short time (HTST; 110 ◦C/8.6 s) on microorganisms,ascorbic acid, total phenols, antioxidant capacity, color, enzyme activity, and rheological behavior inred grapefruit juice during 30 days of storage at 4 ◦C. Evelyn et al. [26] showed that HPP pretreatmentenhanced the thermosonication inactivation of Alicyclobacillus acidoterrestris spores in orange juice,whereas Mastello et al. [27] evaluated the impact of HPP processing on the volatile profile and sensory

Molecules 2019, 24, 974 3 of 20
acceptance of Pêra-Rio orange juice. Moreover, several studies have demonstrated the efficiency ofSCCD processing in the preservation of juices such as orange, melon, kiwi, pear, and strawberry.The findings confirm the SCCD processing as a potential promising technology to the conventionalthermal treatment [28–30]. The assessment of the volatile signature of fruit juice is of great importance,since it enables researchers to help producers improve its quality, develop new products for the market,contribute to its economic valorization [27], as well as to assess the geographical origin, authenticity,and typicity of food matrices [31].
Several extractions and enrichment techniques, namely, liquid–liquid extraction (LLE) [32],simultaneous distillation extraction (SDE) [33], solid-phase trapping solvent extraction (SPTE) [33],solid-phase extraction (SPE) [34], pressurized-fluid extraction (PFE) [35], solid-phase microextraction(SPME) [3,33], and stir bar sorptive extraction (SBSE) [36] have been applied to establish the volatilesignature of food matrices. Nevertheless, microextraction techniques (METs) (e.g., SPME, SBSE)compared to conventional extraction techniques (e.g., LLE, SDE, SPE) offer several advantages, such asa reduction of the amount of organic solvent, the possibility of automation, high sensitivity andconcentration factors [37]. These METs, combined with analytical measurements, can be used to assessthe sensory properties, chemical composition, authenticity, and typicality of juices. The establishmentof the volatile signature, analysis of the nutritional composition, phenolic compounds, carotenoids,and some vitamins [3,38], in addition to sensory analysis using consumers and/or a trained tastepanel, or even using an instrumental taste sensing system, like the electronic tongue [39], are the mostwidely used techniques to assess the quality of fruit juices [40].
The main goal of this study was to establish and compare the volatile signature of fresh andprocessed fruit juices, obtained from the same batch of fruits, by means of headspace solid-phasemicroextraction (HS-SPME), combined with gas chromatography-quadrupole mass spectrometry(GC-qMS). In addition, the impact of processing on the volatile signature of juices from grapes(Vitis vinifera L.), wild red fruits (Fragaria x ananassa Duch., Vaccinium corymbosum L., Rubus idaeus L.),orange (Citrus sinensis L.), pear (Pyrus communis L.), and apple (Malus domestica Borkh.), as well as thecorresponding processed juices (from the same batch), was investigated. These comprehensive datawill allow the evaluation of the impact of processing on the volatile signature of fruit juices from thesame batch. As far as we know, this is the first time that different fruit juices corresponding to differentfruit species were analyzed simultaneously using the same analytical technique, therefore enabling usto describe both the volatile profile in the juice and the variability in the volatile profile between freshand processed fruit juices. The obtained results may help to enlarge the database on the volatile andaroma composition of fresh and processed fruit juices, as well as provide a useful platform to improvethe organoleptic characteristics of the processed juices and consequently contribute to their economicvalorization and improve their acceptance by consumers.
2. Results and Discussion
2.1. Volatomic Signature of Fresh and Processed Fruit Juices
A comprehensive untargeted analysis of the volatile signature of fresh and processed fruit juices,obtained from the same batch of fruits, was performed using HS-SPME/GC-qMS. The data wereprocessed using software (NIST, 2005; Mass Spectral Search Program V.2.0d, Agilent, Washington,USA), that provides quality matching using advanced spectral matching algorithms backgroundsubtraction and kovats index (KI) comparison. Figure 1 shows a typical total ion chromatogram (TIC)of fresh (top) and processed (bottom) pear juices obtained by HS-SPME/GC-qMS. Great differencesamong the patterns of the VOCs from fresh and processed pear juices were observed. On average,125 VOCs were identified in the headspace of the investigated processed fruit juices (108 in grape,117 in red fruits, 97 in orange, 123 in pear, and 124 in apple juice), whereas the volatile signature offresh juices was less complex, with 111 VOCs identified (84 in grape juice, 111 in red fruits, 98 inorange, 108 in pear, and 109 in apple juices) (Figure S1, Supplementary Materials). The identified VOCs

Molecules 2019, 24, 974 4 of 20
belonged to distinct chemical groups, including terpenoids (57), esters (56), carbonyl compounds(33), alcohols (16), acids (3), volatile phenols (2), and furanic compounds (2) (Table 1). Moreover,some differences were also observed in both the qualitative and semi-quantitative (GC peak area)expressions. Table 1 shows the KI determined with a BP20 column, as well as the KI reported in thescientific literature with equivalent columns, was used to confirm the identity of VOCs. Thirty-sixof the identified VOCs were common to all the fresh and processed juices investigated (Table S1,Supplementary Materials). On the other hand, some VOCs were detected in specific juices, such as3-methylbutanal in grape juice, hexyl butanoate and rose oxide isomer in red fruit juices, p-cymene,safranal, and carvone in orange juice, ethyl pentanoate and geranyl valerate in apple juice, and geranialin pear juice.
Molecules 2019, 24, x FOR PEER REVIEW 4 of 22
investigated (Table S1, Supplementary Material). On the other hand, some VOCs were detected in specific juices, such as 3-methylbutanal in grape juice, hexyl butanoate and rose oxide isomer in red fruit juices, p-cymene, safranal, and carvone in orange juice, ethyl pentanoate and geranyl valerate in apple juice, and geranial in pear juice.
Figure 1. Total ion chromatograms obtained by the headspace solid-phase microextraction (HS-SPME)DVB/CAR/PDMS/gas chromatography-quadrupole mass spectrometry (GC-qMS) analysis of fresh and processed pear juice (for the identification of peak numbers, see Table 1).
The distribution of the chemical groups, according to the production process of juices, is shown in Figure 2. Esters, carbonyl compounds, terpenoids, and alcohols are the predominant chemical groups detected in fruit juices. However, significant differences were observed among these chemical groups, according to the production process and fruit variety. The esters were the predominant chemical group in all of the investigated fruit juices (55.2%, on average), except for orange and grape juices, which account for 23.6 and 26.0% of the total volatile profile of the fresh juices, and 20.9 and 18.5% of that of processed juices, respectively. However, the GC total peak areas of esters were, on average, 1.1 and 1.4 times higher in fresh apple juices than the corresponding processed juices. Hexyl acetate was the most abundant ester identified in red fruits, pear, and apple juices, irrespective of the type of juice (Tables 1 and S2).
In orange and grape juices, terpenoids was the most predominant chemical group, accounting for 53.0 and 32.9% of the total volatile composition of fresh juices, and 51.2 and 21.4% of that of processed juices, respectively. While the number of identified terpenoids in orange, pear, and apple juices was similar, its GC peak area in fresh and processed orange juices was three and four times higher than observed in fresh and processed juices from pear and apple, respectively. This trend is
134 151Abundance (× 106) Fresh
Processed
RT (min)
2.6
2.2
1.8
1.4
1.0
0.6
0.2
2.6
2.2
1.8
1.4
1.0
0.6
0.2
10.0 20.0 30.0 40.0 50.0 60.0 70.0 80.0
1
3 6
8
19
27
31 38 44
59
61
79
108 141
159
149124
86
77
34 51
44196
3
1
31
27
26
26
38
59
57
57
61
77
7986
90
90
108
124
134
141151
159
149
Figure 1. Total ion chromatograms obtained by the headspace solid-phase microextraction(HS-SPME)DVB/CAR/PDMS/gas chromatography-quadrupole mass spectrometry (GC-qMS) analysis offresh and processed pear juice (for the identification of peak numbers, see Table 1).
The distribution of the chemical groups, according to the production process of juices, is shown inFigure 2. Esters, carbonyl compounds, terpenoids, and alcohols are the predominant chemical groupsdetected in fruit juices. However, significant differences were observed among these chemical groups,according to the production process and fruit variety. The esters were the predominant chemical groupin all of the investigated fruit juices (55.2%, on average), except for orange and grape juices, whichaccount for 23.6 and 26.0% of the total volatile profile of the fresh juices, and 20.9 and 18.5% of that ofprocessed juices, respectively. However, the GC total peak areas of esters were, on average, 1.1 and 1.4times higher in fresh apple juices than the corresponding processed juices. Hexyl acetate was the mostabundant ester identified in red fruits, pear, and apple juices, irrespective of the type of juice (Table 1and Table S2).

Molecules 2019, 24, 974 5 of 20
Table 1. GC peak area (×106) of volatile organic compounds (VOCs) identified in fresh and processed fruit juices.
Peakn◦
RT(min) 1 KICal
2 KILit3 Chemical Groups
GC Peak Area (×106) (RSD)
Grape Red Fruits Orange Pear Apple
Fresh Processed Fresh Processed Fresh Processed Fresh Processed Fresh Processed
Esters1 5.67 897 864 Methyl acetate 11.18 (2) 2.17 (5) 29.89 (7) 16.76 (8) 1.23 (2) 1.98 (5) 23.94 (16) 21.71 (13) 1.98 (19) 2.58 (8)3 6.59 925 907 Ethyl acetate 4 51.31 (3) 12.45 (5) 4.58 (6) 14.56 (15) 7.83 (11) 3.08 (15) 222.09 (13) 257.16 (10) 144.12 (8) 131.55 (16)7 8.38 969 950 Ethyl propanoate 4 7.97 (6) 26.03 (5) 10.21 (4) 23.32 (7) - - - - 28.73 (6) 7.32 (12)8 8.95 981 969 Propyl acetate 4 5.66 (6) 0.70 (9) - - - - 9.82 (5) 35.95 (1) 0.76 (18) 17.32 (1)
10 9.29 988 982 Methyl butanoate - - 94.87 (12) 46.71 (8) 1.27 a (3) 1.45 a (1) - - 6.14 (4) 1.51 (13)11 10.17 992 1007 Methyl 2-methylbutanoate 12.72 (11) 1.48 (13) 1.06 (3) - - - 2.15 (3) 4.52 (16) 10.32 (9) 12.34 (5)13 10.53 1002 1015 Methyl 3-methylbutanoate - - 13.65 (3) 17.86 (6) - - 3.20 (1) 5.41 (9) - -15 11.33 1024 1028 Ethyl butanoate 4 17.95 (6) 6.42 (3) 30.48 (8) 18.24 (8) 64.68 (10) 62.50 (5) - - 10.08 (6) 1.94 (8)16 12.08 1043 1050 Ethyl 2-methylbutanoate - - 1.72 (18) 42.60 (5) 2.35 (12) 1.94 (9) - - 21.85 (9) 2.19 (15)18 12.75 1059 1060 Ethyl 3-methylbutanoate - 10.39 (4) - - 1.25 (4) 2.16 (6) - - - 40.51 (2)19 13.02 1065 1075 Butyl acetate 4 2.18 (11) 2.34 (17) 67.76 (2) 56.12 (4) - - 21.32 (4) 16.93 (6) 132.24 (13) 221.32 (8)22 15.40 1115 1117 3-Methylbutanol acetate 4 10.03 (13) 0.88 (11) 19.70 (7) 5.20 (15) - - 6.55 (12) 19.26 (14) 617.98 (12) 745.10 (8)25 16.18 1130 1120 Ethyl pentanoate - - - - - - - - 6.03 (13) 11.65 (5)26 16.51 1136 1120 Butyl propanoate - - 6.05 (14) 1.46 (7) 11.25 (3) 26.43 (3) 22.63 (1) 40.01 (9) 33.36 (18) 49.34 (4)28 17.65 1156 1160 Propyl propanoate - - 5.51 (7) 10.41 (9) 14.16 (4) 66.78 (6) 0.65 (13) 1.97 (6) 1.18 (9) 7.71 (6)30 17.88 1159 1152 Ethyl 2-butenoate 6.73 (10) 0.52 (13) - - 15.49 (14) 27.52 (2) - - 3.26 (3) -31 18.52 1170 1147 Pentyl acetate 7.25 (8) 0.78 (11) 2.78 (8) 5.89 (3) - - 16.30 (9) 2.02 (9) 13.85 (14) 1.90 (6)34 19.28 1182 1188 Methyl hexanoate - - 564.99 (7) 430.05 (7) - - - 158.81 (3) 13.23 (8) 28.72 (9)40 22.23 1229 1228 Propyl butanoate 4.59 (6) 0.74 (15) - - - - - 48.35 (7) - 10.56 (15)41 22.36 1231 1220 Ethyl hexanoate 4 27.68 (11) 1.19 (5) 77.27 (13) 82.60 (15) 23.42 (7) 52.65 (15) 1.82 (16) 6.00 (9) 34.09 (7) 2.50 (1)44 24.85 1269 1270 Hexyl acetate 4 31.63 (4) 12.66 (12) 356.35 (8) 233.56 (5) 53.36 (9) 39.23 (2) 676.33 (6) 368.37 (1) 193.62 (10) 109.58 (5)49 26.85 1296 1292 Ethyl 3-hexenoate 4 - - 3.06 (12) 1.28 (2) - - 2.09 (14) 4.47 (5) 1.01 (14) -50 27.11 1300 1305 Ethyl 2-hexenoate 2.58 (9) 1.14 (12) 3.25 (5) 8.77 (4) - - 11.41 (5) 3.99 (8) 0.98 (5) 3.36 (8)51 27.51 1306 1304 Ethyl 3-ethoxypropanoate - - - - - - - 22.33 (5) 4.02 (15) -52 27.76 1310 1328 3-Hexen-1-ol acetate isomer 4.27 (3) 3.36 (3) 36.28 (2) 142.79 (2) - - 5.91 (14) 9.81 (7) 78.43 (14) 56.48 (5)54 28.31 1319 1327 2-Hexen-1-ol acetate isomer - 0.25 (12) 5.57 (7) 4.12 (1) - - 27.12 (9) 11.09 (8) 3.32 (17) 2.88 (6)56 29.10 1332 1332 Hexyl propanoate - 0.76 (11) 26.11 (4) 7.36 (11) - - 6.93 (19) 3.66 (7) 4.42 (12) 4.52 (12)57 29.37 1336 1305 Ethyl 2-hexenoate 3.12 (5) 8.58 (13) 0.39 (6) 2.53 (4) 2.01 (5) 5.47 (8) 1.52 (17) 2.24 (7) 6.87 (16) 3.75 (1)61 31.36 1366 1359 Heptyl acetate 5.91 (12) 0.33 (9) - - 12.28 (8) 23.95 (7) 20.09 (14) 6.38 (4) 1.26 (7) 30.99 (3)64 32.35 1380 1389 Methyl octanoate - - 10.17 (15) 5.98 (2) - - 0.93 (13) 1.76 (15) - -68 33.66 1398 1391 Butyl methylbutanoate - - 21.27 (12) 7.13 (1) 2.61 (3) 1.33 (2) 21.82 (4) 9.65 (11) - -69 33.99 1404 1394 Ethyl 2-hydroxyisovalerate - - 36.49 (10) 10.24 (2) 2.66 (17) 2.25 (6) 29.38 (12) 7.58 (18) 7.22 (13) 3.23 (6)71 35.22 1425 1436 Ethyl octanoate 4 3.97 (4) 2.61 (4) 4.11 (7) 4.39 (14) 72.42 (12) 42.25 (4) 16.89 (16) 16.83 (17) 47.25 (4) 53.46 (11)78 37.64 1465 1441 Isopentyl hexanoate - - - - - 18.74 (2) - - - 6.28 (9)79 37.81 1468 1483 Ethyl 3-hydroxybutanoate 4 - - 181.49 (8) 67.28 (15) 220.28 (7) 154.85 (5) 46.42 (9) 20.54 (16) 7.41 (15) 1.67 (16)89 41.82 1532 1533 Hexyl butanoate - - 12.44 (14) 7.26 (4) - - - - - -100 45.96 1597 1591 Methyl decanoate - 0.38 (4) 6.96 (10) 25.22 (5) - - 8.15 (18) 5.16 (10) 17.67 (8) 1.84 (15)104 47.59 1624 1610 Butyl octanoate - 0.54 (5) - 7.06 (18) - - - 0.98 (7) - 9.51 (14)108 48.69 1643 1636 Ethyl decanoate 4 - - 102.43 (12) 84.04 (8) - - 60.17 (19) 6.74 (15) 6.79 (12) 19.02 (13)110 49.08 1650 1648 Ethyl benzoate 4 2.14 (3) 1.99 (2) - 1.68 (2) - - - 2.04 (1) 2.39 (7) 0.97 (1)112 49.54 1657 1664 Ethyl 3-hydroxyhexanoate 4 - - 5.45 (17) 40.42 (5) 6.28 (4) 27.82 (12) 1.93 (7) 58.21 (9) 5.41 (16) 7.43 (9)

Molecules 2019, 24, 974 6 of 20
Table 1. Cont.
Peakn◦
RT(min) 1 KICal
2 KILit3 Chemical Groups
GC Peak Area (×106) (RSD)
Grape Red Fruits Orange Pear Apple
Fresh Processed Fresh Processed Fresh Processed Fresh Processed Fresh Processed
116 51.36 1687 1683 Benzyl butanoate 18.43 (7) 2.27 (9) 2.01 (14) - - - - - 17.49 (8) 2.58 (13)117 52.22 1700 1689 Diethyl succinate 4 - 1.04 (14) 3.19 (14) - - - - - 1.48 (11) -120 52.69 1708 1694 Ethyl 9-decenoate 6.83 (7) 1.03 (4) 66.22 (18) 204.61 (5) 184.42 (9) 93.89 (8) 4.33 (3) 10.33 (7) 190.78 (7) 74.42 (9)130 55.09 1747 1745 Methyl salicylate 4 53.55 (4) 27.22 (5) 3.86 (12) 1.97 (3) - 4.59 (10) - 1.59 (5) - 0.78 (9)134 56.42 1768 1729 3-Hexenyl hexanoate - - 0.68 (19) 2.06 (5) 6.97 (2) 3.53 (10) 20.76 (16) 1.23 (2) 3.25 (8) 4.63 (14)137 57.41 1783 1803 2-Phenylethyl acetate 4 27.70 (7) 2.12 (11) 59.28 (13) 16.31 (7) 12.34 (17) 7.78 (8) 4.50 (8) 12.12 (2) 1.06 (2) 10.47 (8)141 58.86 1807 1821 Benzyl propanoate - - 0.54 (7) 1.98 (4) - - 168.13 (14) 42.07 (5) 10.62b (18) 10.74b (4)146 60.32 1839 1837 Ethyl dodecanoate 4 - 1.07 (9) - 22.39 (18) - - - 5.47 (6) - 27.04 (12)148 61.85 1872 1872 Geranyl butanoate 4.23 (4) 2.10 (18) 0.74 (17) 9.42 (15) - - 9.88 (4) 2.37 (11) - 22.58 (5)151 63.49 1906 1895 Geranyl isovalerate - 1.71 (13) 0.50 (6) - - - 64.89 (14) 2.89 (4) - -154 65.54 1944 1960 Geranyl valerate - - - - - - - - 1.98 (17) -155 66.22 1956 1974 Methyl jasmonate 11.10 (4) 21.96 (11) 15.26 (7) 29.99 (9) - - - - - -161 73.02 2126 2114 Bornyl benzoate - - - - 7.79 (11) - 4.47 (14) 18.77 (10) - -163 74.72 2135 2139 Ethyl cinnamate 4 - 2.89 (9) 2.15 (4) 6.64 (7) 1.02 c (14) 0.98 c (2) 37.80 (19) 1.45 (10) 3.40 (17) 2.97 (7)168 77.99 2154 2171 Diethyl 2-hydroxyglutarate 1.28 (2) 0.52 (12) 0.39 (5) 0.15 (4) - - 4.77 (10) 2.15 (16) 2.34 (8) 2.03 (10)
% RPA 25.98 18.45 64.16 50.29 23.58 20.90 58.84 45.15 55.00 57.83Alcohols
6 7.62 952 929 Ethanol 4 106.00 (4) 82.28 (9) 51.19 (15) 119.72 (9) 67.62 (12) 89.99 (8) 185.09 (14) 111.82 (12) 93.32 (6) 136.76 (14)14 11.29 1023 1037 1-Propanol 4 40.25 (3) 11.05 (5) 52.66 (7) 84.80 (4) 4.26 (3) 3.98 (2) 4.17 (7) 3.63 (13) 10.21 (3) 24.98 (2)27 16.86 1142 1099 2-Butanol 4 2.80 (5) 0.35 (6) - - 18.87 (6) 21.16 (6) 11.99 (17) 6.14 (5) 24.91 (4) 1.80 (9)37 20.56 1201 1206 3-Methyl-1-butanol 4 1.83 (2) 0.99 (7) 2.15 (3) 4.25 (2) 40.21 (2) 55.17 (4) 8.39 (18) 7.23 (2) 109.54 (4) 99.08 (2)59 29.87 1344 1332 2-Heptanol 4 33.40 (6) 30.15 (8) 13.20 (10) 53.42 (4) 36.18 (17) 4.01 (1) 160.92 (10) 296.92 (8) 6.78 (19) 13.78 (3)60 30.59 1355 1360 1-Hexanol 4 - - - 6.89 (5) - - - - - 7.00 (10)62 31.93 1374 1379 3-Ethoxypropanol 2.55 (6) 0.83 (10) 7.36 (10) 18.74 (9) 6.42 (17) 8.26 (2) - - - 19.92 (2)67 33.31 1394 1391 3-Hexen-1-ol isomer 4 6.95 (5) 0.89 (3) 23.25 (8) 66.75 (5) 13.55 (13) 25.46 (5) 3.37 (16) 4.28 (8) 17.11 (10) 28.55 (2)74 36.18 1441 1445 1-Octen-3-ol 4 3.04 (14) 2.20 (3) 4.27 (2) 3.33 (4) 8.90 (7) 6.30 (15) 8.57 (5) 21.73 (6) 1.19 (18) 15.40 (3)75 36.37 1444 1467 Heptanol 4 - - 27.03 (3) 9.14 (8) 12.33 (18) 9.70 (3) - - 8.51 (6) 13.99 (15)81 38.61 1480 1487 2-Ethyl-1-hexanol 4 10.47 (9) 9.44 (13) 1.56 (9) 7.55 (9) 2.82 (10) 10.25 (2) 4.43 (13) 30.86 (5) 5.58 (8) 22.00 (7)91 42.69 1546 1553 1-Octanol 4 6.62 (2) 7.29 (8) 20.37 (4) 76.80 (4) 72.34 (9) 22.57 (3) 27.20 (5) 68.14 (4) 24.58 (11) 75.42 (2)109 48.80 1645 1624 1-Nonanol 3.45 (12) 3.78 (18) 4.67 (20) 29.29 (6) 23.40 (7) 46.54 (9) - - - -147 60.80 1850 1865 Benzyl alcohol 4 1.96 (14) 3.47 (12) 1.51 (13) 30.96 (3) - - 9.62 (15) 5.55 (2) - -150 62.97 1896 1925 Phenylethyl alcohol 4 19.48 (6) 22.53 (7) 1.92 (5) 6.72 (10) 3.10 (8) 8.23 (4) 13.47 (3) 31.77 (17) 11.77 (4) 10.93 (13)156 67.46 1978 1952 1-Tridecanol - 0.77 (4) - - - - - - - 7.71 (17)
% RPA 18.14 19.97 7.14 15.08 10.05 9.67 16.21 20.74 10.14 15.60Carbonyl compounds
2 6.46 921 - Butanal 4 - - 5.47 (18) 9.43 (17) 4.25 (2) 9.50 (3) 3.19 (5) 7.42 (16) 1.70 (15) 5.24 (11)4 7.19 941 926 2-Methylbutanal 3.34 (2) 1.75 (1) 2.34 (7) 1.97 (2) - - - - 0.26 (11) 2.38 (9)5 7.33 944 936 3-Methylbutanal 4 4.63 (4) 1.69 (14) - - - - - - - -
9 8.98 982 973 2-Pentanone - - 1.08d (2) 0.96
d (3) 7.34 (5) 2.14 (12) 30.36 (5) 2.87 (8) 6.22 (5) 0.77 (4)
20 13.31 1072 1084 Hexanal 4 17.26 (11) 2.06 (18) 18.35 (7) 9.78 (12) 18.53 (12) 14.47 (7) - - 18.57 (18) 7.93 (6)24 15.93 1125 1131 2-Pentenal - 2.44 (9) - 3.02 (13) - - - - - 1.28 (15)32 18.95 1177 1170 2-Heptanone - 2.12 (1) - 1.27 (18) - - - 1.08 (10) - 3.51 (16)33 19.13 1179 1174 Heptanal 4 21.96 (10) 24.03 (7) 5.36 (17) 12.33 (5) - - - 0.34 (8) 1.66 (13) 4.05 (7)

Molecules 2019, 24, 974 7 of 20
Table 1. Cont.
Peakn◦
RT(min) 1 KICal
2 KILit3 Chemical Groups
GC Peak Area (×106) (RSD)
Grape Red Fruits Orange Pear Apple
Fresh Processed Fresh Processed Fresh Processed Fresh Processed Fresh Processed
36 20.22 1196 1192 2-Hexenal isomer 22.33 (1) 25.43 (6) 36.36 (5) 27.90 (1) 10.24 (3) 20.25 (2) 3.27 (11) 38.82 (4) 8.61 (16) 20.50 (13)38 21.17 1211 1200 2-Hexenal isomer 4.66 (10) 2.89 (10) 17.01 (15) 19.74 (5) - - 21.20 (5) 3.08 (2) 31.28 (13) -43 23.49 1248 1244 3-Octanone 4 14.11 (9) 1.51 (9) 0.52 (12) 5.30 (8) - - 0.41 (1) - - 1.90 (12)46 25.58 1279 1272 3-Hydroxy-2-butanone 9.30 (9) 0.97 (4) - - - - - 13.09 (10) - 1.18 (17)47 25.73 1281 1280 Octanal 4 - 7.10 (6) 8.63 (3) 3.73 (10) 99.19 (13) 122.34 (4) - - - 18.05 (5)48 26.58 1292 1287 1-Octen-3-one 4 - 18.29 (7) - - - - - - - 4.89 (9)53 27.92 1313 1299 2-Heptenal isomer - - 6.75 (3) 4.23 (6) 4.53 (16) 10.89 (9) 1.57 (15) 4.26 (3) 6.51 (4) 1.02 (6)55 28.90 1329 1319 6-Methyl-5-hepten-2-one 25.18 (7) 3.10 (15) - - 3.57 (3) 8.24 (11) 24.52 (10) 12.91 (6) 119.93 (11) 40.24 (8)63 32.20 1378 1388 2-Nonanone 2.24 (1) 16.47 (8) - - 4.74 (1) 1.91 (7) 0.98 (2) 1.63 (9) 2.22 (10) 2.83 (1)65 32.51 1383 1385 Nonanal 4 19.70 (15) 0.91 (13) 72.47 (9) 18.60 (13) 46.59 (7) 41.59 (13) 15.56 (1) 14.10 (3) 10.13 (13) 17.48 (10)66 33.17 1392 1401 2,4-Heptadienal isomer - - 10.93 (1) 7.66 (4) 2.25 (1) 2.86 (6) - - 1.20 (4) 1.94 (5)70 34.73 1417 1408 2-Octenal isomer 7.59 (15) 0.43 (5) 1.32 (14) 0.96 (6) 3.58 (19) 5.86 (2) 18.06 (7) - 35.95 (8) 14.73 (9)82 38.78 1483 1458 Methional 4 1.41 (3) 2.42 (8) 3.53 (5) 6.54 (14) 10.12 (14) 15.97 (3) 1.13 (18) 13.33 (7) 0.67 (7) 2.14 (2)83 39.12 1488 1484 Decanal 4 40.95 (6) 14.28 (15) 37.57 (13) 16.69 (12) 84.32 (7) 35.24 (1) 15.61 (3) 11.92 (15) 14.23 (18) 28.73 (8)86 40.58 1512 1495 Benzaldehyde 4 25.94 (12) 21.09 (8) 5.38 (17) 18.16 (2) 2.67 (18) 14.01 (12) 16.05 (8) 3.19 (3) 6.91 (11) 24.45 (2)87 41.30 1524 1527 2-Nonenal isomer 4 - - 6.10 (9) 9.37 (14) 10.19 (11) 16.22 (2) 5.74 (13) 1.59 (8) 3.01 (12) 9.74 (19)
95 44.40 1573 1575 2,6-Nonadienal isomer 1.46 (1) 6.51 (5) 1.08e (15) 0.98
e (1) - - - 2.07 (16) - -
96 44.77 1579 1561 6-Methyl-3,5-heptadiene-2-one - 2.47 (12) 12.57 (19) 6.44 (2) - - - 3.18 (15) - 4.35 (9)106 48.08 1633 1645 Acetophenone 4 9.26 (1) 1.05 (17) 9.61 (5) 7.82 (9) - - 17.96 (18) 3.14 (2) - -127 54.61 1739 1710 2,4-Decadienal 4 - 3.17 (14) 1.66 (11) 6.89 (17) - - 10.06 (6) 9.62 (15) - 34.88 (9)129 54.96 1745 1753 Ethyl benzaldehyde 4 - - - - - 10.48 (4) - 2.75 (9) - -136 57.07 1778 1758 2,4-Decadienal - 0.23 (5) - - 11.22 (6) 7.15 (2) 5.39 (11) 3.27 (3) 8.91 (15) 2.37 (4)164 75.14 2138 2103 γ-Decalactone 4 - 1.07 (5) - 10.56 (9) - - - 1.36 (11) - -166 76.38 2145 2112 Hexadecanone - 0.61 (12) 0.60 (10) 2.75 (11) - - - - - -169 80.45 2167 2153 Palmitaldehyde - - 25.00 (12) 17.37 (14) - - - - - -
% RPA 17.57 18.62 9.80 6.70 10.48 10.53 7.08 5.47 8.99 8.39Terpenoids
12 10.45 1000 1032 α-Pinene 4 - - - - 79.43 (4) 38.60 (5) - 5.59 (16) 6.55 (18) 1.47 (6)17 12.26 1047 1075 Camphene - - - - 1.17 (13) 0.98 (6) - 1.03 (3) - -21 14.03 1087 1116 β-Pinene 4 - - - - 4.84 (3) - - 6.22 (14) - 5.23 (11)23 15.90 1124 1148 δ-3-Carene - - - - 9.57 (11) 8.96 (5) - - - -29 17.73 1157 1141 β-Myrcene 4 - - 0.72 (7) 7.17 (5) 16.13 (12) 4.96 (2) - - - -35 19.68 1188 1198 Limonene 4 5.61 (5) 1.16 (6) 0.96 (4) 7.72 (10) 359.17 (9) 203.95 (3) 14.12 (3) 1.81 (6) 9.31 (4) 11.47 (6)39 21.92 1224 1225 Ocimene - - - - 55.58 (3) 99.12 (3) 8.89 (14) 12.83 (7) - 12.73 (12)42 22.85 1239 1238 γ-Terpinene 20.74 (7) 1.75 (8) - - 20.58 (16) 8.16 (4) - - - -45 25.06 1271 1261 p-Cymene 4 - - - - 76.29 (9) 99.40 (11) - - - -58 29.73 1342 1337 Rose oxide isomer - - 1.05 (5) 1.36 (12) - - - - - -72 35.47 1429 1423 Linalool oxide isomer - - 2.98 (2) 3.17 (15) 15.28 (7) 12.36 (3) 2.14 (5) 24.11 (11) 10.13 (2) 5.48 (1)73 35.58 1431 1449 Dihydrolinalool 83.01 (5) 48.23 (8) - - - - - - - -80 37.90 1469 1488 Citronellal 4 6.33 (2) 4.23 (5) - - 26.50 (15) 12.15 (6) - - 0.95 (17) 1.20 (8)84 39.77 1498 1491 Camphor 17.77 (15) 2.93 (10) 3.26 (10) 3.21 (11) 7.98 (5) 8.22 (4) 8.05 (14) 25.32 (6) 1.79 (7) 7.35 (11)85 40.32 1507 1506 Isoborneol 7.60 (9) 6.11 (2) - - - - 24.88 (15) 7.13 (2) 26.74 (7) 11.44 (8)88 41.61 1529 1516 Isocitral 16.34 (15) 1.63 (6) 10.86 (15) 5.51 (3) - - 3.52 (3) 5.51 (10) 0.96 (13) 3.48 (13)90 42.18 1538 1537 Linalool 4 60.66 (2) 18.25 (4) 254.57 (17) 375.08 (4) 46.40 (17) 198.03 (4) 5.54 (9) 24.57 (8) 7.48 (4) 41.07 (6)92 43.37 1557 1550 Dihydrocarvone - - - - 40.21 (3) 58.42 (5) 2.76 (2) 4.43 (9) 1.32 (13) 3.73 (11)94 44.12 1569 1574 Fenchyl alcohol - - 4.67 (12) 4.88 (10) 64.49 (6) 24.65 (6) 20.45 (18) 3.72 (11) 15.76 (4) 30.35 (5)

Molecules 2019, 24, 974 8 of 20
Table 1. Cont.
Peakn◦
RT(min) 1 KICal
2 KILit3 Chemical Groups
GC Peak Area (×106) (RSD)
Grape Red Fruits Orange Pear Apple
Fresh Processed Fresh Processed Fresh Processed Fresh Processed Fresh Processed
97 45.21 1585 1580 Bornyl acetate - - 3.18 (13) 37.19 (1) 12.33 (12) 16.01 (6) 10.25 (3) 14.70 (3) 1.95 (15) 7.62 (10)98 45.58 1591 1562 Isodihydrocarveol - - - - 25.67 (6) 65.65 (5) 0.78 (4) 1.84 (7) 1.64 (13) 9.09 (5)99 45.89 1596 1596 Mrytenal 39.62 (6) 6.52 (3) - - 12.08 (6) 11.93 (14) - - - -101 46.15 1599 1598 β-Ciclocitral 4 13.87 (7) 1.25 (2) 24.00 (12) 6.40 (4) 1.26 (9) 16.60 (8) 32.96 (4) 11.92 (7) 62.18 (11) 9.01 (7)102 46.53 1606 1602 Citral 4 11.21 (14) 5.50 (6) 2.98 (2) 3.17 (5) 5.01 (13) 7.72 (6) 4.96 (3) 5.21 (3) 1.53 (1) 2.96 (2)103 46.99 1614 1646 β-Terpineol 4 53.04 (11) 20.97 (4) 34.86 (15) 26.29 (7) 6.56 (8) 14.37 (10) 10.01 (3) 2.70 (8) 1.21 (2) 4.88 (7)105 47.70 1626 1648 Safranal - - - - 49.88 (8) 55.30 (12) - - - -107 48.44 1639 1639 Carvone - - - - - - 4.21 (2) 4.02 (5) 9.15 (8) 2.16 (18)111 49.37 1654 1655 Estragole - - 8.27 (15) 4.27 (10) - - 41.13 (16) 32.61 (9) 31.53 (14) 13.11 (9)113 50.21 1668 1648 β-Farnesene isomer - - 14.23 (5) 8.96 (3) 54.22 (2) 90.62 (8) 5.01 (3) 16.44 (12) 1.57 (17) 2.33 (12)114 50.80 1678 1688 α-Terpineol 4 21.09 (6) 13.47 (9) 9.70 (1) 12.44 (9) 40.86 (7) 29.87 (7) 15.12 (4) 11.91 (11) 10.18 (7) 15.52 (1)115 51.03 1681 1667 Neral - - - - - - 4.06 (8) 2.06 (3) 5.59 (5) 1.34 (8)118 52.30 1701 1705 Germacrene D - - 2.76 (9) 1.96 (5) 128.16 (4) 18.84 (5) 1.77 (17) 1.66 (12) 9.10 (8) 11.36 (4)119 52.57 1706 1715 Geranial isomer - - - - - - 34.53 (11) 19.82 (5) - -121 53.05 1714 1718 Naphthalene 4.28 (1) 8.10 (13) - - - - 3.00 (6) 3.80 (14) 17.96 (2) 19.54 (5)122 53.26 1717 1716 TDN 12.46 (6) 1.79 (4) - - 3.16 (11) - - - - 0.99 (9)123 53.65 1724 1726 Valencene - - - - 24.14 (7) - 11.69 (7) - 9.51 (10) -124 53.91 1728 1725 α-Farnesene - - 13.75 (19) 20.96 (5) 27.25 (4) 21.86 (7) 18.58 (10) 27.96 (12) 419.32 (3) 8.16 (5)125 54.10 1731 1714 α-Muurolene - - - - 38.90 (1) 31.01 (8) 12.77 (9) 1.80 (1) - -126 54.27 1734 1711 Geranyl acetate - - - - 31.54 (4) 66.51 (10) - - 23.65 (12) 13.37 (13)128 54.74 1741 1715 Geranial isomer 14.43 (13) 0.50 (3) - - 50.82 (13) 72.06 (10) 0.98 (2) 1.97 (2) 3.61 (5) 5.64 (12)131 55.43 1752 1751 Carvone - - - - 66.83 (3) 103.53 (8) - - - -132 55.82 1758 1759 Cumin aldehyde - - 3.88 (4) 9.76 (7) 2.48 (16) 15.89 (12) - - - -133 55.95 1760 1762 β-Citronellol 4 - - 10.91 (16) 8.67 (10) - - 7.43 (5) 34.98 (5) 23.08 (15) 1.84 (11)135 56.53 1769 1770 Nerol 7.34 (4) 4.67 (7) - - 82.71 (11) 87.95 (9) - - 2.87 (1) 1.59 (3)138 57.50 1784 1765 Perillaldehyde 17.32 (10) 10.26 (9) 8.62 (4) 12.92 (5) 1.36 (3) 2.15 (4) 1.83 (9) 45.48 (10) 19.86 (6) 22.03 (10)139 58.01 1792 1813 β-Damascenone 4 6.98 (3) 10.03 (13) 2.41 (14) 20.16 (2) 1.34 (9) 1.21 (2) 5.65 (11) 4.37 (4) 1.10 (8) 0.92 (5)140 58.38 1798 1786 Cadinadiene - - 1.74 (15) 2.76 (1) 16.07 (18) 33.65 (12) 22.32 (17) 17.16 (6) - -142 59.08 1812 1809 α-Ionone 4 - 0.53 (6) - 8.66 (6) - - - - - 10.22 (9)144 59.60 1824 1840 Geranyl acetone isomer 1.76 (1) 3.27 (4) - - 109.91 (15) 73.38 (7) 7.53 (1) 6.58 (6) - 27.62 (15)145 60.10 1834 1839 trans-carveol - 2.29 (7) - - 8.23 (16) 11.22 (9) 9.89 (7) 4.08 (9) - -149 62.13 1878 1847 Geraniol 4 - - 9.17 (1) 11.90 (10) - - 16.53 (8) 6.74 (14) - -152 64.72 1929 1912 β-Ionone 4 - 1.19 (16) 1.01 (8) 15.77 (7) 8.42 (15) - 29.36 (16) 84.02 (2) 1.27 (14) -153 64.98 1933 1927 Calamenene - - - - - - 4.86 (4) 3.73 (4) 2.14 (16) 1.98 (2)157 68.40 1994 2009 Nerolidol 4 3.09 (6) 2.47 (14) - - - - 2.81 (12) 1.96 (3) - -158 69.19 2103 2089 Elemol - - 0.61 (2) 0.87 (2) 3.05 (11) 22.75 (12) 18.99 (7) 12.15 (3) - -159 71.74 2118 2113 Cedrenol 4.21 (3) 6.03 (4) 91.13 (11) 75.19 (11) - - 3.69 (2) 35.73 (6) 2.73 (8) 1.19 (3)162 73.21 2127 2129 Spathulenol 3.98 (1) 5.33 (7) 0.73 (1) 20.72 (7) - - 19.20 (14) 1.13 (13) - -
% RPA 32.87 21.38 17.69 20.86 53.03 51.16 16.77 19.07 24.06 10.77Volatile phenols
165 75.82 2142 2141 Eugenol 4 7.97 (7) 1.12 (13) 5.01 (5) 6.20 (8) 10.10 (1) 2.98 (1) 16.87 (9) 2.65 (12) 8.54 (4) 9.63 (10)167 76.56 2146 2170 4-Ethyl phenol 4 - 1.88 (14) - 1.21 (2) - 15.45 (16) - - - 1.16 (12)
% RPA 0.61 0.34 0.17 0.22 0.33 0.57 0.63 0.09 0.28 0.35

Molecules 2019, 24, 974 9 of 20
Table 1. Cont.
Peakn◦
RT(min) 1 KICal
2 KILit3 Chemical Groups
GC Peak Area (×106) (RSD)
Grape Red Fruits Orange Pear Apple
Fresh Processed Fresh Processed Fresh Processed Fresh Processed Fresh Processed
% RPA 0.61 0.34 0.17 0.22 0.33 0.57 0.63 0.09 0.28 0.35Fatty acids
76 36.53 1447 1450 Acetic acid 4 34.60 (5) 20.77 (6) 1.37 (15) 7.08 (8) 2.45 (12) 32.50 (5) 7.74 (11) 13.49 (8) 24.06 (3) 12.43 (6)143 59.21 1815 1820 Hexanoic acid 4 9.88 (15) 2.40 (16) 26.48 (13) 18.33 (9) 68.43 (13) 58.96 (2) 1.26 (5) 2.98 (3) 8.16 (11) 1.03 (13)160 72.60 2123 2083 Octanoic acid 4 15.88 (18) 2.65 (8) 2.14 (4) 12.49 (13) 2.73 (14) 14.74 (8) 2.60 (10) 2.07 (10) 11.71 (4) 5.36 (7)
% RPA 4.58 2.93 1.01 1.10 2.39 3.30 0.43 0.65 1.42 0.62Furanic compounds
77 37.12 1457 1455 2-Furfural 4 3.39 (1) 159.04 (4) 0.79 (7) 194.85 (7) 4.67 (6) 124.55 (10) 1.25 (1) 247.37 (4) 3.26 (5) 197.05 (4)93 43.71 1562 1560 5-Methyl-2-furfural 4 - 2.40 (6) - 2.68 (6) - - - 2.73 (13) - -
% RPA 0.26 18.32 0.03 5.75 0.15 3.87 0.05 8.82 0.11 6.441 RT: Retention time (min). 2 Kovat index relative n-alkanes (C8 to C20) on a BP-20 capillary column. 3 Kovat index relative, reported in literature for equivalent capillary column [34,41–43].4 Volatile organic compounds (VOCs) identified by standard; -: Not detected; TDN: 1,2-dihydro-1,1,6-trimethylnaphtalene; Different superscript lowercase letters in a row indicate nosignificant differences between mean values at p < 0.05, obtained by one-way ANOVA, followed by Tukey’s test, for post-hoc multiple comparisons of means, for fresh and processed fruitjuice (n = 2).

Molecules 2019, 24, 974 10 of 20
Molecules 2019, 24, x FOR PEER REVIEW 11 of 22
On the other hand, the number of terpenoids identified in orange juice, independently of the type of juice, was two times higher than that in grape juice. The contribution of this chemical group to the total volatile profile of grape juice was two times higher than its contribution to that of red fruits, apple, and pear juices, irrespective of the type of juice (Table 1). Dihydrolinalool, followed by linalool and α-terpineol, were the predominant terpenoids identified in grape juices (Table S2).
In the studied fresh juices, the contribution of alcohols to the total volatile profile ranged from 10.1 (orange) to 18.1% (grape), whereas in processed juices its contribution ranged from 9.7 (orange) to 20.7% (pear). The ethanol content was higher in the fresh juices from grape, orange, and pear than in the corresponding processed juices, whereas in the red fruit juices and apple juices, the GC peak area of ethanol was higher in the processed juices than in the fresh juices. 1-Propanol was the second most dominant alcohol in grapes and red fruit juices, whereas 3-methyl-1-butanol was the most dominant alcohol in orange and apple juices.
Regarding furanic compounds, a significant increase in terms of the total GC peak area (Figure S3) and % RPA (Table 1) was observed for all investigated processed juices, unlike the fresh juices. The contribution of this chemical group to the total volatile profile of processed juices ranged from 3.9 (orange) to 18.3% (grape), whereas in fresh juices, its content was significantly low (p < 0.05), ranging from 0.03 (red fruits) to 0.3% (grapes).
Figure 2. Total GC peak area of chemical groups identified in fresh and processed fruit juices.Figure 2. Total GC peak area of chemical groups identified in fresh and processed fruit juices.
In orange and grape juices, terpenoids was the most predominant chemical group, accounting for53.0 and 32.9% of the total volatile composition of fresh juices, and 51.2 and 21.4% of that of processedjuices, respectively. While the number of identified terpenoids in orange, pear, and apple juices wassimilar, its GC peak area in fresh and processed orange juices was three and four times higher thanobserved in fresh and processed juices from pear and apple, respectively. This trend is explained bythe high GC peak areas of limonene, which were followed by those of germacrene D, geranyl acetoneisomer and linalool, observed in orange juices (Table 1 and Table S2). On average, limonene represents11.6 and 6.3% of the total volatile profile of fresh and processed juices, respectively.
On the other hand, the number of terpenoids identified in orange juice, independently of the typeof juice, was two times higher than that in grape juice. The contribution of this chemical group tothe total volatile profile of grape juice was two times higher than its contribution to that of red fruits,apple, and pear juices, irrespective of the type of juice (Table 1). Dihydrolinalool, followed by linalooland α-terpineol, were the predominant terpenoids identified in grape juices (Table S2).
In the studied fresh juices, the contribution of alcohols to the total volatile profile ranged from10.1 (orange) to 18.1% (grape), whereas in processed juices its contribution ranged from 9.7 (orange) to20.7% (pear). The ethanol content was higher in the fresh juices from grape, orange, and pear than inthe corresponding processed juices, whereas in the red fruit juices and apple juices, the GC peak areaof ethanol was higher in the processed juices than in the fresh juices. 1-Propanol was the second mostdominant alcohol in grapes and red fruit juices, whereas 3-methyl-1-butanol was the most dominantalcohol in orange and apple juices.
Regarding furanic compounds, a significant increase in terms of the total GC peak area (Figure S3)and % RPA (Table 1) was observed for all investigated processed juices, unlike the fresh juices.The contribution of this chemical group to the total volatile profile of processed juices ranged from 3.9(orange) to 18.3% (grape), whereas in fresh juices, its content was significantly low (p < 0.05), rangingfrom 0.03 (red fruits) to 0.3% (grapes).
Molecules 2019, 24, 974 11 of 20
2.2. Multivariate Data Analysis
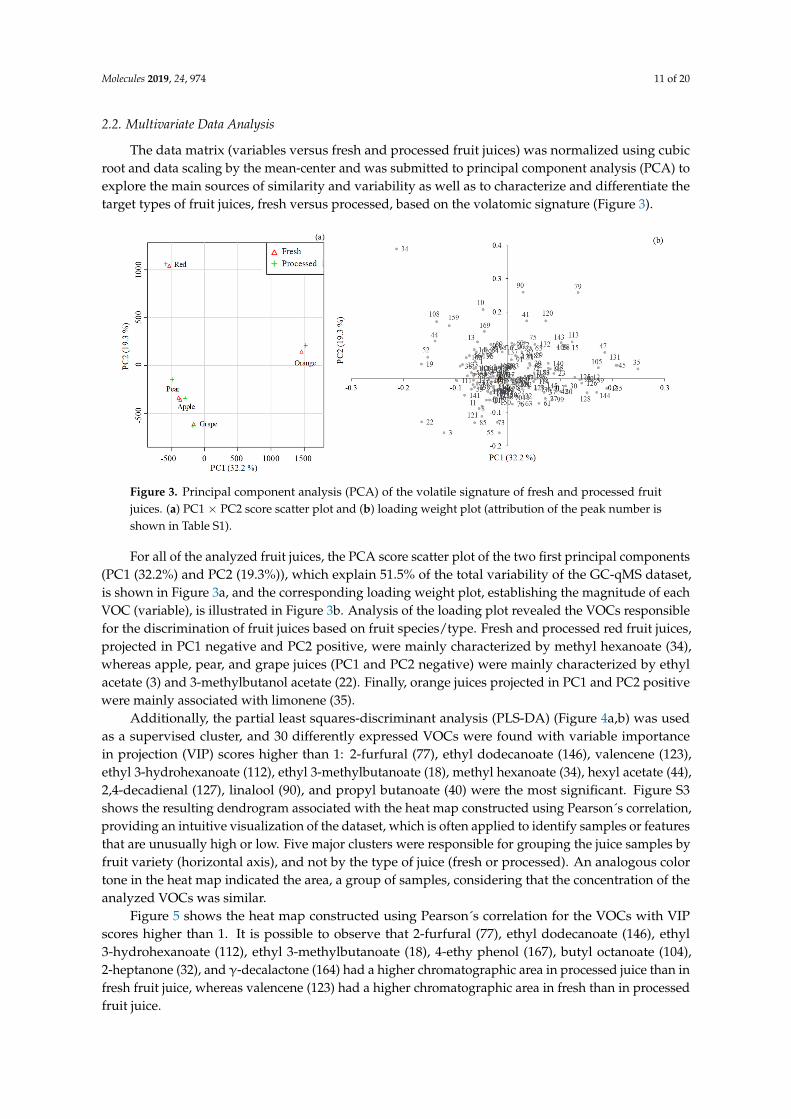
The data matrix (variables versus fresh and processed fruit juices) was normalized using cubicroot and data scaling by the mean-center and was submitted to principal component analysis (PCA) toexplore the main sources of similarity and variability as well as to characterize and differentiate thetarget types of fruit juices, fresh versus processed, based on the volatomic signature (Figure 3).
Molecules 2019, 24, x FOR PEER REVIEW 12 of 22
2.2. Multivariate Data Analysis
The data matrix (variables versus fresh and processed fruit juices) was normalized using cubic root and data scaling by the mean-center and was submitted to principal component analysis (PCA) to explore the main sources of similarity and variability as well as to characterize and differentiate the target types of fruit juices, fresh versus processed, based on the volatomic signature (Figure 3).
Figure 3. Principal component analysis (PCA) of the volatile signature of fresh and processed fruit juices. (a) PC1 × PC2 score scatter plot and (b) loading weight plot (attribution of the peak number is shown in Table S1).
For all of the analyzed fruit juices, the PCA score scatter plot of the two first principal components (PC1 (32.2%) and PC2 (19.3%)), which explain 51.5% of the total variability of the GC-qMS dataset, is shown in Figure 3a, and the corresponding loading weight plot, establishing the magnitude of each VOC (variable), is illustrated in Figure 3b. Analysis of the loading plot revealed the VOCs responsible for the discrimination of fruit juices based on fruit species/type. Fresh and processed red fruit juices, projected in PC1 negative and PC2 positive, were mainly characterized by methyl hexanoate (34), whereas apple, pear, and grape juices (PC1 and PC2 negative) were mainly characterized by ethyl acetate (3) and 3-methylbutanol acetate (22). Finally, orange juices projected in PC1 and PC2 positive were mainly associated with limonene (35).
Additionally, the partial least squares-discriminant analysis (PLS-DA) (Figure 4a,b) was used as a supervised cluster, and 30 differently expressed VOCs were found with variable importance in projection (VIP) scores higher than 1: 2-furfural (77), ethyl dodecanoate (146), valencene (123), ethyl 3-hydrohexanoate (112), ethyl 3-methylbutanoate (18), methyl hexanoate (34), hexyl acetate (44), 2,4-decadienal (127), linalool (90), and propyl butanoate (40) were the most significant. Figure S3 shows the resulting dendrogram associated with the heat map constructed using Pearson´s correlation, providing an intuitive visualization of the dataset, which is often applied to identify samples or features that are unusually high or low. Five major clusters were responsible for grouping the juice samples by fruit variety (horizontal axis), and not by the type of juice (fresh or processed). An analogous color tone in the heat map indicated the area, a group of samples, considering that the concentration of the analyzed VOCs was similar.
Figure 3. Principal component analysis (PCA) of the volatile signature of fresh and processed fruitjuices. (a) PC1 × PC2 score scatter plot and (b) loading weight plot (attribution of the peak number isshown in Table S1).
For all of the analyzed fruit juices, the PCA score scatter plot of the two first principal components(PC1 (32.2%) and PC2 (19.3%)), which explain 51.5% of the total variability of the GC-qMS dataset,is shown in Figure 3a, and the corresponding loading weight plot, establishing the magnitude of eachVOC (variable), is illustrated in Figure 3b. Analysis of the loading plot revealed the VOCs responsiblefor the discrimination of fruit juices based on fruit species/type. Fresh and processed red fruit juices,projected in PC1 negative and PC2 positive, were mainly characterized by methyl hexanoate (34),whereas apple, pear, and grape juices (PC1 and PC2 negative) were mainly characterized by ethylacetate (3) and 3-methylbutanol acetate (22). Finally, orange juices projected in PC1 and PC2 positivewere mainly associated with limonene (35).
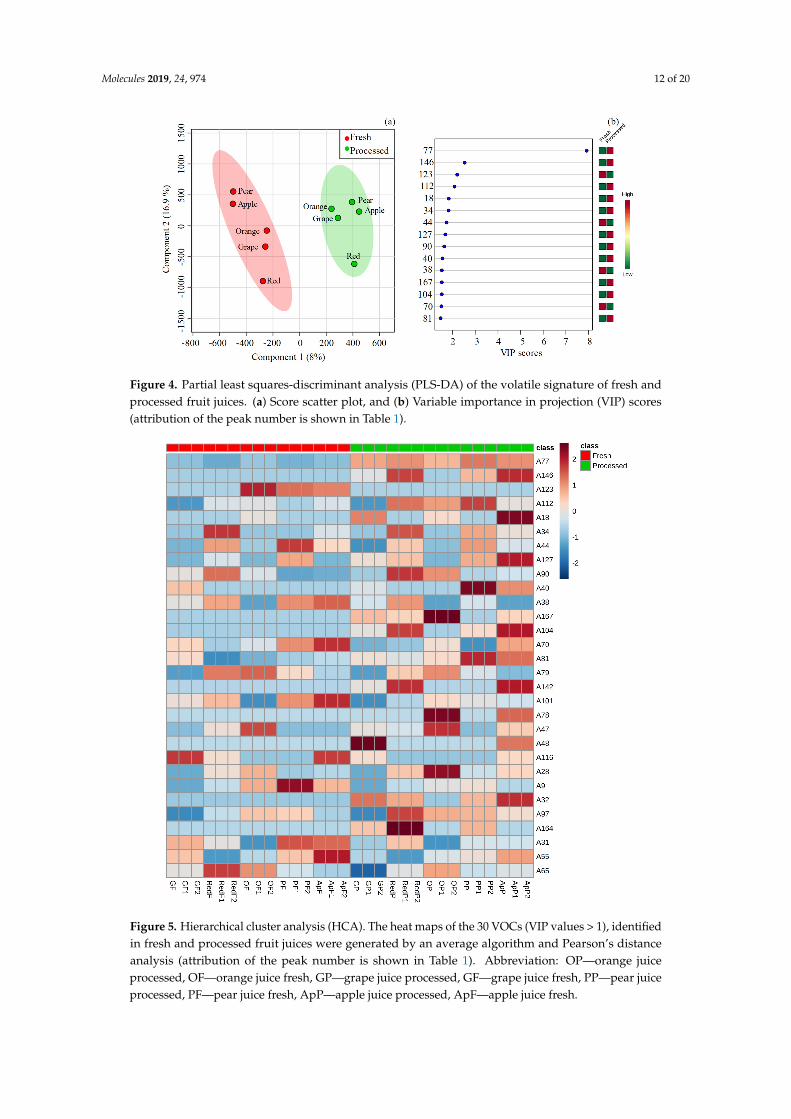
Additionally, the partial least squares-discriminant analysis (PLS-DA) (Figure 4a,b) was usedas a supervised cluster, and 30 differently expressed VOCs were found with variable importancein projection (VIP) scores higher than 1: 2-furfural (77), ethyl dodecanoate (146), valencene (123),ethyl 3-hydrohexanoate (112), ethyl 3-methylbutanoate (18), methyl hexanoate (34), hexyl acetate (44),2,4-decadienal (127), linalool (90), and propyl butanoate (40) were the most significant. Figure S3shows the resulting dendrogram associated with the heat map constructed using Pearson´s correlation,providing an intuitive visualization of the dataset, which is often applied to identify samples or featuresthat are unusually high or low. Five major clusters were responsible for grouping the juice samples byfruit variety (horizontal axis), and not by the type of juice (fresh or processed). An analogous colortone in the heat map indicated the area, a group of samples, considering that the concentration of theanalyzed VOCs was similar.
Figure 5 shows the heat map constructed using Pearson´s correlation for the VOCs with VIPscores higher than 1. It is possible to observe that 2-furfural (77), ethyl dodecanoate (146), ethyl3-hydrohexanoate (112), ethyl 3-methylbutanoate (18), 4-ethy phenol (167), butyl octanoate (104),2-heptanone (32), and γ-decalactone (164) had a higher chromatographic area in processed juice than infresh fruit juice, whereas valencene (123) had a higher chromatographic area in fresh than in processedfruit juice.
Molecules 2019, 24, 974 12 of 20Molecules 2019, 24, x FOR PEER REVIEW 13 of 22
Figure 4. Partial least squares-discriminant analysis (PLS-DA) of the volatile signature of fresh and processed fruit juices. (a) Score scatter plot, and (b) Variable importance in projection (VIP) scores (attribution of the peak number is shown in Table 1).
Figure 5 shows the heat map constructed using Pearson´s correlation for the VOCs with VIP scores higher than 1. It is possible to observe that 2-furfural (77), ethyl dodecanoate (146), ethyl 3-hydrohexanoate (112), ethyl 3-methylbutanoate (18), 4-ethy phenol (167), butyl octanoate (104), 2-heptanone (32), and γ-decalactone (164) had a higher chromatographic area in processed juice than in fresh fruit juice, whereas valencene (123) had a higher chromatographic area in fresh than in processed fruit juice.
Figure 4. Partial least squares-discriminant analysis (PLS-DA) of the volatile signature of fresh andprocessed fruit juices. (a) Score scatter plot, and (b) Variable importance in projection (VIP) scores(attribution of the peak number is shown in Table 1).Molecules 2019, 24, x FOR PEER REVIEW 14 of 22
Figure 5. Hierarchical cluster analysis (HCA). The heat maps of the 30 VOCs (VIP values > 1), identified in fresh and processed fruit juices were generated by an average algorithm and Pearson’s distance analysis (attribution of the peak number is shown in Table 1). Abbreviation: OP—orange juice processed, OF—orange juice fresh, GP—grape juice processed, GF—grape juice fresh, PP—pear juice processed, PF—pear juice fresh, ApP—apple juice processed, ApF—apple juice fresh.
Figure 5. Hierarchical cluster analysis (HCA). The heat maps of the 30 VOCs (VIP values > 1), identifiedin fresh and processed fruit juices were generated by an average algorithm and Pearson’s distanceanalysis (attribution of the peak number is shown in Table 1). Abbreviation: OP—orange juiceprocessed, OF—orange juice fresh, GP—grape juice processed, GF—grape juice fresh, PP—pear juiceprocessed, PF—pear juice fresh, ApP—apple juice processed, ApF—apple juice fresh.

Molecules 2019, 24, 974 13 of 20
3. Discussion
In sum, fruit aroma is an important indicator, which may reflect the quality of future fruit juice.The contribution of each VOC to the specific aroma signature of each fruit species/types depends onthe activity and substrate specificity of the relevant enzymes in the biosynthetic pathway, the substrateavailability, the OT above which VOC can be detected by smell, and the presence of the other VOCs [5].The esters represented more than 45.15% of the total volatile profile of apple, pear, and red fruit juices,which is in accordance with previous studies that report esters as the most abundant chemical groupin pear and apple fruit juices [6,7,11,13]. Regarding this chemical group, hexyl acetate, a dominantesters in pear juice, has been reported as possessing a strong pear-like odor [12]. Moreover, ethyloctanoate contributes to sweet and fruit odors in pears, while hexanal, ethyl acetate, hexyl acetate,ethyl butanoate, and butanol are identified as impact volatiles in Conference pears [13]. On the otherhand, terpenoids, one of the most dominant chemical groups of VOCs found in orange and grapefruit juices, have shown beneficial functions as well as nutraceutical activities. Recently, some studiesin the field of cancer research and food nutrition sciences have been performed on these VOCs dueto their potential anticancer properties [44]. Among them, limonene (a dominant VOC in orangejuice) has been reported to be a bioactive food component from citrus fruits, with a potential role inbreast cancer prevention and treatment [45]. In addition, limonene reduces the oxidative stress inStreptozotocin-induced diabetic rats by decreasing lipid peroxidation and sparing the activities ofantioxidant enzymes [46]. Linalool (a dominant VOC in red fruit juice) and terpineol (a dominant ingrape fruit juice) are responsible for the fruity and floral notes of food matrices. Moreover, linalooland its degradation product, α-terpineol, have been reported as potent antimicrobial agents againstperiodontopathic and cariogenic bacteria [47]. Anti-inflammatory effects were also associated withthese terpenes [48]. α-Farnesene, a specific terpenoid, with green and herbaceous aroma descriptors,has been reported as the most abundant terpene in fresh apple juice [49], which is in agreement withthe results of our study, since we detected GC peak areas (×106) in fresh and processed apple juices of419.32 and 8.16, respectively. Moreover, according to previous studies, the aroma of squeezed orangejuice is primarily associated to esters (e.g., ethyl butanoate, ethyl 2-methylpropanoate), aldehydes(e.g., acetaldehyde, hexanal, octanal), in addition to a smaller number of terpenoids (e.g., myrcene,α-pinene, potentially limonene, linalool, geranial). All these VOCs are responsible for the citrus, green,sweet fruit, and floral notes from fresh orange juice [50–52].
There are differences between the VOCs contained in fresh and processed fruit juices, withprocessed juices having the highest levels of VOCs. Indeed, a recent study of fresh and commercialpomegranate juice indicated that there were marked differences between endogenous VOCs extractedin the laboratory versus what was often found in commercial products [53]. This fact may be dueto several characteristics of fruits (e.g., geographical and botanical origin, varieties, ripening stage,farming practices, and post-harvest handling), the process applied in juice extraction and its production(e.g., enzymes, heat, and filtration), as well as storage conditions [5]. A recent assay reported thatthe volatile loss generally continued through pasteurized storage, and the lowest volatile levels wererecovered after one, two, and four months of storage [54]. Another study highlighted that changesin volatile chemicals could provide useful information about juice processing for the selection ofthe optimal harvest time and for setting a precise blending strategy [55]. Our study showed thatthe volatile profile of processed juices is more complex than that of fresh juices. This result is inaccordance with a previous work carried out by Schmutzer and colleagues [49], in which fresh applejuice was compared with commercial apple juice. These authors highlighted that the differentiationcriteria between fresh and commercial juices based on individual compounds implied a difficultcharacterization process, which is not helpful in establishing a quality index. Consequently, the mostappropriate and useful method is to compare groups of VOCs (in our study: esters, alcohols, carbonylcompounds, terpenoids, volatile phenols, acids, and furanic compounds). In general, fresh juices weremainly characterized by the presence of esters and terpenoids, while furanic compounds (Maillardproducts) were important contributors to the profile of processed juices. Our findings are in accordance

Molecules 2019, 24, 974 14 of 20
with a previous report concerning pomegranate juices [56]. Moreover, storage time and temperaturecan also change juice aroma profiles due to Maillard, strecker, and acid catalyzed hydration reactions.The formation of methional from methionine is probably the most significant example of Streckerdegradation in orange juice [51]. Methional concentration in processed orange juice is higher than freshjuice (Table 1). Moreover, esters as stated above represent an important contribution to fruit juice odor,and the level of total esters in aqueous essence has been used as a quality index [51]. Nevertheless,their concentration in processed juice was lower than fresh juice, since during processing many estersrapidly hydrolyzed by hydrolase enzymes.
The presence of ethanol in the investigated fruit juices is indicative of the fermentation processcaused by microorganisms as a consequence of inefficient sterilization of raw materials or latercontamination. A previous study reported that high ethanol contents were observed mainly in juiceswithout preservatives, particularly freshly-squeezed juices. Octanal and decanal, the most dominantcompounds, of the carbonyl group found, in orange juice unlike other juices, have been consideredto be important contributors to the orange flavor and standard of orange peel oil [57]. An importantpoint to highlight is that the production of excessive volatile phenols is regarded as spoilage. In ourstudy, 4-ethyl phenol, in particular, was only detected in processed juices, suggesting a possiblemicrobial contamination (e.g., Brettanomyces sp). It has been reported [58] that this phenol may providewoody, smoky, leather, and animal off-odors. In the same sense, Daud and colleagues [59] reportedthat another family of compounds, which may contribute to undesirable smells or odors, is acidiccompounds such as octanoic and hexanoic acids.
The data obtained in the current study represent an added value to the existing knowledge,as well as provide a useful platform to improve the organoleptic characteristics of the processedjuices, and consequently contribute to their economic valorization and improve their acceptanceby consumers.
4. Materials and Methods
4.1. Material and Chemicals
All chemicals were of analytical quality. Sodium chloride (NaCl, 99.5%) was supplied fromPanreac (Spain, Barcelona) and the VOC standards used for identification were purchased fromSigma–Aldrich (Madrid, Spain) and Acros Organics (Geel, Belgium), with a purity ≥ 98%. Heliumof purity 5.0 (Air Liquide, Lisbon, Portugal) was utilized as the GC carrier gas. The glass vials,SPME fibers and SPME holder for manual sampling were purchased from Supelco (Bellefonte, PA,USA). The KI was calculated through the injection of a series of C8 to C20 straight-chain n-alkanes(concentration of 40 mg/L in n-hexane), supplied by Fluka (Buchs, Switzerland).
4.2. Fruit Juice Samples
Healthy mature-state and undamaged fruit samples from fresh grapes (Vitis vinifera L.), wild redfruits (Fragaria x ananassa Duch. Vaccinium corymbosum L., Rubus idaeus L.), orange (Citrus sinensis L.),pear (Pyrus communis L.), and apple (Malus domestica Borkh.) were collected at maturity state based onthe sugar/acid ratio, color, and pH from producers in the southwest region of Madeira Island, Portugalduring the 2016 harvest and were immediately taken to the process line at 4 ◦C. For each sampling,fruits were picked randomly throughout the experimental vineyard, taking into consideration thebalance between shadow and sun exposure in the different vineyard locations, following a z-shapedpattern to avoid edge and center effects. In the process line, the fresh fruits were screened, inspected,washed, mechanically crushed, and submitted to an enzymatic treatment using pectinase enzyme(concentration of enzyme: 5 mg/100 g; incubation time: 2 h; and temperature: 35 ◦C). Operations suchas washing, sorting and inspecting require attention to mass and heat transfer. Cooling depends uponheat transfer from fruit to air (possibly water). Cleaning sometimes involved the physical removal ofsurface debris by brushes which reduced the number of microbes. Inspecting sometimes involved the

Molecules 2019, 24, 974 15 of 20
removal of raw materials which did not meet the standards of the quality of analysis. The enzymaticactivity was monitored by adding five milliliters of juice to 15 mL of HCl-acidified ethyl alcohol,observing the mixture for 5 min for gel formation. No gel formation meant that the depectinizationwas complete. After this, the juice was extracted at room temperature (25 ◦C), using the equipmentappropriate for each fruit variety, and then filtrated (XP-201 polyvinylidene fluoride membrane) undervacuum. At this stage, fresh fruit juices were taken, in 250-mL amber glass vials and immediatelytransported to the laboratory at 4 ◦C, aliquoted in 20-mL amber glass vials and frozen at −80 ◦Cuntil analysis. The remaining fruit juice was submitted to a pasteurization process at 80–95 ◦C for 1to 10 min in intermediate tanks to eliminate bacteria without changing the fresh flavor of the fruitjuice. After this process, the fruit juice was submitted to a cooling batch (4 to 5 ◦C) and sterile storage.At this stage, the processed fruit juice was taken, transported to the laboratory, aliquoted, and frozenat −80 ◦C until analysis. All analyses were performed in triplicate.
4.3. Headspace Solid-Phase Microextraction
The HS-SPME experimental parameters used in this work were previously optimized in severalworks, developed in our group [15,19,41,60]. Briefly, aliquots of 5 mL of juice samples were placed intoa 10-mL glass vial. After the addition of 10% (w/v) of NaCl and stirring (0.5 × 0.1 mm bar) at 400 rpm,the vial was capped with a PTFE (polytetrafluoroethylene) septum and an aluminum cap (Chromacol,Hertfordshire, UK). The vial was placed in a thermostated bath, adjusted at 40.0 ± 0.1 ◦C for 5 min, andthen the 50/30 µm divinylbenzene/carboxen/polydimethylsiloxane (DVB/CAR/PDMS) fiber wasinserted into the headspace for 45 min. Each sample was analyzed in triplicate. Blanks, correspondingto the analysis of the coating fiber and not submitted to any extraction procedure, were run betweensets of three analyses.
4.4. Gas Chromatography-Mass Spectrometry Conditions
The gas chromatography mass spectrometry conditions were previously established [15,41].The fiber of the SPME containing the VOCs was manually introduced into the GC injection port at250 ◦C (equipped with a glass liner, 0.75 mm I.D.) for 5 min for desorption. The desorbed VOCswere analyzed in an Agilent Technologies 6890N Network gas chromatography equipped with aBP-20 fused silica capillary column (30 m × 0.25 mm I.D. × 0.25-µm film thickness) supplied bySGE (Darmstadt, Germany), connected to an Agilent 5973N quadrupole mass selective detector.Helium (Air Liquid, Lisbon, Portugal) was used as the carrier gas at a flow rate of 1.0 mL/min(column-head pressure: 12 psi). The injections were performed in the splitless mode (5 min). The GCoven temperature was programmed as follows: 45 ◦C (1 min), then increased by 2 ◦C/min to 100 ◦C(3 min), 5 ◦C/min to 130 ◦C (5 min), and finally 20 ◦C/min to 220 ◦C (2 min). For the MS system,the temperatures of the transfer line, quadrupole, and ionization source were 250, 150, and 230 ◦C,respectively. The electron impact mass spectra were recorded at 70 eV, and the ionization current wasabout 30 µA. The acquisitions were performed in full scan mode (30–300 m/z). The identificationof the VOCs was achieved by (i) comparing the GC retention times and mass spectra, with those,when available, of the standard compounds; (ii) comparing all mass spectra with the data systemlibrary (NIST, 2005 software, Mass Spectral Search Program V.2.0d, Agilent, Washington, USA); and (iii)determining the kovat index (KI) values, according to the van den Dool and Kratz equation [61].For the KI determination, a C8–C20 n-alkanes series was used, and the values were compared, whenavailable, with values reported in the literature for similar columns [34,41–43,62].
4.5. Statistical Analysis
The obtained data were analyzed with Metaboanalyst 4.0 [63], which included data pre-processingto remove VOCs with missing values (MVs), MVs imputation of the resulting data (by Bayesianprincipal component analysis, PCA method), and normalization (data transformation by cubic rootand data scaling by the mean-center). The normalized data were further subjected to one-way ANOVA,
Molecules 2019, 24, 974 16 of 20
followed by Tukey’s test (p < 0.05), for post-hoc multiple comparisons of means and multivariatestatistical analysis, namely, principal component analysis (PCA) and partial least squares-discriminantanalysis (PLS-DA). This provided insights into the separations between the fresh and processed fruitjuices and allowed VOCs that may have indicated differences among the samples sets to be identified.Finally, Pearson’s correlation was used to build the heat map of the fresh and processed fruit juices.
5. Conclusions
The HS-SPME/GC–qMS has proven to be a suitable and solvent-free approach to theestablishment of the volatile signature of fresh and processed juices from different fruits (pear, orange,red fruits, grape, and apple). This analytical technique, combined with multivariate analysis, may offerto fruit juice industries an alternative technique for routine analysis in the monitoring of processes thatmay affect aroma compounds in order to obtain fruit juices with high-quality flavors. For processedjuices, special attention should be paid during the production process in order to avoid possibledeleterious effects associated with the formation of furanic compounds, since a significant increasewas observed from fresh to processed fruit juices of the same batch. Storage time and temperaturecan also change juice aroma profiles due to Maillard, Strecker, and acid catalyzed hydration reactions.In this sense, methional is probably the most significant example of Strecker degradation in orangejuice, and it was possible to observe that its concentration in processed fruit juice was higher thanin fresh fruit juice. On the other hand, esters contribute positively to fruit juice odor, with fruitand floral notes. However, their relative concentration in processed fruit juice was lower thanfresh fruit juice, since during processing many esters rapidly hydrolyzed by hydrolase enzymes.Consequently, it was expected that their contribution to volatile profile on processed fruit juice waslower. These findings represent a suitable tool for providing data on fruit markers, which may be usefulin defining the production procedures (e.g., enzyme, filtration, heat treatment, pasteurization, packingor storage), improving the organoleptic characteristics of the corresponding juices, and consequentlycontributing to the economic valorization and consumer acceptance of juices. Moreover, since the dataobtained in the study correspond to one harvest, more studies need be conducted to investigate thetypicality and reproducibility of the patterns of VOCs, across multiple harvests, and geographical andagronomic conditions.
Supplementary Materials: The following are available online at http://www.mdpi.com/1420-3049/24/5/974/s1,Figure S1: Total ion chromatograms obtained by HS-SPMEDVB/CAR/PDMS/GC-qMS analysis of processed fruitjuices (for identification of peak numbers see Table 1), Figure S2: Overload of GC-qMS chromatograms (enlargedpart of the chromatograms of Figure 1) showing the comparison of the typical profile of 2-furfural identified infresh and processed fruit juices, Figure S3: Hierarchical cluster analysis (HCA). The heat maps of the 169 VOCsidentified in fresh and processed fruit juices were generated by average algorithm and Pearson distance analysis(attribution of the peak number is shown in Table 1). Abbreviation: OP—orange juice processed, OF—orangejuice fresh, GP—grape juice processed, GF—grape juice fresh, PP—pear juice processed, PF—pear juice fresh,ApP—apple juice processed, ApF—apple juice fresh, Table S1: Common volatile organic compounds (VOCs)identified in fresh and processed fruit juices, Table S2: Predominant VOCs in fresh and processed fruit juicesanalyzed using HS-SPME/GC-MS methodology.
Author Contributions: R.P., C.S. and P.S. performed the design of experiments, data and statistical analysis;R.P. and S.M. performed manuscript preparation; R.P. and J.S.C. performed the conception of study, manuscriptpreparation, and editing.
Funding: This research received no external funding.
Acknowledgments: This work was supported by the FCT-Fundação para a Ciência e a Tecnologia(project PEst-OE/QUI/UI0674/2013, CQM, Portuguese Government funds), Madeira 14-20 Program(project PROEQUIPRAM—Reforço do Investimento em Equipamentos e Infraestruturas Científicas naRAM—M1420-01-0145-FEDER-000008) and by ARDITI-Agência Regional para o Desenvolvimento daInvestigação Tecnologia e Inovação through the project M1420-01-0145-FEDER-000005—Centro de Químicada Madeira—CQM+ (Madeira 14-20). The authors also acknowledge Post-Doc grants, SFRH/BPD/97387/2013and ARDITI-CQM/2017/008-PDG to Rosa Perestrelo and Sonia Medina, respectively, and PhD grants to CatarinaSilva (SFRH/BD/97039/2013) and Pedro Silva (ARDITI; M1420 Project—09-5369-FSE-000001).
Conflicts of Interest: The authors declare no conflict of interest.

Molecules 2019, 24, 974 17 of 20
References
1. Slavin, J.L.; Lloyd, B. Health benefits of fruits and vegetables. Adv. Nutr. An Int. Rev. J. 2012, 3, 506–516.[CrossRef] [PubMed]
2. Wang, X.; Ouyang, Y.; Liu, J.; Zhu, M.; Zhao, G.; Bao, W.; Hu, F.B. Fruit and vegetable consumptionand mortality from all causes, cardiovascular disease, and cancer: Systematic review and dose-responsemeta-analysis of prospective cohort studies. BMJ (Clin. Res. Ed.) 2014, 349, g4490. [CrossRef] [PubMed]
3. D’Agostino, M.F.; Sanz, J.; Sanz, M.L.; Giuffrè, A.M.; Sicari, V.; Soria, A.C. Optimization of a solid-phasemicroextraction method for the gas chromatography–mass spectrometry analysis of blackberry (Rubusulmifolius Schott) fruit volatiles. Food Chem. 2015, 178, 10–17. [CrossRef] [PubMed]
4. Khalil, M.N.A.; Fekry, M.I.; Farag, M.A. Metabolome based volatiles profiling in 13 date palm fruit varietiesfrom Egypt via SPME GC–MS and chemometrics. Food Chem. 2017, 217, 171–181. [CrossRef] [PubMed]
5. El Hadi, M.; Zhang, F.-J.; Wu, F.-F.; Zhou, C.-H.; Tao, J. Advances in fruit aroma volatile research. Molecules2013, 18, 8200–8229. [CrossRef] [PubMed]
6. Ferreira, L.; Perestrelo, R.; Caldeira, M.; Câmara, J.S. Characterization of volatile substances in applesfrom Rosaceae family by headspace solid-phase microextraction followed by GC-qMS. J. Sep. Sci. 2009, 32,1875–1888. [CrossRef] [PubMed]
7. Holland, D.; Larkov, O.; Bar-Ya’akov, I.; Bar, E.; Zax, A.; Brandeis, E.; Ravid, U.; Lewinsohn, E. Developmentaland Varietal Differences in Volatile Ester Formation and Acetyl-CoA: Alcohol Acetyl Transferase Activitiesin Apple (Malus domestica Borkh.). Fruit 2005. [CrossRef]
8. Rizzolo, A.; Grassi, M.; Eccher Zerbini, P. Influence of harvest date on ripening and volatile compounds inthe scab-resistant apple cultivar ‘Golden Orange’. J. Hortic. Sci. Biotechnol. 2006, 81, 681–690. [CrossRef]
9. Villatoro, C.; Altisent, R.; Echeverría, G.; Graell, J.; López, M.L.; Lara, I. Changes in biosynthesis of aromavolatile compounds during on-tree maturation of ‘Pink Lady®’ apples. Postharvest Biol. Technol. 2008, 47,286–295. [CrossRef]
10. Lara, I.; Miró, R.M.; Fuentes, T.; Sayez, G.; Graell, J.; López, M.L. Biosynthesis of volatile aroma compoundsin pear fruit stored under long-term controlled-atmosphere conditions. Postharvest Biol. Technol. 2003, 29,29–39. [CrossRef]
11. Kahle, K.; Preston, C.; Richling, E.; Heckel, F.; Schreier, P. On-line gas chromatography combustion/pyrolysisisotope ratio mass spectrometry (HRGC-C/P-IRMS) of major volatiles from pear fruit (Pyrus communis)and pear products. Food Chem. 2005, 91, 449–455. [CrossRef]
12. Rapparini, F.; Predieri, S. Pear Fruit Volatiles. In Horticultural Reviews; John Wiley & Sons, Inc.: Oxford, UK,2010; pp. 237–324.
13. Rizzolo, A.; Cambiaghi, P.; Grassi, M.; Zerbini, P.E. Influence of 1-Methylcyclopropene and StorageAtmosphere on Changes in Volatile Compounds and Fruit Quality of Conference Pears. J. Agric. Food Chem.2005, 53, 9781–9789. [CrossRef] [PubMed]
14. Kelebek, H.; Selli, S. Determination of volatile, phenolic, organic acid and sugar components in a Turkish cv.Dortyol (Citrus sinensis L. Osbeck) orange juice. J. Sci. Food Agric. 2011, 91, 1855–1862. [CrossRef] [PubMed]
15. Perestrelo, R.; Barros, A.S.; Rocha, S.M.; Câmara, J.S. Optimisation of solid-phase microextraction combinedwith gas chromatography–mass spectrometry based methodology to establish the global volatile signaturein pulp and skin of Vitis vinifera L. grape varieties. Talanta 2011, 85, 1483–1493. [CrossRef] [PubMed]
16. Bellincontro, A.; Nicoletti, I.; Valentini, M.; Tomas, A.; De Santis, D.; Corradini, D.; Mencarelli, F. Integrationof Nondestructive Techniques with Destructive Analyses to Study Postharvest Water Stress of Winegrapes.Am. J. Enol. Vitic. 2009, 60, 57–65.
17. Fenoll, J.; Manso, A.; Hellín, P.; Ruiz, L.; Flores, P. Changes in the aromatic composition of the Vitis viniferagrape Muscat Hamburg during ripening. Food Chem. 2009, 114, 420–428. [CrossRef]
18. Perestrelo, R.; Silva, C.; Silva, P.; Câmara, J.S. Unraveling Vitis vinifera L. grape maturity markers based onintegration of terpenic pattern and chemometric methods. Microchem. J. 2018, 142, 367–376. [CrossRef]
19. Porto-Figueira, P.; Freitas, A.; Cruz, C.J.; Figueira, J.; Câmara, J.S. Profiling of passion fruit volatiles:An effective tool to discriminate between species and varieties. Food Res. Int. 2015, 77, 408–418. [CrossRef]
20. Riu-Aumatell, M.; Castellari, M.; López-Tamames, E.; Galassi, S.; Buxaderas, S. Characterisation of volatilecompounds of fruit juices and nectars by HS/SPME and GC/MS. Food Chem. 2004, 87, 627–637. [CrossRef]

Molecules 2019, 24, 974 18 of 20
21. Alves Filho, E.G.; Rodrigues, T.H.S.; Fernandes, F.A.N.; de Brito, E.S.; Cullen, P.J.; Frias, J.M.; Bourke, P.;Cavalcante, R.S.; Almeida, F.D.L.; Rodrigues, S. An untargeted chemometric evaluation of plasma and ozoneprocessing effect on volatile compounds in orange juice. Innov. Food Sci. Emerg. Technol. 2017. [CrossRef]
22. Evelyn; Kim, H.J.; Silva, F.V.M. Modeling the inactivation of Neosartorya fischeri ascospores in apple juiceby high pressure, power ultrasound and thermal processing. Food Control 2016, 59, 530–537. [CrossRef]
23. Yi, J.; Kebede, B.T.; Hai Dang, D.N.; Buvé, C.; Grauwet, T.; Van Loey, A.; Hu, X.; Hendrickx, M. Qualitychange during high pressure processing and thermal processing of cloudy apple juice. LWT 2017, 75, 85–92.[CrossRef]
24. Kebede, B.; Lee, P.Y.; Leong, S.Y.; Kethireddy, V.; Ma, Q.; Aganovic, K.; Eyres, G.T.; Hamid, N.; Oey, I.A Chemometrics Approach Comparing Volatile Changes during the Shelf Life of Apple Juice Processed byPulsed Electric Fields, High Pressure and Thermal Pasteurization. Foods 2018, 7, 169. [CrossRef] [PubMed]
25. Gao, G.; Zhao, L.; Ma, Y.; Wang, Y.; Sun, Z.; Liao, X. Microorganisms and Some Quality of Red GrapefruitJuice Affected by High Pressure Processing and High Temperature Short Time. Food Bioprocess Technol. 2015,8, 2096–2108. [CrossRef]
26. Evelyn; Silva, F.V.M. High pressure processing pretreatment enhanced the thermosonication inactivation ofAlicyclobacillus acidoterrestris spores in orange juice. Food Control 2016, 62, 365–372. [CrossRef]
27. Mastello, R.B.; Janzantti, N.S.; Bisconsin-Júnior, A.; Monteiro, M. Impact of HHP processing on volatileprofile and sensory acceptance of Pêra-Rio orange juice. Innov. Food Sci. Emerg. Technol. 2018, 45, 106–114.[CrossRef]
28. Yuk, H.G.; Sampedro, F.; Fan, X.; Geveke, D.J. Nonthermal Processing of Orange Juice Using a Pilot-PlantScale Supercritical Carbon Dioxide System with a Gas-Liquid Metal Contactor. J. Food Process. Preserv. 2014,38, 630–638. [CrossRef]
29. Marszałek, K.; Wozniak, Ł.; Barba, F.J.; Skapska, S.; Lorenzo, J.M.; Zambon, A.; Spilimbergo, S. Enzymatic,physicochemical, nutritional and phytochemical profile changes of apple (Golden Delicious L.) juice undersupercritical carbon dioxide and long-term cold storage. Food Chem. 2018, 268, 279–286. [CrossRef] [PubMed]
30. Amaral, G.V.; Silva, E.K.; Costa, A.L.R.; Alvarenga, V.O.; Cavalcanti, R.N.; Esmerino, E.A.; Guimarães, J.T.;Freitas, M.Q.; Sant’Ana, A.S.; Cunha, R.L.; et al. Whey-grape juice drink processed by supercritical carbondioxide technology: Physical properties and sensory acceptance. LWT 2018, 92, 80–86. [CrossRef]
31. Silva, P.; Freitas, J.; Silva, C.L.C.L.; Perestrelo, R.; Nunes, F.M.F.M.; Câmara, J.S.J.S. Establishmentof authenticity and typicality of sugarcane honey based on volatile profile and multivariate analysis.Food Control 2016, 73, 1176–1188. [CrossRef]
32. Ivanova, V.; Stefova, M.; Vojnoski, B.; Stafilov, T.; Bíró, I.; Bufa, A.; Felinger, A.; Kilár, F. Volatile compositionof Macedonian and Hungarian wines assessed by GC/MS. Food Bioprocess Technol. 2013, 6, 1609–1617.[CrossRef]
33. Lee, S.-N.; Kim, N.-S.; Lee, D.-S. Comparative study of extraction techniques for determination of garlicflavor components by gas chromatography-mass spectrometry. Anal. Bioanal. Chem. 2003, 377, 749–756.[CrossRef] [PubMed]
34. Mendes, B.; Gonçalves, J.; Câmara, J.S. Effectiveness of high-throughput miniaturized sorbent- and solidphase microextraction techniques combined with gas chromatography-mass spectrometry analysis for arapid screening of volatile and semi-volatile composition of wines—A comparative study. Talanta 2012, 88,79–94. [CrossRef] [PubMed]
35. Belandria, V.; Aparecida de Oliveira, P.M.; Chartier, A.; Rabi, J.A.; de Oliveira, A.L.; Bostyn, S.Pressurized-fluid extraction of cafestol and kahweol diterpenes from green coffee. Innov. Food Sci.Emerg. Technol. 2016, 37, 145–152. [CrossRef]
36. Ochiai, N.; Sasamoto, K.; Takino, M.; Yamashita, S.; Daishima, S.; Heiden, A.C.; Hoffmann, A. Simultaneousdetermination of preservatives in beverages, vinegar, aqueous sauces, and quasi-drug drinks by stir-barsorptive extraction (SBSE) and thermal desorption GC–MS. Anal. Bioanal. Chem. 2002, 373, 56–63. [CrossRef][PubMed]
37. Uekane, T.M.; Nicolotti, L.; Griglione, A.; Bizzo, H.R.; Rubiolo, P.; Bicchi, C.; Rocha-Leão, M.H.M.;Rezende, C.M. Studies on the volatile fraction composition of three native Amazonian-Brazilian fruits:Murici (Byrsonima crassifolia L., Malpighiaceae), bacuri (Platonia insignis M., Clusiaceae), and sapodilla(Manilkara sapota L., Sapotaceae). Food Chem. 2017, 219, 13–22. [CrossRef] [PubMed]
Molecules 2019, 24, 974 19 of 20
38. Sentandreu, E.; Cerdán-Calero, M.; Sendra, J.M. Phenolic profile characterization of pomegranate(Punica granatum) juice by high-performance liquid chromatography with diode array detection coupled toan electrospray ion trap mass analyzer. J. Food Compos. Anal. 2013, 30, 32–40. [CrossRef]
39. Tempere, S.; Schaaper, M.H.; Cuzange, E.; de Lescar, R.; de Revel, G.; Sicard, G. The olfactory masking effectof ethylphenols: Characterization and elucidation of its origin. Food Q. Prefer. 2016, 50, 135–144. [CrossRef]
40. Granato, D.; Margraf, T.; Brotzakis, I.; Capuano, E.; van Ruth, S.M. Characterization of conventional,biodynamic, and organic purple grape juices by chemical markers, antioxidant capacity, and instrumentaltaste profile. J. Food Sci. 2015, 80, C55–C65. [CrossRef] [PubMed]
41. Spínola, V.; Perestrelo, R.; Câmara, J.S.; Castilho, P.C. Establishment of monstera deliciosa fruit volatilemetabolomic profile at different ripening stages using solid-phase microextraction combined with gaschromatography-mass spectrometry. Food Res. Int. 2015, 67, 409–417. [CrossRef]
42. Ferreira, V.; Aznar, M.; López, R.; Cacho, J. Quantitative gas chromatography-olfactometry carried out atdifferent dilutions of an extract. Key differences in the odor profiles of four high-quality Spanish aged redwines. J. Agric. Food Chem. 2001, 49, 4818–4824. [CrossRef] [PubMed]
43. Varming, C.; Petersen, M.A.; Poll, L. Comparison of isolation methods for the determination of importantaroma compounds in black currant (Ribes nigrum L.) juice, using nasal impact frequency profiling. J. Agric.Food Chem. 2004, 52, 1647–1652. [CrossRef] [PubMed]
44. Paduch, R.; Kandefer-Szerszen, M.; Trytek, M.; Fiedurek, J. Terpenes: Substances useful in human healthcare.Arch. Immunol. Ther. Exp. 2007, 55, 315–327. [CrossRef]
45. Miller, J.A.; Thompson, P.A.; Hakim, I.A.; Chow, H.-H.S.; Thomson, C.A. d-Limonene: A bioactive foodcomponent from citrus and evidence for a potential role in breast cancer prevention and treatment. Oncol. Rev.2011, 5, 31–42. [CrossRef]
46. Murali, R.; Karthikeyan, A.; Saravanan, R. Protective effects of D-limonene on lipid peroxidation andantioxidant enzymes in streptozotocin-induced diabetic rats. Basic Clin. Pharmacol. Toxicol. 2013, 112,175–181. [CrossRef] [PubMed]
47. Park, S.-N.; Lim, Y.K.; Freire, M.O.; Cho, E.; Jin, D.; Kook, J.-K. Antimicrobial Effect of Linalool andα-Terpineol Against Periodontopathic and Cariogenic Bacteria. Anaerobe 2012, 18, 369–372. [CrossRef][PubMed]
48. Li, Y.; Lv, O.; Zhou, F.; Li, Q.; Wu, Z.; Zheng, Y. Linalool inhibits LPS-induced inflammation in BV2 microgliacells by activating Nrf2. Neurochem. Res. 2015, 40, 1520–1525. [CrossRef] [PubMed]
49. Schmutzer, G.R.; Magdas, A.D.; David, L.I.; Moldovan, Z. Determination of the volatile components of applejuice using solid phase microextraction and gas chromatography–mass spectrometry. Anal. Lett. 2014, 47,1683–1696. [CrossRef]
50. Perez-Cacho, P.R.; Rouseff, R.L. Fresh Squeezed Orange Juice Odor: A Review. Crit. Rev. Food Sci. Nutr. 2008,48, 681–695. [CrossRef] [PubMed]
51. Perez-Cacho, P.R.; Rouseff, R. Processing and Storage Effects on Orange Juice Aroma: A Review. J. Agric.Food Chem. 2008, 56, 9785–9796. [CrossRef] [PubMed]
52. Arena, E.; Guarrera, N.; Campisi, S.; Nicolosi Asmundo, C. Comparison of odour active compoundsdetected by gas-chromatography–olfactometry between hand-squeezed juices from different orange varieties.Food Chem. 2006, 98, 59–63. [CrossRef]
53. Beaulieu, J.C.; Stein-Chisholm, R.E. HS-GC–MS volatile compounds recovered in freshly pressed ‘Wonderful’cultivar and commercial pomegranate juices. Food Chem. 2016, 190, 643–656. [CrossRef] [PubMed]
54. Beaulieu, J.C.; Stein-Chisholm, R.E.; Lloyd, S.W.; Bett-Garber, K.L.; Grimm, C.C.; Watson, M.A.; Lea, J.M.Volatile, anthocyanidin, quality and sensory changes in rabbiteye blueberry from whole fruit through pilotplant juice processing. J. Sci. Food Agric. 2017, 97, 469–478. [CrossRef] [PubMed]
55. Bai, J.; Baldwin, E.; McCollum, G.; Plotto, A.; Manthey, J.; Widmer, W.; Luzio, G.; Cameron, R. Changes involatile and non-volatile flavor chemicals of “Valencia” orange juice over the harvest seasons. Foods 2016, 5,4. [CrossRef] [PubMed]
56. Vázquez-Araújo, L.; Koppel, K.; Chambers, E., IV; Adhikari, K.; Carbonell-Barrachina, A.A. Instrumentaland sensory aroma profile of pomegranate juices from the USA: Differences between fresh and commercialjuice. Flavour Fragrance J. 2011, 26, 129–138. [CrossRef]
Molecules 2019, 24, 974 20 of 20
57. Qiao, Y.; Xie, B.J.; Zhang, Y.; Zhang, Y.; Fan, G.; Yao, X.L.; Pan, S.Y. Characterization of aroma activecompounds in fruit juice and peel oil of Jinchen sweet orange fruit (Citrus sinensis (L.) Osbeck) by GC-MSand GC-O. Molecules (Basel Switzerland) 2008, 13, 1333–1344. [CrossRef]
58. Edlin, D.A.N.; Narbad, A.; Dickinson, J.R.; Lloyd, D. The biotransformation of simple phenolic compoundsby Brettanomyces anomalus. FEMS Microbiol. Lett. 1995, 125, 311–315. [CrossRef]
59. Daud, M.N.H.; Ahamad, N.; Jabit, M.L.; Kormin, S. A new approach for reduction of chemical compoundscausing undesirable odour in Morinda citrifolia fruit juice. J. Trop. Agric. Food Sci. 2013, 41, 257–264.
60. Perestrelo, R.; Barros, A.S.A.S.; Rocha, S.M.; Câmara, J.S. Establishment of the varietal profile of Vitis viniferaL. grape varieties from different geographical regions based on HS-SPME/GC-qMS combined withchemometric tools. Microchem. J. 2014, 116, 107–117. [CrossRef]
61. van Den Dool, H. A generalization of the retention index system including linear temperature programmedgas—Liquid partition chromatography. J. Chromatogr. A 1963, 11, 463–471. [CrossRef]
62. Acree, T.; Arn, H. Flavornet Home Page. Available online: http://www.flavornet.org/ (accessed on14 February 2019).
63. Chong, J.; Soufan, O.; Li, C.; Caraus, I.; Li, S.; Bourque, G.; Wishart, D.S.; Xia, J. MetaboAnalyst 4.0: Towardsmore transparent and integrative metabolomics analysis. Nucleic Acids Res. 2018, 46, W486–W494. [CrossRef][PubMed]
Sample Availability: Samples of the compounds are not available from the authors.
© 2019 by the authors. Licensee MDPI, Basel, Switzerland. This article is an open accessarticle distributed under the terms and conditions of the Creative Commons Attribution(CC BY) license (http://creativecommons.org/licenses/by/4.0/).