using!high(throughputdna!sequencingand! molecular ...€¦ · ! i!!...
TRANSCRIPT

i
Using high-‐throughput DNA sequencing and
molecular phylogenies to investigate the
evolution and biogeography of the southern
hemisphere fauna
Kieren James Mitchell
Australian Centre for Ancient DNA
School of Biological Sciences
Faculty of Sciences
University of Adelaide
Thesis submitted in fulfilment of the requirements for the degree of
Doctor of Philosophy
June 2015


iii
TABLE OF CONTENTS
THESIS ABSTRACT ..................................................................................................................... v
THESIS DECLARATION ........................................................................................................... vii
Publications ............................................................................................................................................................... ix
ACKNOWLEDGEMENTS ............................................................................................................ xi
CHAPTER 1: General Introduction ....................................................................................... 1
Background ................................................................................................................................................................ 3 Southern hemisphere biogeography ............................................................................................................... 5 Phylogenetics for biogeographical hypothesis testing ............................................................................ 8 Ancient DNA and next-‐generation sequencing ........................................................................................ 13 Pros and cons of mitochondrial DNA ........................................................................................................... 18 Summary .................................................................................................................................................................. 23 Thesis Overview .................................................................................................................................................... 24 References ............................................................................................................................................................... 29
CHAPTER 2: Molecular phylogeny, biogeography, and habitat preference
evolution of marsupials ........................................................................................................ 41
Supplementary Information ............................................................................................................................ 57
CHAPTER 3: Ancient DNA reveals elephant birds and kiwi are sister taxa and
clarifies ratite bird evolution .............................................................................................. 77
Supplementary Information ............................................................................................................................ 85
CHAPTER 4: Origin and evolution of the New Zealand wrens (Acanthisittidae)
..................................................................................................................................................... 127
Abstract ................................................................................................................................................................... 131 Introduction .......................................................................................................................................................... 132 Results ..................................................................................................................................................................... 136 Discussion .............................................................................................................................................................. 145 Methods .................................................................................................................................................................. 151 Acknowledgements ............................................................................................................................................ 164 References ............................................................................................................................................................. 165 Supplementary Information .......................................................................................................................... 173

iv
CHAPTER 5: Ancient mitochondrial genome reveals unsuspected taxonomic
affinity of the extinct Chatham duck (Pachyanas chathamica) and resolves
divergence times for New Zealand and sub-‐Antarctic brown teals ..................... 183
Supplementary Information .......................................................................................................................... 197
CHAPTER 6: An extinct nestorid parrot (Aves, Psittaciformes, Nestoridae) from
the Chatham Islands, New Zealand ................................................................................. 207
Supplementary Information .......................................................................................................................... 227
CHAPTER 7: Ancient DNA analyses of mammalian megafauna from La
Chumbiada (Argentina; South America) ....................................................................... 229
Abstract ................................................................................................................................................................... 231 Introduction .......................................................................................................................................................... 232 Methods .................................................................................................................................................................. 238 Results ..................................................................................................................................................................... 250 Discussion .............................................................................................................................................................. 258 References ............................................................................................................................................................. 263 Supplementary Information .......................................................................................................................... 269
CHAPTER 8: General discussion and concluding remarks ..................................... 273
Summary, synthesis and significance ........................................................................................................ 275 Limitations of single loci .................................................................................................................................. 280 Building better datasets ................................................................................................................................... 289 Inferring accurate evolutionary timescales ............................................................................................ 294 Future directions ................................................................................................................................................ 306 Conclusion ............................................................................................................................................................. 312 References ............................................................................................................................................................. 314
APPENDIX: Molecular dating, genomic data, and the temporal origin of modern
birds .......................................................................................................................................... 327
Abstract ................................................................................................................................................................... 329 Introduction .......................................................................................................................................................... 330 Methods .................................................................................................................................................................. 332 Results ..................................................................................................................................................................... 335 Discussion .............................................................................................................................................................. 340 Acknowledgements ........................................................................................................................................... 342 References ............................................................................................................................................................. 343 Supplementary Information .......................................................................................................................... 346

v
THESIS ABSTRACT Biogeography is the study of how and why organisms are distributed the way they
are, and is consequently intimately tied to evolution. By investigating biogeographic
patterns we can learn more about fundamental evolutionary processes and the
history of life on Earth. Molecular phylogenies are an invaluable tool for
biogeographical hypothesis testing, allowing the relationships among taxa to be
confidently reconstructed and the timescale of their evolution to be estimated.
However, many biogeographic hypotheses have not been extensively evaluated in a
phylogenetic context due to difficulties associated with obtaining sufficient nucleotide
sequence data to construct adequately resolved phylogenies. In the past, a major
obstacle to this process was the amount of labour and expense involved in generating
large quantities of sequence data. However, the recent advent of high-‐throughput
sequencing has revolutionised the collection of nucleotide sequence data, greatly
decreasing the costs associated with generating large nucleotide sequence datasets.
A second problem for building molecular phylogenies is obtaining sequence
data from degraded sub-‐fossil remains of extinct species. A large proportion of the
world’s terrestrial megafauna became extinct within the last fifty thousand years, and
understanding the relationships of these species to their extant relatives is crucial for
testing many biogeographical and evolutionary hypotheses. While high-‐throughput
sequencing provides many benefits for the sequencing of ancient DNA, methods are
still required to increase the concentration of target endogenous molecules in order
to make sequencing cost-‐effective. One solution to this problem is hybridisation
enrichment.

vi
In this thesis I use both hybridisation enrichment and high-‐throughput
sequencing to gather nucleotide sequence data from a range of extant and extinct
southern hemisphere species in order to construct well resolved phylogenies. I
sequence near-‐complete mitochondrial genomes from extinct elephant birds from
Madagascar (Aepyornis and Mullerornis), acanthisittid wrens from New Zealand
(Pachyplichas, Traversia and Xenicus), the Chatham Island duck (Pachyanas), and
South American horses (Hippidion) and glyptodontids (Glyptodon). I am also able to
retrieve fragments of mitochondrial DNA from the previously undescribed (extinct)
Chatham Islands parrot. In addition to data from these extinct species, I obtain
mitochondrial genomes from 69 extant marsupial species, tripling the number of
marsupials for which mitochondrial genomes are available. Using these new data I
investigate how patterns of bird and mammal distribution have been influenced by
important geological events that shaped the southern hemisphere over the past 100
million years: the breakup of Gondwana during the Cretaceous, Palaeocene and
Eocene; the submergence of Zealandia in the Oligocene; the emergence of New Guinea
and Wallacea beginning in the Miocene; and formation of the Isthmus of Panama and
emergence of the Chatham Islands archipelago in the Pliocene. Ultimately, I resolve
several long-‐standing evolutionary mysteries, most prominently the geographical
origin of the flightless ratite birds: I demonstrate that their modern distribution is the
result of overwater dispersal by flighted ancestors rather than Gondwanan vicariance
as traditionally thought. I also highlight how taxon sampling, model choice, and
calibration of the molecular clock can impact our evaluation of different
biogeographical and evolutionary scenarios.

vii
THESIS DECLARATION I certify that this work contains no material which has been accepted for the award of
any other degree or diploma in my name in any university or other tertiary
institution and, to the best of my knowledge and belief, contains no material
previously published or written by any other person, except where due reference has
been made in the text. In addition, I certify that no part of this work will, in the future,
be used in a submission in my name for any other degree or diploma in any university
or other tertiary institution without the prior approval of the University of Adelaide
and where applicable, any partner institution responsible for the joint-‐award of this
degree.
I give consent to this copy of my thesis when deposited in the University
library, being made available for loan and photocopying, subject to the provisions of
the Copyright Act 1968.
The author acknowledges that copyright of published works contained within
this thesis (as listed below) resides with the copyright holder(s) of those works.
I also give permission for the digital version of my thesis to be made available
on the web, via the University’s digital research repository, the Library Search and
also through web search engines, unless permission has been granted by the
University to restrict access for a period of time.
…………………………………………. ………………………………….. Kieren James Mitchell Date


ix
Publications
Mitchell, K.J., Pratt, R.C., Watson, L.N., Gibb, G.C., Llamas, B., Kasper, M., Edson,
J., Hopwood, B., Male, D., Armstrong, K.N., Meyer, M., Hofreiter, M., Austin, J.,
Donnellan, S.C., Lee, M.S.Y., Phillips, M.J., Cooper, A., 2014. Molecular
phylogeny, biogeography, and habitat preference evolution of marsupials.
Molecular Biology and Evolution 31 (9), 2322-‐2330
Mitchell, K.J., Llamas, B., Soubrier, J., Rawlence, N.J., Worthy, T.H., Wood, J.,
Lee, M.S.Y., Cooper, A., 2014. Ancient DNA reveals elephant birds and kiwi are
sister taxa and clarifies ratite bird evolution. Science 344, 898-‐900.
Mitchell, K.J., Wood, J.R., Scofield, R.P., Llamas, B., Cooper, A., 2014. Ancient
mitochondrial genome reveals unsuspected taxonomic affinity of the extinct
Chatham duck (Pachyanas chathamica) and resolves divergence times for New
Zealand and sub-‐Antarctic brown teals. Molecular Phylogenetics and Evolution
70, 420-‐428.
Wood, J.R., Mitchell, K.J., Scofield, R.P., Tennyson, A.J.D., Fidler, A.E.,
Wilmshurst, J.M., Llamas, B., Cooper, A., 2014. An extinct nestorid parrot (Aves,
Psittaciformes, Nestoridae) from the Chatham Islands, New Zealand. Zoological
Journal of the Linnean Society 172, 185-‐199.


xi
ACKNOWLEDGEMENTS Firstly I would like to thank my principal supervisor, Alan Cooper, for giving me the
opportunity to work at ACAD, and for his great advice and tuition during my
candidature. I’d also like to thank my other supervisors Mike Lee and Matt Phillips for
always being available to discuss theoretical and practical issues, and providing
valuable feedback on my work.
Thanks to everyone at ACAD (past and present) for maintaining a supporting
and collaborative work environment, providing guidance, and partaking in
constructive and informative discussions. I would particularly like to acknowledge:
Bastien Llamas, Jess Metcalf, Kyle Armstrong, Steve Richards, Janette Edson and
Jeremy Austin for their direct tutelage in the wet lab; Bastien Llamas (again), Julien
Soubrier and Jimmy Breen for their help with bioinformatics and computer analyses;
and Maria Lekis for her tireless administrative efforts. Thanks also to all my
collaborators outside of ACAD, both local and international – your assistance has
been invaluable.
For providing the financial resources necessary to complete the work I have
undertaken I would like to thank the Australian Research Council and the New
Zealand Marsden Fund Council, and therefore ultimately the tax-‐paying public (both
of Australia and New Zealand).

xii
I would also like to thank all of my amazing friends, fellow PhD students, and
partner Laurati, for their patience, camaraderie, sympathy, understanding and moral
support over the last few years.
Finally I would like to thank my biggest fans and number one supporters, my
parents Jim and Sally, for their moral and financial support not only throughout my
candidature but also in getting me to the point where I could undertake a PhD in the
first place. None of my personal achievements could have been possible without their
effort, and they have my eternal love and gratitude.

1
CHAPTER 1:
General Introduction
CHAPTER 1: General Introduction


3
CHAPTER 1: General Introduction
Background
It can be readily observed that groups of closely related species occupy distinct
geographic ranges. For example, marsupial mammals are restricted in distribution to
the Americas and Australasia, penguins are almost exclusive to the southern
hemisphere, and all living species of lemur are restricted to Madagascar. Such
observations were instrumental in the original conception of biological evolution.
Charles Darwin recorded that endemic species found on many oceanic islands bear
close resemblance to species present on nearby continents (Darwin 1859): “The
inhabitants of the Cape de Verde Islands are related to those of Africa, like those of
the Galapagos to America. I believe this grand fact can receive no sort of explanation
on the ordinary view of independent creation…” Alfred Wallace noted similar
patterns of distribution for which there existed no satisfactory explanation (Wallace
1855): “Why are the genera of the Palms and of Orchids in almost every case confined
to one hemisphere? Why are the closely allied species of brown-‐backed Trogons all
found in the East, and the green-‐backed in the West? Why are the Macaws and the
Cockatoos similarly restricted?” Even before he and Darwin independently inferred
the mechanism of natural selection, Wallace proposed a law governing the origin and
distribution of species (Wallace 1855): “Every species has come into existence
coincident both in space and time with a pre-‐existing closely allied species.” This
principle provided a biological explanation for geographical patterns exhibited by
higher taxa: the distribution of a species reflects its evolutionary history.
4
Biogeography is the study of species distributions through time, and integrates
aspects of geology, geography, ecology and climatology (Gunnell 2013; Wen, et al.
2013). Geology and geography both place obvious physical restrictions on the
distributions of organisms. For example, animals that are not predisposed to fly or
swim long distances will rarely be found on isolated volcanic islands or coral atolls. In
addition, animals and plants may only survive in an area with a suitable climate and
ecology: rainfall, temperature, food availability and competition with other species all
play a role in determining species distributions. However, the interaction between
organisms and their environment is ultimately determined by their evolutionary
history. Consequently, biogeographic patterns may provide valuable insights into
many evolutionary questions. Striking biogeographic patterns can be observed in
many elements of the southern hemisphere biota, so it is little wonder that the
evolutionary thinking of both Darwin and Wallace was so heavily influenced by their
travels in that region (see Gunnell 2013).

5
Southern hemisphere biogeography
The principal geological event leading to the current arrangement of the major
southern hemisphere landmasses was the breakup of the supercontinent Gondwana
(Schellart, et al. 2006; Blakey 2008; Ali and Krause 2011). Around 120 million years
ago (mya) the emergent land that now forms Africa, Antarctica, Australia, India,
Madagascar, New Zealand and South America was contiguous. Subsequently, plate
tectonics caused the southern landmasses to gradually break apart and drift to their
current positions while India moved rapidly north and collided with Asia, forming the
Himalayas. Many animal and plant groups are distributed across the now separate
southern fragments. For example, primates are found in South America, Africa and
Madagascar, as well as Asia in the northern hemisphere (Springer, et al. 2012;
Gunnell 2013). From a biogeographic perspective there are several possibilities:
either primates were already distributed across these landmasses and began to
evolve independently once they became separated (vicariance), ancestral primates
dispersed across the ocean after the landmasses became isolated (dispersal), or a
combination of both. A similar pattern can be observed in the ratites, a group of large
flightless birds (Cooper, et al. 2001; Haddrath and Baker 2001; Johnston 2011;
Haddrath and Baker 2012): the emu and cassowary from Australia, rhea from South
America, ostrich from Africa, kiwi from New Zealand, and the recently extinct moa
from New Zealand and elephant birds from Madagascar. Since these birds, being
flightless, are apparently ill suited to dispersal, they have long been a textbook
example of vicariant speciation. However, the mechanism underlying the distribution
of many other groups (including the primates) is more contentious.
6
The southern hemisphere also contains a large number of small isolated
islands with high proportions of endemic fauna, including Lord Howe Island and the
Chatham Islands archipelago. We can be certain from the relatively young
palaeogeographic history of many of these landmasses that their entire fauna must
have descended from dispersing colonists (e.g. McDougall, et al. 1981; Campbell
2008; Campbell, et al. 2008), leaving biogeographers with only the question of where
these colonists originated from. However, competing hypotheses of vicariance versus
dispersal do surround some of the southern hemisphere’s smaller islands. Of
particular interest to biogeographers is Wallacea (Metcalfe, et al. 2001): a group of
mainly Indonesian islands separated by deep straits from nearby islands on the
Australian continental shelf to the east and the Asian continental shelf to the west.
While the islands to the east and west have fauna characteristic of their respective
plate, the Wallacean islands support a mixture of members from conventionally
Australian and Asian groups. For example, Sulawesi (the largest island in Wallacea) is
home to both marsupials (typical of Australia) and primates (typical of Asia).
Biogeographers spent the latter half of the 19th century and the beginning of the 20th
century attempting to draw a line through Wallacea dividing the islands into an Asian
and Australian portion based on the distribution of “Australian” and “Asian”
mammals, birds and insects (e.g. Wallace's line; reviewed in Simpson 1977). In reality
no such discrete boundary exists, and would not be expected to given what we know
of the region’s geological history (van Ufford and Cloos 2005; Hall 2013). The
Wallacean islands have never been closely associated with either bordering plate,
instead emerging from the ocean as a result of uplift and volcanism over the last 25
million years (van Ufford and Cloos 2005). Early in this period, land connection with
the Australian shelf likely occurred briefly through either a continental promontory

7
(Hall 2013) or an accreted terrane (Metcalfe, et al. 2001), but the islands have been
isolated by deep water ever since. The Wallacean region itself has been very active
tectonically and many of the individual islands have likely been connected and
separated at some point during their history (Hall 2013). However, the exact
palaeogeography is uncertain. Studying the resulting biogeographic patterns may not
only reveal the evolution and origins of the Wallacean fauna, but also help to
reconstruct the geological history of the region.

8
Phylogenetics for biogeographical hypothesis testing
In order to answer biogeographical questions such as those above we must first
determine the precise relationship between organisms (Crisp, et al. 2011). For
example, it was the discovery of a close relationship between the Galapagos and
American flycatchers, mockingbirds and doves that caused Darwin to realise that
much of the Galapagos fauna had descended from American colonists (Sulloway
1982). Historically, relationships among species were determined on the somewhat
subjective basis of overall morphological similarity. The modern discipline concerned
with inferring these relationships is phylogenetics: the creation of bifurcating
evolutionary trees (phylogenies) based on changes in homologous characters
(reviewed in Lemey, et al. 2009; Roy, et al. 2014). Character similarities and
differences inherited by descendants of a common ancestor allow relationships to be
inferred, and thus the branching order of the phylogeny to be determined. Each node
on a phylogeny represents a common ancestor while each tip represents a sampled
species; more closely related species share a more recent common ancestor.
Compared with earlier subjective approaches, quantitative phylogenetic approaches
have the advantage of being more rigorous, objective and repeatable, as well as
allowing the strength of inferred relationships to be evaluated statistically. While
morphological characters can still be readily used in this framework, and frequently
are (e.g. Lee, et al. 2014), most recent phylogenetic studies focus on molecular data.
By far the most commonly employed molecular data today are nucleotide sequences.
Nucleotide sequence data obtained from a homologous gene in different organisms
can be compared and each site (A, C, G, or T) treated as a single character.

9
A major advantage of nucleotide sequence data over morphological data for
phylogenetic inference is the sheer number of characters available (Hillis 1987). The
majority of morphological data matrices comprise at most a few hundred characters
(e.g. Worthy, et al. 2010; Beck 2012; Worthy and Scofield 2012), with exceptional
datasets having a few thousand (O'Leary, et al. 2013), while the genome of an
organism can contain billions of nucleotide sites (though typically only a relatively
tiny subset are sampled: see Chapter 8). Generally speaking, analysing a greater
number of variable characters provides greater confidence in the branching order of
the inferred phylogeny, since each branching event will be based on more characters.
Consequently, phylogenies inferred from nucleotide sequence data are generally
much better resolved than morphological phylogenies. Additionally, most
phylogenetic methods assume that the states of all sampled characters are
independent, which is often a problem for morphological characters (Sharon and
Hastings 1998). While nucleotide characters may sometimes be non-‐independent
(Nasrallah, et al. 2011), this seems to be less common than for morphology. Another
advantage of nucleotide sequence data over morphology is that certain homologous
genes can be found shared across almost the entire tree of life, whereas
morphological characters can generally only be measured for a narrow subset of taxa
(Hillis 1987). This makes nucleotide sequence data more widely comparable than
morphological data. Finally, adaptation to similar environments and ecological niches
can cause convergent evolutionary changes in otherwise only distantly related
species. Convergence is much more likely to mislead phylogenetic inference based on
morphological characters than nucleotide sequence data (e.g. Sibley and Ahlquist
1987; Doolittle 1994; Hedges and Sibley 1994; Hedges and Maxson 1996), though in
some cases convergent sequence evolution may occur (Parker, et al. 2013).

10
The evolutionary dynamics of nucleotide sequences have now been well
characterised, and a large number of probabilistic models are available for analysing
sequence data in a phylogenetic context (Strimmer and von Haessler 2003). These
models can allow for differing likelihoods of each class of substitution, different
stationary frequencies of each individual nucleotide, and rate heterogeneity among
different nucleotide sites. A valuable addition to these models of evolution is the
incorporation of the molecular clock, which allows a phylogeny to be calibrated to an
absolute timescale (Ho 2007, 2009, 2014). Kimura (1968) posited that most
nucleotide substitutions are selectively neutral and thus accumulate in the genome at
a steady rate influenced only by the mutation rate. This would mean that the time of
divergence between two taxa could be simply estimated using their relative genetic
distance, assuming that substitutions occurred according to a constant probabilistic
clock. In reality, the mutation rate varies across lineages (e.g. Martin and Palumbi
1993), and so the rate of evolution cannot be assumed to be constant. However,
relaxed clock models have been devised, which allow the rate of evolution to vary
among lineages (Drummond, et al. 2006). The most commonly used molecular dating
methods employ a Bayesian framework in which the age of key nodes on a phylogeny
are constrained according to some prior knowledge (Drummond and Rambaut 2007;
Yang 2007; Ronquist, et al. 2012), usually from the fossil record (Benton and
Donoghue 2007; Donoghue and Benton 2007). For example, the oldest know penguin
Waimanu is around 61 million years old (Slack, et al. 2006), meaning that the
divergence between penguins and their nearest relatives, the albatrosses and petrels
(Jarvis, et al. 2014), must have occurred prior to this time. Rates of evolution and
divergence times can be estimated for all nodes on the phylogeny using the temporal
data from one or more constrained nodes.

11
Using time-‐calibrated molecular phylogenies, biogeographers and
evolutionary biologists have moved far beyond the foundational work of Darwin and
Wallace. Many software packages exist that use a time-‐calibrated phylogeny and the
distribution of living species to infer the distribution of ancestral species (e.g. Pagel,
et al. 2004; Ree and Smith 2008). These methods can be useful for determining the
geographical origin of island colonists (e.g. Kuriyama, et al. 2011; Fabre, et al. 2012).
We can infer that colonisation occurred coincident with (or at some time following)
the divergence of the colonist lineage from taxa remaining in the ancestral source
region (Crisp, et al. 2011). Further, we can assume that endemic radiation of the
colonist lineage occurred following colonisation. This allows a temporal window of
colonisation to be identified. For example, the ancestral Darwin’s finch must have
dispersed to the Galapagos no earlier than its divergence from its nearest living
mainland American relatives but no later than the point when it began to diversify
into the many forms we observe today. Temporal windows of colonisation can be
compared among different groups, and to known geological events, to test specific
biogeographical scenarios.
Certain complex biogeographical scenarios predict a very specific timing and
order of divergences among species (Crisp, et al. 2011). One example is the
distribution of members of a group across the major southern hemisphere
landmasses and the competing hypotheses of Gondwanan vicariance and
transoceanic dispersal. Africa and Madagascar were the first of the southern
landmasses to become isolated from the rest (Blakey 2008; Ali and Krause 2011), so
the vicariance hypothesis predicts that: A) members of a group distributed in South
America, Australia and New Zealand should be more closely related to each other
12
than to African and Madagascan members of the same group, and B) the origin of the
African and Madagascan lineages should predate the separation of these landmasses
approximately 100 mya. When these predications were tested for the primates it was
discovered that the divergences between the South American, African, and
Madagascan primates occurred much more recently than expected if their
distribution was the result of vicariance (Springer, et al. 2012; Gunnell 2013). Thus, it
appears that the ancestors of both the South American monkeys and the Madagascan
lemurs in fact dispersed from Africa over the Atlantic Ocean and the Mozambique
Channel, respectively, to reach their current homelands. This hypothesis could only
be rigorously tested because DNA sequence data is available for primates from all
three regions. While obtaining these data was relatively straightforward for the
primates because each relevant group contains living representatives, it can be a
problem for other groups when some taxa necessary for testing a hypothesis are
extinct and represented only by fossil or sub-‐fossil material.

13
Ancient DNA and next-‐generation sequencing
A large proportion of the world’s terrestrial megafauna became extinct within the last
fifty thousand years (Barnosky, et al. 2004; Prescott, et al. 2012; Stegner and Holmes
2013). Understanding the origin of these species is crucial for testing many
biogeographical and evolutionary hypotheses. For example, two groups of flightless
ratites became extinct only recently: moa from New Zealand (13th century; Allentoft,
et al. 2014) and elephant birds from Madagascar (after the 11th century, possibly as
late as the 17th century; Hawkins and Goodman 2003). Without knowing their
phylogenetic position it is impossible to rigorously test the hypothesis of Gondwanan
vicariance as has been done for primates. Because these species became extinct only
very recently it is theoretically possible to sequence DNA from sub-‐fossil remains, but
this process is much more difficult than for living organisms from which fresh DNA
samples can be obtained (reviewed in Hofreiter, et al. 2001). Ancient DNA (aDNA)
extracted from sub-‐fossil remains (e.g. bones, teeth) is generally a mixture of
endogenous DNA from the target organism and exogenous DNA from bacteria and
other environmental sources. The endogenous DNA is usually at such a low relative
concentration that it must be worked on in specially designed clean facilities with
stringent decontamination protocols in order to avoid contamination with modern
DNA and PCR (polymerase chain reaction) products (Cooper and Poinar 2000).
Further, endogenous DNA molecules are usually degraded and suffer from both post-‐
mortem fragmentation and chemical base modifications, principally deamination and
depurination (Lindahl 1993; Briggs, et al. 2007; Sawyer, et al. 2012). For this reason,
researchers have typically been forced to PCR amplify aDNA in short fragments, often
only around 100 base pairs (bp) in length. Since chemical damage can result in
14
nucleotide misincorporation during PCR and sequencing, PCR replicates must be
performed to ensure that multiple template molecules are sequenced, which are
unlikely to share the same damage pattern (Cooper and Poinar 2000). While all
ancient samples suffer some degree of degradation, the age and thermal history of
each sample partially determine the difficulty of isolating endogenous DNA (Smith, et
al. 2003; Allentoft, et al. 2012): recent remains generally have better preservation
than older remains, while remains from colder environments are generally better
preserved than those from warmer environments. Thus, previous studies have been
reasonably successful in sequencing DNA from moa remains from cold, dry sites in
New Zealand (Cooper, et al. 2001; Haddrath and Baker 2001; Haddrath and Baker
2012) but have had little success with elephant bird remains, which usually come
from warmer, swampy sites in Madagascar (see Cooper, et al. 2001).
While taxon sampling is an important consideration for hypothesis testing, the
resulting phylogeny must also be well resolved. This requires sampling a sufficient
number of characters for each taxon, such that enough changes are recorded along
each branch to be confident of the inferred branching order. However, sequencing
large numbers of genes using traditional PCR and Sanger sequencing is a laborious
process even without the additional disadvantages of aDNA. High-‐throughput
sequencing has revolutionised the collection of gene sequence data. High-‐throughput
sequencing technologies allow huge numbers of DNA molecules to be individually
sequenced quickly, accurately and at a comparatively low cost per base (van Dijk, et
al. 2014). For example, the IonTorrent PGM (Life Technologies) can produce up to 2
Gb of data in less than eight hours. While this has greatly increased the amount of
data that can be sequenced from extant organisms (e.g. Jarvis, et al. 2014), next-‐

15
generation machines are also very well suited to sequencing ancient DNA (Knapp and
Hofreiter 2010; Rizzi, et al. 2012). The short read-‐length of most machines does not
present a disadvantage for ancient DNA, as endogenous DNA molecules are already
highly fragmented: usable DNA sequences may be confidently identified at lengths
down to around 25-‐30 bp (Prufer, et al. 2010; Meyer, et al. 2012; Orlando, et al.
2013), and many endogenous aDNA molecules are little larger (Noonan, et al. 2005;
Briggs, et al. 2009; Rasmussen, et al. 2010). Most high-‐throughput sequencing
platforms are capable of sequencing such small molecules, providing access to the
maximum amount of usable information from an aDNA extract. The huge number of
molecules sequenced by high-‐throughput sequencing also largely overcomes the
problem of post-‐mortem damage in aDNA: so many individual molecules are
sequenced that the damaged sites are usually easy to identify. Similarly, mixed
templates and contamination can also be identified without the need for costly and
time-‐consuming bacterial cloning.
Shotgun sequencing is the most straightforward approach to high-‐throughput
sequencing: simply sequencing a random sample of molecules from a DNA extract.
This approach has been used to successfully sequence whole genomes from a range of
living organisms (e.g. Jarvis, et al. 2014). It has also been used to sequence genomic
data from a number of exceptionally well-‐preserved ancient specimens (e.g. Miller, et
al. 2008; Rasmussen, et al. 2010; Meyer, et al. 2012). However, for many ancient DNA
extracts the concentration of endogenous DNA is too low to make shotgun sequencing
economical (Knapp and Hofreiter 2010). It is not uncommon for endogenous DNA to
comprise less than 1% of an extract (e.g. Skoglund, et al. 2012), in which case 99% of
sequencing effort would be wasted on sequencing non-‐target DNA. Further, in many

16
cases only a subset of the whole genome is desired in order to test a hypothesis,
making shotgun sequencing even less efficient even for studies of extant species. In
these situations, a method for increasing the relative concentration of target
endogenous molecules is required in order to make high-‐throughput sequencing cost-‐
effective.
PCR can be used to enrich a DNA extract for target molecules prior to high-‐
throughput sequencing. By amplifying large (several kilobases) stretches of the target
region via long-‐range PCR, and then shearing the resulting molecules into small
fragments compatible with high-‐throughput sequencing sequencers, large quantities
of data can be efficiently produced for many samples in parallel (Meyer, et al. 2007).
However, for aDNA this approach still faces one of the main problems for traditional
sequencing approaches: the short average fragment length of aDNA molecules. While
in some cases this may be circumvented by multiplex PCR targeting many short
fragments simultaneously (Stiller, et al. 2009), this would be extremely laborious to
implement for non-‐model organisms. Even then, PCR can realistically only target
molecules of around 100 bp or more while the longest fragments in DNA extracts
from some highly degraded remains is only 70 bp (Noonan, et al. 2005; Briggs, et al.
2009; Rasmussen, et al. 2010). Consequently, a PCR-‐based approach to high-‐
throughput sequencing does not allow us to take full advantage of the ability to
sequence extremely short endogenous molecules.
Hybridisation enrichment allows the relative concentration of specific
molecules within a DNA extract to be increased without the use of targeted PCR
(Hodges, et al. 2007; St John and Quinn 2008; Gnirke, et al. 2009; Horn 2012). This

17
technique involves incubating the pool of extracted DNA molecules with a selection of
short synthetic DNA or RNA bait molecules (either in solution or as part of a solid
array) that are complementary to the regions of interest. Target molecules anneal to
the baits, allowing unbound non-‐target molecules to be removed with a series of
washes. The annealed molecules can then be released from the baits, resulting in an
enriched pool of molecules in which the relative concentration of the regions of
interest has been increased. Consequently, sequencing the products of hybridisation
enrichment is much more cost-‐effective than shotgun sequencing for samples where
the relative concentration of targets is low, such as for highly degraded remains. An
additional advantage of hybridisation enrichment is that, unlike conventional PCR
based methods, it allows sequence information to be obtained from target molecules
as short as 25 bp. A final advantage of hybridisation enrichment is that the bait
molecule sequences need not be completely identical to the target gene regions,
meaning that this approach can be used for de novo sequencing (Mason, et al. 2011;
Li, et al. 2013). Hybridisation enrichment and high-‐throughput sequencing thus open
up a range of new possibilities for studying aDNA.
18
Pros and cons of mitochondrial DNA
Many past PCR-‐based aDNA studies have focused on mitochondrial DNA sequences
(e.g. Cooper 1994; Cooper, et al. 2001; Haddrath and Baker 2001; Barnes, et al. 2002;
Lambert, et al. 2002; Burger, et al. 2004; Shapiro, et al. 2004; Orlando, et al. 2009;
Barnett, et al. 2014), and the mitochondrial genome (mitogenome) is also a good
target for hybridisation enrichment techniques for similar reasons. Firstly,
mitogenomes have a much higher copy-‐number than the nuclear genome: while a cell
only contains two copies of the nuclear genome it may contain thousands of
mitochondria, which each contain multiple copies of the mitogenome. As a
consequence, mitochondrial DNA molecules are generally overrepresented in aDNA
extracts. By length the mitogenome makes up only 0.0004% of the average complete
mammal genome (~17 kilobases versus 2.8 – 4 gigabases; Knapp and Hofreiter
2010), while in some aDNA extracts mitochondrial DNA may account for up to 1.99%
of molecules (Gilbert, et al. 2007). This means that much less sequencing effort need
be expended in order to reconstruct a high-‐quality mitogenome sequence compared
to a nuclear locus of similar length. There is also some evidence to suggest that
hybridisation enrichment yields a greater relative increase in concentration of target
molecules when the starting concentration of target molecules is already relatively
high (Carpenter, et al. 2013). Although this apparent correlation has not been
extensively explored, it would constitute an additional argument for targeting
mitochondrial DNA from highly degraded samples. A second advantage of
mitochondria for aDNA is their conserved structure: for most vertebrates the
mitogenome is approximately 17 kilobases long and encodes two RNAs, 22 tRNAs,
and 13 peptides that are involved in electron transport (Moritz, et al. 1987). This is an

19
important consideration for de novo sequencing as it makes primer design easier for
PCR-‐based methods, and bait molecule design easier for hybridisation enrichment.
The conserved structure and gene order of the mitogenome also provides a scaffold
for bioinformatically assembling high-‐throughput sequencing data.
An additional advantage of mitochondria, specifically for phylogenetic studies
of animals, is that mitochondrial genes have a higher evolutionary rate than nuclear
genes (e.g. Brown, et al. 1979; Moritz, et al. 1987). This means that for a given number
of nucleotides sequenced, mitochondrial genes will generally record more changes
than nuclear genes per unit of time (Rubinoff and Holland 2005). More changes
recorded mean a greater chance of observing synapomorphies for a given branch,
resulting in an increase in the strength of inferred relationships. However, this high
evolutionary rate can also be a disadvantage. Over time, quickly evolving nucleotide
sites will undergo multiple consecutive changes. While probabilistic models of
nucleotide evolution can partially account for superimposed substitutions, eventually
these sites will become saturated and phylogenetic signal will be diminished
(Strimmer and von Haessler 2003). Saturation can affect branch length estimation
(e.g. Hugall and Lee 2004; Phillips 2009) and mislead phylogenetic inference in cases
where some taxa display base composition bias (Phillips and Penny 2003; Gibson, et
al. 2005). Fortunately, methods exist to detect saturation (e.g. Xia, et al. 2003; Xia and
Lemey 2009). The effects of saturation can then be mitigated by either excluding the
affected sites or by recoding the data to increase the signal-‐to-‐noise ratio. RY-‐coding
pools together the four bases into two: purines (A and G: R) and pyrimidines (C and
T: Y). This overcomes problems with commonly observed AT versus CG biases. RY-‐
coding also lessens the erosion of phylogenetic signal, as transitions are effectively

20
ignored: transitions (purine replacing another purine, or pyrimidine replacing
another pyrimidine) occur much more rapidly than transversions (replacement of a
pyrimidine by a purine, or vice versa). In mitochondria saturation is most frequently a
problem at third codon positions of protein coding genes, where most changes are
synonymous and consequently under little evolutionary constraint, and RY-‐coding
third codon positions has been effective in numerous previous studies (e.g. Phillips, et
al. 2001; Phillips and Penny 2003; Harrison, et al. 2004; Phillips, et al. 2006; Phillips
and Pratt 2008; Phillips, et al. 2010). When saturation is accounted for, mitochondria
can effectively be used to infer evolutionary events as deep as ~80 mya (e.g. Phillips,
et al. 2010): a temporal window that covers much of the evolution of birds and
mammals and includes the KPg boundary.
Past PCR-‐based studies have identified non-‐functional copies of mitochondrial
genes residing in the nuclear genome. These nuclear mitochondrial genes (NUMTs)
can cause problems when they are preferentially amplified over the authentic
mitochondrial sequence (e.g. Collura and Stewart 1995; Sorenson and Quinn 1998).
NUMTs are common in many eukaryote species (Bensasson, et al. 2001). For example,
the human genome contains at least 755 fragments of nuclear mitochondrial DNA
varying in length from 38 to 14835 bp, though most are less than 500 bp (Ramos, et
al. 2011). If a NUMT is mistaken for an authentic mitochondrial sequence then
phylogenetic inference may be compromised: once the NUMT is transposed into the
nuclear genome it evolves independently from the original, subject to a slower
evolutionary rate (in animals) and different selection pressures (e.g. Fukuda, et al.
1985; Lopez, et al. 1994; Collura and Stewart 1995; Perna and Kocher 1996).
Consequently, if the transposition event predates multiple speciation events then the

21
branching order among the effected species may be reconstructed incorrectly.
Fortunately, NUMTs only appear to be a major problem for PCR-‐based methods:
hybridisation enrichment techniques do not appear to be affected to the same extent
(Li, et al. 2012; Hahn, et al. 2013). Nuclear copies appear at such low frequencies in
high-‐throughput sequencing data that the authentic mitochondrial sequence is easily
identified.
An additional concern when relying on a single locus such as the mitogenome
to infer phylogenies is incongruence between the locus tree and the species tree
(Maddison 1997). One mechanism by which this incongruence can arise is through
incomplete lineage sorting. Incomplete lineage sorting occurs when multiple alleles at
a locus persist in a population through multiple speciation events and there is
differential sorting and fixation/sampling of these alleles in the descendent lineages.
Species tree inference is most likely to be affected by incomplete lineage sorting when
multiple consecutive speciation events occur in a short space of time (Rosenberg
2013). This is because the ancestral allelic diversity that can potentially lead to
incomplete lineage sorting will be lost from descendent lineages over longer
timescales due to genetic drift (Rosenberg 2003). Genetic drift occurs more quickly
when population sizes are small, so mitochondria are less susceptible to the effects of
incomplete lineage sorting than any single nuclear loci (Zink and Barrowclough
2008): being both haploid and uniparentally inherited, mitochondria have an
effective population one quarter the size of an autosomal nuclear locus. However, if
incomplete lineage sorting does occur, phylogenetic inference from mitochondrial
sequence data will be misled to a greater degree as minimal recombination means

22
that the mitogenome generally represents only a single molecular history (Ballard
and Whitlock 2004).
In addition to incomplete lineage sorting, incongruence between a gene tree
and the species tree can occur when the species boundary is breached (e.g.
introgressive hybridisation in vertebrates) and a foreign allele is captured and
reaches fixation (or a high enough frequency that it is sampled). Some studies suggest
that hybridisation occurs in up to 10% of bird and mammal species (Grant and Grant
1992; Mallet 2005), but it is not clear how often hybridisation will actually result in
sufficient gene flow to mislead phylogenetic inference. In reality, this will be species-‐
dependent and determined by a range of factors including demography and hybrid
fitness/fertility. However, mitochondria may be more susceptible to introgression
than nuclear loci: low effective population size and lack of recombination may lead
mitogenomes into fitness traps via Muller’s ratchet (Moran 1996; Lynch and
Blanchard 1998), which may make them vulnerable to selective sweeps driven by
more fit mitochondrial lineages entering a population through hybridisation (Phillips,
et al. 2013).

23
Summary
Ultimately, mitochondria have several advantages for constructing phylogenies for
biogeographical inference. Mitochondrial DNA sequences can be isolated from highly
degraded remains using hybridisation enrichment, so can be sequenced for extinct
species from environments where DNA preservation is especially poor. They also
have high information content and provide good resolution over timescales relevant
to much of the evolutionary history of birds and mammals. While using mitochondria
to infer phylogenies has disadvantages, these can be mitigated in many cases by
accounting for them methodologically (e.g. excluding/RY-‐coding quickly evolving
sites) or through cautious interpretation of results (e.g. when consecutive short
internodes increase the likelihood of incomplete lineage sorting). Still other
disadvantages of mitochondrial DNA (e.g. nuclear mitochondrial gene copies; NUMTs)
may be effectively circumvented through the use of high-‐throughput sequencing.
The advent of new sequencing technology now allows us to produce more
DNA sequence data than ever before, and from samples and species that were
previously too degraded to work with. These data permit us to reconstruct
phylogenies and infer evolutionary relationships with greater confidence than
previously possible. As a consequence, we now have an opportunity to test many
biogeographical and evolutionary hypotheses in a phylogenetic framework for the
first time. The time is ripe to renew investigation of outstanding questions regarding
the origin and evolution of the southern hemisphere fauna.

24
Thesis Overview
In this thesis I take advantage of recent advances in hybridisation enrichment and
high-‐throughput sequencing to generate data for building well resolved phylogenies.
The chapters of this thesis describe my application of these tools to a number of
different bird and mammal groups, including both living and extinct species. My
primary objectives are to test long-‐standing biogeographic and phylogenetic
hypotheses regarding elements of the southern hemisphere fauna, and identify
patterns and processes that may increase our understanding of taxon distributions
and movement more broadly.
CHAPTER 2
Molecular phylogeny, biogeography, and habitat preference evolution of marsupials
Marsupials are distributed across the Americas, Australia, New Guinea and
Wallacea. The separation and divergence of the extant American and Australasian
groups was been extensively studied. However, at least ten marsupial lineages are
distributed throughout New Guinea and Wallacea, and their biogeographic history is
less certain. In Chapter 2, I present 69 new marsupial mitogenomes obtained using
both shotgun and PCR-‐enriched high-‐throughput sequencing techniques coupled with
traditional Sanger sequencing. By combining these new mitogenome sequences with
existing data I produce a comprehensive time-‐calibrated phylogeny of marsupials.
Using this phylogeny, I compare the ages of New Guinean/Wallacean lineages both to
one another and what is known about the palaeogeography of the Australasian region

25
in order to determine the origin of these groups. I also infer the environmental
preferences of ancestral marsupials and explore how this corresponds to their
biogeography and to changing environmental conditions in Australia and South
America during the Cenozoic.
CHAPTER 3
Ancient DNA reveals elephant birds and kiwi are sister taxa and clarifies ratite bird
evolution
The distribution of ratites has been widely assumed to have resulted from
Gondwanan vicariance. However, this hypothesis has never been fully tested, as the
phylogenetic position of the extinct Madagascan elephant birds has remained
unresolved. In Chapter 3, I describe a procedure for in-‐solution hybridisation
enrichment of mitochondrial DNA from extinct species, which uses an RNA probe
array based on sequences from a pool of extant bird species. I use this enrichment
strategy coupled with high-‐throughput sequencing to obtain partial mitochondrial
genomes from two species of elephant bird: Aepyornis hildebrandti and Mullerornis
agilis. These new data allow the relationships of the elephant birds to the other
ratites to be inferred with high confidence, and I re-‐asses the hypothesis of
Gondwanan vicariance in light of this new information.

26
CHAPTER 4
Origin and evolution of the New Zealand wrens (Acanthisittidae)
New Zealand historically supported a diverse endemic avian fauna. However, a
large proportion of this avifauna became extinct following the arrival of humans,
leaving much of its evolution and origins uncertain. In particular, it is unclear to what
extent the current fauna represents Gondwanan vicariant elements and how many
species actually represent more recent arrivals. Some authors have suggested that
the entire fauna is descended from recent colonists arriving in New Zealand following
an extensive marine transgression ~24 mya (see Landis, et al. 2008). This hypothesis
can be tested in biogeographical framework. In Chapter 4, I use the methods first
presented in Chapter 3 to obtain data from three extinct members of New Zealand’s
most diverse group of passerines: the acanthisittid wrens. I use these new aDNA data
and sequences from the two extant species to determine phylogenetic relationships
within the group. Determining whether the acanthisittid wren radiation predates the
marine transgression requires an accurate estimate of the rate of bird evolution,
which remains contentious (Appendix). I examine how assumptions about the age of
birds affect our understanding of acanthisittid biogeography and the
palaeogeography of New Zealand.

27
CHAPTER 5
Ancient mitochondrial genome reveals unsuspected taxonomic affinity of the extinct
Chatham duck (Pachyanas chathamica) and resolves divergence times for New Zealand
and sub-‐Antarctic brown teals.
The Chatham Islands archipelago lies ~850 km east of New Zealand and like
New Zealand historically supported a diverse endemic avifauna, much of which
became extinct following the arrival of humans. In Chapter 5, I employ the techniques
described in Chapter 3, this time applied to the extinct Chatham duck (Pachyanas
chathamica). I use the resultant DNA sequence data to test whether the divergence of
the Chatham duck corresponds to the uplift of the Chatham Islands 2-‐3 mya, and to
identify the geographic origin of the Chatham duck lineage and its taxonomic
affinities.
CHAPTER 6
An extinct nestorid parrot (Aves, Psittaciformes, Nestoridae) from the Chatham Islands,
New Zealand
Chapter 6 focuses on a second member of the extinct Chatham Islands
avifauna: the Chatham Island parrot. This chapter identifies it as a distinct species
(Nestor chathamensis sp. nov.) and includes a comprehensive description, as well as
an examination of its biogeographic origin, palaeoecology, and relationships to the
New Zealand kea and kaka.

28
CHAPTER 7
Ancient DNA analyses of mammalian megafauna from La Chumbiada (Argentina; South
America)
In Chapter 7 I adapt the hybridisation enrichment technique from Chapter 3 to enrich
for mammalian mitochondrial DNA. I then use this approach to survey the aDNA
content of some mammalian megafaunal remains from La Chumbiada, Argentina.
DNA preservation was sufficient to reconstruct partial mitogenomes from two extinct
species: a glyptodontid (Glyptodon sp.) and a horse (Hippidion sp.). I investigate how
inclusion of these taxa in the phylogenies of their respective groups changes our
understanding of their evolution and the estimation of molecular dates. In particular,
I test whether the origin of the Hippidion lineage corresponds with the timing of the
Great American Interchange ~3 mya.
CHAPTER 8
General discussion and concluding remarks
This concluding chapter consolidates my most significant findings. I also identify
areas of methodology and interpretation where caution is needed and improvements
could be made, particularly with regard to calibration of molecular dating analyses
and the inference of evolutionary timescales. Finally, I provide a perspective on the
future direction and objectives of biogeography as we enter the era of high-‐
throughput sequencing.

29
References
Ali JR, Krause DW. 2011. Late Cretaceous bioconnections between Indo-‐Madagascar
and Antarctica: refutation of the Gunnerus Ridge causeway hypothesis. J Biogeogr
38:1855-‐1872.
Allentoft ME, Collins M, Harker D, Haile J, Oskam CL, Hale ML, Campos PF, Samaniego
JA, Gilbert MTP, Willerslev E, et al. 2012. The half-‐life of DNA in bone: measuring
decay kinetics in 158 dated fossils. Proc R Soc B 279:4724-‐4733.
Allentoft ME, Heller R, Oskam CL, Lorenzen ED, Hale ML, Gilbert MTP, Jacomb C,
Holdaway RN, Bunce M. 2014. Extinct New Zealand megafauna were not in decline
before human colonization. Proceedings of the National Academy of Sciences
111:4922-‐4927.
Ballard JWO, Whitlock MC. 2004. The incomplete natural history of mitochondria. Mol
Ecol 13:729-‐744.
Barnes I, Matheus P, Shapiro B, Jensen D, Cooper A. 2002. Dynamics of Pleistocene
population extinctions in Beringian brown bears. Science 295:2267-‐2270.
Barnett R, Yamaguchi N, Shapiro B, Ho S, Barnes I, Sabin R, Werdelin L, Cuisin J,
Larson G. 2014. Revealing the maternal demographic history of Panthera leo using
ancient DNA and a spatially explicit genealogical analysis. BMC Evol Biol 14:70.
Barnosky AD, Koch PL, Feranec RS, Wing SL, Shabel AB. 2004. Assessing the causes of
Late Pleistocene extinctions on the continents. Science 306:70-‐75.
Beck RM. 2012. An 'ameridelphian' marsupial from the early Eocene of Australia
supports a complex model of Southern Hemisphere marsupial biogeography.
Naturwissenschaften 99:715-‐729.
Bensasson D, Zhang D-‐X, Hartl DL, Hewitt GM. 2001. Mitochondrial pseudogenes:
evolution's misplaced witnesses. Trends Ecol Evol 16:314-‐321.
Benton MJ, Donoghue PCJ. 2007. Paleontological evidence to date the tree of life. Mol
Biol Evol 24:26-‐53.
Blakey RC. 2008. Gondwana paleogeography from assembly to breakup-‐A 500 m.y.
odyssey. Geological Society of America Special Papers 441:1-‐28.

30
Briggs AW, Good JM, Green RE, Krause J, Maricic T, Stenzel U, Lalueza-‐Fox C, Rudan P,
Brajkoviƒá D, Kuƒáan Ω, et al. 2009. Targeted Retrieval and Analysis of Five
Neandertal mtDNA Genomes. Science 325:318-‐321.
Briggs AW, Stenzel U, Johnson PLF, Green RE, Kelso J, Prüfer K, Meyer M, Krause J,
Ronan MT, Lachmann M, et al. 2007. Patterns of damage in genomic DNA sequences
from a Neandertal. Proceedings of the National Academy of Sciences 104:14616-‐
14621.
Brown WM, George M, Wilson AC. 1979. Rapid evolution of animal mitochondrial
DNA. Proceedings of the National Academy of Sciences 76:1967-‐1971.
Burger J, Rosendahl W, Loreille O, Hemmer H, Eriksson T, Götherström A, Hiller J,
Collins MJ, Wess T, Alt KW. 2004. Molecular phylogeny of the extinct cave lion
Panthera leo spelaea. Mol Phylogenet Evol 30:841-‐849.
Campbell HJ. 2008. Geology, Chatham Islands: heritage and conservation.
Christchurch: Canterbury University Press.
Campbell HJ, Begg J, Beu A, Carter B, Curtis N, Davies G, Emberson R, Given D,
Goldberg J, Holt K, et al. 2008. Geological considerations relating to the Chatham
Islands, mainland New Zealand, and the history of New Zealand terrestrial life. Geol
Soc N Z Misc Publ 126.
Carpenter ML, Buenrostro JD, Valdiosera C, Schroeder H, Allentoft ME, Sikora M,
Rasmussen M, Gravel S, Guillén S, Nekhrizov G, et al. 2013. Pulling out the 1%: whole-‐
genome capture for the targeted enrichment of ancient DNA sequencing libraries. The
American Journal of Human Genetics 93:852-‐864.
Collura RV, Stewart C-‐B. 1995. Insertions and duplications of mtDNA in the nuclear
genomes of Old World monkeys and hominoids. Nature 378:485-‐489.
Cooper A. 1994. Ancient DNA sequences reveal unsuspected phylogenetic
relationships within New Zealand wrens (Acanthisittidae). Experientia 50:558-‐563.
Cooper A, Lalueza-‐Fox C, Anderson S, Rambaut A, Austin J, Ward R. 2001. Complete
mitochondrial genome sequences of two extinct moas clarify ratite evolution. Nature
409:704-‐707.

31
Cooper A, Poinar HN. 2000. Ancient DNA: do it right or not at all. Science 289:1139-‐
1139.
Crisp MD, Trewick SA, Cook LG. 2011. Hypothesis testing in biogeography. Trends
Ecol Evol 26:66-‐72.
Darwin C. 1859. On the origin of species by means of natural selection, or, The
preservation of favoured races in the struggle for life. London: John Murray.
Donoghue PCJ, Benton MJ. 2007. Rocks and clocks: calibrating the Tree of Life using
fossils and molecules. Trends Ecol Evol 22:424-‐431.
Doolittle RF. 1994. Convergent evolution: the need to be explicit. Trends in
Biochemical Sciences 19:15-‐18.
Drummond AJ, Ho SYW, Phillips MJ, Rambaut A. 2006. Relaxed phylogenetics and
dating with confidence. PLoS Biol 4:699-‐710.
Drummond AJ, Rambaut A. 2007. BEAST: Bayesian evolutionary analysis by sampling
trees. BMC Evol Biol 7.
Fabre P-‐H, Irestedt M, Fjeldså J, Bristol R, Groombridge JJ, Irham M, Jønsson KA. 2012.
Dynamic colonization exchanges between continents and islands drive diversification
in paradise-‐flycatchers (Terpsiphone, Monarchidae). J Biogeogr 39:1900-‐1918.
Fukuda M, Wakasugi S, Tsuzuki T, Nomiyama H, Shimada K, Miyata T. 1985.
Mitochondrial DNA-‐like sequences in the human nuclear genome. Characterization
and implications in the evolution of mitochondrial DNA. J Mol Biol 186:257-‐266.
Gibson A, Gowri-‐Shankar V, Higgs PG, Rattray M. 2005. A comprehensive analysis of
mammalian mitochondrial genome base composition and improved phylogenetic
methods. Mol Biol Evol 22:251-‐264.
Gilbert MTP, Tomsho LP, Rendulic S, Packard M, Drautz DI, Sher A, Tikhonov A, Dalén
L, Kuznetsova T, Kosintsev P, et al. 2007. Whole-‐genome shotgun sequencing of
mitochondria from ancient hair shafts. Science 317:1927-‐1930.
Gnirke A, Melnikov A, Maguire J, Rogov P, LeProust EM, Brockman W, Fennell T,
Giannoukos G, Fisher S, Russ C, et al. 2009. Solution hybrid selection with ultra-‐long
oligonucleotides for massively parallel targeted sequencing. Nat Biotechnol 27:182-‐
189.

32
Grant PR, Grant BR. 1992. Hybridization of bird species. Science 256:193-‐197.
Gunnell GF. 2013. Biogeography and the legacy of Alfred Russel Wallace. Geol Belg
16:211-‐216.
Haddrath O, Baker AJ. 2001. Complete mitochondrial DNA geonome sequences of
extinct birds: ratite phylogenetics and the vicariance biogeography hypothesis.
Proceedings of the Royal Society of London. Series B: Biological Sciences 268:939-‐
945.
Haddrath O, Baker AJ. 2012. Multiple nuclear genes and retroposons support
vicariance and dispersal of the palaeognaths, and an Early Cretaceous origin of
modern birds. Proc R Soc B 279:4617-‐4625.
Hahn C, Bachmann L, Chevreux B. 2013. Reconstructing mitochondrial genomes
directly from genomic next-‐generation sequencing reads -‐ a baiting and iterative
mapping approach. Nucleic Acids Res 41:e29.
Hall R. 2013. The palaeogeography of Sundaland and Wallacea since the Late Jurassic.
J Limnol 72:1-‐17.
Harrison GL, McLenachan PA, Phillips MJ, Slack KE, Cooper A, Penny D. 2004. Four
new avian mitochondrial genomes help get to basic evolutionary questions in the late
Cretaceous. Mol Biol Evol 21:974-‐983.
Hawkins AFA, Goodman SM. 2003. Chapter 12: Birds -‐ Introduction to the Birds. In:
Goodman SM, Benstead JP, editors. The natural history of Madagascar. Chicago:
University of Chicago Press. p. 1019-‐1044.
Hedges SB, Maxson LR. 1996. Re: Molecules and morphology in amniote phylogeny.
Mol Phylogenet Evol 6:79-‐81.
Hedges SB, Sibley CG. 1994. Molecules vs. morphology in avian evolution: the case of
the "pelecaniform" birds. Proc Natl Acad Sci U S A 91:9861-‐9865.
Hillis DM. 1987. Molecular versus morphological approaches to systematics. Annu
Rev Ecol Syst 18:23-‐42.
Ho SYW. 2007. Calibrating molecular estimates of substitution rates and divergence
times in birds. J Avian Biol 38:409-‐414.

33
Ho SYW. 2009. An examination of phylogenetic models of substitution rate variation
among lineages. Biol Lett 5:421-‐424.
Ho SYW. 2014. The changing face of the molecular evolutionary clock. Trends Ecol
Evol 29:496-‐503.
Hodges E, Xuan Z, Balija V, Kramer M, Molla MN, Smith SW, Middle CM, Rodesch MJ,
Albert TJ, Hannon GJ, et al. 2007. Genome-‐wide in situ exon capture for selective
resequencing. Nat Genet 39:1522-‐1527.
Hofreiter M, Serre D, Poinar HN, Kuch M, Paabo S. 2001. Ancient DNA. Nat Rev Genet
2:353-‐359.
Horn S. 2012. Target enrichment via DNA hybridization capture. Methods Mol Biol
840:177-‐188.
Hugall AF, Lee MSY. 2004. Molecular claims of Gondwanan age for Australian agamid
lizards are untenable. Mol Biol Evol 21:2102-‐2110.
Jarvis ED, Mirarab S, Aberer AJ, Li B, Houde P, Li C, Ho SYW, Faircloth BC, Nabholz B,
Howard JT, et al. 2014. Whole-‐genome analyses resolve early branches in the tree of
life of modern birds. Science 346:1320-‐1331.
Johnston P. 2011. New morphological evidence supports congruent phylogenies and
Gondwana vicariance for palaeognathous birds. Zool J Linn Soc 163:959-‐982.
Kimura M. 1968. Evolutionary Rate at the Molecular Level. Nature 217:624-‐626.
Knapp M, Hofreiter M. 2010. Next generation sequencing of ancient DNA:
requirements, strategies and perspectives. Genes 1:227-‐243.
Kuriyama T, Brandley MC, Katayama A, Mori A, Honda M, Hasegawa M. 2011. A time-‐
calibrated phylogenetic approach to assessing the phylogeography, colonization
history and phenotypic evolution of snakes in the Japanese Izu Islands. J Biogeogr
38:259-‐271.
Lambert DM, Ritchie PA, Millar CD, Holland B, Drummond AJ, Baroni C. 2002. Rates of
evolution in ancient DNA from Adelie penguins. Science 295:2270-‐2273.
Landis CA, Campbell HJ, Begg JG, Mildenhall DC, Paterson AM, Trewick SA. 2008. The
Waipounamu Erosion Surface: questioning the antiquity of the New Zealand land
surface and terrestrial fauna and flora. Geol Mag 145:173-‐197.

34
Lee MSY, Cau A, Naish D, Dyke GJ. 2014. Morphological clocks in paleontology, and a
Mid-‐Cretaceous origin of crown Aves. Syst Biol 63:442-‐449.
Lemey P, Salemi M, Vandamme A. 2009. The phylogenetic handbook: a practical
approach to phylogenetic analysis and hypothesis Testing New York: Cambridge
University Press.
Li C, Hofreiter M, Straube N, Corrigan S, Naylor GJ. 2013. Capturing protein-‐coding
genes across highly divergent species. Biotechniques 54:321-‐326.
Li M, Schroeder R, Ko A, Stoneking M. 2012. Fidelity of capture-‐enrichment for
mtDNA genome sequencing: influence of NUMTs. Nucleic Acids Res 40:e137.
Lindahl T. 1993. Instability and decay of the primary structure of DNA. Nature
362:709-‐715.
Lopez J, Yuhki N, Masuda R, Modi W, O'Brien S. 1994. Numt, a recent transfer and
tandem amplification of mitochondrial DNA to the nuclear genome of the domestic
cat. J Mol Evol 39:174-‐190.
Lynch M, Blanchard JL. 1998. Deleterious mutation accumulation in organelle
genomes. Genetica 102-‐103:29-‐39.
Maddison WP. 1997. Gene Trees in Species Trees. Syst Biol 46:523-‐536.
Mallet J. 2005. Hybridization as an invasion of the genome. Trends Ecol Evol 20:229-‐
237.
Martin AP, Palumbi SR. 1993. Body size, metabolic rate, generation time, and the
molecular clock. Proceedings of the National Academy of Sciences 90:4087-‐4091.
Mason VC, Li G, Helgen KM, Murphy WJ. 2011. Efficient cross-‐species capture
hybridization and next-‐generation sequencing of mitochondrial genomes from
noninvasively sampled museum specimens. Genome Research 21:1695-‐1704.
McDougall I, Embleton BJJ, Stone DB. 1981. Origin and evolution of Lord Howe Island,
Southwest Pacific Ocean. J Geol Soc Aust 28:155-‐176.
Metcalfe I, B. SJM, Morwood M, Davidson I. 2001. Faunal and floral migrations and
evolution in SE Asia-‐Australasia. Lisse: Swets & Zeitlinger Publishers.
35
Meyer M, Kircher M, Gansauge M-‐T, Li H, Racimo F, Mallick S, Schraiber JG, Jay F,
Prüfer K, de Filippo C, et al. 2012. A high-‐coverage genome sequence from an archaic
denisovan individual. Science 338:222-‐226.
Meyer M, Stenzel U, Myles S, Prufer K, Hofreiter M. 2007. Targeted high-‐throughput
sequencing of tagged nucleic acid samples. Nucleic Acids Res 35:e97.
Miller W, Drautz DI, Ratan A, Pusey B, Qi J, Lesk AM, Tomsho LP, Packard MD, Zhao F,
Sher A, et al. 2008. Sequencing the nuclear genome of the extinct woolly mammoth.
Nature 456:387-‐390.
Moran NA. 1996. Accelerated evolution and Muller's rachet in endosymbiotic
bacteria. Proc Natl Acad Sci U S A 93:2873-‐2878.
Moritz C, Dowling TE, Brown WM. 1987. Evolution of animal mitochondrial DNA:
relevance for population biology and systematics. Annu Rev Ecol Syst 18:269-‐292.
Nasrallah CA, Mathews DH, Huelsenbeck JP. 2011. Quantifying the impact of
dependent evolution among sites in phylogenetic inference. Syst Biol 60:60-‐73.
Noonan JP, Hofreiter M, Smith D, Priest JR, Rohland N, Rabeder G, Krause J, Detter JC,
Pääbo S, Rubin EM. 2005. Genomic sequencing of pleistocene cave bears. Science
309:597-‐599.
O'Leary MA, Bloch JI, Flynn JJ, Gaudin TJ, Giallombardo A, Giannini NP, Goldberg SL,
Kraatz BP, Luo Z-‐X, Meng J, et al. 2013. The placental mammal ancestor and the post
K-‐Pg radiation of placentals. Science 339:662-‐667.
Orlando L, Ginolhac A, Zhang G, Froese D, Albrechtsen A, Stiller M, Schubert M,
Cappellini E, Petersen B, Moltke I, et al. 2013. Recalibrating Equus evolution using the
genome sequence of an early Middle Pleistocene horse. Nature 499:74-‐78.
Orlando L, Metcalf JL, Alberdi MT, Telles-‐Antunes M, Bonjean D, Otte M, Martin F,
Eisenmann V, Mashkour M, Morello F, et al. 2009. Revising the recent evolutionary
history of equids using ancient DNA. Proc Natl Acad Sci U S A 106:21754-‐21759.
Pagel M, Meade A, Barker D. 2004. Bayesian estimation of ancestral character states
on phylogenies. Syst Biol 53:673-‐684.

36
Parker J, Tsagkogeorga G, Cotton JA, Liu Y, Provero P, Stupka E, Rossiter SJ. 2013.
Genome-‐wide signatures of convergent evolution in echolocating mammals. Nature
502:228-‐231.
Perna NT, Kocher TD. 1996. Mitochondrial DNA: molecular fossils in the nucleus. Curr
Biol 6:128-‐129.
Phillips MJ. 2009. Branch-‐length estimation bias misleads molecular dating for a
vertebrate mitochondrial phylogeny. Gene 441:132-‐140.
Phillips MJ, Gibb GC, Crimp EA, Penny D. 2010. Tinamous and moa flock together:
mitochondrial genome sequence analysis reveals independent losses of flight among
ratites. Syst Biol 59:90-‐107.
Phillips MJ, Haouchar D, Pratt RC, Gibb GC, Bunce M. 2013. Inferring kangaroo
phylogeny from incongruent nuclear and mitochondrial genes. PLoS ONE 8:e57745.
Phillips MJ, Lin YH, Harrison GL, Penny D. 2001. Mitochondrial genomes of a
bandicoot and a brushtail possum confirm the monophyly of australidelphian
marsupials. Proceedings of the Royal Society of London Series B-‐Biological Sciences
268:1533-‐1538.
Phillips MJ, McLenachan PA, Down C, Gibb GC, Penny D. 2006. Combined
mitochondrial and nuclear DNA sequences resolve the interrelations of the major
Australasian marsupial radiations. Syst Biol 55:122-‐137.
Phillips MJ, Penny D. 2003. The root of the mammalian tree inferred from whole
mitochondrial genomes. Mol Phylogenet Evol 28:171-‐185.
Phillips MJ, Pratt RC. 2008. Family-‐level relationships among the Australasian
marsupial "herbivores" (Diprotodontia : koala, wombats, kangaroos and possums).
Mol Phylogenet Evol 46:594-‐605.
Prescott GW, Williams DR, Balmford A, Green RE, Manica A. 2012. Quantitative global
analysis of the role of climate and people in explaining late Quaternary megafaunal
extinctions. Proc Natl Acad Sci U S A 109:4527-‐4531.
Prufer K, Stenzel U, Hofreiter M, Paabo S, Kelso J, Green R. 2010. Computational
challenges in the analysis of ancient DNA. Genome Biol 11:R47.

37
Ramos A, Barbena E, Mateiu L, del Mar González M, Mairal Q, Lima M, Montiel R, Aluja
MP, Santos C. 2011. Nuclear insertions of mitochondrial origin: database updating
and usefulness in cancer studies. Mitochondrion 11:946-‐953.
Rasmussen M, Li Y, Lindgreen S, Pedersen JS, Albrechtsen A, Moltke I, Metspalu M,
Metspalu E, Kivisild T, Gupta R, et al. 2010. Ancient human genome sequence of an
extinct Palaeo-‐Eskimo. Nature 463:757-‐762.
Ree RH, Smith SA. 2008. Maximum likelihood inference of geographic range evolution
by dispersal, local extinction, and cladogenesis. Syst Biol 57:4-‐14.
Rizzi E, Lari M, Gigli E, De Bellis G, Caramelli D. 2012. Ancient DNA studies: new
perspectives on old samples. Genet Sel Evol 44:21.
Ronquist F, Teslenko M, van der Mark P, Ayres DL, Darling A, Hohna S, Larget B, Liu L,
Suchard MA, Huelsenbeck JP. 2012. MrBayes 3.2: efficient Bayesian phylogenetic
inference and model choice across a Large model space. Syst Biol 61:539-‐542.
Rosenberg NA. 2013. Discordance of species trees with their most likely gene trees: a
unifying principle. Mol Biol Evol 30:2709-‐2713.
Rosenberg NA. 2003. The shapes of neutral gene genealogies in two species:
probabilities of monophyly, paraphyly, and polyphyly in a coalescent model.
Evolution 57:1465-‐1477.
Roy S, Dasgupta R, Bagchi A. 2014. A review on phylogenetic analysis: a journey
through modern era. Computational Molecular Bioscience 4:39-‐45.
Rubinoff D, Holland BS. 2005. Between two extremes: Mitochondrial DNA is neither
the panacea nor the nemesis of phylogenetic and taxonomic inference. Syst Biol
54:952-‐961.
Sawyer S, Krause J, Guschanski K, Savolainen V, Pääbo S. 2012. Temporal patterns of
nucleotide misincorporations and DNA fragmentation in ancient DNA. PLoS ONE
7:e34131.
Schellart WP, Lister GS, Toy VG. 2006. A Late Cretaceous and Cenozoic reconstruction
of the Southwest Pacific region: Tectonics controlled by subduction and slab rollback
processes. Earth-‐Sci Rev 76:191-‐233.

38
Shapiro B, Drummond AJ, Rambaut A, Wilson MC, Matheus PE, Sher AV, Pybus OG,
Gilbert MTP, Barnes I, Binladen J, et al. 2004. Rise and fall of the Beringian steppe
bison. Science 306:1561-‐1565.
Sharon BE, Hastings PA. 1998. Morphological correlations in evolution: consequences
for phylogenetic analysis. The Quarterly Review of Biology 73:141-‐162.
Sibley CG, Ahlquist JE. 1987. Avian phylogeny reconstructed from comparisons of the
genetic material, DNA. In: Patterson C, editor. Molecules and morphology in
evolution: conflict or compromise? Cambridge: Cambridge University Press. p. 95-‐
121.
Simpson GG. 1977. Too many lines; the limits of the Oriental and Australian
zoogeographic regions. Proc Am Philos Soc 121:107-‐120.
Skoglund P, Malmström H, Raghavan M, Storå J, Hall P, Willerslev E, Gilbert MTP,
Götherström A, Jakobsson M. 2012. Origins and genetic legacy of neolithic farmers
and hunter-‐gatherers in Europe. Science 336:466-‐469.
Slack KE, Jones CM, Ando T, Harrison GL, Fordyce RE, Arnason U, Penny D. 2006. Early
penguin fossils, plus mitochondrial genomes, calibrate avian evolution. Mol Biol Evol
23:1144-‐1155.
Smith CI, Chamberlain AT, Riley MS, Stringer C, Collins MJ. 2003. The thermal history
of human fossils and the likelihood of successful DNA amplification. J Hum Evol
45:203-‐217.
Sorenson MD, Quinn TW. 1998. Numts: A Challenge for Avian Systematics and
Population Biology. The Auk 115:214-‐221.
Springer MS, Meredith RW, Gatesy J, Emerling CA, Park J, Rabosky DL, Stadler T,
Steiner C, Ryder OA, Janečka JE, et al. 2012. Macroevolutionary Dynamics and
Historical Biogeography of Primate Diversification Inferred from a Species
Supermatrix. PLoS ONE 7:e49521.
St John J, Quinn TW. 2008. Rapid capture of DNA targets. Biotechniques 44:259-‐264.
Stegner MA, Holmes M. 2013. Using palaeontological data to assess mammalian
community structure: Potential aid in conservation planning. Palaeogeogr.
Palaeoclimatol. Palaeoecol. 372:138-‐146.
39
Stiller M, Knapp M, Stenzel U, Hofreiter M, Meyer M. 2009. Direct multiplex
sequencing (DMPS)-‐-‐a novel method for targeted high-‐throughput sequencing of
ancient and highly degraded DNA. Genome Res 19:1843-‐1848.
Strimmer K, von Haessler A. 2003. Nucleotide substitution models. In: Salemi M,
Vandamme A, editors. The phylogenetic handbook: a practical approach to DNA and
protein phylogeny. Cambridge: Cambridge University Press.
Sulloway FJ. 1982. The Beagle collections of Darwin's finches (Geospizinae). Bulletin
of the British Museum (Natural History) Zoology Series 43:49-‐94.
van Dijk EL, Auger H, Jaszczyszyn Y, Thermes C. 2014. Ten years of next-‐generation
sequencing technology. Trends Genet 30:418-‐426.
van Ufford AQ, Cloos M. 2005. Cenozoic tectonics of New Guinea. Aapg Bulletin
89:119-‐140.
Wallace AR. 1855. On the law which has regulated the introduction of new species.
Annals and Magazine of Natural History 16:184-‐196.
Wen J, Ree RH, Ickert-‐Bond SM, Nie Z, Funk V. 2013. Biogeography: where do we go
from here? Taxon 62:912-‐927.
Worthy TH, Hand SJ, Nguyen JMT, Tennyson AJD, Worthy JP, Scofield RP, Boles WE,
Archer M. 2010. Biogeographical and Phylogenetic Implications of an Early Miocene
Wren (Aves: Passeriformes: Acanthisittidae) from New Zealand. J Vertebr Paleontol
30:479-‐498.
Worthy TH, Scofield RP. 2012. Twenty-‐first century advances in knowledge of the
biology of moa (Aves: Dinornithiformes): a new morphological analysis and moa
diagnoses revised. N Z J Zool 39:87-‐153.
Xia X, Lemey P. 2009. Assessing substitution saturation with DAMBE. In: Lemey P,
Salemi M, Vandamme A, editors. The phylogenetic handbook: a practical approach to
phylogenetic analysis and hypothesis testing: Cambridge University Press.
Xia X, Xie Z, Salemi M, Chen L, Wang Y. 2003. An index of substitution saturation and
its application. Mol Phylogenet Evol 26:1-‐7.
Yang Z. 2007. PAML 4: a program package for phylogenetic analysis by maximum
likelihood. Mol Biol Evol 24:1586-‐1591.

40
Zink RM, Barrowclough GF. 2008. Mitochondrial DNA under siege in avian
phylogeography. Mol Ecol 17:2107-‐2121.

41
CHAPTER 2:
Molecular phylogeny,
biogeography, and habitat preference evolution of
marsupials CHAPTER 2: Molecular phylogeny, biogeography, and habitat preference evolution of marsupials
Mitchell, K.J., Pratt, R.C., Watson, L.N., Gibb, G.C., Llamas, B., Kasper, M., Edson, J.,
Hopwood, B., Male, D., Armstrong, K.N., Meyer, M., Hofreiter, M., Austin, J., Donnellan, S.C., Lee, M.S.Y., Phillips, M.J., Cooper, A., 2014. Molecular phylogeny, biogeography, and habitat preference evolution of marsupials. Molecular Biology and Evolution 31
(9), 2322-‐2330
doi: 10.1093/molbev/msu176


Mitchell, K.J., Pratt, R.C., Watson, L.N., Gibb, G.C., Llamas, B., Kasper, M., Edson, J., Hopwood, B., Male, D., Armstrong, K.N., Meyer, M., Hofreiter, M., Austin, J., Donnellan, S.C., Lee, M.S.Y., Phillips, M.J. & Cooper, A. (2014) Molecular phylogeny, biogeography, and habitat preference evolution of marsupials. Molecular Biology and Evolution, v. 31 (9), pp. 2322-2330
NOTE:
This publication is included on pages 47 - 76 in the print copy of the thesis held in the University of Adelaide Library.
It is also available online to authorised users at:
http://dx.doi.org/10.1093/molbev/msu176

77
CHAPTER 3:
Ancient DNA reveals elephant
birds and kiwi are sister taxa and clarifies ratite bird evolution
CHAPTER 3: Ancient DNA reveals elephant birds and kiwi are sister taxa and clarifies ratite bird evolution
Mitchell, K.J., Llamas, B., Soubrier, J., Rawlence, N.J., Worthy, T.H., Wood, J., Lee, M.S.Y., Cooper, A., 2014. Ancient DNA reveals elephant birds and kiwi are sister taxa and
clarifies ratite bird evolution. Science 344, 898-‐900.
doi: 10.1126/science.1251981


Mitchell, K.J., Llamas, B., Soubrier, J., Rawlence, N.J., Worthy, T.H., Wood, J., Lee, M.S.Y., Cooper, A., (2014) Ancient DNA reveals elephant birds and kiwi are sister taxa and clarifies ratite bird evolution. Science, v. 344 (6186), pp. 898-900.
NOTE:
This publication is included on pages 81 - 126 in the print copy of the thesis held in the University of Adelaide Library.
It is also available online to authorised users at:
http://dx.doi.org/10.1126/science.1251981

127
CHAPTER 4:
Origin and evolution of the New Zealand wrens (Acanthisittidae)
CHAPTER 4: Origin and evolution of the New Zealand wrens (Acanthisittidae)
Mitchell, K.J., Wood, J.R., Llamas, B., McLenachan, P.A., Scofield, R.P., Worthy, T.H., Cooper, A., 2014. Origin and evolution of the New Zealand wrens (Acanthisittidae).
In preparation for submission to Proceedings of the National Academy of Sciences of the United States of America (PNAS).


131
CHAPTER 4:
Origin and evolution of the New Zealand wrens (Acanthisittidae)
Kieren J. Mitchell1, Jamie R. Wood2, Bastien Llamas1, Patricia A. McLenachan3, Olga
Kardailsky4, R. Paul Scofield5, Trevor H. Worthy6, Alan Cooper1
1 Australian Centre for Ancient DNA, School of Earth and Environmental Science, University of
Adelaide, North Terrace Campus, South Australia 5005, Australia 2 Landcare Research, Post Office Box 40, Lincoln 7640, New Zealand 3 Institute of Fundamental Sciences, Massey University, Palmerston North 4474, New Zealand. 4 Department of Anatomy, Otago University, Dunedin 9054, New Zealand 5 Canterbury Museum, Rolleston Avenue, Christchurch 8013, New Zealand 6 School of Biological Sciences, Flinders University, South Australia 5001, Australia
Abstract
It has long been thought that the unique biota of New Zealand comprises two distinct
elements: vicariant groups that have persisted on the landmass since its separation
from Gondwana (>55 Ma), and groups descending from ancestors that arrived later
via over-‐water dispersal. However, it has also been suggested that Zealandia (the
continental fragment of which New Zealand is today the largest emergent portion)
became completely submerged for a period during the Late Oligocene/earliest
Miocene and that all modern New Zealand flora and fauna are descendants of
subsequent colonists. Few molecular studies of endemic New Zealand clades have
been able to convincingly refute this hypothesis; however, the New Zealand biota has
not been exhaustively surveyed. In the present study we use the acanthisittid wrens,
New Zealand’s second largest endemic bird radiation, as a biogeographical test for
the persistence of a Gondwanan fauna in Zealandia throughout the Cenozoic. We
sequenced mitochondrial genomes from four acanthisittid species (including three

132
extinct species) and analysed these new data alongside existing molecular and
morphological data to produce a comprehensive total-‐evidence phylogeny. Molecular
dating of our phylogeny suggests that at least two acanthisittid lineages persisted in
Zealandia during the Oligocene/Early Miocene marine transgression, providing
evidence for the continuous presence of emergent land. In addition, our phylogeny
resolves several long-‐standing questions regarding the evolution of the acanthisittid
wrens and reveals patterns that parallel those observed in several other New Zealand
bird taxa.
Introduction
New Zealand is a unique natural laboratory for studying evolutionary processes, and
is characterised foremost by its paucity of endemic terrestrial mammals. Unlike other
largely mammal-‐free islands and archipelagos (e.g. Lord Howe Island and Hawaii)
that formed volcanically during the last ten million years (1, 2), New Zealand has
been isolated since its separation from the supercontinent Gondwana over 55 million
years ago (3). In addition to its great age, New Zealand is also much larger (~270,000
km2) and more geologically complex than most other islands, providing a range of
habitats largely unrivalled outside of the major continental landmasses. These factors
combined to produce a diverse vertebrate fauna where ecological niches dominated
elsewhere by mammals are instead filled primarily by birds (4). However, despite
decades of research into this distinctive biota, the origins of much of New Zealand’s
flora and fauna are still poorly understood and are currently the subject of renewed
debate and controversy (5-‐7).

133
It has generally been recognised that the modern biota of New Zealand
comprises two components: lineages that have persisted on the landmass since its
separation from Gondwana (vicariance), and lineages descending from colonists that
arrived via later trans-‐oceanic dispersal (8). Vicariant species have historically been
thought to include animals such as leiopelmatid frogs, velvet worms (Onychophora),
ratites (the moa and kiwi) and the tuatara (Sphenodon), and plants such as the
southern beech (Nothofagaceae) and kauri (Agathis). However, recent studies have
revealed that many of these groups are potentially only relatively recent arrivals. For
example, it now appears that the moa and kiwi descended from flighted ancestors
that dispersed to New Zealand following its isolation (9, 10), and molecular dating
has cast doubt on the antiquity of New Zealand Nothofagaceae (11) and Agathis (12).
These findings have called into question the true contribution of ancient Gondwanan
lineages to the modern New Zealand biota and consequently the central dogma
surrounding the origins of the New Zealand flora and fauna (6).
The land area of Zealandia (the continental plate of which New Zealand is
today the largest emergent portion) was drastically reduced during a marine
transgression, the “Oligocene drowning” (13), which likely resulted in a reduction in
available ecological niches, and widespread extinction. However, some researchers
have recently gone so far as to suggest that Zealandia became completely submerged
during the Waitakian (21.7-‐25.2 mya: Late Oligocene/earliest Miocene), completely
extirpating the resident biota (7, 14, 15). This alternative scenario suggests that the
modern flora and fauna of New Zealand are purely the result of post-‐inundation
dispersal since the Early Miocene. While several studies have provided geological
evidence for emergent land existing at least ephemerally during this period (16-‐18),

134
none have yet provided unequivocal evidence for continuously emergent land
throughout the Cenozoic. Similarly, palaeontological studies have yet to convincingly
demonstrate persistence of plant or animal lineages through the Oligocene/Early
Miocene marine transgression. However, molecular studies of biogeography can also
be used to test this hypothesis (5, 19).
Molecular phylogenetic analyses can provide evidence against the total
submergence of Zealandia by demonstrating that diversification of an endemic New
Zealand clade began prior to the marine transgression (19). That is, two or more
lineages within a clade have existed since at least 22-‐25 mya. The rationale for this
test is that post-‐inundation dispersal to Zealandia by multiple lineages within a single
clade followed by the complete extinction of that clade outside of New Zealand is
unlikely. Most endemic groups studied to date do not satisfy the conditions of this test
and so their presence in New Zealand can plausibly be explained by diversification
following post-‐inundation dispersal (5). Possible instances of pre-‐inundation
diversification have recently been identified in several animal clades (20-‐23);
however, the diversity of New Zealand’s recent (Holocene) biota has not yet been
exhaustively studied, partly because a large proportion of the fauna became extinct
following the arrival of human colonists. Thus, ancient DNA analysis of museum
specimens from extinct species may be valuable in further investigating the
persistence of emergent land during the Oligocene/Early Miocene marine
transgression.
One group that remains poorly studied is New Zealand’s endemic passerine
family Acanthisittidae (or New Zealand wrens). Little is known about the
135
relationships among these six or seven small (0.15 – 0.5 gram) and cryptic birds (24).
Entirely distinct from the “true” wrens (Troglodytidae), the acanthisittids represent
the most ancient lineage of the largest order of birds: Passeriformes. The acanthisittid
wrens are particularly notable for including four of the five known flightless
passerines (25-‐28): the long-‐billed wren (Dendroscansor decurvirostris), Lyall’s wren
(Traversia lyalli) and both North and South Island forms of the stout-‐legged wren
[Pachyplichas jagmi and Pachyplichas yaldwyni, respectively, although these taxa may
actually represent a single species (24, 29)]. However, all four of these birds, along
with the bush wren (Xenicus longipes), became extinct following the arrival of humans
(26, 30), likely through predation by the introduced Pacific rat (Rattus exulans).
Consequently, the rifleman (Acanthisitta chloris) and rock wren (Xenicus gilviventris)
are the only extant representatives of the family.
Previous molecular studies have concluded that the recent diversity of
acanthisittid wrens likely arose during the Miocene (13, 30), suggesting that
acanthisittids may be post-‐inundation colonists. However, these past studies sampled
only a few acanthisittid species, and included no formal molecular dating analyses. In
the present study we construct a more comprehensively sampled phylogeny of
acanthisittid wrens including extinct and extant taxa, and using both molecular and
morphological data. This allows us to more thoroughly assess the probability of
continuous emergent land existing in Zealandia since its separation from the other
Gondwanan landmasses.

136
Results
We obtained near-‐complete mitochondrial genome (mitogenome) sequences from
three extinct acanthisittid species (Lyall’s wren, Traversia lyalli, 15,657 bp; South
Island stout-‐legged wren, Pachyplichas yaldwyni, 16,060 bp; bush wren, Xenicus
longipes, 16,017 bp) and one of the two extant species (the rock wren, Xenicus
gilviventris, 14,359 bp). In order to reconstruct the phylogeny of acanthisittids we
combined these new data with existing mitogenome sequences for the remaining
extant acanthisittid (the rifleman; Acanthisitta chloris) and a number of outgroup taxa
(Table S1). We further augmented this dataset with the addition of a previously
published matrix of 53 morphological characters (31), which allowed us to include
the two acanthisittid genera that still lacked nucleotide sequence data: Dendroscansor
decurvirostris (the recently extinct, monotypic long-‐billed wren) and Kuiornis
indicator (a fossil taxon from the Miocene).
Analyses of the nucleotide sequence data alone confirm the monophyly of
Acanthisittidae, and strongly suggest that the basal divergence among the sequenced
acanthisittid species is between T. lyalli and the ancestor of Acanthisitta, Pachyplichas
and Xenicus (Figure 1). Within this latter clade, Acanthisitta appears to be sister-‐taxon
to a clade comprising Xenicus and Pachyplichas, within which Xenicus is paraphyletic
with respect to P. yaldwyni. Analyses of the morphological data alone support the
monophyly of Acanthisittidae but do not support any particular arrangement of taxa
(see also 31). An exception is the clade comprising Acanthisitta and Kuiornis, which
receives somewhat strong support in analyses of the morphological data alone.
Notably, support for this node increases when the molecular and morphological data

137
are combined. In addition, both analyses of the combined data and morphological
data alone suggest that Dendroscansor falls outside the diversity of sequenced taxa,
although support for this position is moderate to weak, and removing Dendroscansor
from the dataset improves support for all nodes in the combined analysis (Table 1).
We compared the acanthisittid mitochondrial genome sequences from the
phylogenetic analyses above to previously published sequences for a 201 bp
fragment of 12S rRNA from the rifleman, bush wren and rock wren (see 30). Genetic
distances (Table 2) reveal that the intraspecific distance among sampled rock wrens
is equal to the distance between the rock wren and the stout-‐legged wren (0.5-‐1%; 1-‐
2 base changes). Thus, the rock wren and stout-‐legged wren cannot readily be
distinguished using this short region without more extensive sampling from each
taxon. In contrast, intraspecific diversity within the bush wren is comparatively high
(3%; 6 base changes).

138
Figure 1: Relationships among acanthisittid wrens inferred from total evidence analyses
(combined morphological and molecular data) in MrBayes, RAxML and PAUP*. Relationships
among outgroups not depicted (but see Figure 2). Extinct taxa are coloured red. Extinct taxa
for which no nucleotide sequence data are available are marked with a red dot. Scale is in
substitutions per site as estimated for the nucleotide data partitions using MrBayes. Branch
support values are listed in Table 1.
Table 1: Branch support values for relationships among acanthisittids (Bayesian posterior
probability / maximum likelihood bootstrap % / maximum parsimony bootstrap %). Nodes
are labelled as for Figure 1. Analyses were run in MrBayes, RAxML and PAUP* for the
molecular (mitogenomic) data alone, the morphological data alone, and the combined
molecular and morphological data (total evidence). Total evidence analyses, and analyses of
the morphological data alone, were run both with and without Dendroscansor decurvirostris.
Node Molecular data only
Total evidence Morphological data only All taxa No
Dendroscansor All taxa No
Dendroscansor 1 1.0 / 100 / 100 0.97 / 100 / 89 1.0 / 100 / 100 0.97 / 98 / 93 1.0 / 100 / 100 2 -‐ 0.85 / 45 / 54 -‐ 0.81 / 80 / 70 -‐ 3 1.0 / 100 / 100 0.85 / 43 / 52 1.0 / 100 / 100 0 / 1 / <5 0 / 6 / 6 4 1.0 / 94 / 86 0.98 / 78 / 79 1.0 / 92 / 86 0 / 8 / 10 0 / 1 / <5 5 1.0 / 100 / 100 0.99 / 82 / 91 1.0 / 97 / 99 0 / 8 / 8.5 0 / 3 / 7.3 6 -‐ 0.95 / 93 / 93 1.0 / 96 / 97 0.9 / 88 / 83 0.91 / 95 / 86
Xenicus gilviventris
Xenicus longipes
Acanthisitta chloris
Kuiornis indicator
Traversia lyalli
Pachyplichas yaldwyni
Dendroscansor decurvirostris
2
1
3
45
6
0.04

139
Table 3: Genetic distance matrix (% identity between taxa) comparing new sequences
presented in the present study with those from previous publications (30, 32) for the 201bp
region of 12S rRNA for which all taxa are sampled. Highly similar sequence pairs (>95%
identity) are highlighted. Pairwise distance calculated in Geneious v6.1.2 (Biomatters;
http://www.geneious.com).
T. lyalli
(this study)
A. chloris
(AY325307;
Harrison et al. 2004)
A. chloris
(Cooper, 1994)
X. longipes
(this study)
X. longipes
(Cooper, 1994)
P yaldwyni
(this study)
X. gilviventris
(this study)
X. gilviventris “gilviventris"
(Cooper, 1994)
A. chloris (AY325307; Harrison et al. 2004)
88.6
A. chloris (Cooper, 1994) 87.6 99
X. longipes (this study) 89.6 95.5 95.5
X. longipes (Cooper, 1994) 90.5 94.5 94.5 97
P. yaldwyni (this study) 88.6 94 94 94.5 93.5
X. gilviventris (this study) 89.6 94 94 94.5 93.5 99
X. gilviventris “gilviventris” (Cooper, 1994)
89.1 94.5 94.5 95 94 99.5 99.5
X. gilviventris “rineyi” (Cooper, 1994)
89.6 95 95 94.5 93.5 99 99 99.5

140
To investigate the timing of acanthisittid diversification, we conducted
molecular dating analyses on our nucleotide sequence dataset using BEAST (33).
Since all analyses strongly suggest that the Miocene Kuiornis indicator is a crown-‐
group acanthisittid (Table 1), this taxon potentially provides a useful temporal
calibration for estimating the age of the group. Consequently, we constrained the
minimum age for the divergence between Acanthisitta and Pachyplichas/Xenicus to
16 mya (31). We also implemented seven additional fossil-‐based minima throughout
the rest of the tree (see Methods). The timeframe for the early evolution of birds is
contentious (see Appendix), so we tested the effect of three different maximum age
constraints for our phylogeny (64, 84.11 and 125.3 mya). These maxima were
secondarily derived from analyses of a large genome-‐scale dataset (34), and span the
range of plausible hypotheses for the timescale of bird evolution (see Methods,
Appendix). Figure 2 displays age estimates for all nodes using the least extreme
maximum constraint (84.11 mya); estimates obtained using the alternative
constraints are displayed in Table 3. Posterior node ages varied substantially based
on the choice of maximum constraint, particularly for nodes towards the root of the
tree (Table 3). For example, mean node age estimates for the divergence between
acanthisittids and the remaining passeriforms (Figure 2: node D) varied between 52.7
and 92.3 mya depending on the maximum constraint implemented.
In order to test whether acanthisittids began diversifying prior to the New
Zealand Oligocene/Miocene marine transgression we compared the crown age of
Acanthisittidae (Figure 2, Table 3: node E) to the timing of peak inundation, which
occurred during the Waitakian (21.7-‐25.2 mya). Under all maximum constraints, the
mean age of the divergence between Traversia and the remaining acanthisittids

141
preceded the Waitakian: varying between 27.2 and 36.8 mya (Figure 3, Table 3).
However, under the two more restrictive maxima, the 95% HPD (Highest Posterior
Density) of the posterior age distribution for this node at least partially overlapped
the Waitakian.
In addition to assessing how different maximum age constraints affect our
posterior node age estimates, we also tested the effect of removing the 16 mya
minimum constraint on the divergence between Acanthisitta and
Pachyplichas/Xenicus. Removing this constraint resulted in large differences in the
posterior age estimates for most nodes (Figure 3, Table 3), although this effect was
most pronounced when the maximum age constraint on the phylogeny was relaxed
(Table 3). When the minimum age constraint on Acanthisitta was excluded, the 95%
HPDs for the divergence of Traversia from the remaining acanthisittids overlapped
the Waitakian substantially. Further, the mean age of this node either immediately
preceded, coincided with, or followed the Waitakian, depending on the maximum
constraint implemented (Figure 3, Table 3).

142
Figure 2: Phylogeny of Coraciopasseres ("core landbirds"; sensu 34). Tree topology estimated
using MrBayes, RAxML and PAUP*; branch lengths estimated using BEAST assuming a 16
mya minimum bound on the divergence between Acanthisitta and Pachyplichas/Xenicus and a
maximum of 84.11 mya on the age of Coraciopasseres (Table 3: 2A; see Methods for details).
Scale is in millions of years before present. Bars associated with nodes reflect the 95% HPD of
the posterior age distribution. Acanthisittidae is shaded grey. Extinct taxa are highlighted in
red.
01020304050607080
Pachyplichas yaldwyni
Menura novaehollandiae
Dryocopus pileatus
Xenicus longipes
Campylorhynchus zonatus
Oriolus chinensis
Eurystomus orientalis
Tyrannidae
Vireo olivaceus
Xenicus gilviventris
Sitta carolinensis
Maluridae
Traversia lyalli
Old World suboscines
Falco peregrinus
Micrastur gilvicollis
Meliphagidae
Strigops habroptilus
Acanthisitta chloris
Rhynchopsitta terrisi
A
B
C
D
E
F
G
H
J
I
K
L
M
N
O
P
Q
R
S
Acanthisittidae
Falconiformes
Psittaciformes
Passeriformes
Piciformes
Coraciiformes
Time (mya)
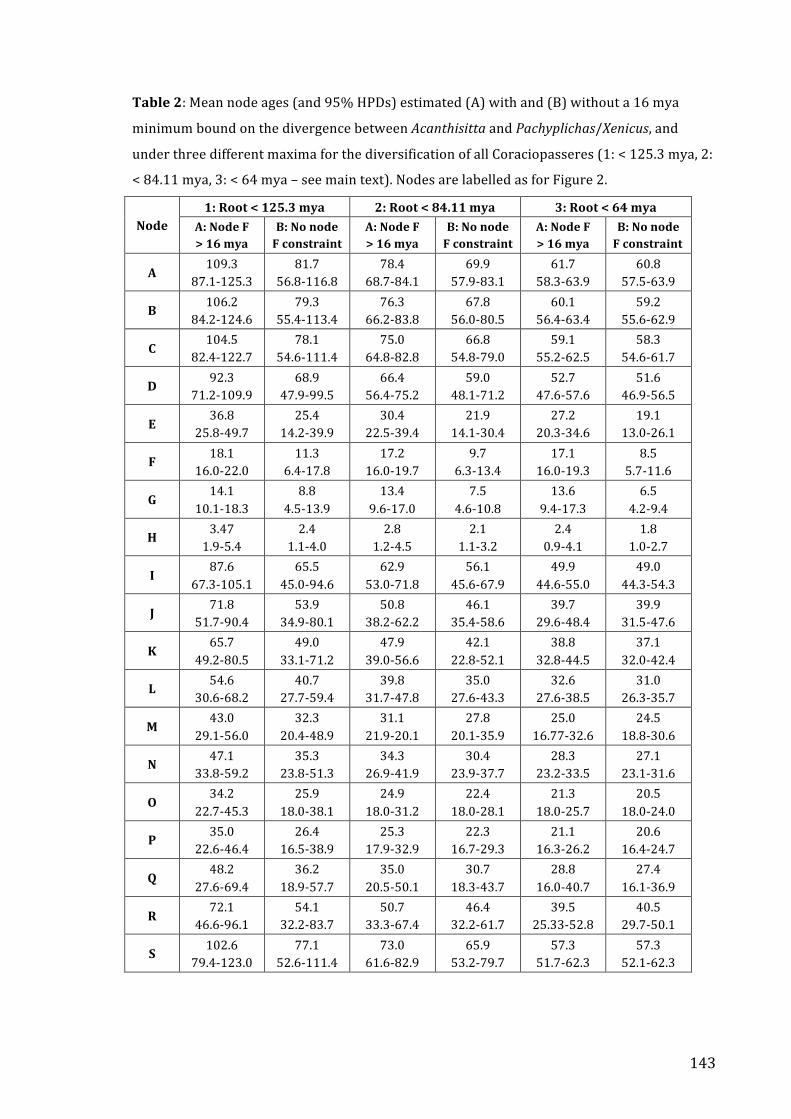
143
Table 2: Mean node ages (and 95% HPDs) estimated (A) with and (B) without a 16 mya
minimum bound on the divergence between Acanthisitta and Pachyplichas/Xenicus, and
under three different maxima for the diversification of all Coraciopasseres (1: < 125.3 mya, 2:
< 84.11 mya, 3: < 64 mya – see main text). Nodes are labelled as for Figure 2.
Node 1: Root < 125.3 mya 2: Root < 84.11 mya 3: Root < 64 mya
A: Node F > 16 mya
B: No node F constraint
A: Node F > 16 mya
B: No node F constraint
A: Node F > 16 mya
B: No node F constraint
A 109.3
87.1-‐125.3 81.7
56.8-‐116.8 78.4
68.7-‐84.1 69.9
57.9-‐83.1 61.7
58.3-‐63.9 60.8
57.5-‐63.9
B 106.2 84.2-‐124.6
79.3 55.4-‐113.4
76.3 66.2-‐83.8
67.8 56.0-‐80.5
60.1 56.4-‐63.4
59.2 55.6-‐62.9
C 104.5
82.4-‐122.7 78.1
54.6-‐111.4 75.0
64.8-‐82.8 66.8
54.8-‐79.0 59.1
55.2-‐62.5 58.3
54.6-‐61.7
D 92.3 71.2-‐109.9
68.9 47.9-‐99.5
66.4 56.4-‐75.2
59.0 48.1-‐71.2
52.7 47.6-‐57.6
51.6 46.9-‐56.5
E 36.8
25.8-‐49.7 25.4
14.2-‐39.9 30.4
22.5-‐39.4 21.9
14.1-‐30.4 27.2
20.3-‐34.6 19.1
13.0-‐26.1
F 18.1 16.0-‐22.0
11.3 6.4-‐17.8
17.2 16.0-‐19.7
9.7 6.3-‐13.4
17.1 16.0-‐19.3
8.5 5.7-‐11.6
G 14.1
10.1-‐18.3 8.8
4.5-‐13.9 13.4
9.6-‐17.0 7.5
4.6-‐10.8 13.6
9.4-‐17.3 6.5
4.2-‐9.4
H 3.47 1.9-‐5.4
2.4 1.1-‐4.0
2.8 1.2-‐4.5
2.1 1.1-‐3.2
2.4 0.9-‐4.1
1.8 1.0-‐2.7
I 87.6
67.3-‐105.1 65.5
45.0-‐94.6 62.9
53.0-‐71.8 56.1
45.6-‐67.9 49.9
44.6-‐55.0 49.0
44.3-‐54.3
J 71.8 51.7-‐90.4
53.9 34.9-‐80.1
50.8 38.2-‐62.2
46.1 35.4-‐58.6
39.7 29.6-‐48.4
39.9 31.5-‐47.6
K 65.7
49.2-‐80.5 49.0
33.1-‐71.2 47.9
39.0-‐56.6 42.1
22.8-‐52.1 38.8
32.8-‐44.5 37.1
32.0-‐42.4
L 54.6 30.6-‐68.2
40.7 27.7-‐59.4
39.8 31.7-‐47.8
35.0 27.6-‐43.3
32.6 27.6-‐38.5
31.0 26.3-‐35.7
M 43.0
29.1-‐56.0 32.3
20.4-‐48.9 31.1
21.9-‐20.1 27.8
20.1-‐35.9 25.0
16.77-‐32.6 24.5
18.8-‐30.6
N 47.1 33.8-‐59.2
35.3 23.8-‐51.3
34.3 26.9-‐41.9
30.4 23.9-‐37.7
28.3 23.2-‐33.5
27.1 23.1-‐31.6
O 34.2
22.7-‐45.3 25.9
18.0-‐38.1 24.9
18.0-‐31.2 22.4
18.0-‐28.1 21.3
18.0-‐25.7 20.5
18.0-‐24.0
P 35.0 22.6-‐46.4
26.4 16.5-‐38.9
25.3 17.9-‐32.9
22.3 16.7-‐29.3
21.1 16.3-‐26.2
20.6 16.4-‐24.7
Q 48.2
27.6-‐69.4 36.2
18.9-‐57.7 35.0
20.5-‐50.1 30.7
18.3-‐43.7 28.8
16.0-‐40.7 27.4
16.1-‐36.9
R 72.1
46.6-‐96.1 54.1
32.2-‐83.7 50.7
33.3-‐67.4 46.4
32.2-‐61.7 39.5
25.33-‐52.8 40.5
29.7-‐50.1
S 102.6 79.4-‐123.0
77.1 52.6-‐111.4
73.0 61.6-‐82.9
65.9 53.2-‐79.7
57.3 51.7-‐62.3
57.3 52.1-‐62.3

144
Figure 3: Posterior age distributions for the crown divergence amongst acanthisittids (Figure
2, Table 3: node E): the divergence between Traversia lyalli and the remaining wrens,
estimated (A) with and (B) without a 16 mya minimum bound on the divergence between
Acanthisitta and Pachyplichas/Xenicus, and under three difference maxima for the
diversification of all Coraciopasseres (1: < 125.3 mya, 2: < 84.11 mya, 3: < 64 mya – see main
text). The grey shaded area denotes the time period (Waitakian) during which the peak
inundation of Zealandia is thought to have occurred. Time scale is in millions of years before
the present.
Peak inundation (Waitakian 21.7-25.2 mya)Acanthisitta >16 mya
Acanthisitta unconstrained
1. Coraciopasseres < 125.3 mya2. Coraciopasseres < 84.11 mya3. Coraciopasseres < 64 mya
A
B
60 50 40 30 20 10 0
Time (mya)

145
Discussion
Our results provide evidence against the total submergence of Zealandia during the
Oligocene/Early Miocene marine transgression. Two lineages of acanthisittid wren
likely predate the period of peak inundation (Figure 2, Table
3): the ancestor of Traversia and the ancestor of the clade comprising Acanthisitta,
Kuiornis, Xenicus and Pachyplichas. While the validity of this conclusion depends
heavily on the implementation of a minimum constraint on the divergence between
Acanthisitta and Pachyplichas/Xenicus (16 mya), we have demonstrated that this
calibration is phylogenetically well justified: there is strong support for a close
relationship between the Acanthisitta lineage and the Miocene fossil taxon Kuiornis
(Figure 1, Table 1). When the node age constraint based on Kuiornis was included, the
mean age estimate for the divergence of Traversia from the remaining acanthisittids
preceded the beginning of the Waitakian (the period during which peak inundation
occurred) regardless of the maximum bound placed on the root of the phylogeny
(Figure 3, Table 3). However, the 95% HPDs of the posterior distribution overlapped
the Waitakian to varying degrees depending on choice of constraint. If the origin of
crown-‐birds occurred deep in the Cretaceous (Figure 3: A1) then pre-‐inundation
diversification of the acanthisittids was highly probable (lower bound of the 95%
HPD = 25.6 mya), but if modern bird orders predominantly originated in the Cenozoic
(Figure 3: A3) then the biogeographic history of acanthisittids appears less certain
(lower bound of the 95% HPD = 20.3 mya). The timescale of early bird evolution is a
matter of contention (see Appendix) (35, 36), making it difficult to determine which
of these constraints is more realistic. A less extreme constraint may be most
appropriate based on current evidence. For example, a maximum bound of 83 mya on

146
Coraciopasseres allows for the possibility that many taxonomically ambiguous fossils
from the latest Cretaceous/earliest Palaeocene (e.g. Polarornis, Tytthostonyx,
unnamed putative sphenisciform from Chatham Islands; see 37, 38) are actually
representatives of the neoavian crown group, but without presuming the existence of
deep ghost lineages for a large number of bird orders (36). Under this conservative
assumption (Figure 3: A2), pre-‐inundation history of acanthisittids in New Zealand
appeared likely (lower bound of the 95% HPD = 22.5 mya). Further, the tentative
position of Dendroscansor decurvirostris at the base of the acanthisittid tree in
analyses including the morphological data suggests that Dendroscansor may
represent a third pre-‐inundation acanthisittid lineage.
Diversification of acanthisittids preceding peak inundation suggests that they
were present in New Zealand prior to (and survived throughout) the marine
transgression, which implies the existence of persistent emergent land. However, it
does not necessarily imply that acanthisittids represent a vicariant group (as has
often been assumed; e.g. 39, 40): an ancestral acanthisittid could equally have
dispersed to New Zealand following its separation, yet before the marine
transgression. If the origin of the acanthisittid wrens were the result of vicariance,
then we should expect the divergence between acanthisittids and the remaining
passerines to closely reflect the geological separation between Australia and New
Zealand. Using a conservative maximum bound on the age of Coraciopasseres and a
16 mya minimum bound on the divergence between Acanthisitta and
Pachyplichas/Xenicus, we estimated that the origin of acanthisittids occurred between
56.4-‐75.2 mya (Figure 2, Table 3), which is close to the 55-‐60 mya separation of
Australia and New Zealand suggested by recent geological reconstructions (3). This

147
result would strongly suggest a vicariant origin of acanthisittid wrens. However, the
mean age for this particular divergence in the present study varied by ~40 My
depending on prior assumptions (Table 3), and previously published estimates for
the equivalent node range from ~38 mya (34) to 91.8 mya (41). Consequently, it
remains uncertain whether the presence of acanthisittids in New Zealand prior to
marine transgression was due to vicariance or pre-‐inundation colonisation via long-‐
distance dispersal. Certainly, several other elements of New Zealand’s avifauna
appear to have arisen from dispersal. For example, the ancestors of the moa and kiwis
likely flew to New Zealand following its separation (9, 10), and the origin of New
Zealand’s endemic nestorid parrot lineage (e.g. kakapo, Strigops habroptilus) inferred
by some analyses appears too recent to be explained by vicariance (Figure 2, Table 3,
Appendix). However, more accurate dating analyses will need to be performed before
reliable conclusions about the origin of these bird groups can be made. Incorporation
of additional fossil data will be a necessary component of this future work, in order to
better characterise evolutionary rate heterogeneity across the phylogeny of birds:
including temporal data from Kuiornis had a large effect on posterior age estimates in
the present study. Consequently, Kuiornis will likely constitute an important
calibration for future studies.
Results in the present study not only provide insight into the biogeographical
history of Acanthisittidae, but also allowed us to better assess the diversity of the
group and understand their evolution within New Zealand. For example, the
taxonomic status of Lyall’s wren (Traversia lyalli, Rothschild 1894) has been
contentious since its original description (see 42): if not for a delay in article
preparation, Lyall’s wren would instead have been described as Xenicus insularis (43).

148
Even recently the taxonomy of Lyall’s wren has remained controversial with some
authors instead favouring Xenicus lyalli (e.g. 44). However, our results unequivocally
confirm the taxonomic distinctness of Traversia, and indicate that the
morphologically “aberrant” (27) Lyall’s wren is the result of a long period (>20 My) of
independent evolution (Figure 2 and 3, Table 3). Conversely, we demonstrate
convincingly that Pachyplichas is not distinct from Xenicus (Figure 1, Table 1): the
stout-‐legged wren (P. yaldwyni) is clearly a closer relative to the rock wren (X.
gilviventris) than either is to the bush wren (X. longipes). Consequently, we
synonymize Pachyplichas Millener, 1988 with Xenicus Gray 1855, so that Pachyplichas
jagmi Millener 1988 and P. yaldwyni Millener 1988 become Xenicus jagmi and Xenicus
yaldwyni, respectively. Finally, we note that the bush wren (Xenicus longipes) as
currently recognised may in fact comprise several cryptic species: the genetic
distance observed between the bush wren individual sequenced in this study and
another individual for which some data was already available (see 30) is three-‐fold
greater that the distance observed between the rock wren and the stout-‐legged wren
(Table 2). A comprehensive molecular survey of wren remains from across New
Zealand will be necessary to further explore this possibility.
Even accounting for uncertainty in determining the precise timescale of
acanthisittid evolution, age estimates in the present study allow tentative
identification of potential drivers of the radiation of acanthisittids. The rock wren (X.
gilviventris) primarily inhabits New Zealand’s alpine and sub-‐alpine zones,
particularly the Southern Alps (45). It is consequently notable that the divergence of
the rock wren from the stout-‐legged wren (< 5 mya; Figure 2, Table 3: node H)
roughly coincides with both the origin of another primarily alpine endemic bird, the

149
kea (2.7 -‐ 8.0 mya; 46), and evidence for the uplift of New Zealand’s Southern Alps
(beginning ~5 mya; e.g. 47). It is possible that availability of an alpine niche drove the
evolution of the rock wren. However, it is unclear whether the rock wren’s current
alpine distribution actually reflects its fundamental niche or is the result of range
reduction following human colonisation. Differentiating between these two scenarios
is complicated by difficulties in discriminating sub-‐fossil remains of the rock wren
from those of the bush wren (24). However, the methods and reference data
presented herein may make this problem tractable by allowing cost-‐effective
molecular species identification from degraded and morphologically non-‐diagnostic
remains.
The stout-‐legged wren had a maximum body mass 50% greater than any other
acanthisittid, and also had a more robust pelvis and hind limbs than its relatives (24).
Since the stout-‐legged wren presumably descended from a more Xenicus-‐like form
following its divergence from the ancestor of the rock wren, the larger and heavier
morphology of the stout-‐legged wren must have evolved only relatively recently. The
rapid evolution of a completely flightless and stout-‐legged bird from a primitively
slender and gracile group is rare among passerines but well documented among rails
(e.g. 48, 49). A particularly striking comparison can be drawn to New Zealand’s
endemic swamphen, the takahē (Porphyrio hochstetteri). The ancestors of the takahē
became large and flightless no more than ~5 Mya (48), a similar timescale to the
evolution of Pachyplichas. However, a key difference between the stout-‐legged wren
and the takahē is that the takahē evolved in geographic isolation after its ancestors
dispersed to New Zealand (49) while the stout-‐legged wren apparently evolved
sympatrically with its more gracile relatives (27). The preference of the stout-‐legged
150
wren for lowland forests (24) perhaps partially explains its origin. If the evolution of
the rock wren was truly driven by availability and exploitation of an alpine niche,
then altitudinal separation may have eventually led to cessation of gene flow between
the ancestors of the rock wren and stout-‐legged wren and permitted the
morphological divergence of the stout-‐legged wren.
Although some acanthisittids have progressed further towards complete
flightlessness than others, most described species are (or were) largely terrestrial in
habit. Flight is energetically expensive (50, 51), so if the terrestrial habits and small
body size of recent acanthisittids is representative of their Oligocene ancestors then
these factors likely contributed to the survival of acanthisittids through the marine
transgression. Stephens Island (~1.5 km2) presumably supported a stable population
of Lyall’s wren over a long time period, demonstrating how multiple lineages of
acanthisittid may have survived even if New Zealand had been reduced to an
archipelago of small islands. Small body size is also a characteristic of other endemic
taxa that have been demonstrated to exhibit pre-‐inundation diversification: one
family of frogs (Leiopelmatidae; 23), a clade of geckoes (Hoplodactylus/Naultinus;
21), two genera of harvestmen (Aoraki and Rakaia; 20) and four clades of midge
(Anzacladius, Eukieffriella, Pirara and Naonella/Tonnoirocladius/Paulfreemania; 22).
An extensive reduction in habitable area would have proved a more severe
bottleneck for larger organisms (e.g. moa). Consequently, we are less likely to observe
multiple pre-‐inundation lineages in these taxa (see 5). However, our results
contribute to the growing body of evidence (both biogeographical and geological)
that habitable emergent land has been present in Zealandia continuously throughout

151
the Cenozoic, and suggest that pre-‐Oligocene fossil representatives of larger
vertebrate taxa may yet be discovered.
Methods
Processing of modern material
A specimen of Xenicus gilviventris was provided by Canterbury Museum, New
Zealand. DNA was extracted from a ~3x3mm3 section of muscle tissue using a DNeasy
Blood and Tissue kit (Qiagen) following the manufacturer’s protocol.
The mitochondrial genome of X. gilviventris was first amplified as four
overlapping fragments using an Expand Long Template PCR kit (Roche). Each
individual PCR (50 μL) contained 1.4 mM dNTPs, 3.75 U Polymerase (Taq and Tgo;
Roche), 1 × Buffer, 1.75 mM MgCl2, 20 pmol each primer (see Table S2) and up to 500
ng DNA. Cycling conditions were as follows: 94 °C for 2 min; 10 cycles of 94 °C for 10
s, 50 °C for 30 s, 72 °C for 4 min; 25 cycles of 94 °C for 10 s, 50 °C for 30 s, 72 °C for 4
min (plus 20 s/cycle); and 68 °C for 7 min. The resulting long DNA fragments were
subsequently used as the template for PCR amplification of shorter 1-‐2 kb fragments
using the primers listed in Table S2. Each individual PCR (20 μL) contained: 1 ×
buffer, 125 μM dNTPs, 10 pmol each primer (see Table S2), 1.5 mM MgCl2, 1 U Taq
Polymerase (Roche) and up to 50 ng DNA template. Cycling conditions were as
follows: 94 °C for 3 min; 35 cycles of 94 °C for 30 s, 50 °C for 30 s, 72 °C for 90 s; and
72 °C for 5 min. Prior to sequencing, PCR products were treated using 0.5 U Shrimp

152
Alkaline Phosphatase (FastAP; ThermoFisher Scientific) and 5 U Exonuclease I
(ThermoFisher Scientific). The Massey Genome Service (Massey University, New
Zealand) performed dideoxy chain-‐termination sequencing and capillary
electrophoresis (on an ABI3730). Resulting chromatograms were trimmed and
assembled into a single consensus sequence using Geneious v6.1.2 (Biomatters;
http://www.geneious.com).
Processing of ancient material
We obtained bone samples from three extinct acanthisittid species: Pachyplichas
yaldwyni (Hawk’s Cave tarsometatarsus, Canterbury Museum), Traversia lyalli
(S27777, Museum of New Zealand Te Papa Tongarewa) and Xenicus longipes
(Av37320, Canterbury Museum). All DNA extraction and library preparation steps
were performed in a purpose-‐built, physically isolated, ancient DNA laboratory at the
Australian Centre for Ancient DNA, University of Adelaide.
DNA Extraction from Xenicus longipes and Pachyplichas yaldwyni specimens
Potential contamination of the X. longipes and P. yaldwyni bone samples was
minimised by removing surfaces (c. 1 mm) using a Dremel tool, followed by wiping
the freshly exposed surfaces with bleach, and UV irradiation for 15 min. Each sample
(0.2 g) was powdered using a mikrodismembrator (Sartorius). The powdered bone
was then lysed by rotational incubation at 37 ºC overnight in 4 mL of 0.5 M EDTA pH
8.0 followed by a further incubation at 55 ºC for 2 hr with the addition of 60 μL of

153
proteinase-‐K. The released DNA was bound, washed and eluted (final volume 200 μL)
using the silica-‐based method of Rohland and Hofreiter (52).
DNA Extraction from Traversia lyalli specimen
A Dremel tool was used to remove approximately 1 mm of the exterior surface of the
T. lyalli bone, and 0.1 g of newly exposed bone material was collected. The bone
fragment was powdered using an 8 mm tungsten ball bearing in a Braun
Mikrodismembrator U (B. Braun Biotech International, Germany). The powder was
decalcified overnight in 10-‐30 vol of 0.5 M EDTA pH 8.0 at room temperature. The
resulting sediment was collected by centrifugation and digested with proteinase-‐
K/DTT overnight at 50-‐55 °C, then extracted twice with Tris-‐saturated phenol and
once with chloroform. The DNA was desalted using Centricon-‐30 filter units
(Millipore) and concentrated to approximately 100-‐150 μL.
Library preparation and hybridisation enrichment
Extracted DNA from all three ancient samples (P. yaldwyni, T. lyalli, X. longipes) was
enzymatically repaired and blunt-‐ended, and custom adapters (Table S3) were
ligated following the protocol of Meyer and Kircher (53). The 5’ adapter sequence
featured a unique index in order to allow identification and exclusion of any
downstream contamination. Libraries were subjected to a series of short PCR
amplifications (12 cycles in primary amplification and 13 cycles in secondary and
tertiary amplifications) to increase the total quantity of DNA using primers
complementary to the adapter sequences (53). Cycle number was kept low and each

154
round of amplification was split into eight separate PCRs in order to minimise PCR
bias. Each individual PCR (25 μL) contained 1× PCR buffer, 2.5 mM MgCl2, 1 mM
dNTPs, 0.5 mM each primer (Table S4), 0.1 U AmpliTaq Gold and 2 μL DNA. Cycling
conditions were as follows: 94 °C for 12 min; 12-‐13 cycles of 94 °C for 30 s, 60 °C for
30 s, 72 °C for 40 s (plus 2 s/cycle); and 72 °C for 10 min. PCR products were purified
using AMPure magnetic beads (Agencourt).
Commercially synthesised biotinylated 80 mer RNA baits (MYcroarray, MI,
USA), were used to enrich the target library for mitochondrial DNA. Baits were
designed using published whole mitochondrial genome sequences (excluding D-‐loop)
and included the rifleman (Acanthisitta chloris) among a number of other
Passeriformes (i.e. rook, Corvus frugilegus; common magpie, Pica pica) and more
distant avian outgroups (see Table S5). DNA-‐RNA hybridisation enrichment was
performed according to manufacturer’s recommendations (v1) in a final
concentration of 5.2 × SSPE, 5.2 × Denhardt’s, 5 mM EDTA and 0.1% SDS. This
solution was incubated at 55 °C for 36 hr with 200 ng of the target DNA library, after
which the RNA baits were immobilised on magnetic MyOne Streptavidin Beads (Life
Technologies). The baits were washed once with a solution of 1× SSC and 0.1% SDS
(15 min at room temperature) and twice with 0.1× SSC and 0.1% SDS (10 min at 50
°C). Subsequent resuspension in 0.1 M NaOH pH 13.0 destroyed the RNA baits,
releasing captured DNA into solution. Captured DNA was purified using a Qiagen
Minelute spin-‐column. The quantity of DNA remaining after enrichment was
extremely small, so an additional round of PCR was performed (12 cycles; conditions
as above). Subsequently, a final round of PCR (7 cycles; conditions as above) was
performed with fusion primers to add terminal IonTorrent recognition sequences to

155
the enriched library. The forward fusion primer contained an additional index
sequence (Table S3) to further identify sequencing reads belonging to the target
library.
We compared the performance of the standard hybridisation enrichment
protocol (MYcroarray MYbaits v1) to several modified protocols:
1) An additional incubation of the streptavidin beads with 100 μg yeast tRNA
prior to addition of the hybridisation reaction, potentially reducing non-‐
specific binding to the streptavidin beads.
2) As for 1) but with the wash steps performed at 45 °C instead of 50 °C,
decreasing the stringency of the wash steps and potentially allowing more
endogenous molecules to be retained (since the target organisms were
phylogenetically distant from those used to design the bait molecules).
3) As for 1) but with the first round of post-‐hybridisation amplification
omitted, potentially decreasing PCR-‐bias and increasing library complexity.
4) As for 1) and 3) but with the hybridisation buffer replaced with formamide
buffer, a hybridisation temperature of 42 °C instead of 55 °C, and four wash
steps instead of three (one with 2 × SSC and 0.05% Tween20 [Sigma-‐Aldrich]
at room temperature for 10 min, two with 0.75 × SSX and 0.05% Tween20
[Sigma-‐Aldrich] at 50 °C for 10 min, and one with 0.2 × SSC + 0.05% Tween20
[Sigma-‐Aldrich] at 50 °C for 10 min). Formamide lowers the melting

156
temperature of DNA allowing hybridisation to be performed at a lower
temperature (54) Further, formamide buffers favour formation of DNA/RNA
over DNA/DNA duplexes (55), potentially increasing the efficiency of capture.
5) Omission of all hybridisation enrichment steps (shotgun sequencing).
Enrichment proportions obtained using each protocol are outlined in Table S6.
Briefly, enrichment increased the proportion of endogenous reads obtained by two
orders of magnitude (a 186 × increase), but differences among the enrichment
protocols are inconclusive and require more extensive study and replication. All data
generated for each specimen were pooled for downstream analysis, including read
mapping.
Sequencing and data processing
Final sequencing libraries were diluted then linked to proprietary micron-‐scale beads
(Ion Sphere Particles; Life Technologies) and clonally amplified via emulsion PCR
using the Ion OneTouch system (Life Technologies). DNA sequencing was performed
at the Australian Centre for Ancient DNA (ACAD) on an IonTorrent PGM (Life
Technologies) using 200bp sequencing chemistry and four 316 chips.
Following sequencing, base calling was performed using Torrent Suite v3.2.1
(Life Technologies). Sequencing reads were immediately demultiplexed according to
5’ Index II (Table S3) using the fastx_barcode_splitter tool (FASTX-‐toolkit v0.0.13;
http://hannonlab.cshl.edu/fastx_toolkit) allowing no mismatches in the index

157
sequences (-‐-‐mismatches 0). Demultiplexed reads (14,192,512) were trimmed with
cutadapt v1.1 (56), using the short custom adapter sequences (Table S3). Trimming
parameters included a maximum error rate of 0.333 (-‐e 0.333), a minimum read
length of 30 nucleotides (-‐m 30), a maximum read length of 200 nucleotides (-‐M 200),
a minimum read quality Phred score of 20 (-‐q 20), a minimum of three-‐nucleotides
overlap between the read and the adapter (-‐O 3), and five iterations of trimming (-‐n
5). Read quality was visualized using fastQC v0.10.1
(http://www.bioinformatics.bbsrc.ac.uk/projects/fastqc) before and after trimming
to make sure the trimming of adapters was efficient. Trimmed reads were then sorted
according to 5’ Index I (Table S3) using the fastx_barcode_splitter tool (FASTX-‐toolkit
v0.0.13; http://hannonlab.cshl.edu/fastx_toolkit) allowing no mismatches in the
index sequences (-‐-‐mismatches 0). The removal of the five bp 5’ Index I resulted in a
pool of reads between 25 -‐195 bp in length, which were subsequently used for
mapping and consensus assembly.
As we were sequencing extinct taxa de novo, we had no established references
to map against. In the present study, we follow an iterative mapping protocol adapted
from several previous publications (9, 57). For each specimen separately, all
deconvoluted and trimmed reads were mapped to the rifleman mitochondrial
genome (AY325307) using TMAP v3.2.2 (https://github.com/nh13/TMAP) with the
default parameters for the ‘mapall’ command. Reads with a mapping quality Phred
score >30 were selected using the SAMtools v1.4 (58) view command (-‐q 30), and
duplicate reads were discarded using the MarkDuplicates.jar tool from Picard tools
v1.79 (http://picard.sourceforge.net). A 50% consensus was generated from the
mapped reads, and used as the reference for an additional round of mapping. This

158
process was iterated six times until no additional reads could be mapped and the
quality of the consensus ceased to improve. A final, more stringent, iteration of
mapping was then performed using the ‘aln’ command within BWA v.0.7.8 (59) with
seed disabled (-‐l 1024), a maximum of two gaps (-‐o 2) and a relaxed maximum edit
distance (-‐n 0.01). A final 75% consensus sequence was generated for each specimen
and checked by eye in Geneious v6.1.2 (Biomatters; http://www.geneious.com). Sites
that received no coverage or insufficient coverage to unambiguously call a nucleotide
were coded as IUPAC ambiguities. See Table S7 for further details on consensus
sequences.
We used MapDamage v0.3.3 (60) to assess patterns of damage across all
mapped reads (Figures S1, S2 and S3). In all cases, patterns observed were consistent
with degraded ancient DNA (elevated 5’ C-‐to-‐T and 3’ A-‐to-‐G substitutions, and
depurination at the position preceding the beginning of the reads) though these
patterns were stronger for some samples than for others, possibly reflecting different
preservation histories. We also detect an increase in other substitution types towards
the ends of reads for some specimens, particularly Xenicus longipes. These
mismatches may be a result of indel errors accumulated during sequencing (frequent
in IonTorrent data; 61) resulting in poor alignment accuracy towards the ends of
reads. This artefact occurs at sufficiently low frequency that it does not affect the final
consensus sequence. Alternatively, it could result from the relatively low number of
reads aligning to the consensus for X. longipes compared to P. yaldwyni and T. lyalli
(see Table S7)

159
Phylogenetics and molecular dating
Our new acanthisittid sequences were aligned with previously published
mitochondrial genomes from a number of other species from within Coraciopasseres
(sensu 34) (Table S7): the “core landbirds”, comprising all descendants of the
common ancestor of Passeriformes and Coraciiformes. Sequences were aligned using
the ClustalW algorithm as implemented in Geneious v6.1.2 (Biomatters;
http://www.geneious.com), and checked by eye. The molecular data were augmented
with a previously published matrix of osteological characters (31). Equivalent
Bayesian, maximum likelihood and maximum parsimony analyses were run on the
molecular and morphological data both individually and combined (total evidence).
Taxa that were missing molecular data (see Table S7) were omitted from analyses of
the molecular dataset alone, and vice versa.
Since we were primarily interested in inferring the relationships among
acanthisittids, we placed several a priori constraints on outgroup nodes in accordance
with previous studies (e.g. 34, 62). In analyses of the molecular data, we constrained
the reciprocal monophyly of Passeriformes and Psittaciformes, reciprocal monophyly
of Passeriformes+Psittaciformes (Psittacopasserimorphae) and Falconiformes, and
the reciprocal monophyly of Psittacopasserimorphae+Falconiformes
(Psittacopasseria) and Coraciimorphae. Additionally, analyses of the combined
dataset and the morphological data alone were further constrained (in accordance
with the results of the molecular data): the reciprocal monophyly of Passeri and
Tyranni was enforced, as was the reciprocal monophyly of Passeri+Tyranni and
Acanthisittidae. The position of the acanthisittid taxa for which no molecular data

160
was sampled (i.e. Dendroscansor decurvirostris and Kuiornis indicator) was
unconstrained in all analyses, to allow for the possibility that Acanthisittidae is
paraphyletic. In addition, all analyses including the morphological data were run both
with and without the inclusion of Dendroscansor in order to assess the effect of its
inclusion on ingroup branch support.
Optimal partitioning and substitution models for the molecular data were
determined for each analysis using Partitionfinder v1.1.1. (63). PartitionFinder
favoured schemes ranging from 8-‐10 partitions reduced from an input of 45 putative
partitions (Table S8): first, second and third codon positions of each mitochondrial
protein-‐coding gene; and stem and loop sites of 12S rRNA, 16S rRNA and
concatenated tRNAs. Third codon positions were concatenated a priori before
assessing the optimal partitioning and models for BEAST analyses, as Partitionfinder
was unable to calculate model likelihoods for some individual genes due to a lack of
informative sites. Stem and loop positions of RNA-‐coding genes were identified using
RNAalifold (64). Third codon positions of protein coding genes were RY-‐coded to
reduce the influence of transition saturation. Morphological data were analysed as an
additional partition.
Bayesian analyses were performed using MrBayes v3.2.2 (65). Where
included, morphological data were analysed using the MK model (66), with equal
rates across sites (Bayes factor analysis did not support the inclusion of a gamma
parameter for rate heterogeneity). Each MrBayes analysis employed four separate
runs of four Markov chains each (one cold and three incrementally heated) using
default priors. Each chain ran for 4 x 10⁷ generations, sampling every 4,000.

161
Convergence in topology was assessed using the average standard deviation of clade
(split) frequencies (<0.02), while convergence in individual parameter values was
assessed through potential scale reduction factors approaching 1, and through
broadly overlapping distributions and effective sample sizes >200 in Tracer v1.6
(http://tree.bio.ed.ac.uk/software/tracer/). Sampled trees were summarized as a
majority-‐rule consensus tree after discarding the first 10% of trees as burnin.
Maximum likelihood analyses were run using RAxML v.7.2.8 (67). RAxML
analyses comprised a maximum likelihood search for the best-‐scoring tree from
1,000 bootstrap replicates. Where included, morphological data were modelled using
the MK (66) multigamma option, and all characters were treated as unordered. All
polymorphic sites among the morphological data were treated as unknown.
Maximum parsimony analyses were run using PAUP* (68) with heuristic
searches involving 1000 random addition replicates. 200 bootstrap replicates were
performed for each analysis. All morphological characters were treated as unordered.
Molecular dating analyses were performed using BEAST v1.8 (33) on a dataset
comprising only those taxa sampled for molecular data (Table S7). We constrained
the minimum age of eight nodes in accordance with the first appearance of
unequivocal descendants of those nodes in the fossil record (Table 4). Due to
incompleteness of the fossil record of birds during the Cretaceous, maximum bounds
for the divergence of modern birds are difficult to determine objectively (35, 36), and
it has been demonstrated that this can have a large effect on the inferred timescale of
bird evolution (see Appendix). Consequently, we ran independent analyses testing

162
the effect of three different, derived from the upper bound of the 95% HPD for
Coraciopasseres (the root of the phylogeny: node A) as estimated using a genome-‐
scale nucleotide dataset for all birds (see Appendix): 64 mya as for analyses when the
maximum age of birds was constrained to 99.6 mya, 84.11 mya as for analyses when
the maximum age of birds was constrained to 117.5 mya, and 125.3 mya as for
analyses when no constraint was placed on the origin of birds. The same maximum
bound was used for all calibrated nodes (Table 4), and all constraints were
implemented as uniform distributions with hard minima and maxima. In addition to
testing the affect of different maxima on our inferred dates, we also ran all analyses
with and without the constraint on node F in order to test the contribution of
temporal information based on Kuiornis to posterior age estimates.
Table 4: Values and justification for minimum age constraints employed in molecular dating.
Nodes are labelled as for Figure 2 and Table 3.
Node Description Minimum (mya)
Justification
O Sittidae+Troglodytidae 18.0 Following Ericson et al. (69). Based on earliest certhioid (Certhiops), from the Miocene (70).
P Oriolidae+Vireonidae 16.3 Following Ericson et al. (69). Based on earliest oriolid (Longimornis), from the Miocene (71).
M Maluridae+Meliphagidae 10.4 Following Ericson et al. (69). Based on earliest meliphagid (unnamed), from the Miocene (72).
F Acanthisitta+ Xenicus/Pachyplichas
16.0 Based on Kuiornis indicator (31). See main text.
C Passeriformes+ Psittaciformes
54.6 Based on a stem passerine from the Eocene (73).
Q Nestoridae+Psittacidae 16.0 Based on earliest known nestotid (Nelepsittacus), from the Miocene (74).
S Coraciiformes+Piciformes 51.0 Based on earliest coraciiform (Primobucco) from the Eocene (75).
A Coraciopasseres; the root of the tree
56.8 Following Jarvis et al. (34). Based on a strigiform (Berruornis), from the Palaeocene (76).

163
For each of the six calibration schemes (three different maxima, with and
without a minimum constraint on node F) we ran two independent MCMC chains in
BEAST. Each chain was run for 108 generations sampling every 105 with the first 10%
of samples discarded as burnin. The hypothesis of a global clock was tested and
rejected, so we used independent relaxed uncorrelated lognormal clock model, with a
rate multiplier allowing relative rates to vary according to data partition (see Table
S8). In addition, a birth-‐death prior was placed on the distribution of nodes in the
phylogeny. To facilitate faster convergence, we constrained the tree topology
inaccordance with the best-‐supported tree from the previous MrBayes, RAxML and
PAUP* analyses (see Figure 2). Parameter values were monitored in Tracer v1.6 to
ensure convergence and ESSs >200. Sampled trees and parameter values from the
two chains run for each calibration scheme were combined before summarising the
results.
Comparison with existing acanthisittid sequence data
Short sequences (201 bp) of mitochondrial 12S rRNA have previously been published
for individuals of A. chloris, X. longipes and two putative subspecies of X. gilviventris: X.
g. gilviventris and X. g. rineyi (30). In order to assess and compare intra-‐species
diversity, we aligned these sequences with the comparable region (position 674-‐874
of the Acanthisitta chloris mitogenome, AY325307) of the acanthisittid mitogenomes
sequences from our main dataset (see Table S7) using the ClustalW algorithm as
implemented in Geneious v6.1.2, and calculated genetic distances between each pair
of individuals (also using Geneious v6.1.2).

164
Acknowledgements
Funding for this project was awarded by the NZ Marsden Fund. Grid computing
facilities were provided by the CIPRES (Cyberinfrastructure for Phylogenetic
Research) Science Gateway.

165
References
1. Clague DA (1996) The growth and subsidence of the Hawaiian-‐Emporer
volcanic chain. The Origin and Evolution of Pacific Island Biotas, New Guinea to
Eastern Polynesia: Patterns and Processes, eds Keast A & Miller SE (SPB
Academic Publishing, Amsterdam).
2. McDougall I, Embleton BJJ, & Stone DB (1981) Origin and evolution of Lord
Howe Island, Southwest Pacific Ocean. J Geol Soc Aust 28(1-‐2):155-‐176.
3. Schellart WP, Lister GS, & Toy VG (2006) A Late Cretaceous and Cenozoic
reconstruction of the Southwest Pacific region: Tectonics controlled by
subduction and slab rollback processes. Earth-‐Sci Rev 76(3-‐4):191-‐233.
4. Worthy TH & Holdaway RN (2002) The Lost World of the Moa: Prehistoric Life
of New Zealand. (Indiana University Press/Canterbury University Press,
Bloomington/Christchurch).
5. Sharma PP & Wheeler WC (2013) Revenant clades in historical biogeography:
the geology of New Zealand predisposes endemic clades to root age shifts. J
Biogeogr 40(8):1609-‐1618.
6. Goldberg J, Trewick SA, & Paterson AM (2008) Evolution of New Zealand's
terrestrial fauna: a review of molecular evidence. Philosophical Transactions of
the Royal Society B: Biological Sciences 363(1508):3319-‐3334.
7. Waters JM & Craw D (2006) Goodbye Gondwana? New Zealand biogeography,
geology, and the problem of circularity. Syst Biol 55(2):351-‐356.
8. Cooper RA & Millener PR (1993) The New Zealand biota: Historical
background and new research. Trends Ecol Evol 8(12):429-‐433.
9. Mitchell KJ, et al. (2014) Ancient DNA reveals elephant birds and kiwi are
sister taxa and clarifies ratite bird evolution. Science 344(6186):898-‐900.
10. Worthy TH, et al. (2013) Miocene fossils show that kiwi (Apteryx, Apterygidae)
are probably not phyletic dwarves. Paleornithological Research 2013 -‐
Proceedings of the 8th International Meeting of the Society of Avian
Paleontology and Evolution, eds Göhlich UB & Kroh A), pp 63-‐80.

166
11. Knapp M, et al. (2005) Relaxed molecular clock provides evidence for long-‐
distance dispersal of Nothofagus (Southern Beech). PLoS Biol 3(1):e14.
12. Biffin E, Hill RS, & Lowe AJ (2010) Did kauri (Agathis: Araucariaceae) really
survive the Oligocene drowning of New Zealand? Syst Biol 59(5):594-‐602.
13. Cooper A & Cooper RA (1995) The Oligocene bottleneck and New Zealand
biota -‐ genetic record of a past environmental crisis. Proceedings of the Royal
Society B-‐Biological Sciences 261(1362):293-‐302.
14. Landis CA, et al. (2008) The Waipounamu Erosion Surface: questioning the
antiquity of the New Zealand land surface and terrestrial fauna and flora. Geol
Mag 145(02):173-‐197.
15. Campbell HJ & Landis CA (2001) New Zealand awash. New Zealand Geographic
(51):6-‐7.
16. Strogen DP, Bland KJ, Nicol A, & King PR (2014) Paleogeography of the
Taranaki Basin region during the latest Eocene-‐Early Miocene and
implications for the 'total drowning' of Zealandia. N Z J Geol Geophys
57(2):110-‐127.
17. Riordan NK, Reid CM, Bassett KN, & Bradshaw JD (2014) Reconsidering basin
geometries of the West Coast: the influence of the Paparoa Core Complex on
Oligocene Rift Systems. N Z J Geol Geophys 57(2):170-‐184.
18. Kamp PJJ, Tripathi ARP, & Nelson CS (2014) Paleogeography of Late Eocene to
earliest Miocene Te Kuiti Group, central-‐western North Island, New Zealand. N
Z J Geol Geophys 57(2):128-‐148.
19. Crisp MD, Trewick SA, & Cook LG (2011) Hypothesis testing in biogeography.
Trends in ecology & evolution 26(2):66-‐72.
20. Giribet G, et al. (2012) Evolutionary and biogeographical history of an ancient
and global group of arachnids (Arachnida: Opiliones: Cyphophthalmi) with a
new taxonomic arrangement. Biol J Linn Soc 105(1):92-‐130.
21. Nielsen SV, Bauer AM, Jackman TR, Hitchmough RA, & Daugherty CH (2011)
New Zealand geckos (Diplodactylidae): Cryptic diversity in a post-‐Gondwanan
lineage with trans-‐Tasman affinities. Mol Phylogenet Evol 59(1):1-‐22.

167
22. Krosch MN, Baker AM, Mather PB, & Cranston PS (2011) Systematics and
biogeography of the Gondwanan Orthocladiinae (Diptera: Chironomidae). Mol
Phylogenet Evol 59(2):458-‐468.
23. Roelants K, et al. (2007) Global patterns of diversification in the history of
modern amphibians. Proceedings of the National Academy of Sciences
104(3):887-‐892.
24. Tennyson A & Martinson P (2006) Extinct birds of New Zealand (Te Papa Press,
Wellington, New Zealand).
25. Rando JC, López M, & Seguí B (1999) A new species of extinct flightless
passerine (Emberizidae: Emberiza) from the Canary Islands. The Condor
101(1):1-‐13.
26. Millener PR & Worthy TH (1991) Contributions to New Zealand's Late
Quaternary avifauna. II: Dendroscansor decurvirostris, a new genus and species
of wren (Aves: Acanthisittidae). J R Soc N Z 21(2):179-‐200.
27. Millener PR (1988) Contributions to New Zealand's Late Quaternary avifauna.
1: Pachyplichas, a new genus of wren (Aves: Acanthisittidae), with two new
species. J R Soc N Z 18(4):383-‐406.
28. Millener PR (1989) The only flightless passerine: the Stephens Island wren
(Traversia lyalli : Acanthisittidae). Notornis 36(4):280-‐284.
29. Gill BJ, et al. (2010) Checklist of the birds of New Zealand, Norfolk and
Macquarie Islands, and the Ross Dependency, Antarctica. 4th edition. (Te Papa
Press and Ornithological Society of New Zealand, Wellington).
30. Cooper A (1994) Ancient DNA sequences reveal unsuspected phylogenetic
relationships within New Zealand wrens (Acanthisittidae). Experientia
50(6):558-‐563.
31. Worthy TH, et al. (2010) Biogeographical and phylogenetic implications of an
Early Miocene wren (Aves: Passeriformes: Acanthisittidae) from New Zealand.
J Vertebr Paleontol 30(2):479-‐498.

168
32. Harrison GL, et al. (2004) Four new avian mitochondrial genomes help get to
basic evolutionary questions in the late Cretaceous. Mol Biol Evol 21(6):974-‐
983.
33. Drummond AJ & Rambaut A (2007) BEAST: Bayesian evolutionary analysis by
sampling trees. BMC Evol Biol 7(214).
34. Jarvis ED, et al. (2014) Whole-‐genome analyses resolve early branches in the
tree of life of modern birds. Science 346(6215):1320-‐1331.
35. Brocklehurst N, Upchurch P, Mannion PD, & O'Connor J (2012) The
Completeness of the Fossil Record of Mesozoic Birds: Implications for Early
Avian Evolution. PLoS ONE 7(6):e39056.
36. Ksepka DT, Ware JL, & Lamm KS (2014) Flying rocks and flying clocks:
disparity in fossil and molecular dates for birds. Proc R Soc B 281(1788).
37. Mayr G (2014) The origins of crown group birds: molecules and fossils.
Palaeontology 57(2):231-‐242.
38. Mayr G (2009) Palaeognathous Birds. Paleogene Fossil Birds, (Springer-‐Verlag,
Berlin), pp 25-‐34.
39. Ericson PGP, et al. (2002) A Gondwanan origin of passerine birds supported by
DNA sequences of the endemic New Zealand wrens. Proceedings of the Royal
Society B-‐Biological Sciences 269(1488):235-‐241.
40. Barker FK, Cibois A, Schikler P, Feinstein J, & Cracraft J (2004) Phylogeny and
diversification of the largest avian radiation. Proc Natl Acad Sci U S A
101(30):11040-‐11045.
41. Pereira SL & Baker AJ (2006) A mitogenomic timescale for birds detects
variable phylogenetic rates of molecular evolution and refutes the standard
molecular clock. Mol Biol Evol 23(9):1731-‐1740.
42. Galbreath R & Brown D (2004) The tale of the lighthouse-‐keeper's cat:
Discovery and extinction of the Stephens Island wren (Traversia lyalli).
Notornis 51(4):193-‐200.
43. Buller SWL (1895) On a new species of Xenicus from an island off the coast of
New Zealand. Ibis 37(2):236-‐237.

169
44. Clements JF, et al. (2014) The eBird/Clements checklist of birds of the world:
Version 6.9. Downloaded from
http://www.birds.cornell.edu/clementschecklist/download/ (Cornell
Univeresity Press).
45. Michelsen-‐Heath S & Gaze P (2007) Changes in abundance and distribution of
the rock wren (Xenicus gilviventris) in the South Island, New Zealand. Notornis
54(2):71-‐78.
46. Wood JR, et al. (2014) An extinct nestorid parrot (Aves, Psittaciformes,
Nestoridae) from the Chatham Islands, New Zealand. Zool J Linn Soc
172(1):185-‐199.
47. Batt GE, Braun J, Kohn BP, & McDougall I (2000) Thermochronological analysis
of the dynamics of the Southern Alps, New Zealand. Geol Soc Am Bull
112(2):250-‐266.
48. Garcia-‐R JC, Gibb GC, & Trewick SA (2014) Deep global evolutionary radiation
in birds: Diversification and trait evolution in the cosmopolitan bird family
Rallidae. Mol Phylogenet Evol 81(0):96-‐108.
49. Trewick SA (1997) Flightlessness and phylogeny amongst endemic rails (Aves:
Rallidae) of the New Zealand region. Philosophical Transactions of the Royal
Society of London. Series B: Biological Sciences 352(1352):429-‐446.
50. McNab BK (1994) Energy Conservation and the Evolution of Flightlessness in
Birds. The American Naturalist 144(4):628-‐642.
51. McNab BK & Ellis HI (2006) Flightless rails endemic to islands have lower
energy expenditures and clutch sizes than flighted rails on islands and
continents. Comparative Biochemistry and Physiology Part A: Molecular &
Integrative Physiology 145(3):295-‐311.
52. Rohland N & Hofreiter M (2007) Ancient DNA extraction from bones and teeth.
Nature Protocols 2(7):1756-‐1762.
53. Meyer M & Kircher M (2010) Illumina sequencing library preparation for
highly multiplexed target capture and sequencing. Cold Spring Harbor
Protocols 2010(6):1-‐10.

170
54. McConaughy BL, Laird CD, & McCarthy BJ (1969) Nucleic acid reassociation in
formamide. Biochemistry 8(8):3289-‐3295.
55. Casey J & Davidson N (1977) Rates of formation and thermal stabilities of
RNA:DNA and DNA:DNA duplexes at high concentrations of formamide.
Nucleic Acids Res 4(5):1539-‐1552.
56. Martin M (2012) Cutadapt removes adapter sequences from high-‐throughput
sequencing reads. Bioinformatics in Action 17(1):10-‐12.
57. Mitchell KJ, Wood JR, Scofield RP, Llamas B, & Cooper A (2014) Ancient
mitochondrial genome reveals unsuspected taxonomic affinity of the extinct
Chatham duck (Pachyanas chathamica) and resolves divergence times for New
Zealand and sub-‐Antarctic brown teals. Mol Phylogenet Evol 70:420-‐428.
58. Li H, et al. (2009) The Sequence Alignment/Map (SAM) format and SAMtools.
Bioinformatics 25(16):2078-‐2079.
59. Li H & Durbin R (2009) Fast and accurate short read alignment with Burrows-‐
Wheeler transform. Bioinformatics 25(14):1754-‐1760.
60. Ginolhac A, Rasmussen M, Gilbert MTP, Willerslev E, & Orlando L (2011)
mapDamage: testing for damage patterns in ancient DNA sequences.
Bioinformatics 27(15):2153-‐2155.
61. Yeo ZX, et al. (2012) Improving indel detection specificity of the Ion Torrent
PGM benchtop sequencer. PLoS ONE 7(9):e45798.
62. Hackett SJ, et al. (2008) A phylogenomic study of birds reveals their
evolutionary history. Science 320(5884):1763-‐1768.
63. Lanfear R, Calcott B, Ho SY, & Guindon S (2012) PartitionFinder: combined
selection of partitioning schemes and substitution. Mol Biol Evol 29(6):1537-‐
1719.
64. Bernhart S, Hofacker I, Will S, Gruber A, & Stadler P (2008) RNAalifold:
improved consensus structure prediction for RNA alignments. BMC
Bioinformatics 9(1):474.
171
65. Ronquist F, et al. (2012) MrBayes 3.2: efficient Bayesian phylogenetic
inference and model choice across a Large model space. Syst Biol 61(3):539-‐
542.
66. Lewis PO (2001) A likelihood approach to estimating phylogeny from discrete
morphological character data. Syst Biol 50(6):913-‐925.
67. Stamatakis A, Hoover P, & Rougemont J (2008) A rapid bootstrap algorithm for
the RAxML web servers. Syst Biol 57(5):758-‐771.
68. Swofford DL (2002) PAUP*. Phylogenetic Analysis Using Parsimony (*and Other
Methods). (Sinauer Associates, Sunderland, Massachussets).
69. Ericson P, Klopfstein S, Irestedt M, Nguyen J, & Nylander J (2014) Dating the
diversification of the major lineages of Passeriformes (Aves). BMC Evol Biol
14(1):8.
70. Manegold A (2008) Earliest fossil record of the Certhioidea (treecreepers and
allies) from the early Miocene of Germany. J Ornithol 149(2):223-‐228.
71. Boles WE (1999) A new songbird (Aves: Passeriformes: Oriolidae) from the
Miocene of Riversleigh, northwestern Queensland, Australia. Alcheringa: An
Australasian Journal of Palaeontology 23(1):51-‐56.
72. Boles WE (2005) Fossil honeyeaters (Meliphagidae) from the Late Tertiary of
Riversleigh, north-‐western Queensland. Emu 105(1):21-‐26.
73. Boles WE (1995) The world's oldest songbird. Nature 374(6517):21-‐22.
74. Worthy TH, Tennyson AJD, & Scofield RP (2011) An early Miocene diversity of
parrots (Aves, Strigopidae, Nestorinae) from New Zealand. J Vertebr Paleontol
31(5):1102-‐1116.
75. Ksepka DT & Clarke JA (2010) Primobucco mcgrewi (Aves: Coracii) from the
Eocene Green River Formation: new anatomical data from the earliest
constrained record of stem rollers. J Vertebr Paleontol 30(1):215-‐225.
76. Mourer-‐Chauviré C (1994) A large owl from the Palaeocene of France.
Palaeontology 37:339-‐348.


173
Supplementary Information
Figure S1: MapDamage report for the final round of mapping for Traversia lyalli. The top
panels show the high frequency of purines immediately before the reads characteristic of
ancient DNA (although this signal is weak for adenine). The two lower panels show the
accumulation of 5’ C-‐to-‐T (red) and 3’ G-‐to-‐A (blue) misincorporations characteristic of
ancient DNA. T-‐to-‐C and A-‐to-‐G transitions are shown in orange and black, respectively. Other
substitutions are shown in grey. Insertions and deletions are shown in purple and green,
respectively.
A
0.0
0.1
0.2
0.3
0.4
0.5
Frequency
� � � � � � �
� ��
��
� �� � � � � �
A
�� � �
� � � �
�
�
�
�
�
� � �� � � �
Traversia lyalliC
� �� � � � �
� �
�
� ��
��
� � � � �
C
0.0
0.1
0.2
0.3
0.4
0.5
��
��
�� �
�
��
�
�� �
�
� � � � �
G
0.0
0.1
0.2
0.3
0.4
0.5
ï�� ï� ï� ï� ï� ï� ï� ï� ï� ï� 0 1 2 3 4 5 � � � � 10
Frequency
� � � � � �� �
�
�
� �
� � � � � � � �
G
ï�� ï� ï� ï� ï� ï� ï� ï� ï� ï� 0 1 2 3 4 5 � � � � 10
��
�� � �
�
�
�
�
�
�
� �
�
�� � � �
T
ï�� ï� ï� ï� ï� ï� ï� ï� ï� ï� 0 1 2 3 4 5 � � � � 10
� � � � � � � � �
� �
�
�
� � � � � � �
T
0.0
0.1
0.2
0.3
0.4
0.5
ï�� ï� ï� ï� ï� ï� ï� ï� ï� ï� 0 1 2 3 4 5 � � � � 10
��
�
��
�
� �
�
�
��
�
�
� � � � � �
1 2 3 4 5 � � � � 10 11 12 13 14 15 �� �� �� �� 20 21 22 23 24 25
0.000.020.04��������0.100.120.14��������0.200.220.24��������0.30
Frequency
�
�
�
�
�
�
�
�
�
�
�
�
�
�
�
ï�� ï� ï� ï� ï� ï� ï� ï� ï� ï�
0.000.020.04��������0.100.120.14��������0.200.220.24��������0.30

174
Figure S2: MapDamage report for the final round of mapping for Pachyplichas yaldwyni. The
top panels show the high frequency of purines immediately before the reads characteristic of
ancient DNA (although this signal is weak for adenine). The two lower panels show the
accumulation of 5’ C-‐to-‐T (red) and 3’ G-‐to-‐A (blue) misincorporations characteristic of
ancient DNA. T-‐to-‐C and A-‐to-‐G transitions are shown in orange and black, respectively. Other
substitutions are shown in grey. Insertions and deletions are shown in purple and green,
respectively.
A
0.0
0.1
0.2
0.3
0.4
0.5
Frequency
� � � � � � �� �
� � �� � � � � � � �
A
�� �
� � ��
� �
� �
��
��
�
��
� �
Pachyplichas yaldwyniC
� � � � � � �� �
��
�
�� �
�� � � �
C
0.0
0.1
0.2
0.3
0.4
0.5
� � � � � ��
�
�
� �
� �
� �
� ��
� �
G
0.0
0.1
0.2
0.3
0.4
0.5
ï�� ï� ï� ï� ï� ï� ï� ï� ï� ï� 0 1 2 3 4 5 � � � � 10
Frequency
��
� � � � � � �
�
�
�
� � � � �� � �
G
ï�� ï� ï� ï� ï� ï� ï� ï� ï� ï� 0 1 2 3 4 5 � � � � 10
�� � �
� � �
�
�
�
�
�
� �
�
�
��
��
T
ï�� ï� ï� ï� ï� ï� ï� ï� ï� ï� 0 1 2 3 4 5 � � � � 10
� ��
� � � � � �
�
�
��
� � �� � � �
T
0.0
0.1
0.2
0.3
0.4
0.5
ï�� ï� ï� ï� ï� ï� ï� ï� ï� ï� 0 1 2 3 4 5 � � � � 10
� � �� �
� ��
�
�
��
�
�
� ��
� ��
1 2 3 4 5 � � � � 10 11 12 13 14 15 �� �� �� �� 20 21 22 23 24 25
0.000.020.04��������0.100.120.14��������0.200.220.24��������0.30
Frequency
�
�
�
�
�
�
�
�
�
�
�
�
�
�
�
ï�� ï� ï� ï� ï� ï� ï� ï� ï� ï�
0.000.020.04��������0.100.120.14��������0.200.220.24��������0.30

175
Figure S3: MapDamage report for the final round of mapping for Xenicus longipes. The top
panels show the high frequency of purines immediately before the reads characteristic of
ancient DNA. The two lower panels show the accumulation of 5’ C-‐to-‐T (red) and 3’ G-‐to-‐A
(blue) misincorporations characteristic of ancient DNA. T-‐to-‐C and A-‐to-‐G transitions are
shown in orange and black, respectively. Other substitutions are shown in grey. Insertions
and deletions are shown in purple and green, respectively. Note that there is an accumulation
of substitutions in the first five bp of mapped reads. These mismatches may be a result of
indel errors accumulated during sequencing (frequent in IonTorrent data; 61) resulting in
poor alignment accuracy towards the ends of reads. This artefact occurs at sufficiently low
frequency that it does not affect the final consensus sequence.
A
0.0
0.1
0.2
0.3
0.4
0.5
Frequency
� ��
� �� � �
��
�
�� �
��
��
� �
A
��
��
�� �
��
�
�
�
�
� �
� �
� ��
Xenicus longipesC
� � �� �
� �� �
��
� �� �
�� � � �
C
0.0
0.1
0.2
0.3
0.4
0.5
�� � � �
�
��
��
�
� �
� �� � � � �
G
0.0
0.1
0.2
0.3
0.4
0.5
ï�� ï� ï� ï� ï� ï� ï� ï� ï� ï� 0 1 2 3 4 5 � � � � 10
Frequency
�� �
� � �� �
�
�
�
� �� �
� � � � �
G
ï�� ï� ï� ï� ï� ï� ï� ï� ï� ï� 0 1 2 3 4 5 � � � � 10
�
� � � �
�
��
�
�
�
�
�
�� �
� � ��
T
ï�� ï� ï� ï� ï� ï� ï� ï� ï� ï� 0 1 2 3 4 5 � � � � 10
��
�� � �
� ��
�
��
� ��
��
�
� �
T
0.0
0.1
0.2
0.3
0.4
0.5
ï�� ï� ï� ï� ï� ï� ï� ï� ï� ï� 0 1 2 3 4 5 � � � � 10
� �� �
�� �
�
�
�
��
�
�
�
� �
� � �
1 2 3 4 5 � � � � 10 11 12 13 14 15 �� �� �� �� 20 21 22 23 24 25
0.000.020.04��������0.100.120.14��������0.200.220.24��������0.30
Frequency
�
�
�
�
�
�
�
�
�
�
�
�
�
�
�
ï�� ï� ï� ï� ï� ï� ï� ï� ï� ï�
0.000.020.04��������0.100.120.14��������0.200.220.24��������0.30

176
Table S1: Taxa used in total evidence phylogenetic analyses. Taxa for which morphology was
scored by Worthy et al. (31) are marked with an “x”; only these taxa were included in
analyses of the morphological data alone. NCBI/GenBank accession numbers are given for
previously published mitogenome sequences; only these taxa (and those for which new
sequence was generated in this study) were included in analyses of the molecular data alone
(including BEAST molecular dating analyses).
Taxon Common name Family Morphology Accession Kuiornis indicator -‐ Acanthisittidae x Morphology only Dendroscansor decurvirostris Long-‐billed wren Acanthisittidae x Morphology only
Acanthisitta chloris Rifleman Acanthisittidae x AY325307 Xenicus longipes Bush wren Acanthisittidae x This study Xenicus gilviventris Rock wren Acanthisittidae x This study Pachyplichas yaldwyni Stout-‐legged wren Acanthisittidae x This study
Traversia lyalli Lyall's wren Acanthisittidae x This study
Tyrannidae N/A Tyrannidae x (Tyrannus tyrannus)
AY596278 (Cnemotriccus fuscatus)
Procnias nudicollis Bare-‐throated bellbird Cotingidae x Morphology only
Pseudocolaptes boissonneautii
Streaked tuftedcheek Furnariidae x Morphology only
Old World suboscines N/A N/A x (Pitta
versicolor)
NC_000879 (Smithornis sharpei)
Atrichornis clamosus Noisy scrubbird Atrichornithidae x Morphology only Menura novaehollandiae Superb lyrebird Menuridae x AY542313
Menura alberti Albert's lyrebird Menuridae x Morphology only Ptilonorhynchidae° N/A Ptilonorhynchidae x Morphology only Climacteridae° N/A Climacteridae x Morphology only
Maluridae° N/A Maluridae x KJ909199 (Malurus melanocephalus)
Pardalotus striatus Striated pardalote Pardalotidae x Morphology only Dasyornis broadbenti Rufous bristlebird Dasyornithidae x Morphology only Acanthizidae° N/A Acanthizidae x Morphology only
Meliphagidae° N/A Meliphagidae x JX901072 (Epthianura albifrons)
Sitta carolinensis White-‐breasted nuthatch Sittidae KJ909195
Campylorhynchus zonatus Band-‐backed wren Troglodytidae KF509924
Oriolus chinensis Black-‐naped oriole Oriolidae JQ083495 Vireo olivaceus Red-‐eyd vireo Vireonidae KJ909193

177
Rhynchopsitta terrisi Maroon-‐fronted parrot Psittacidae KF010318
Strigops habroptilus Kakapo Nestoridae AY309456 Falco peregrinus Peregrine falcon Falconidae AF090338 Micrastur gilvicollis Lined forest falcon Falconidae DQ780881
Dryocopus pileatus Pileated woodpecker Picidae x DQ780879
Eurystomus orientalis Dollarbird Coraciidae x EU344978
Merops ornatus Rainbow bee-‐eater Meropidae x Morphology only ° Scored as a composite taxon in Worthy et al. (31)
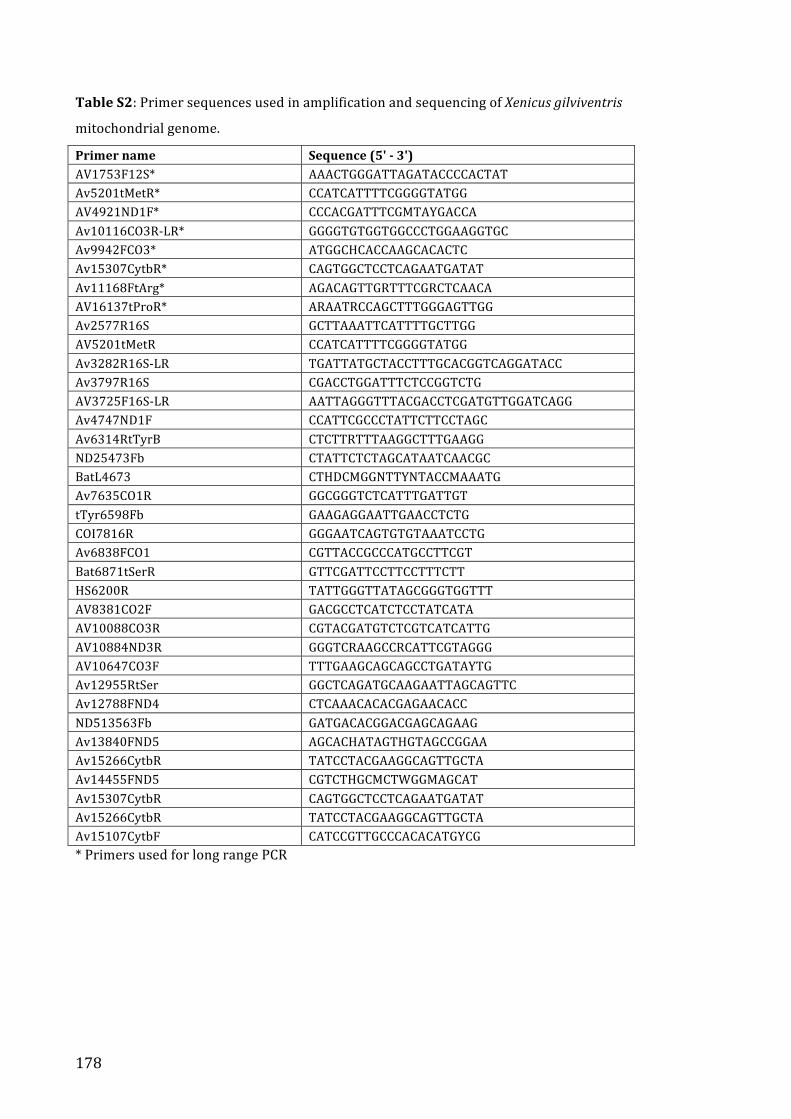
178
Table S2: Primer sequences used in amplification and sequencing of Xenicus gilviventris
mitochondrial genome.
Primer name Sequence (5' -‐ 3') AV1753F12S* AAACTGGGATTAGATACCCCACTAT Av5201tMetR* CCATCATTTTCGGGGTATGG AV4921ND1F* CCCACGATTTCGMTAYGACCA Av10116CO3R-‐LR* GGGGTGTGGTGGCCCTGGAAGGTGC Av9942FCO3* ATGGCHCACCAAGCACACTC Av15307CytbR* CAGTGGCTCCTCAGAATGATAT Av11168FtArg* AGACAGTTGRTTTCGRCTCAACA AV16137tProR* ARAATRCCAGCTTTGGGAGTTGG Av2577R16S GCTTAAATTCATTTTGCTTGG AV5201tMetR CCATCATTTTCGGGGTATGG Av3282R16S-‐LR TGATTATGCTACCTTTGCACGGTCAGGATACC Av3797R16S CGACCTGGATTTCTCCGGTCTG AV3725F16S-‐LR AATTAGGGTTTACGACCTCGATGTTGGATCAGG Av4747ND1F CCATTCGCCCTATTCTTCCTAGC Av6314RtTyrB CTCTTRTTTAAGGCTTTGAAGG ND25473Fb CTATTCTCTAGCATAATCAACGC BatL4673 CTHDCMGGNTTYNTACCMAAATG Av7635CO1R GGCGGGTCTCATTTGATTGT tTyr6598Fb GAAGAGGAATTGAACCTCTG COI7816R GGGAATCAGTGTGTAAATCCTG Av6838FCO1 CGTTACCGCCCATGCCTTCGT Bat6871tSerR GTTCGATTCCTTCCTTTCTT HS6200R TATTGGGTTATAGCGGGTGGTTT AV8381CO2F GACGCCTCATCTCCTATCATA AV10088CO3R CGTACGATGTCTCGTCATCATTG AV10884ND3R GGGTCRAAGCCRCATTCGTAGGG AV10647CO3F TTTGAAGCAGCAGCCTGATAYTG Av12955RtSer GGCTCAGATGCAAGAATTAGCAGTTC Av12788FND4 CTCAAACACACGAGAACACC ND513563Fb GATGACACGGACGAGCAGAAG Av13840FND5 AGCACHATAGTHGTAGCCGGAA Av15266CytbR TATCCTACGAAGGCAGTTGCTA Av14455FND5 CGTCTHGCMCTWGGMAGCAT Av15307CytbR CAGTGGCTCCTCAGAATGATAT Av15266CytbR TATCCTACGAAGGCAGTTGCTA Av15107CytbF CATCCGTTGCCCACACATGYCG * Primers used for long range PCR

179
Table S3: Structure of DNA sequencing libraries. Components and nucleotide sequences
listed in order 5’ to 3’.
Component Sequence (5’ -‐ 3’) 5’ IonTorrent Primer Bind Site CCATCTCATCCCTGCGTGTCTCCGACTCAG
5’ Index II TACTATG/ACAGCTG/AGCACTG (T. lyalli) ACTGTCG/TGACGTG (P. yaldwyni) TGACGTG (X. longipes)
5’ Adapter ACACTCTTTCCCTACACGACGCTCTTCCGATCT 5’ Index I ACTAA (T. lyalli) -‐ ACCGG (P. yaldwyni) -‐ ACACT (X. longipes) DNA fragment Variable 3’ Adapter AGATCGGAAGAGCACACGTCTGAACTCCAGTCAC 3’ IonTorrent Adapter ATCACCGACTG CCCATAGAGAGG
Table S4: Primer sequences used in library amplification and sequencing preparation for
ancient samples.
Primer Sequence (5’ – 3’) Library amp. Fwd ACACTCTTTCCCTACACGAC
Library amp. Rev GTGACTGGAGTTCAGACGTGT
IonTorrent fusion Fwd
CCATCTCATCCCTGCGTGTCTCCGACTCAG(TACTATG/ACAGCTG/AGCACTG)ACACTCTTTCCCTACACGACGCTCTTCCGATCT (Traversia lyalli) CCATCTCATCCCTGCGTGTCTCCGACTCAG(ACTGTCG/TGACGTG)ACACTCTTTCCCTACACGACGCTCTTCCGATCT (Pachyplichas yaldwyni) CCATCTCATCCCTGCGTGTCTCCGACTCAG(TGACGTG)ACACTCTTTCCCTACACGACGCTCTTCCGATCT (Xenicus longipes)
IonTorrent fusion Rev
CCTCTCTATGGGCAGTCGGTGATGTGACTGGAGTTCAGACGTGTGCTCTTCCGATCT

180
Table S5: Taxonomy and NCBI/GenBank accession numbers for data used to design in-‐
solution RNA probe array.
Species Common name Family Accession Acanthisitta chloris Rifleman Acanthisittidae AY325307 Aegotheles cristatus Owlet nightjar Aegothelidae EU344979 Anas formosa Baikal teal Anatidae JF730435 Anas platyrhynchos Mallard Anatidae NC_009684 Anomalopteryx didiformis Little bush moa Emeidae NC_002779 Anser anser Domestic goose Anatidae NC_011196 Apteryx haastii Great spotted kiwi Apterygidae NC_002782 Apteryx owenii Little spotted kiwi Apterygidae NC_013806 Branta canadensis Canada goose Anatidae NC_007011 Cacatua moluccensis Salmon-‐crested cockatoo Cacatuidae NC_020592 Corvus frugilegus Rook Corvidae NC_002069 Dendrocygna javanica Lesser whistling duck Anatidae NC_012844 Dinornis robustus Giant moa Dinornithidae NC_002672 Emeus crassus Eastern moa Emeidae NC_002673 Eudyptes chrysocome Rockhopper penguin Spheniscidae NC_008138 Eudyptula minor Little blue penguin Spheniscidae NC_004538 Gallinula chloropus Common moorhen Rallidae NC_015236 Gallirallus okinawae Okinawa rail Rallidae NC_012140 Pica pica Common magpie Corvidae NC_015200 Porphyrio hochstetteri South Island takahe Rallidae NC_010092 Procellaria cinerea Grey petrel Procellariidae AP009191 Pterodroma brevirostris Kerguelen petrel Procellariidae NC_007174 Rallina eurizonoides Slake Rallidae NC_012142 Rhea americana Greater rhea Rheidae NC_000846 Strigops habroptilus Kakapo Strigopidae NC_005931 Struthio camelus Ostrich Struthionidae NC_002785 Tinamus major Great tinamou Tinamidae NC_002781

181
Table S6: Enrichment proportions obtained using different hybridisation protocols.
Enrichment calculated as percentage of reads mapping (prior to de-‐duplication) to the
relevant final consensus (target) sequence after a single round of BWA mapping using the
parameters listed in the methods. See main text for description of protocols. Cells are shaded
for specimens not subjected to that protocol.
Protocol Traversia lyalli Pachyplichas yaldwyni
Xenicus longipes
Standard Total reads 165,021 93,129 302,330 % target 5.032 0.009* 0.036*
Alternative 1 Total reads 179,440 % target 4.272
Alternative 2 Total reads 209,695 % target 3.368
Alternative 3 Total reads 343,566 % target 0.892
Alternative 4 Total reads 1,339,280 1,006,439 563,329 % target 6.354 1.876 5.511
Alternative 5 (Shotgun)
Total reads 563,329 % target 0.034
* Substantial evaporation from these tubes during incubation may have compromised
enrichment
Table S7: Consensus sequence statistics for ancient samples following final iteration of
mapping.
Traversia lyalli Pachyplichas yaldwyni
Xenicus longipes
Total number of filtered reads 2,456,765 1,443,134 1,674,990
Total number of mapped de-‐duplicated reads 8,222 5,809 1,662
Consensus length 15,6557 16,060 16,017
Consensus coverage 99.7 98.8 91.2
Mean read length (standard deviation) bp 76.0 (27.5) 81.4 (23.5) 77.3 (28.3)
Mean depth of coverage (standard deviation) X 40.1 (18.0) 31.0 (22.9) 8.4 (8.8)

182
Table S8: Partitioning schemes and substitution models for analyses of the nucleotide
sequence data (see Table S7), determined using PartitionFinder v1.1.1 (63).
Program Partition number
Composition Substitution model
RAxML 1 ATP6_1, CO2_1, CO3_1, CYTB_1, ND1_1, ND3_1 GTR+G RAxML 2 ATP8_1, ND2_1, ND4L_1, ND4_1, ND5_1, ND6_1 GTR+G RAxML 3 12S_stems, 16S_stems, CO1_1, tRNA_stems GTR+G RAxML 4 CO1_2, CO2_2, CO3_2, CYTB_2, ND1_2 GTR+G RAxML 5 ATP6_2, ATP8_2, ND2_2, ND3_2, ND4L_2, ND4_2, ND5_2 GTR+G RAxML 6 ATP6_3, ATP8_3, CO1_3, CO2_3, CO3_3, CYTB_3, ND1_3,
ND2_3, ND3_3, ND4L_3, ND4_3, ND5_3, ND6_3 GTR+G
RAxML 7 12S_loops, 16S_loops, ND6_2 GTR+G RAxML 8 tRNA_loops GTR+G MrBayes 1 CO2_1, CO3_1, CYTB_1, ND1_1 GTR+I+G MrBayes 2 ATP6_1, ATP8_1, ND2_1, ND3_1, ND4L_1, ND4_1,
ND5_1, ND6_1 GTR+I+G
MrBayes 3 12S_stems, 16S_stems, CO1_1 GTR+I+G MrBayes 4 CO1_2, CO2_2, CO3_2, CYTB_2, ND1_2 GTR+I+G MrBayes 5 ATP6_2, ATP8_2, ND2_2, ND3_2, ND4L_2, ND4_2, ND5_2 GTR+I+G MrBayes 6 ATP6_3, ATP8_3, CO1_3, CO2_3, CO3_3, CYTB_3, ND1_3,
ND2_3, ND3_3, ND4L_3, ND4_3, ND5_3, ND6_3 F81
MrBayes 7 12S_loops, 16S_loops, ND6_2 GTR+I+G MrBayes 8 tRNA_loops HKY+G MrBayes 9 tRNA_stems K80+I+G BEAST 1 CO2_1, CO3_1, CYTB_1, ND1_1 TVM+I+G BEAST 2 ATP6_1, ATP8_1, ND2_1, ND3_1, ND4L_1, ND4_1, ND5_1 GTR+I+G BEAST 3 CO1_1 K81+I+G BEAST 4 CO1_2, CO2_2, CO3_2, CYTB_2, ND1_2 TVM+I+G BEAST 5 ATP6_2, ATP8_2, ND2_2, ND3_2, ND4L_2, ND4_2, ND5_2 GTR+I+G BEAST 6 ATP6_3, ATP8_3, CO1_3, CO2_3, CO3_3, CYTB_3, ND1_3,
ND2_3, ND3_3, ND4L_3, ND4_3, ND5_3, ND6_3 F81
BEAST 7 ND6_1, ND6_2 K81uf+G BEAST 8 12S_loops, 16S_loops TrN+I+G BEAST 9 tRNA_loops HKY+G BEAST 10 12S_stems, 16S_stems, tRNA_stems TVM+G

183
CHAPTER 5:
Ancient mitochondrial genome reveals unsuspected taxonomic affinity of the extinct Chatham
duck (Pachyanas chathamica) and resolves divergence times for New Zealand and sub-‐Antarctic
brown teals CHAPTER 5: Ancient mitochondrial genome reveals unsuspected taxonomic affinity of the extinct Chatham duck (Pachyanas chathamica) and resolves divergence times for New Zealand and sub-‐Antarctic brown teals
Mitchell, K.J., Wood, J.R., Scofield, R.P., Llamas, B., Cooper, A., 2014. Ancient mitochondrial genome reveals unsuspected taxonomic affinity of the extinct Chatham duck (Pachyanas chathamica) and resolves divergence times for New Zealand and sub-‐Antarctic brown teals. Molecular Phylogenetics and Evolution 70, 420-‐428.
doi:10.1016/j.ympev.2013.08.017


Mitchell, K.J., Wood, J.R., Scofield, R.P., Llamas, B. & Cooper, A. (2014) Ancient mitochondrial genome reveals unsuspected taxonomic affinity of the extinct Chatham duck (Pachyanas chathamica) and resolves divergence times for New Zealand and sub-Antarctic brown teals. Molecular Phylogenetics and Evolution, v. 70, pp. 420-428
NOTE:
This publication is included on pages 187 - 206 in the print copy of the thesis held in the University of Adelaide Library.
It is also available online to authorised users at:
http://dx.doi.org/10.1016/j.ympev.2013.08.017
207
CHAPTER 6:
An extinct nestorid parrot (Aves, Psittaciformes, Nestoridae) from
the Chatham Islands, New Zealand
CHAPTER 6: An extinct nestorid parrot (Aves, Psittaciformes, Nestoridae) from the Chatham Islands, New Zealand
Wood, J.R., Mitchell, K.J., Scofield, R.P., Tennyson, A.J.D., Fidler, A.E., Wilmshurst, J.M.,
Llamas, B., Cooper, A., 2014. An extinct nestorid parrot (Aves, Psittaciformes, Nestoridae) from the Chatham Islands, New Zealand. Zoological Journal of the Linnean
Society 172, 185-‐199.
doi: 10.1111/zoj.12164
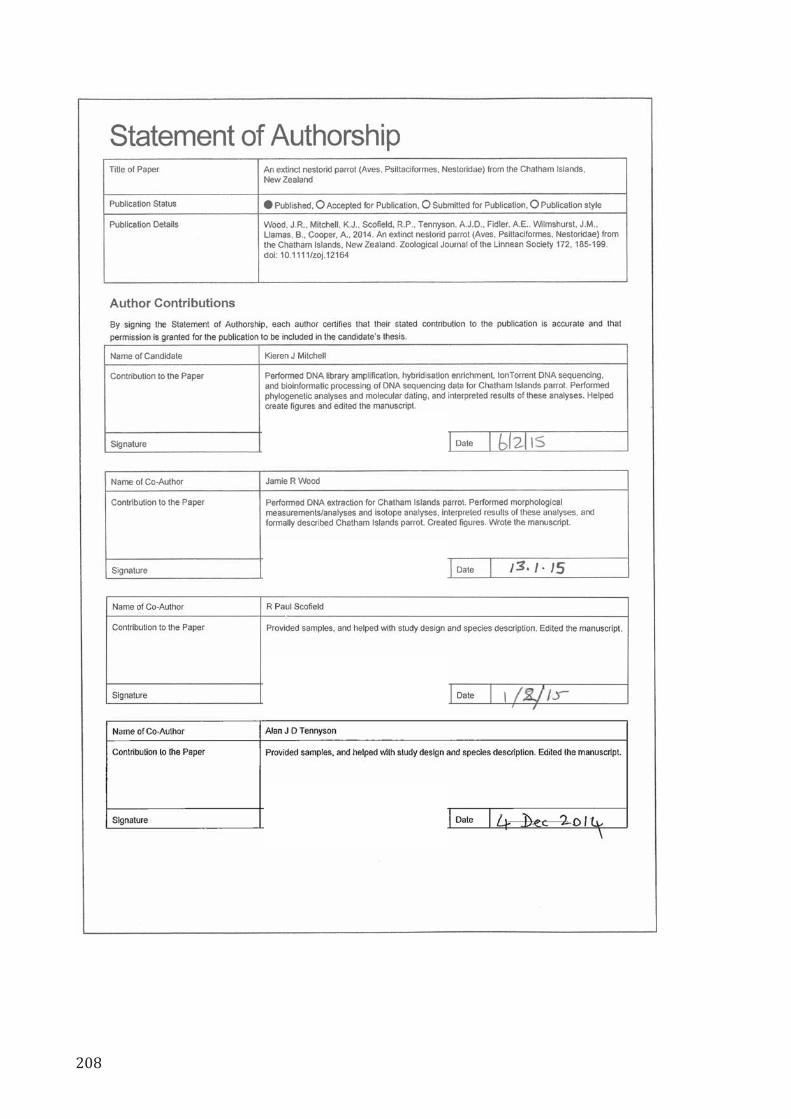


Wood, J.R., Mitchell, K.J., Scofield, R.P., Tennyson, A.J.D., Fidler, A.E., Wilmshurst, J.M., Llamas, B. & Cooper, A. (2014) An extinct nestorid parrot (Aves, Psittaciformes, Nestoridae) from the Chatham Islands, New Zealand. Zoological Journal of the Linnean Society, v. 172 (1), pp. 185–199
NOTE:
This publication is included on pages 211 - 228 in the print copy of the thesis held in the University of Adelaide Library.
It is also available online to authorised users at:
http://dx.doi.org/10.1111/zoj.12164

229
CHAPTER 7:
Ancient DNA analyses of
mammalian megafauna from La Chumbiada (Argentina; South
America) CHAPTER 7: Ancient DNA analyses of mammalian megafauna from La Chumbiada (Argentina; South America)
Mitchell, K.J., Scanferla, A., Soibelzon, E., Cooper, A., 2014. Ancient DNA analyses of
mammalian megafauna from La Chumbiada (Argentina; South America).
In preparation for submission to Molecular Phylogenetics and Evolution.


231
CHAPTER 7:
Ancient DNA analyses of mammalian megafauna from La Chumbiada
(Argentina; South America)
Kieren J Mitchell1, Agustin Scanferla2, Esteban Soibelzon3, Alan Cooper1
1 Australian Centre for Ancient DNA, School of Biological Sciences, University of Adelaide, Australia 2 Instituto de Bio y Geociencias del NOA, Museo de Ciencias Naturales, Universidad Nacional de Salta,
Argentina 3 División Paleontología de Vertebrados, Museo de La Plata, Argentina
Abstract
Most of South America’s megafauna became extinct during the late Pleistocene and
early Holocene. While studies of ancient DNA from these taxa have made some
progress towards reconstructing the composition and evolution of this past
community, they have largely been hampered by poor DNA preservation and the
limitations of traditional sequencing methods. Although new technologies have
recently been developed that allow DNA sequences to be more readily obtained from
highly degraded remains, the potential of these techniques for studying the extinct
megafauna of South America has not been fully explored. In the present study we
used hybridisation enrichment and high-‐throughput sequencing to obtain near-‐
complete mitochondrial genomes from two extinct South American megafaunal
genera: Hippidion (endemic horses) and Glyptodon (a giant relative of extant
armadillos). This allowed us to confidently resolve the relationships of these taxa to
the extant fauna, and clarify their temporal and geographic origin. We suggest that

232
future application of the methods presented herein will allow the diversity of extinct
taxa from South America to be more comprehensively surveyed, and ultimately
should provide a greater understanding of the evolution of South America’s unique
biota.
Introduction
A large proportion of the world’s megafauna became extinct during the last 50 kyr
(Barnosky, et al. 2004; Prescott, et al. 2012; Stegner and Holmes 2013). In South
America, this period saw the disappearance of a diverse faunal community that
included giant ground sloths, large armadillo-‐relatives (Glyptodontidae), flightless
carnivorous “terror birds” (Phorusrhacidae) and sabre-‐toothed cats (Fariña et al.,
2013). This extinct community is particularly interesting due to the influences of
biogeography on its composition (Simpson, 1980; Stehli and Webb, 1985). South
America was geographically isolated for tens of millions of years during the interval
between its separation from the other fragments of the supercontinent Gondwana
and its subsequent connection to North America via the Isthmus of Panama.
Consequently, for much of its history South America lacked characteristic elements of
its modern fauna, including perissodactyls (e.g. tapirs), artiodactyls (e.g. pigs, deer),
or carnivorans (e.g. bears, cats, foxes), which were widespread throughout North
America and Eurasia. Instead, South American “old endemic” groups exploited the
niches conventionally filled by these groups: xenarthrans (e.g. ground sloths,
glyptodontids) and meridiungulates (a placental mammal group of uncertain affinity)
were the primary grazers/browsers, while metatherians (e.g. sparassodonts) and
233
phorusrhacid birds were prominent terrestrial carnivores. Several of these old
endemic groups converged on remarkably similar forms to their ecological
counterparts elsewhere (e.g. Sparassodonta and Carnivora,
Artiodactyla/Perissodactyla and Meridiungulata) (Rose, 2006). However, around
three million years ago, formation of the Isthmus of Panama initiated a period of
major faunal dispersal between North and South America (the Great American Biotic
Interchange; GABI). The GABI led to an extensive restructuring of animal
communities, and nearly half of the modern South American fauna descends from
North American immigrants (Fariña et al., 2013). However, many elements of the old
endemic South American fauna survived until the Late Pleistocene (e.g. glyptodontids,
meridiungulates). By studying these late-‐surviving old endemic taxa, we can better
understand the evolution of the South American fauna during its long period of
isolation. Conversely, by studying the evolution of GABI immigrants (e.g. horses), we
can gain a greater appreciation of the timing and impact of the GABI on the faunal
community of South America.
Since much of the South American megafauna became extinct only in the latest
Pleistocene, or even early Holocene, it should be possible to extract ancient DNA from
the remains of many species. Traditional DNA sequencing methods have been
somewhat successful in this regard, although in most cases only very short regions of
the mitochondrial genome (mitogenome) have been recovered (e.g. Clack et al., 2012;
Greenwood et al., 2001; Hoss et al., 1996; Orlando et al., 2008; Orlando et al., 2009;
Weinstock et al., 2009; Weinstock et al., 2005), which limits the power of these
datasets for hypothesis testing. The recent advent of high-‐throughput sequencing has
revolutionised the collection of DNA sequence data, allowing largely complete
234
mitogenome sequences to be obtained from a diverse range of extinct species (e.g.
Mitchell et al., 2014a; Mitchell et al., 2014b; Paijmans et al., 2013). However, these
new methods have not been extensively applied to extinct taxa from South America.
Consequently, it is now an appropriate time to revisit outstanding questions
regarding the origin and evolution of the South American megafauna. In the present
study, we focus on two extinct taxa: Hippidion (endemic South American horses) and
Glyptodon (a representative of the giant armoured glyptodontids).
Two genera of horse (Equidae) existed in South America during the
Pleistocene: Equus (the genus comprising all extant equids inc. asses, horses and
zebras) and Hippdion (three recognised species, all endemic to South America;
Alberdi and Prado, 1993). The extinct South American representatives of Equus
appear to have been a subpopulation of Equus ferus (the ancestor of domestic horses)
(Orlando et al., 2008; Orlando et al., 2009; Weinstock et al., 2005), one of two species
of horse distributed throughout North America during the Pleistocene along with the
New World stilt-‐legged horses (a morphologically plastic and taxonomically
contentious group). Equus ferus (sensu Orlando et al., 2009) seems to have entered
South America from North America only in the last million years (MacFadden, 2013).
In contrast, Hippidion first appears in the South American fossil record during the late
Pliocene (Alberdi and Prado, 1993), soon after the beginning of the GABI. However,
while Equus is recorded from the Pliocene fossil record of North America (Winans,
1989), no “hippidiforms” are recognised outside of South America (Prado and
Alberdi, 1996; Prothero and Schoch, 1989), leaving the evolutionary origins of
Hippidion uncertain. Two main hypotheses have been proposed to explain the origins

235
of Hippidion (Figure 1): one based on palaeontological data and morphological
evolution, and the other based on ancient DNA.
Figure 1: Conflicting hypotheses regarding the origin of South American horses (adapted
from Weinstock et al., 2005). A) Prado and Alberdi (1996) suggest that the ancestors of
Hippidion diverged from the lineage leading to modern Equus during the Miocene, with
Hippidion and Equus potentially descending from the fossil genus Pliohippus. B) Previous
ancient DNA studies have suggested that Hippidion actually falls within the diversity of Equus,
and shared a common ancestor with New World stilt-‐legged (NWSL) horses around the
beginning of the GABI (Orlando et al., 2008; Orlando et al., 2009; Weinstock et al., 2005).
Timescale is in millions of years before the present.
The most prominent palaeontological hypothesis (Figure 1A) is that the
ancestors of both Hippidion and Equus arose independently in North America from
the fossil genus Pliohippus during the Late Miocene as part of a radiation of early
horses (inc. Protohippus, Calippus, Nannipus, Astrohippus, Pseudhippation, Hipparion)
(Prado and Alberdi, 1996). This viewpoint implies that a hippidiform “ghost lineage”
South America
South America
South America
North America
North America
South America
Pliohippus
Equus
Hippidion
Equus ferus
Equus ferus
Equus NWSL
DinohippusPliohippus
Equus ferus
Equus ferus
Equus NWSLDinohippus
Hippidion
B
A
PleistocenePlioceneMiocene 2.5 0.015.3
Land connection between North and South America (beginning ~3 mya)
Time (mya)
Equus
“hippidiform” ancestor
236
must have persisted in North America for several million years without being
detected in the fossil record, before becoming extinct following the dispersal of
Hippidion (sensu stricto) to South America. In contrast, a second hypothesis (Figure
1B) based on previously published Hippidion ancient DNA sequences (Orlando et al.,
2008; Orlando et al., 2009; Weinstock et al., 2005), suggests that Hippidion falls
within the diversity of Equus and diverged from the ancestor of the New World stilt-‐
legged horses coincident with the beginning of the GABI. While this explains the
absence of hippidiform fossil taxa from North America, it contradicts strong
morphological evidence for the phylogenetic distinctness of Hippidion and the
monophyly of Equus. Additional genetic data is required to conclusively resolve this
disagreement.
Questions of phylogenetic affinity also surround the extinct glyptodontids.
However, unlike Hippidion, glyptodontids are old endemic members of the South
American fauna (Fariña et al., 2013). Glyptodontids were perhaps one of the more
bizarre looking mammal groups to have ever evolved, with short deep skulls, fused
vertebral columns, immobile bone exoskeletons, and (frequently) spiked club-‐like
tails (Gillette and Ray, 1981). They were also one of the most abundant and diverse
elements of the South American mammal fauna through much of the late Cenozoic
(Rose, 2006). Previous palaeontological studies suggested that glyptodontids (along
with their smaller more armadillo-‐like relatives, the pampatheriids) form a clade
(Glyptodonta) that is reciprocally monophyletic with respect to a clade comprising
the extant armadillos (Dasypodidae) (e.g. Figure 2A; Engelmann, 1985). However,
more recent studies of morphological data have tentatively suggested a close
relationship between Glyptodonta and the armadillo subfamily Euphractinae (Figure

237
2B) – comprising the six-‐banded armadillo, pichi and hairy armadillos – to the
exclusion of the remaining three extant armadillo subfamilies (Billet et al., 2011;
Gaudin and Wible, 2006). Thus far, no ancient DNA has been sequenced for either
Glyptodontidae or Pampatheriidae, so this hypothesis has not been definitively tested
(Figure 2C). Confirming the phylogenetic position of Glyptodonta relative to extant
armadillos could prove valuable for calibrating the evolutionary timescale of
Cingulata (the clade comprising Dasypodidae, Glyptodontidae and Pampatheriidae),
since unequivocal glyptodontid remains are known from the Eocene (Simpson, 1948).
Figure 2: Suggested relationships between the four subfamilies (sensu Delsuc et al., 2012) of
extant armadillo (Dasypodidae: shaded grey) and Glyptodontidae. A) Glyptodontids were
originally thought to be phylogenetically distinct from dasypodid armadillos. B) More recent
morphological studies (e.g. Billet et al., 2011) have suggested that glyptodontids are actually
phylogenetically nested within extant armadillos, possibly close to the euphractines. C) DNA-‐
based phylogenetic analyses have clarified the relationships between extant armadillos
(Delsuc et al., 2012), but have thus far been unable to test the position of Glyptodontidae due
to a lack of available sequence data.
In the present study we have extracted ancient DNA from the remains of
Glyptodon and Hippidion individuals collected from the La Chumbiada Member of the
Luján Formation: Late Pleistocene (~30 thousand year old) sediments from the Rio
Glyptodontidae
Euphractinae
Tolypeutinae
Chlamyphorinae
Dasypodinae
Glyptodontidae
Euphractinae
Tolypeutinae
Chlamyphorinae
Dasypodinae
Morphology
?
DNA
BA C

238
Luján valley near Mercedes in Buenos Aires Province, Argentina (Cione et al., 2006;
Cione and Tonni, 1995; Dillon and Rabassa, 1985). By using hybridisation enrichment
and high-‐throughput sequencing we were able to generate near-‐complete
mitochondrial genome sequences from both taxa, despite the relatively poor DNA
preservation of the remains. These new high-‐quality sequence data allowed us to
confidently resolve several uncertainties regarding the origin and evolution of South
American horses and cingulates.
Methods
Sample preparation and extraction
All DNA extraction and library preparation steps were performed in a purpose-‐built,
physically isolated, ancient DNA laboratory at the Australian Centre for Ancient DNA,
University of Adelaide. Two samples were taken from the disarticulated jaw of a
juvenile Hippidion individual and processed in parallel: the root of a molar
(ACAD15255) and a portion of the left ascending ramus (ACAD15257). A single
sample was taken from the osteoderm (scute) of a Glyptodon individual
(ACAD15262). The material available was insufficient to identify either taxon to the
species level using morphology alone.
Potential for contamination of the bone samples was reduced by removing
surfaces (c. 1 mm) using a dremel tool, followed by UV irradiation for 15 min. Each
sample (0.2 g) was powdered using a mikrodismembrator (Sartorius). The powdered
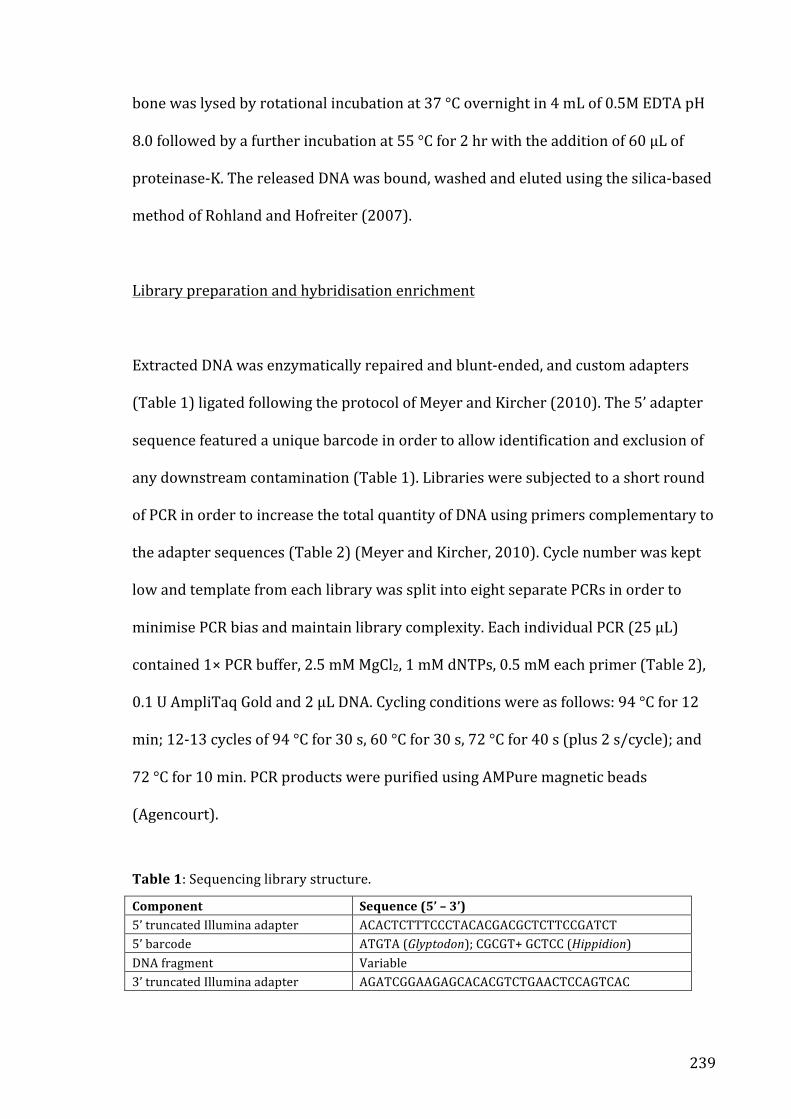
239
bone was lysed by rotational incubation at 37 °C overnight in 4 mL of 0.5M EDTA pH
8.0 followed by a further incubation at 55 °C for 2 hr with the addition of 60 μL of
proteinase-‐K. The released DNA was bound, washed and eluted using the silica-‐based
method of Rohland and Hofreiter (2007).
Library preparation and hybridisation enrichment
Extracted DNA was enzymatically repaired and blunt-‐ended, and custom adapters
(Table 1) ligated following the protocol of Meyer and Kircher (2010). The 5’ adapter
sequence featured a unique barcode in order to allow identification and exclusion of
any downstream contamination (Table 1). Libraries were subjected to a short round
of PCR in order to increase the total quantity of DNA using primers complementary to
the adapter sequences (Table 2) (Meyer and Kircher, 2010). Cycle number was kept
low and template from each library was split into eight separate PCRs in order to
minimise PCR bias and maintain library complexity. Each individual PCR (25 μL)
contained 1× PCR buffer, 2.5 mM MgCl2, 1 mM dNTPs, 0.5 mM each primer (Table 2),
0.1 U AmpliTaq Gold and 2 μL DNA. Cycling conditions were as follows: 94 °C for 12
min; 12-‐13 cycles of 94 °C for 30 s, 60 °C for 30 s, 72 °C for 40 s (plus 2 s/cycle); and
72 °C for 10 min. PCR products were purified using AMPure magnetic beads
(Agencourt).
Table 1: Sequencing library structure.
Component Sequence (5’ – 3’) 5’ truncated Illumina adapter ACACTCTTTCCCTACACGACGCTCTTCCGATCT 5’ barcode ATGTA (Glyptodon); CGCGT+ GCTCC (Hippidion) DNA fragment Variable 3’ truncated Illumina adapter AGATCGGAAGAGCACACGTCTGAACTCCAGTCAC

240
Table 2: Primers used for library amplification.
Primer Sequence (5’ – 3’) Library amplification forward ACACTCTTTCCCTACACGAC
Library amplification reverse GTGACTGGAGTTCAGACGTGT
Illumina adapter fusion forward AATGATACGGCGACCACCGAGATCTACACTCTTTCCCTACACGACGCTCTT
Illumina adapter fusion reverse CAAGCAGAAGACGGCATACGAGATACCTAGGGTGACTGGAGTTCAGACGTGT
Commercially synthesised biotinylated 80-‐mer RNA baits (MYcroarray, MI,
USA) were used to enrich the target library for mitochondrial DNA. Baits were
designed using published mitochondrial sequences from a range of placental
mammals (Table 3). DNA-‐RNA hybridisation enrichment was performed according to
manufacturer’s recommendations (v1) in a final concentration of 5.2 × SSPE, 5.2 ×
Denhardt’s, 5 mM EDTA and 0.1% SDS. This solution was incubated for 44 hr (3 hr at
60°C, 12 hr at 55 °C, 12 hr at 50 °C, 17 hr at 55 °C) with a total of 200 ng of library
DNA, after which the RNA baits were immobilised on magnetic MyOne Streptavidin
beads (Life Technologies). The baits were washed once with a solution of 1× SSC and
0.1% SDS (15 min at room temperature) and twice with 0.1× SSC and 0.1% SDS (10
min at 50 °C). Subsequent resuspension in 0.1 M NaOH pH 13.0 destroyed the RNA
baits, releasing captured DNA into solution. Captured DNA was purified using a
Qiagen Minelute spin-‐column. The quantity of DNA remaining after enrichment was
extremely small, so an additional round of PCR was performed (12 cycles; conditions
as above). Subsequently, a final round of PCR (7 cycles; conditions as above) was
performed with fusion primers (Table 2) to add full-‐length Illumina sequencing
adapters to the enriched library.

241
Table 3: Mitochondrial sequence used to design RNA baits for hybridisation enrichment.
Species name Common name Accession Arctodus simus Giant short-‐faced bear NC_011116 Bison bison American bison NC_012346 Bos taurus Cattle GU947008 Bradypus tridactylus Three-‐toed sloth AY960979 Bubalus bubalis Water buffalo NC_006295 Capra pyrenaica Spanish ibex FJ207528 Capricornis crispus Japanese serow AP003429 Dasypus novemcinctus Nine-‐banded armadillo NC_001821 Echinops telfairi Lesser hedgehog tenrec AB099484 Gazella dorcas Dorcas gazelle JN632637 Hippotragus niger Sable antelope JN632648 Kobus leche Lechwe JN632652 Lemur catta Ring-‐tailed lemur AJ421451 Macaca mulatta Rhesus macaque NC_005943 Mammuthus primigenius Woolly mammoth EU153453 Myotragus balearicus Balearic Islands cave goat AY380560 Oryctolagus cuniculus European rabbit NC_001913 Ovis aries Sheep HM236182 Panthera leo Lion KC834784 Pipistrellus abramus Japanese pipistrelle AB061528 Rhinolophus ferrumequinum Greater horseshoe bat NC_020326 Rupicapra rupicapra Chamois FJ207539 Sciurus vulgaris Red squirrel AJ238588 Ursus arctos Brown bear HQ685964 Sequencing and data processing
Libraries were diluted to 2 nM and run on an Illumina MiSeq using 2 x 150 bp
(paired-‐end) sequencing chemistry. Following sequencing, reads were demultiplexed
according to the 5’ barcode using ‘sabre’ (https://github.com/najoshi/sabre) (default
parameters: no mismatches allowed). In addition, five base pairs were removed from
the 3’ end of the reverse reads using fastx_trimmer (FASTX-‐toolkit v0.0.13;
http://hannonlab.cshl.edu/fastx_toolkit) to ensure that forward and reverse reads
were of equal length for read merging. Adapter sequences were removed and paired-‐

242
end reads were merged using Adapter Removal v1.5.4 (Lindgreen, 2012). Low quality
bases were trimmed (<Phred20 –-‐minquality 4) and merged reads shorter than 25 bp
were discarded (-‐-‐minlength 25). Read quality was visualized using fastQC v0.10.1
(http://www.bioinformatics.bbsrc.ac.uk/projects/fastqc) before and after trimming
to make sure the trimming of adapters was efficient. Only read pairs that could be
successfully merged were retained for mapping and assembly. Reads from the two
Hippidion libraries were pooled for downstream analysis.
For both Hippidion and Glyptodon, reads were iteratively mapped against the
mitogenome sequence of a close relative (Equus ferus AY584828 and Dasypus
novemcinctus NC_001821, respectively) using TMAPv3.2.2
(https://github.com/nh13/TMAP) (default ‘mapall’ parameters). Reads with a
mapping quality Phred score >30 were selected using the SAMtools v1.4 (Li et al.,
2009) view command (-‐q 30), and duplicate reads were discarded using the
MarkDuplicates.jar tool from Picard tools v1.79 (http://picard.sourceforge.net). After
each iteration, a 50% consensus sequence was generated from all mapped reads and
used as the reference for the next iteration. This process was repeated until no
additional reads could be aligned (four iterations for Hippidion, seven iterations for
Glyptodon). Using the TMAP consensus as a reference a final round of higher
stringency mapping was performed using BWA v0.7.8 (Li and Durbin, 2009) (‘aln’ -‐l
1024, -‐n 0.01, -‐o 2). Reads with a mapping quality Phred score >30 were selected
using the SAMtools v1.4 (Li et al., 2009) view command (-‐q 30), and duplicate reads
were discarded using ‘FilterUniqueSAMCons.py’ (Kircher, 2012). A final 75%
consensus sequence was generated for both Hippidion and Glyptodon and checked by
eye in Geneious v6.1.2 (Biomatters; http://www.geneious.com). Sites that received

243
no coverage or insufficient coverage to unambiguously call a nucleotide were coded
as IUPAC ambiguities.
A total of 3,347,419 reads were assignable to our Hippidion sequencing
libraries. After iterative mapping, 2,037 unique reads were aligned. The final
Hippidion consensus sequence was 16,486 bp in length. Aligned reads spanned 90.5%
of the final Hippidion consensus; sites that received no coverage or insufficient
coverage to unambiguously call a nucleotide were coded as IUPAC ambiguities. Mean
length of individual reads was 60.2 bp (standard deviation = 13.2) while mean read
depth across the consensus was mean 7.4x (standard deviation = 6.4). For our
Glyptodon library, a total of 1,758,698 reads contributed 1,277 unique aligned reads,
resulting in a consensus sequence of length 16,124 bp. Aligned reads spanned 77% of
the final Glyptodon consensus; sites that received no coverage or insufficient coverage
to unambiguously call a nucleotide were coded as IUPAC ambiguities. Mean length of
individual reads was 64 bp (standard deviation = 15.8) while mean read depth across
the consensus was mean 5.1x (standard deviation = 5.2). We used MapDamage v0.3.3
(Ginolhac et al., 2011) to assess patterns of damage across all mapped reads for both
Hippidion and Glyptodon (Figures 3 and 4, respectively). In both cases, patterns
observed were consistent with degraded ancient DNA (elevated 5’ C-‐to-‐T and 3’ A-‐to-‐
G substitutions, and depurination at the position preceding the beginning of the
reads).
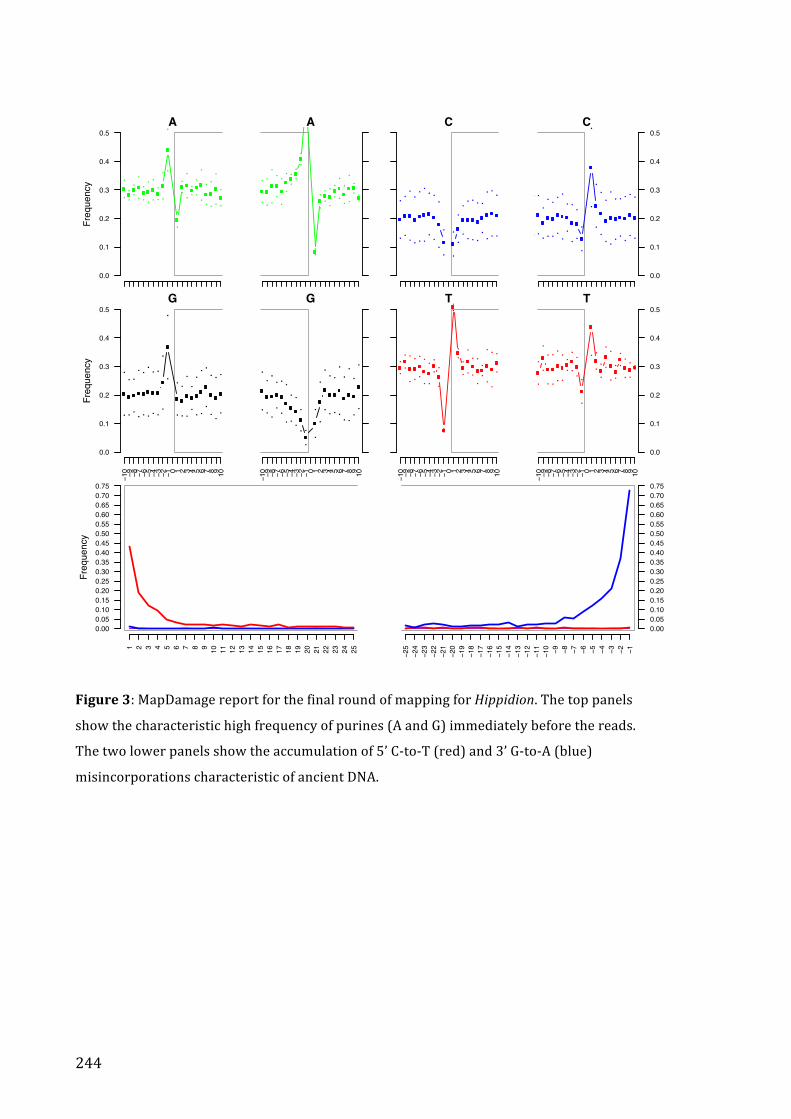
244
Figure 3: MapDamage report for the final round of mapping for Hippidion. The top panels
show the characteristic high frequency of purines (A and G) immediately before the reads.
The two lower panels show the accumulation of 5’ C-‐to-‐T (red) and 3’ G-‐to-‐A (blue)
misincorporations characteristic of ancient DNA.
A
0.0
0.1
0.2
0.3
0.4
0.5
Frequency
�
�� �
� � ��
�
�
�
� ��
� �
� ��
�
A
� �� �
�
��
�
�
�
�� �
��
�� �
�
C
�� �
�� � �
�
�
� �
�
� � � ��
� � �
C
0.0
0.1
0.2
0.3
0.4
0.5
�
�� �
� � �� �
�
�
�
�
�� � � �
��
G
0.0
0.1
0.2
0.3
0.4
0.5
ï�� ï� ï� ï� ï� ï� ï� ï� ï� ï� 0 1 2 3 4 5 � � � � 10
Frequency
�� � � � � � �
�
�
� �� � �
��
��
�
G
ï�� ï� ï� ï� ï� ï� ï� ï� ï� ï� 0 1 2 3 4 5 � � � � 10
�� � � �
��
�
�
�
�
�
�� �
�
�� �
�
T
ï�� ï� ï� ï� ï� ï� ï� ï� ï� ï� 0 1 2 3 4 5 � � � � 10
�
�
� ��
� �
�
�
�
�
�
�
��
� ��
�
�
T
0.0
0.1
0.2
0.3
0.4
0.5
ï�� ï� ï� ï� ï� ï� ï� ï� ï� ï� 0 1 2 3 4 5 � � � � 10
�
�
� �� �
��
�
�
�
�
�
�
��
�
� ��
1 2 3 4 5 � � � � 10 11 12 13 14 15 �� �� �� �� 20 21 22 23 24 25
0.000.050.100.150.200.250.300.350.400.450.500.55����������������
Frequency
�
�
�
�
�
�
�
�
�
�
�
�
�
�
�
ï�� ï� ï� ï� ï� ï� ï� ï� ï� ï�
0.000.050.100.150.200.250.300.350.400.450.500.55����������������

245
Figure 4: MapDamage report for the final round of mapping for Glyptodon. The top panels
show the characteristic high frequency of purines (A and G) immediately before the reads.
The two lower panels show the accumulation of 5’ C-‐to-‐T (red) and 3’ G-‐to-‐A (blue)
misincorporations characteristic of ancient DNA.
A
0.0
0.1
0.2
0.3
0.4
0.5Frequency
��
��
��
� �
�
�
�
�
�� �
�� � �
�
A
� �� � �
� ��
�
�
�
� ��
��
�
��
�
C
� � � � � � � �
�
�
�
�
�� �
�� � � �
C
0.0
0.1
0.2
0.3
0.4
0.5
��
� � �
�� � �
�
�
� � �� �
��
� �
G
0.0
0.1
0.2
0.3
0.4
0.5
ï�� ï� ï� ï� ï� ï� ï� ï� ï� ï� 0 1 2 3 4 5 � � � � 10
Frequency
� �� �
��
�
� �
�
�
� �� � �
�� �
�
Gï�� ï� ï� ï� ï� ï� ï� ï� ï� ï� 0 1 2 3 4 5 � � � � 10
�� �
�
�� �
��
�
�
�
�
� ��
�� �
�
T
ï�� ï� ï� ï� ï� ï� ï� ï� ï� ï� 0 1 2 3 4 5 � � � � 10
��
��
� � �
��
�
�
�
�� �
�
�
� � �
T
0.0
0.1
0.2
0.3
0.4
0.5
ï�� ï� ï� ï� ï� ï� ï� ï� ï� ï� 0 1 2 3 4 5 � � � � 10
�� �
�
��
� ��
�
�
�
�
� ��
� � �
�
1 2 3 4 5 � � � � 10 11 12 13 14 15 �� �� �� �� 20 21 22 23 24 25
0.000.050.100.150.200.250.300.350.400.450.500.55����
Frequency
�
�
�
�
�
�
�
�
�
�
�
�
�
�
�
ï�� ï� ï� ï� ï� ï� ï� ï� ï� ï�
0.000.050.100.150.200.250.300.350.400.450.500.55����

246
Phylogenetic analysis of perissodactyls (including Hippidion)
We aligned our Hippidion consensus sequence with previously published
mitogenome sequences from a range of perissodactyls (Table S1) using the ClustalW
algorithm as implemented in Geneious v6.1.2 (Biomatters;
http://www.geneious.com). Optimal partitioning and substitution models for
downstream maximum likelihood and Bayesian phylogenetic analyses were
determined using PartitionFinder v1.1.1. (Lanfear et al., 2012). PartitionFinder
favoured schemes ranging from six to seven partitions (Table S2) reduced from an
input of 45 putative partitions: first, second and third codon positions of each
individual mitochondrial protein-‐coding gene; and stem and loop sites of 12S rRNA,
16S rRNA and concatenated tRNAs. Stem and loop positions of RNA genes were
identified using RNAalifold (Bernhart et al., 2008). Third codon positions of protein
coding genes were RY-‐coded to reduce the influence of transition saturation using
DAMBE (Xia and Xie, 2001).
Topology estimation and molecular dating were performed under a Bayesian
framework using BEAST v1.8 (Drummond and Rambaut, 2007), using the
substitution models and partitioning scheme determined using PartitionFinder
(Table S2). The hypothesis of a global clock was tested and rejected, so we used an
uncorrelated relaxed lognormal clock model allowing relative rates to vary for each
partition. We calibrated the molecular clock by constraining the age of three nodes:
the root of the tree (Figure 5: node A), the divergence between Ceratomorpha and
Tapiromorpha (Figure 5: node B), and the origin of the Hippidion lineage (Figure 5:
node H). All node age constraints were implemented as uniform distributions. The
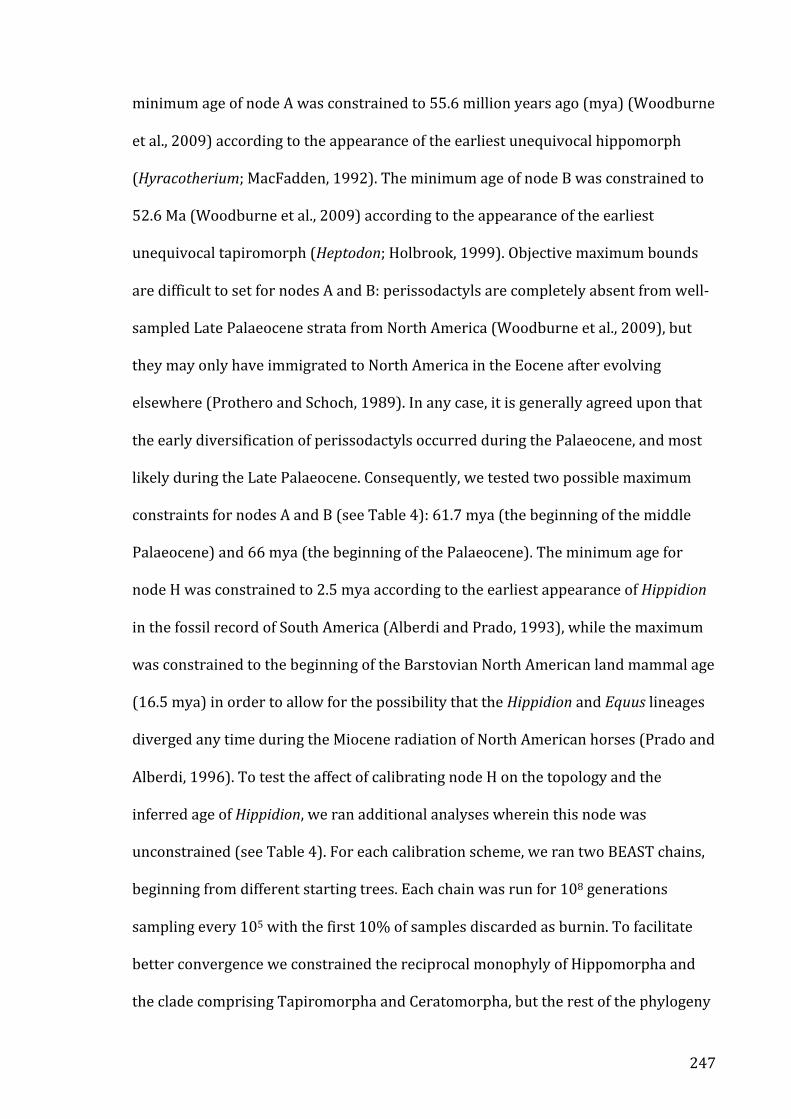
247
minimum age of node A was constrained to 55.6 million years ago (mya) (Woodburne
et al., 2009) according to the appearance of the earliest unequivocal hippomorph
(Hyracotherium; MacFadden, 1992). The minimum age of node B was constrained to
52.6 Ma (Woodburne et al., 2009) according to the appearance of the earliest
unequivocal tapiromorph (Heptodon; Holbrook, 1999). Objective maximum bounds
are difficult to set for nodes A and B: perissodactyls are completely absent from well-‐
sampled Late Palaeocene strata from North America (Woodburne et al., 2009), but
they may only have immigrated to North America in the Eocene after evolving
elsewhere (Prothero and Schoch, 1989). In any case, it is generally agreed upon that
the early diversification of perissodactyls occurred during the Palaeocene, and most
likely during the Late Palaeocene. Consequently, we tested two possible maximum
constraints for nodes A and B (see Table 4): 61.7 mya (the beginning of the middle
Palaeocene) and 66 mya (the beginning of the Palaeocene). The minimum age for
node H was constrained to 2.5 mya according to the earliest appearance of Hippidion
in the fossil record of South America (Alberdi and Prado, 1993), while the maximum
was constrained to the beginning of the Barstovian North American land mammal age
(16.5 mya) in order to allow for the possibility that the Hippidion and Equus lineages
diverged any time during the Miocene radiation of North American horses (Prado and
Alberdi, 1996). To test the affect of calibrating node H on the topology and the
inferred age of Hippidion, we ran additional analyses wherein this node was
unconstrained (see Table 4). For each calibration scheme, we ran two BEAST chains,
beginning from different starting trees. Each chain was run for 108 generations
sampling every 105 with the first 10% of samples discarded as burnin. To facilitate
better convergence we constrained the reciprocal monophyly of Hippomorpha and
the clade comprising Tapiromorpha and Ceratomorpha, but the rest of the phylogeny

248
was co-‐estimated with the divergence dates. Parameter values were monitored and
compared between the two independent chains in Tracer v1.6
(http://tree.bio.ed.ac.uk/software/tracer/) to ensure convergence and ESSs >200.
Sampled trees and parameter values from each run were combined before
summarising the results.
To test the sensitivity of our inferred tree topology to model choice and
analytical framework, we repeated our phylogenetic analysis in RAxML (Stamatakis
et al., 2008). The RAxML analysis comprised a maximum likelihood search for the
best-‐scoring tree from 1,000 bootstrap replicates.
In addition to the BEAST and RAxML analyses above, we conducted a network
analysis (Figure 6) of a 351 bp control region sequence corresponding to sites
15,704-‐16,054 of the Equus ferus mitogenome (AY584828). In addition to our
Hippidion sequence, we included sixteen additional Hippidion individuals for which
the relevant region had been previously published (Orlando et al., 2008; Orlando et
al., 2009; Weinstock et al., 2005), and also the relevant region from the Equus ferus
mitogenome (Table S3). All alignment columns containing gaps or ambiguous bases
were removed, leaving a total of 38 variable positions. The analysis was performed in
Network v4.6 (http://www.fluxus-‐engineering.com/) using the median-‐joining
algorithm (Bandelt et al., 1999).

249
Phylogenetic analysis of xenarthrans (inc. Glyptodon)
We aligned our Glyptodon consensus sequence with previously published
mitogenomes and individual mitochondrial gene sequences from a range of
xenarthrans (Table S4) using the ClustalW algorithm as implemented in Geneious
v6.1.2 (Biomatters; http://www.geneious.com). Data was partitioned and
substitution models determined using PartitionFinder, RNAalifold and DAMBE as
described above for the perissodactyls (Table S5).
BEAST and RAxML analyses were run for the xenarthran dataset as described
above for perissodactyls, with the exception of the calibrations for molecular dating.
We calibrated three nodes on the xenarthran phylogeny: the root of the tree (Figure
7: node A), the origin of Glyptodon (Figure 7: node M) and the origin of Tolypeutinae
(Figure 7: node O). All node age constraints were implemented as uniform
distributions. The minimum age of node A was constrained to 55.8 mya (end of the
Palaeocene) according to the appearance of the earliest unequivocal cingulates
(Bergqvist and Oliveira, 1998). The minimum age of node M was constrained to 36
mya according to the appearance of the earliest unequivocal glyptodontids
(Lomaphorelus, Palaeopeltis; Simpson, 1948). The minimum age of node O was
constrained to 26 mya according to the appearance of Kuntianaru, a stem tolypeutine
(Billet et al., 2011). The maximum age of any node on the xenarthran phylogeny is
difficult to determine objectively, as the fossil record is patchy and the geographical
origin of early xenarthrans is uncertain (Billet et al., 2011; Rose, 2006). Consequently,
we test three alternative maximum constraints for the diversification of Xenarthra
(see Table 5), spanning a range of plausible times: 70.06 mya (secondarily derived
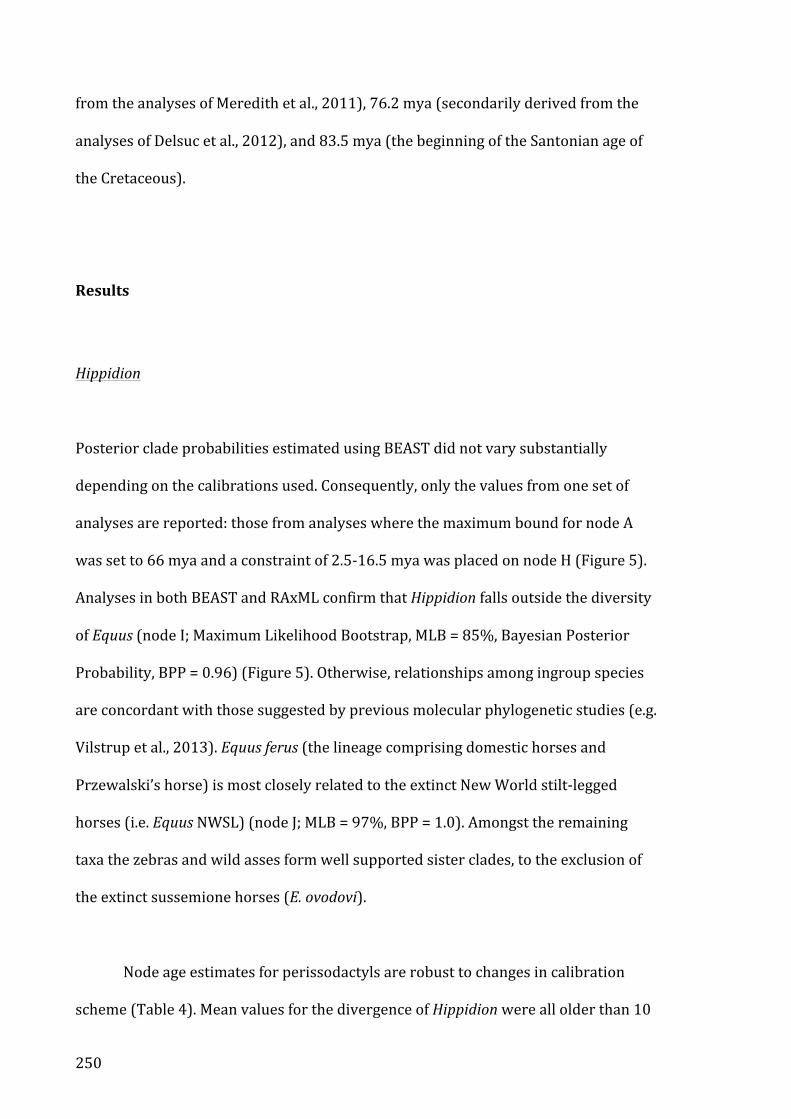
250
from the analyses of Meredith et al., 2011), 76.2 mya (secondarily derived from the
analyses of Delsuc et al., 2012), and 83.5 mya (the beginning of the Santonian age of
the Cretaceous).
Results
Hippidion
Posterior clade probabilities estimated using BEAST did not vary substantially
depending on the calibrations used. Consequently, only the values from one set of
analyses are reported: those from analyses where the maximum bound for node A
was set to 66 mya and a constraint of 2.5-‐16.5 mya was placed on node H (Figure 5).
Analyses in both BEAST and RAxML confirm that Hippidion falls outside the diversity
of Equus (node I; Maximum Likelihood Bootstrap, MLB = 85%, Bayesian Posterior
Probability, BPP = 0.96) (Figure 5). Otherwise, relationships among ingroup species
are concordant with those suggested by previous molecular phylogenetic studies (e.g.
Vilstrup et al., 2013). Equus ferus (the lineage comprising domestic horses and
Przewalski’s horse) is most closely related to the extinct New World stilt-‐legged
horses (i.e. Equus NWSL) (node J; MLB = 97%, BPP = 1.0). Amongst the remaining
taxa the zebras and wild asses form well supported sister clades, to the exclusion of
the extinct sussemione horses (E. ovodovi).
Node age estimates for perissodactyls are robust to changes in calibration
scheme (Table 4). Mean values for the divergence of Hippidion were all older than 10

251
mya, while the lower bound of the 95% HPD was always older than 7 mya. This is
clearly incompatible with Orlando et al. (2009)’s age estimates, which placed the
origin of Hippidion at most 4.5 mya. However, our results are very close to Vilstrup et
al. (2013)’s timescale for the evolution of Equus. Considering the high support we
recover for the monophyly of Equus, this suggests that our results are a more
accurate reflection of the true temporal origin of Hippidion than Orlando et al.
(2009)’s values.
Network analysis of a 351 bp section of the control region reveals that the
Hippidion sample in this study represents a distinct lineage from all other previously
sampled Hippidion individuals. At least eight nucleotide changes separate our
Hippidion sample from the ‘H. devillei’ group (inc. four haplotypes, four individuals),
while at least six substitutions separate ‘H. devillei’ from ‘H. saldiasi/principale’ (inc.
eight haplotypes, 12 individuals). The H. principale individual differs from the
sampled H. devillei haplotypes by only a single substitution. In comparison, Equus
ferus is separated from Hippidion by at least 23 substitutions.

252
Figure 5: Phylogeny of perissodactyls. Topology and branch lengths were estimated using
BEAST, with a maximum bound of 66 mya on the root (node A) and a constraint of 2.5-‐16.5
mya on node H. Scale is in millions of years before the present. Node bars represent the 95%
Highest Posterior Density (HDP) of age estimates. Support values (Bayesian Posterior
Probability / Maximum Likelihood Bootstrap) are given for nodes that did not receive
maximum support in both analyses (1.0 / 100). Node ages estimated under all calibration
schemes are listed in Table 4. Extinct taxa highlighted in red. Hippidion in bold.
0102030405060
Dicerorhinus sumatrensis
Rhinoceros sondaicus
Equus kiang
Equus zebra
Tapirus indicus
Hippidion
Equus grevyi
Equus quagga
Equus ovodovi
Equus hemionus onager
Equus ferus
Rhinoceros unicornis
Equus NWSL
Equus hemionus kulan
Diceros bicornis
Coelodonta antiquitatis
Ceratotherium simum
0.71 / 47
0.81 / 76
0.96 / 85
0.6 / 52
Hippomorpha (horses)
Ceratomorpha (rhinos)
Tapiromorpha (tapirs)
Time (mya)
Asses
Zebras
“Sussemione” horses
New World stilt-legged horses
Domestic horse ancestor
1.0 / 97
1.0 / 98
A
B
C
D
E
F
G
N
L
K
M
O
P
I
JH

253
Table 4: Mean node ages (and 95% highest posterior densities) for all nodes in Figure 5, as
estimated using BEAST according to four difference calibration schemes (see main text for
details).
Node
Node age (mya)
Palaeocene Perissodactyla (<66 mya) Late Palaeocene Perissodactyla (<61.7 mya)
Hippidion constrained (2.5-‐16.5 mya)
Hippidion unconstrained
Hippidion constrained (2.5-‐16.5 mya)
Hippidion unconstrained
A 61.9 (56.8-‐66.0)
61.9 (56.9-‐66.0)
59.2 (56.2-‐61.7)
59.2 (56.2-‐61.7)
B 56.2 (52.6-‐61.7)
56.2 (52.6-‐61.7)
55.3 (52.6-‐59.1)
55.3 (52.6-‐59.1)
C 23.1 (17.3-‐29.2)
23.1 (17.5-‐27.9)
22.5 (17.0-‐29.6)
22.5 (16.88-‐28.4)
D 11.7 (7.7-‐15.9)
11.6 (7.6-‐15.8)
11.3 (7.5-‐15.9)
11.3 (7.4-‐15.6)
E 22.0 (16.7-‐28.1)
22.0 (16.6-‐27.9)
21.4 (16.1-‐27.4)
21.4 (16.0-‐26.9)
F 9.8 (6.3-‐13.6)
9.8 (6.3-‐13.5)
9.6 (6.0-‐13.1)
9.5 (5.5-‐12.0)
G 8.8 (5.7-‐12.2)
8.8 (5.5-‐12.0)
8.6 (5.6-‐12.0)
8.6 (6.2-‐13.2)
H 10.6 (7.7-‐13.6)
10.6 (7.6-‐13.6)
10.3 (7.5-‐13.1)
10.2 (7.4-‐13.1)
I 8.1 (6.0-‐10.4)
8.1 (6.0-‐10.5)
7.8 (5.8-‐10.2)
7.9 (5.9-‐10.2)
J 6.3 (4.4-‐8.6)
6.3 (4.3-‐8.6)
6.2 (4.2-‐8.3)
6.2 (4.2-‐8.3)
K 5.1 (3.7-‐6.6)
5.1 (3.6-‐6.6)
4.9 (3.6-‐6.5)
4.9 (3.6-‐6.5)
L 4.8 (3.4-‐6.2)
4.8 (3.5-‐6.2)
4.6 (3.3-‐6.1)
4.6 (3.3-‐6.0)
M 4.1 (2.8-‐5.3)
4.1 (2.9-‐5.3)
3.9 (2.8-‐5.3)
3.9 (2.8-‐5.2)
N 2.8 (1.8-‐3.9)
2.8 (1.9-‐3.9)
2.8 (1.8-‐3.9)
2.8 (1.8-‐3.8)
O 1.3 (0.8-‐1.9)
1.3 (0.9-‐1.9)
1.3 (0.8-‐1.8)
1.3 (0.8-‐1.8)
P 1.1 (0.7-‐1.6)
1.1 (0.7-‐1.6)
1.1 (0.7-‐1.6)
1.1 (0.7-‐1.6)

254
Figure 6: Haplotype network generated using the median-‐joining algorithm in Network,
based on a 351 bp fragment of control region corresponding to sites 15,704-‐16,054 of the
Equus ferus mitogenome (AY584828). Coloured nodes represent sampled haplotypes (size
relative to frequency), while black nodes represent unsampled intermediate haplotypes.
Sequence IDs are listed in Table S3.
H. devillei
H. saldiasi/principale
Hippidion(this study)
Equus ferus
19
1
2
3
6
4
5
710
118 9
12
13
14

255
Glyptodon
Posterior support for clades obtained from Bayesian analyses under different
calibration schemes were largely comparable (except in one case: see below), so only
the clade support values obtained from the analysis constrained to 76.2 mya is
reported (Figure 7). Both BEAST and RAxML analyses confirm that Glyptodon is
closely related to euphractine, tolypeutine and chlamyphorine armadillos to the
exclusion of Dasypodinae (node M; MLB = 99, BPP = 1.0), thus rendering extant
armadillos (Dasypodidae) paraphyletic with respect to Glyptodontidae (Figure 7).
However, while we recover good support for a clade comprising Tolypeutinae and
Chlamyphorinae (node O; MLB = 87%, BPP = 1.0), the relationship of this combined
clade relative to Glyptodon and Euphractinae is uncertain. A clade comprising
Glyptodontidae and Euphractinae to the exclusion of Tolypeutinae and
Chlamyphorinae is favoured by Bayesian analyses when the diversification of
Xenarthra is constrained to 83.5 mya, although only weakly (BPP = 0.66). However,
when the age constraint on Xenarthra is restricted (as well as in maximum likelihood
analyses), a clade comprising Chlamyphorinae, Euphractinae and Tolypeutinae to the
exclusion of Glyptodon is preferred, although again only weakly (node N; MLB = 52%,
BPP 76.2 mya = 0.57, BPP 70.06 mya = 0.75). Otherwise, relationships among
Xenarthrans are consistent with previous phylogenetic studies (e.g. Delsuc et al.,
2012; Greenwood et al., 2001; Hoss et al., 1996).

256
Figure 7: Phylogeny of xenarthrans. Topology and branch lengths were estimated using
BEAST, with a maximum bound of 76.2 mya on the root (node A). Scale is in millions of years
before the present. Node bars represent the 95% Highest Posterior Density (HDP) of age
estimates. Support values (Bayesian Posterior Probability / Maximum Likelihood Bootstrap)
are given for nodes that did not receive maximum support in both analyses (1.0 / 100). Node
ages estimated under all calibration schemes are listed in Table 5. Subfamily names listed as
for Delsuc et al. (2012). Extinct taxa highlighted in red. Glyptodon in bold.
010203040506070
Dasypus kappleri
Priodontes maximus
Myrmecophaga tridactyla
Choloepus didactylus
Tolypeutes matacus
Bradypus variegatus
Chlamyphous truncatus
Chaetophractus villosus
Choleopus hoffmanni
Bradypus tridactylus
Dasypus novemcinctus
Cyclopes didactylus
Cabassous unicinctus
Bradypus torquatus
Euphractus sexcinctus
Mylodon darwinii
Glyptodon
Zaedyus pichiy
Calyptophractus retusus
Tamandua tetradactyla
Nothrotheriops shastensis
0.97 / 81
0.71 / 56
0.99 / 690.57 / 52
Time (mya)
1.0 / 87
1.0 / 85
1.0 / 99
1.0 / 76
Folivora (sloths)
Cingulata
Vermilingua(anteaters)
Dasypodinae (nine-banded andlong-nosed armadillos)
Tolypeutinae(three-banded,naked-tailed, andgiant armadillos)
Chlamyphorinae(fairy armadillos)
Euphractinae(six-banded and hairyarmadillos, pichi)
A
B
C
D
E
F
G
H
I
J
K
L
N
O
P
Q
R
S
T
M
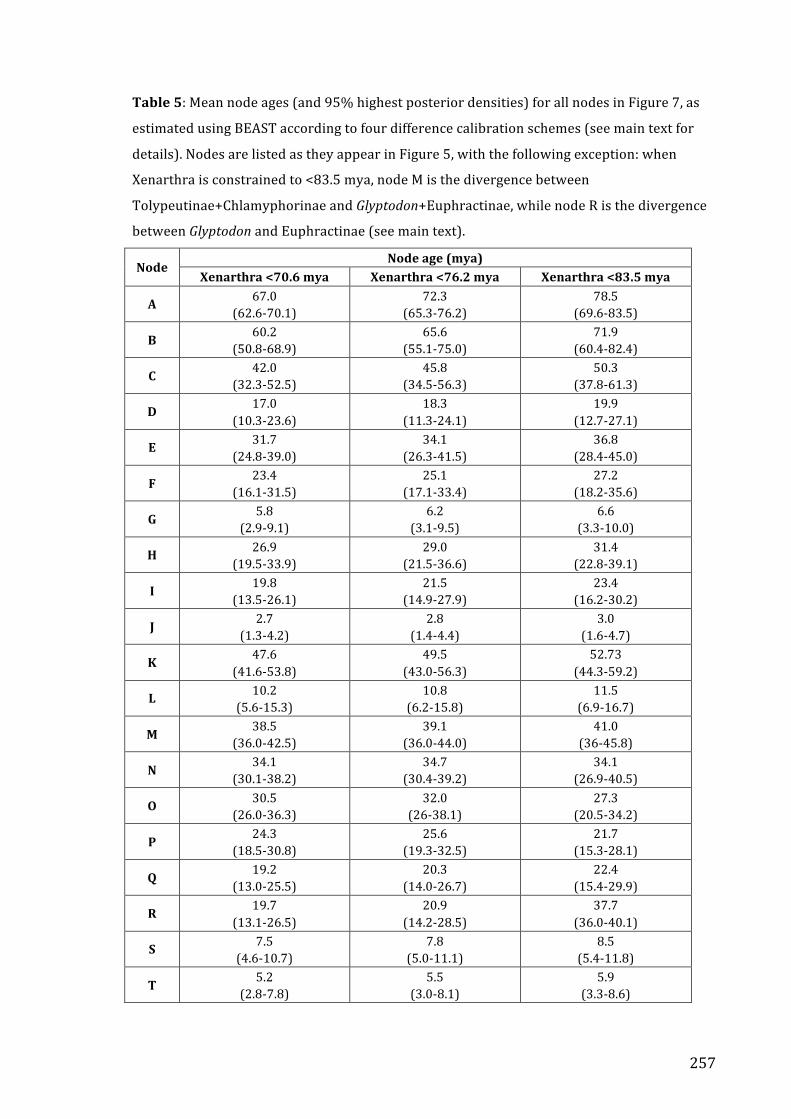
257
Table 5: Mean node ages (and 95% highest posterior densities) for all nodes in Figure 7, as
estimated using BEAST according to four difference calibration schemes (see main text for
details). Nodes are listed as they appear in Figure 5, with the following exception: when
Xenarthra is constrained to <83.5 mya, node M is the divergence between
Tolypeutinae+Chlamyphorinae and Glyptodon+Euphractinae, while node R is the divergence
between Glyptodon and Euphractinae (see main text).
Node Node age (mya)
Xenarthra <70.6 mya Xenarthra <76.2 mya Xenarthra <83.5 mya
A 67.0 (62.6-‐70.1)
72.3 (65.3-‐76.2)
78.5 (69.6-‐83.5)
B 60.2 (50.8-‐68.9)
65.6 (55.1-‐75.0)
71.9 (60.4-‐82.4)
C 42.0 (32.3-‐52.5)
45.8 (34.5-‐56.3)
50.3 (37.8-‐61.3)
D 17.0 (10.3-‐23.6)
18.3 (11.3-‐24.1)
19.9 (12.7-‐27.1)
E 31.7 (24.8-‐39.0)
34.1 (26.3-‐41.5)
36.8 (28.4-‐45.0)
F 23.4 (16.1-‐31.5)
25.1 (17.1-‐33.4)
27.2 (18.2-‐35.6)
G 5.8 (2.9-‐9.1)
6.2 (3.1-‐9.5)
6.6 (3.3-‐10.0)
H 26.9 (19.5-‐33.9)
29.0 (21.5-‐36.6)
31.4 (22.8-‐39.1)
I 19.8 (13.5-‐26.1)
21.5 (14.9-‐27.9)
23.4 (16.2-‐30.2)
J 2.7 (1.3-‐4.2)
2.8 (1.4-‐4.4)
3.0 (1.6-‐4.7)
K 47.6 (41.6-‐53.8)
49.5 (43.0-‐56.3)
52.73 (44.3-‐59.2)
L 10.2 (5.6-‐15.3)
10.8 (6.2-‐15.8)
11.5 (6.9-‐16.7)
M 38.5 (36.0-‐42.5)
39.1 (36.0-‐44.0)
41.0 (36-‐45.8)
N 34.1 (30.1-‐38.2)
34.7 (30.4-‐39.2)
34.1 (26.9-‐40.5)
O 30.5 (26.0-‐36.3)
32.0 (26-‐38.1)
27.3 (20.5-‐34.2)
P 24.3 (18.5-‐30.8)
25.6 (19.3-‐32.5)
21.7 (15.3-‐28.1)
Q 19.2 (13.0-‐25.5)
20.3 (14.0-‐26.7)
22.4 (15.4-‐29.9)
R 19.7 (13.1-‐26.5)
20.9 (14.2-‐28.5)
37.7 (36.0-‐40.1)
S 7.5 (4.6-‐10.7)
7.8 (5.0-‐11.1)
8.5 (5.4-‐11.8)
T 5.2 (2.8-‐7.8)
5.5 (3.0-‐8.1)
5.9 (3.3-‐8.6)

258
Our results suggest that the ancestor of Glyptodontidae diverged from its nearest
living ancestor around 40 mya (Figure 7; Table 5). In addition, the inclusion of
Glyptodon in our analyses pushes back the age of Cingulata (node K) by over five
million years compared to previous molecular dating studies (see Delsuc et al., 2012).
In contrast, we show that the inclusion of Glyptodon as a calibration has relatively
little effect on the estimation of more recent divergences within Cingulata, or on
divergences within Folivora (sloths) or Vermilingua (anteaters), compared to
previously published estimates. Finally, we demonstrate that the maximum
constraint placed on the root of the xenarthran phylogeny has a large effect on the
mean age of many nodes, particularly those close to the root.
Discussion
The ancient DNA data presented in this study strongly support previous
palaeontological hypotheses regarding the evolution of both Hippidion and Glyptodon.
We demonstrate that Hippidion is distinct from Equus and is not closely allied with
Equus ferus or the New World stilt–legged horses. This result is consistent with
observations from the fossil record but contrary to the conclusions of previous
ancient DNA studies. The conflict between our results and those of previous ancient
DNA studies appears to be caused mainly by a change in the root position of the
phylogeny: re-‐rooting phylogenies from previous studies makes them largely
compatible with the topology in Figure 3. Previous studies focused predominantly on
relatively short, quickly evolving mitochondrial control region sequences. This likely
made estimating the root position from outgroup sequences difficult, since horses

259
diverged from their nearest living relatives – tapirs and rhinos – over 50 mya (Figure
4). In the present study we have access to additional data from more slowly evolving
mitochondrial regions making it straightforward to align distant outgroups and
confidently determine the root position (i.e. between Hippidion and Equus). Further,
the inclusion of outgroup taxa has the advantage of allowing the use of additional
fossil calibrations (e.g. the earliest unequivocal hippomorph: Hyracotherium), which
were not implemented in previous ancient DNA studies focusing on Hippidion. Using
these calibrations, we found that the divergence between Hippidion and Equus
occurred much too early to have resulted from allopatric speciation following the
dispersal of Hippidion ancestors into South America during the Great American
Interchange (~3 mya), as suggested by Orlando et al. (2009). This outcome is
consistent regardless of when we set the upper limit on the early diversification of
perissodactyls, or whether we place a constraint on the temporal origin of Hippidion
(Table 4). Instead, our results are fully consistent with a North American origin of the
Hippidion lineage during the Late Miocene as part of a radiation of pliohippine horses,
as suggested by some interpretations of the fossil record (Prado and Alberdi, 1996).
Consequently, Hippidion would already have existed as a distinct lineage at the time
of the Great American Interchange, and must subsequently have become extinct in
North America following dispersal into South America. This result should encourage
investigation of the North American fossil record for relatives of Hippidion.
While the Hippidion sequence data presented in this study largely resolve the
relationship between Hippidion and Equus, our results raise additional questions with
regard to the relationship among taxa within Hippidion. Three morphologically
distinct species are recognised from the Pliocene/Pleistocene fossil record (Alberdi
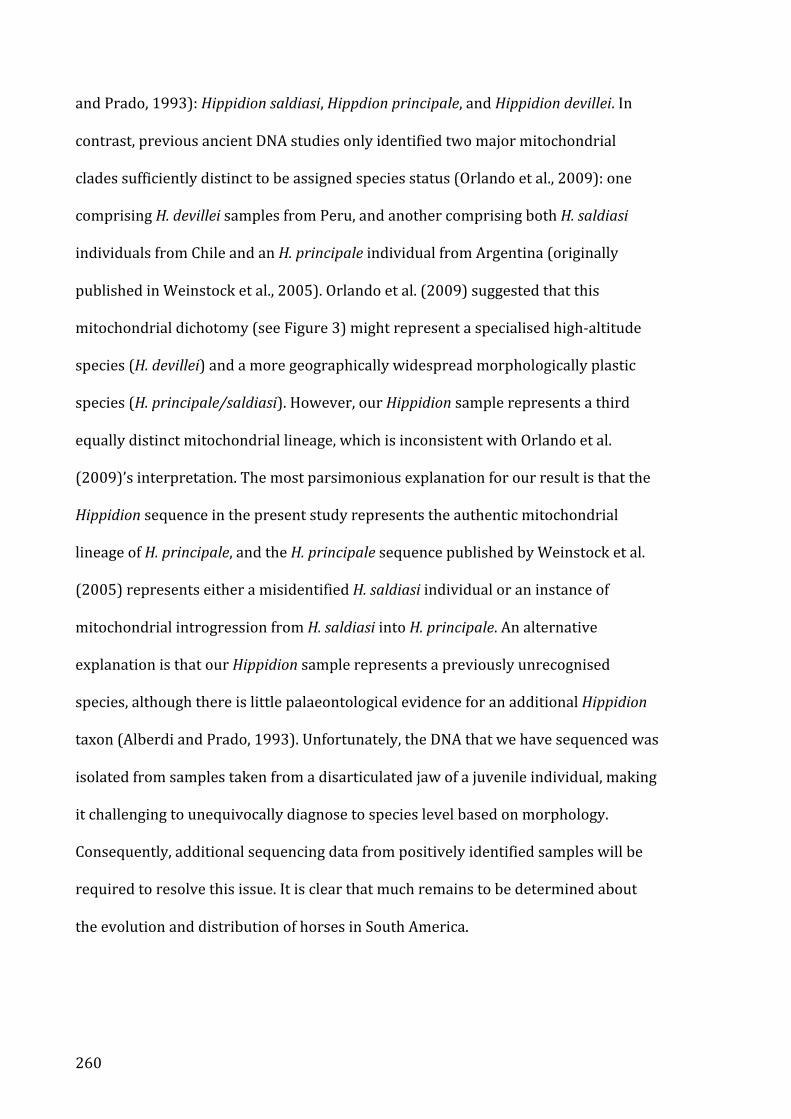
260
and Prado, 1993): Hippidion saldiasi, Hippdion principale, and Hippidion devillei. In
contrast, previous ancient DNA studies only identified two major mitochondrial
clades sufficiently distinct to be assigned species status (Orlando et al., 2009): one
comprising H. devillei samples from Peru, and another comprising both H. saldiasi
individuals from Chile and an H. principale individual from Argentina (originally
published in Weinstock et al., 2005). Orlando et al. (2009) suggested that this
mitochondrial dichotomy (see Figure 3) might represent a specialised high-‐altitude
species (H. devillei) and a more geographically widespread morphologically plastic
species (H. principale/saldiasi). However, our Hippidion sample represents a third
equally distinct mitochondrial lineage, which is inconsistent with Orlando et al.
(2009)’s interpretation. The most parsimonious explanation for our result is that the
Hippidion sequence in the present study represents the authentic mitochondrial
lineage of H. principale, and the H. principale sequence published by Weinstock et al.
(2005) represents either a misidentified H. saldiasi individual or an instance of
mitochondrial introgression from H. saldiasi into H. principale. An alternative
explanation is that our Hippidion sample represents a previously unrecognised
species, although there is little palaeontological evidence for an additional Hippidion
taxon (Alberdi and Prado, 1993). Unfortunately, the DNA that we have sequenced was
isolated from samples taken from a disarticulated jaw of a juvenile individual, making
it challenging to unequivocally diagnose to species level based on morphology.
Consequently, additional sequencing data from positively identified samples will be
required to resolve this issue. It is clear that much remains to be determined about
the evolution and distribution of horses in South America.

261
Mitochondrial sequence data obtained from Glyptodon in the present study
provide strong support for the paraphyly of extant armadillos with respect to
glyptodontids. Several recent palaeontological studies have tentatively suggested a
close relationship between glyptodontids and euphractine armadillos, based on
several morphological characters (Billet et al., 2011; Gaudin and Wible, 2006). While
BEAST analyses recover a topology consistent with this hypothesis when the
timescale for xenarthran diversification is relaxed to the last 83.5 million years,
further restricting this constraint on the root results in Glyptodon falling outside of a
clade of non-‐dasypodine armadillos. However, in either case statistical support is
weak: analyses in the present study ultimately lack the resolution to determine the
precise affinity of Glyptodontidae within Cingulata. This may simply be due to a lack
of comparative data. Only a few mitochondrial genes are available for tolypeutine,
chlamyphorine and euphractine armadillos in comparison to the largely complete
mitogenome we have assembled for Glyptodon. Thus, it is possible that sequencing
additional genes from extant species will provide sufficient information to further
refine the phylogenetic position of Glyptodontidae in future analyses.
Including Glyptodon in our phylogeny allowed us to use the presence of
glyptodontids in the late Eocene (Simpson, 1948) as an additional fossil constraint for
molecular dating. However, while constraining the temporal origin of Glyptodon
resulted in slightly older estimates for several nodes compared to previous studies
(e.g. Delsuc et al., 2012), the restriction placed on the maximum age of Xenarthra had
a larger effect overall (Table 5). Consequently, caution should be exercised when
calibrating the root of Xenarthra, especially as placing an objective maximum bound
on this node is difficult due to uncertainty surrounding the geographical origin of
262
early xenarthrans (Rose, 2006). Glyptodon may serve as a more informative
calibration in the future if putative glyptodontid remains from the Late Palaeocene
(Cifelli, 1983) can be positively identified (see Bergqvist and Oliveira, 1995).
Ultimately, the present study has largely resolved the phylogenetic affinities of
two elements of the extinct South American megafauna: Hippidion and Glyptodon.
Further, it has helped to clarify the geographical and temporal origin of Hippidion,
although details concerning the diversification of Hippidion within South America
remain uncertain. Using hybridisation enrichment and high-‐throughput sequencing,
quality DNA sequence data can now be obtained for large numbers of samples in a
cost-‐effective manner, even for relatively old sites with poor potential for DNA
preservation (e.g. the Luján Formation), making broad surveys of past diversity
feasible. This approach will permit the evolution of Hippidion to be further clarified in
the future. Further, hybridisation enrichment and high-‐throughput sequencing will
allow ancient DNA analysis of taxa that have proven recalcitrant to traditional
sequencing methods. For example, future studies may finally be able to unequivocally
resolve the relationships of the enigmatic South American meridiungulates (e.g.
Macrauchenia, Toxodon). This would have important implications for our
understanding of the evolution and distribution of early placental mammals.
263
References
Alberdi, M.T., Prado, J.L., 1993. Review of the genus Hippidion Owen, 1869
(Mammalia: Perissodactyla) from the Pleistocene of South America. Zool J Linn Soc
108, 1-‐22.
Bandelt, H.J., Forster, P., Röhl, A., 1999. Median-‐joining networks for inferring
intraspecific phylogenies. Mol Biol Evol 16, 37-‐48.
Bergqvist, L.P., Oliveira, E.V., 1995. Comments on the xenarthran astragali from the
Itaboraí Basin (middle Paleocene) of Rio de Janeiro, Brazil. 12º Jornadas Argentinas
de Paleontología de Vertebrados (Tucamán) 14.
Bergqvist, L.P., Oliveira, E.V., 1998. A new Paleocene armadillo (Mammalia,
Dasypodoidea) from the Itaboraí Basin, Brazil. Asoc Paleontol Argent Publ Espec 5,
35-‐40.
Bernhart, S., Hofacker, I., Will, S., Gruber, A., Stadler, P., 2008. RNAalifold: improved
consensus structure prediction for RNA alignments. BMC Bioinformatics 9, 474.
Billet, G., Hautier, L., de Muizon, C., Valentin, X., 2011. Oldest cingulate skulls provide
congruence between morphological and molecular scenarios of armadillo evolution.
Proc R Soc B 278, 2791-‐2797.
Cifelli, R.L., 1983. Eutherian tarsals from the late Paleocene of Brazil. Am Mus Novit
2761, 1-‐31.
Cione, A.L., Figini, A.J., Tonni, E.P., 2006. Did the megafauna range to 4300 Bp In South
America? Radiocarbon 43, 69-‐75.
Cione, A.L., Tonni, E.P., 1995. Chronostratigraphy and "Land-‐Mammal Ages" in the
Cenozoic of Southern South America: principles, practices, and the "Uquian" problem.
J Paleontol 69, 135-‐159.
Clack, A.A., MacPhee, R.D., Poinar, H.N., 2012. Mylodon darwinii DNA sequences from
ancient fecal hair shafts. Ann Anat 194, 26-‐30.
264
Delsuc, F., Superina, M., Tilak, M.-‐K., Douzery, E.J.P., Hassanin, A., 2012. Molecular
phylogenetics unveils the ancient evolutionary origins of the enigmatic fairy
armadillos. Mol Phylogenet Evol 62, 673-‐680.
Dillon, A., Rabassa, J., 1985. Miembro La Chumbiada, Formación Luján (Pleistoceno,
provincia de Buenos Aires): una nueva unidad estratigráfica del valle del río Salado.
Actas de las I Jornadas Geológicas Bonaerenses 1, 1-‐27.
Drummond, A.J., Rambaut, A., 2007. BEAST: Bayesian evolutionary analysis by
sampling trees. BMC Evol Biol 7.
Engelmann, G., 1985. The phylogeny of the Xenarthra. In: Montgomery, G.G. (Ed.), The
ecology and evolution of armadillos, sloths, and vermilinguas. Smithsonian Institution
Press, Washington, DC.
Fariña, R.A., Vizcaíno, S.F., de Iulis, G., 2013. Megafauna: giant beasts of Pleistocene
South America. Indiana University Press, Bloomington, Indiana.
Gaudin, T.J., Wible, J.R., 2006. The phylogeny of the living and extinct armadillos
(Mammalia, Xenarthra, Cingulata): a craniodental analysis. In: Carrano, M.T., Gaudin,
T.J., Blob, R.W., Wible, J.R. (Eds.), Amniote paleobiology: perspectives on the evolution
of mammals, birds, and reptiles. University of Chicago Press, Chicago, Illinois, pp. 153-‐
198.
Gillette, D.D., Ray, C.E., 1981. Glyptodonts of North America. Smithson Contrib
Paleobiol 40, 1-‐255.
Ginolhac, A., Rasmussen, M., Gilbert, M.T.P., Willerslev, E., Orlando, L., 2011.
mapDamage: testing for damage patterns in ancient DNA sequences. Bioinformatics
27, 2153-‐2155.
Greenwood, A.D., Castresana, J., Feldmaier-‐Fuchs, G., Paabo, S., 2001. A molecular
phylogeny of two extinct sloths. Mol Phylogenet Evol 18, 94-‐103.
Holbrook, L.T., 1999. The phylogeny and classification of tapiromorph perissodactyls
(Mammalia). Cladistics 15, 331-‐350.
Hoss, M., Dilling, A., Currant, A., Paabo, S., 1996. Molecular phylogeny of the extinct
ground sloth Mylodon darwinii. Proc Natl Acad Sci U S A 93, 181-‐185.

265
Kircher, M., 2012. Analysis of High-‐Throughput Ancient DNA Sequencing Data.
Ancient DNA: Methods and Protocols, pp. 197-‐228.
Lanfear, R., Calcott, B., Ho, S.Y., Guindon, S., 2012. PartitionFinder: combined selection
of partitioning schemes and substitution. Mol Biol Evol 29, 1537-‐1719.
Li, H., Durbin, R., 2009. Fast and accurate short read alignment with Burrows-‐
Wheeler transform. Bioinformatics 25, 1754-‐1760.
Li, H., Handsaker, B., Wysoker, A., Fennell, T., Ruan, J., Homer, N., Marth, G., Abecasis,
G., Durbin, R., Subgroup, G.P.D.P., 2009. The Sequence Alignment/Map (SAM) format
and SAMtools. Bioinformatics.
Lindgreen, S., 2012. AdapterRemoval: easy cleaning of next-‐generation sequencing
reads. BMC Research Notes 5, 337.
MacFadden, B.J., 1992. Fossil Horses: Systematics, Paleobiology, and Evolution of the
Family Equidae. Cambridge University Press, Cambridge, UK.
MacFadden, B.J., 2013. Dispersal of Pleistocene Equus (Family Equidae) into South
America and calibration of GABI 3 based on evidence from Tarija, Bolivia. PLoS ONE
8, e59277.
Meredith, R.W., Janecka, J.E., Gatesy, J., Ryder, O.A., Fisher, C.A., Teeling, E.C., Goodbla,
A., Eizirik, E., Simao, T.L.L., Stadler, T., Rabosky, D.L., Honeycutt, R.L., Flynn, J.J.,
Ingram, C.M., Steiner, C., Williams, T.L., Robinson, T.J., Burk-‐Herrick, A., Westerman,
M., Ayoub, N.A., Springer, M.S., Murphy, W.J., 2011. Impacts of the Cretaceous
terrestrial revolution and KPg extinction on mammal diversification. Science 334,
521-‐524.
Meyer, M., Kircher, M., 2010. Illumina sequencing library preparation for highly
multiplexed target capture and sequencing. Cold Spring Harbor Protocols 2010.
Mitchell, K.J., Llamas, B., Soubrier, J., Rawlence, N.J., Worthy, T.H., Wood, J., Lee, M.S.Y.,
Cooper, A., 2014a. Ancient DNA reveals elephant birds and kiwi are sister taxa and
clarifies ratite bird evolution. Science 344, 898-‐900.
Mitchell, K.J., Wood, J.R., Scofield, R.P., Llamas, B., Cooper, A., 2014b. Ancient
mitochondrial genome reveals unsuspected taxonomic affinity of the extinct Chatham

266
duck (Pachyanas chathamica) and resolves divergence times for New Zealand and
sub-‐Antarctic brown teals. Mol Phylogenet Evol 70, 420-‐428.
Orlando, L., Male, D., Alberdi, M.T., Prado, J.L., Prieto, A., Cooper, A., Hanni, C., 2008.
Ancient DNA clarifies the evolutionary history of American late Pleistocene equids. J
Mol Evol 66, 533-‐538.
Orlando, L., Metcalf, J.L., Alberdi, M.T., Telles-‐Antunes, M., Bonjean, D., Otte, M., Martin,
F., Eisenmann, V., Mashkour, M., Morello, F., Prado, J.L., Salas-‐Gismondi, R., Shockey,
B.J., Wrinn, P.J., Vasil'ev, S.K., Ovodov, N.D., Cherry, M.I., Hopwood, B., Male, D., Austin,
J.J., Hanni, C., Cooper, A., 2009. Revising the recent evolutionary history of equids
using ancient DNA. Proc Natl Acad Sci U S A 106, 21754-‐21759.
Paijmans, J.L.A., Gilbert, M.T.P., Hofreiter, M., 2013. Mitogenomic analyses from
ancient DNA. Mol Phylogenet Evol 69, 404-‐416.
Prado, J.L., Alberdi, M.T., 1996. A cladistic analysis of the horses of the tribe Equini.
Palaeontology 39, 663-‐680.
Prothero, D.R., Schoch, R.M., 1989. Origin and evolution of the Perissodactyla:
summary and synthesis. In: Prothero, D.R., Schoch, R.M. (Eds.), The evolution of
perissodactyls. Oxford University Press, New York, New York, pp. 504-‐529.
Rohland, N., Hofreiter, M., 2007. Ancient DNA extraction from bones and teeth. Nature
Protocols 2, 1756-‐1762.
Rose, K.D., 2006. The beginning of the age of mammals. The John Hopkins University
Press, Baltimore, Maryland.
Simpson, G.G., 1948. The beginning of the Age of Mammals in South America. Part 1.
Introduction. Systematics: Marsupialia, Edentata, Condylarthra, Litopterna and
Notioprogonia. Bull Am Mus Nat Hist 91, 1-‐232.
Simpson, G.G., 1980. Splendid isolation: the curious history of the South American
mammals. Yale University Press, New Haven, Connecticut.
Stamatakis, A., Hoover, P., Rougemont, J., 2008. A rapid bootstrap algorithm for the
RAxML web servers. Syst Biol 57, 758-‐771.
Stehli, F.G., Webb, S.D., 1985. The great American biotic interchange. Topics in
geobiology. Plenum Press, New York.

267
Vilstrup, J.T., Seguin-‐Orlando, A., Stiller, M., Ginolhac, A., Raghavan, M., Nielsen, S.C.A.,
Weinstock, J., Froese, D., Vasiliev, S.K., Ovodov, N.D., Clary, J., Helgen, K.M., Fleischer,
R.C., Cooper, A., Shapiro, B., Orlando, L., 2013. Mitochondrial phylogenomics of
modern and ancient Equids. PLoS ONE 8, e55950.
Weinstock, J., Shapiro, B., Prieto, A., Marín, J.C., González, B.A., Gilbert, M.T.P.,
Willerslev, E., 2009. The Late Pleistocene distribution of vicuñas (Vicugna vicugna)
and the “extinction” of the gracile llama (“Lama gracilis”): new molecular data. Quat
Sci Rev 28, 1369-‐1373.
Weinstock, J., Willerslev, E., Sher, A., Tong, W., Ho, S.Y.W., Rubenstein, D., Storer, J.,
Burns, J., Martin, L., Bravi, C., Prieto, A., Froese, D., Scott, E., Xulong, L., Cooper, A.,
2005. Evolution, systematics, and phylogeography of Pleistocene horses in the New
World: a molecular perspective. PLoS Biol 3, e241.
Winans, M.C., 1989. A quantitative study of the North American fossil species of the
genus Equus. In: Prothero, D.R., Schoch, R.M. (Eds.), The evolution of perissodactyls.
Oxford University Press, New York, New York, pp. 262-‐297.
Woodburne, M.O., Gunnell, G.F., Stucky, R.K., 2009. Climate directly influences Eocene
mammal faunal dynamics in North America. Proceedings of the National Academy of
Sciences 106, 13399-‐13403.
Xia, X., Xie, Z., 2001. DAMBE: Data analysis in molecular biology and evolution. J Hered
92, 371-‐373.

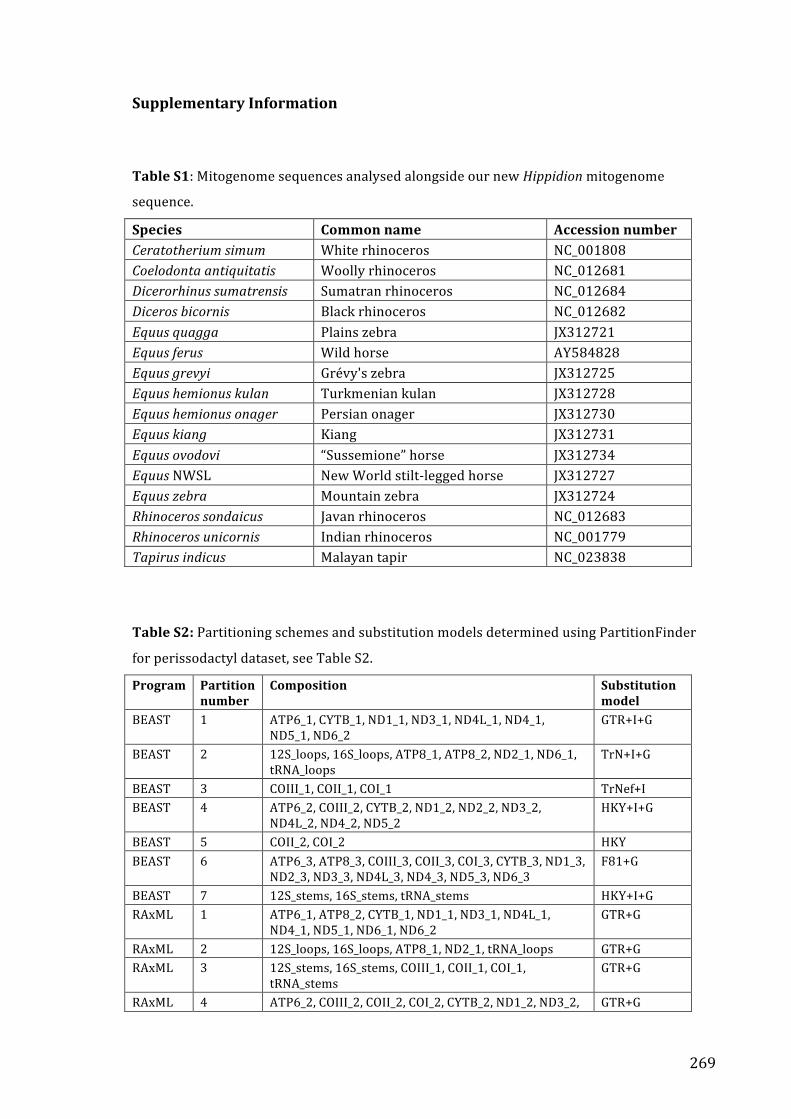
269
Supplementary Information
Table S1: Mitogenome sequences analysed alongside our new Hippidion mitogenome
sequence.
Species Common name Accession number Ceratotherium simum White rhinoceros NC_001808 Coelodonta antiquitatis Woolly rhinoceros NC_012681 Dicerorhinus sumatrensis Sumatran rhinoceros NC_012684 Diceros bicornis Black rhinoceros NC_012682 Equus quagga Plains zebra JX312721 Equus ferus Wild horse AY584828 Equus grevyi Grévy's zebra JX312725 Equus hemionus kulan Turkmenian kulan JX312728 Equus hemionus onager Persian onager JX312730 Equus kiang Kiang JX312731 Equus ovodovi “Sussemione” horse JX312734 Equus NWSL New World stilt-‐legged horse JX312727 Equus zebra Mountain zebra JX312724 Rhinoceros sondaicus Javan rhinoceros NC_012683 Rhinoceros unicornis Indian rhinoceros NC_001779 Tapirus indicus Malayan tapir NC_023838
Table S2: Partitioning schemes and substitution models determined using PartitionFinder
for perissodactyl dataset, see Table S2.
Program Partition number
Composition Substitution model
BEAST 1 ATP6_1, CYTB_1, ND1_1, ND3_1, ND4L_1, ND4_1, ND5_1, ND6_2
GTR+I+G
BEAST 2 12S_loops, 16S_loops, ATP8_1, ATP8_2, ND2_1, ND6_1, tRNA_loops
TrN+I+G
BEAST 3 COIII_1, COII_1, COI_1 TrNef+I BEAST 4 ATP6_2, COIII_2, CYTB_2, ND1_2, ND2_2, ND3_2,
ND4L_2, ND4_2, ND5_2 HKY+I+G
BEAST 5 COII_2, COI_2 HKY BEAST 6 ATP6_3, ATP8_3, COIII_3, COII_3, COI_3, CYTB_3, ND1_3,
ND2_3, ND3_3, ND4L_3, ND4_3, ND5_3, ND6_3 F81+G
BEAST 7 12S_stems, 16S_stems, tRNA_stems HKY+I+G RAxML 1 ATP6_1, ATP8_2, CYTB_1, ND1_1, ND3_1, ND4L_1,
ND4_1, ND5_1, ND6_1, ND6_2 GTR+G
RAxML 2 12S_loops, 16S_loops, ATP8_1, ND2_1, tRNA_loops GTR+G RAxML 3 12S_stems, 16S_stems, COIII_1, COII_1, COI_1,
tRNA_stems GTR+G
RAxML 4 ATP6_2, COIII_2, COII_2, COI_2, CYTB_2, ND1_2, ND3_2, GTR+G

270
ND4L_2 RAxML 5 ND2_2, ND4_2, ND5_2 GTR+G RAxML 6 ATP6_3, ATP8_3, COIII_3, COII_3, COI_3, CYTB_3, ND1_3,
ND2_3, ND3_3, ND4L_3, ND4_3, ND5_3, ND6_3 GTR+G
Table S3: Sample used in Hippidion network analysis.
Haplotype Species Accession numbers Original publication 1 Equus ferus AY584828 -‐ 2 Hippidion sp. -‐ This study 3 Hippidion devillei GQ324599 (Orlando et al., 2009) 4 Hippidion devillei GQ324601 (Orlando et al., 2009) 5 Hippidion devillei GQ324598 (Orlando et al., 2009) 6 Hippidion devillei GQ324600 (Orlando et al., 2009) 7 Hippidion principale DQ007562 (Weinstock et al., 2005) 8 Hippidion saldiasi GQ324593, GQ324594,
GQ324595 (Orlando et al., 2009)
9 Hippidion saldiasi DQ007563, DQ007564, GQ324597
(Orlando et al., 2009; Weinstock et al., 2005)
10 Hippidion saldiasi DQ007566 (Weinstock et al., 2005) 11 Hippidion saldiasi DQ007560 (Weinstock et al., 2005) 12 Hippidion saldiasi GQ324596 (Orlando et al., 2009) 13 Hippidion saldiasi DQ007561 (Weinstock et al., 2005) 14 Hippidion saldiasi EU030679 (Orlando et al., 2008)
Table S4: Mitochondrial sequences analysed alongside our new Glyptodon mitogenome
sequence.
Species Common name Locus Accession number Bradypus torquatus Maned sloth 12S
16S COI CytB
EF405918 EU301715 HM352900 HM352908
Bradypus tridactylus Pale-‐throated sloth Mitogenome AY960979 Bradypus variegatus Brown-‐throated sloth 12S
16S ND1 CytB
EF405916 Z48938 AB011218 AF232013
Cabassous unicinctus Southern naked-‐tailed armadillo
12S 16S ND1 COI CytB
AJ278151 JQ627261 AB011217 JQ627360 AF232016
Calyptophractus retusus Greater fairy armadillo 12S ND1
FR821713 FR821711
Chaetophractus villosus Big hairy armadillo 12S 16S ND1
AY012096 AF069534 AJ505835
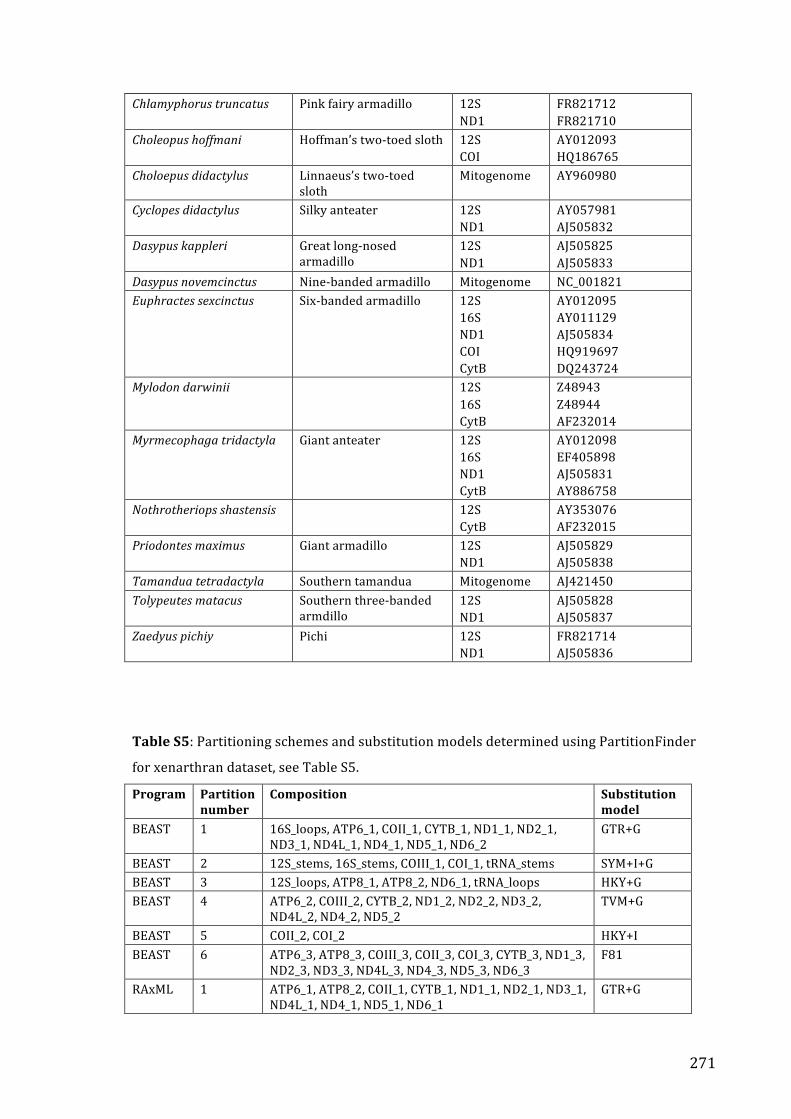
271
Chlamyphorus truncatus Pink fairy armadillo 12S ND1
FR821712 FR821710
Choleopus hoffmani Hoffman’s two-‐toed sloth 12S COI
AY012093 HQ186765
Choloepus didactylus Linnaeus’s two-‐toed sloth
Mitogenome AY960980
Cyclopes didactylus Silky anteater 12S ND1
AY057981 AJ505832
Dasypus kappleri Great long-‐nosed armadillo
12S ND1
AJ505825 AJ505833
Dasypus novemcinctus Nine-‐banded armadillo Mitogenome NC_001821 Euphractes sexcinctus Six-‐banded armadillo 12S
16S ND1 COI CytB
AY012095 AY011129 AJ505834 HQ919697 DQ243724
Mylodon darwinii 12S 16S CytB
Z48943 Z48944 AF232014
Myrmecophaga tridactyla Giant anteater 12S 16S ND1 CytB
AY012098 EF405898 AJ505831 AY886758
Nothrotheriops shastensis 12S CytB
AY353076 AF232015
Priodontes maximus Giant armadillo 12S ND1
AJ505829 AJ505838
Tamandua tetradactyla Southern tamandua Mitogenome AJ421450 Tolypeutes matacus Southern three-‐banded
armdillo 12S ND1
AJ505828 AJ505837
Zaedyus pichiy Pichi 12S ND1
FR821714 AJ505836
Table S5: Partitioning schemes and substitution models determined using PartitionFinder
for xenarthran dataset, see Table S5.
Program Partition number
Composition Substitution model
BEAST 1 16S_loops, ATP6_1, COII_1, CYTB_1, ND1_1, ND2_1, ND3_1, ND4L_1, ND4_1, ND5_1, ND6_2
GTR+G
BEAST 2 12S_stems, 16S_stems, COIII_1, COI_1, tRNA_stems SYM+I+G BEAST 3 12S_loops, ATP8_1, ATP8_2, ND6_1, tRNA_loops HKY+G BEAST 4 ATP6_2, COIII_2, CYTB_2, ND1_2, ND2_2, ND3_2,
ND4L_2, ND4_2, ND5_2 TVM+G
BEAST 5 COII_2, COI_2 HKY+I BEAST 6 ATP6_3, ATP8_3, COIII_3, COII_3, COI_3, CYTB_3, ND1_3,
ND2_3, ND3_3, ND4L_3, ND4_3, ND5_3, ND6_3 F81
RAxML 1 ATP6_1, ATP8_2, COII_1, CYTB_1, ND1_1, ND2_1, ND3_1, ND4L_1, ND4_1, ND5_1, ND6_1
GTR+G

272
RAxML 2 12S_stems, 16S_stems, COIII_1, COI_1, tRNA_stems GTR+G RAxML 3 12S_loops, 16S_loops, ATP8_1, ND6_2, tRNA_loops GTR+G RAxML 4 ATP6_2, COIII_2, CYTB_2, ND1_2, ND2_2, ND3_2,
ND4L_2, ND4_2, ND5_2 GTR+G
RAxML 5 COII_2, COI_2 GTR+G RAxML 6 ATP6_3, ATP8_3, COIII_3, COII_3, COI_3, CYTB_3, ND1_3,
ND2_3, ND3_3, ND4L_3, ND4_3, ND5_3, ND6_3 GTR+G

273
CHAPTER 8:
General discussion and concluding remarks
CHAPTER 8: General discussion and concluding remarks


275
CHAPTER 8: General discussion and concluding remarks
Summary, synthesis and significance
Molecular phylogenies are an invaluable tool for biogeographical hypothesis testing
(Avise 2000; Crisp, et al. 2011), allowing the relationships among taxa to be
confidently inferred and the timescale of their evolution to be estimated. However,
many biogeographic hypotheses have not been extensively evaluated in a
phylogenetic context due to difficulties associated with obtaining sufficient nucleotide
sequence data to construct an adequately resolved phylogeny. Previously, major
obstacles included the sizeable amount of labour and expense involved in generating
large quantities of sequence data, and (in cases where key species are extinct)
challenges associated with isolating and sequencing DNA from sub-‐fossil remains.
However, the recent advent of high-‐throughput sequencing has revolutionised the
collection of nucleotide sequence data, greatly decreasing the costs associated with
generating large datasets (van Dijk, et al. 2014). Further, combining high-‐throughput
sequencing with targeted capture procedures such as hybridisation enrichment can
allow sequence data to be obtained even from highly degraded remains of recently
extinct species (Knapp and Hofreiter 2010). The primary aim of the work presented
in this thesis was to explore the use of these new techniques for answering
longstanding biogeographic questions concerning the evolution and origin of the
southern hemisphere fauna, thereby also identifying patterns and processes that may
further increase our understanding of both evolution and taxon distributions.

276
Chapter 2 comprised a comprehensive reconstruction of the evolution of
modern marsupials. I used a combination of sequencing strategies, focusing mainly
on long-‐range PCR followed by high-‐throughput sequencing, to obtain 69 novel
mitochondrial genomes (mitogenomes): more than tripling the number of marsupial
species for which mitogenomes were available. By combining these new data with
previously published sequences, I was able to reconstruct a well-‐resolved phylogeny
comprising 58% of extant species and 97% of extant genera. I used this phylogeny as
a framework to analyse changes in habitat preference of marsupials throughout their
evolution, and investigate the colonisation of New Guinea and Wallacea from
Australia. My results revealed a number of concerted dispersal events occurring
earlier than previously reported, suggesting land connection between Australia and a
newly emergent New Guinea during the Middle Miocene.
In Chapter 3, I aimed to test the hypothesis that vicariance was the primary
driver of the modern distribution of palaeognathous birds. This required me to
sequence ancient DNA from the extinct Madagascan elephant birds, for which the
long-‐range PCR strategy employed in Chapter 2 would be inadequate due to the poor
preservation of available elephant bird specimens. Consequently, I adapted a
hybridisation enrichment strategy to target bird mitogenome sequences. This
allowed me to generate near-‐complete mitogenomes for two elephant bird species.
Using these new data I was able to confidently resolve the phylogenetic position of
the elephant birds for the first time, revealing that completely unexpectedly their
closest living relative is the kiwi from New Zealand. This result led me to reject the
traditional hypothesis of Gondwanan vicariance as the primary determinant of
modern palaeognath distributions in favour of flighted dispersal. This finding

277
stimulated the development of a number of novel hypotheses about the timing,
drivers and fossil record of palaeognath evolution. The hybridisation enrichment
procedure presented in Chapter 3 was key in obtaining data for the remaining
chapters of this thesis (4 -‐7).
Chapter 4 involved reconstructing the evolutionary history of New Zealand’s
endemic acanthisittid wrens, in order to test the hypothesis that the entirety of
Zealandia was completely submerged during the Late Oligocene/earliest Miocene. I
demonstrated that the wrens likely began diversifying prior to this period of
submergence, strongly suggesting the persistence of land in Zealandia throughout the
Cenozoic. However, the strength of this conclusion depends partly on assumptions
made about the evolutionary timescale of evolution for birds as a whole, which
remains contentious (see Appendix).
Chapter 5 and 6 each examined the origins of a member of the extinct endemic
avifauna from the Chatham Islands archipelago: the Chatham Island duck (Anas
chathamica, sensu Chapter 5) and the Chatham Islands parrot (Nestor chathamensis,
sensu Chapter 6), respectively. I demonstrated that the closest living relative of each
species resides in the New Zealand region and that the divergence of each lineage
closely follows the emergence of the Chatham Islands. These results presumably
reflect allopatric speciation after dispersal from mainland New Zealand to the
Chatham Islands archipelago.
In Chapter 7, I retrieved the first ancient DNA from a glyptodontid – a giant
extinct relative of extant armadillos – and confirmed previous palaeontological
(morphological) hypotheses that glyptodontids are more closely related to extant

278
euphractine armadillos (e.g. the six-‐banded armadillos) than to dasypodines (e.g. the
nine-‐banded and long-‐nosed armadillos). This allowed me to use glyptodontid fossils
to recalibrate the evolutionary timescale for Xenarthra, revealing that diversity
within Cingulata (the armadillos and their relatives) may be older than previous
estimates had suggested. Also in Chapter 7, I greatly expanded upon available
sequence data for Hippidion, an extinct endemic South American horse. Contrary to
palaeontological hypotheses, previous ancient DNA studies had suggested that
Hippidion was nested within Equus and closely related to an extinct taxon from North
America (New World stilt-‐legged horses), possibly diverging only 4 mya (temporally
close to the formation of the Isthmus of Panama). However, with new data I
demonstrated that Hippidion is in fact a distinct lineage from Equus and is likely
substantially older than 4 mya, reconciling genetic results with previous
palaeontological studies.
Ultimately, the research presented in this thesis contributes substantially to
our understanding of the evolution of several southern hemisphere bird and mammal
taxa. Clarifying the phylogenetic affinities of these taxa allowed me to test several
long-‐standing hypotheses: firstly, about the relative contributions of vicariance and
dispersal to modern faunal composition (Chapters 2, 3 and 4), and secondly about
periods of parallel faunal dispersal and allopatric speciation (Chapters 2, 3 5, 6 and
7). Overall, my results de-‐emphasise the role of vicariance in driving the divergence
between modern bird and mammal groups. Among marsupials, my estimates for the
divergence between the American and Australasian taxa (~69 mya; Chapter 2)
substantially predated the final severance of land connection between these regions
(34-‐41 mya; Lawver, et al. 2011). This result is further confirmed by fossil remains of

279
an “ameridelphian” marsupial from Australia (Beck 2012). Similarly, amongst birds I
recovered little signal for Gondwanan vicariance in acanthisittids or nestorid parrots
(Chapter 4), and in the case of ratites I found compelling evidence against a vicariant
distribution (Chapter 3). This suggests a much more dynamic early evolutionary
history of mammals and birds compared to traditional passive vicariant narratives,
and implicates competitive exclusion and extinction as major drivers of modern
faunal distributions rather than simply isolation. However, oceanic barriers clearly do
play an important role in determining the distribution of mammals, as evidenced by
biogeographic patterns resulting from the formation of the Isthmus of Panama ~3
mya (Chapter 7) and the ephemeral land connection occurring between Australia and
New Guinea/Wallacea since the Miocene (Chapter 2). In contrast, long overwater
“sweepstakes” dispersal events appear to be relatively frequent among birds: ducks
and parrots arrived on the Chatham Islands (~850 km away from New Zealand, their
nearest large landmass) soon after the archipelago’s emergence 2-‐3 mya (Chapters 5
and 6).
One of the main challenges I faced in performing the research presented in this
thesis was sequencing and assembling mitogenomic data from sub-‐fossil remains of
non-‐model organisms. The hybridisation enrichment and iterative mapping
methodology developed throughout the latter chapters of this thesis (3 -‐ 7)
represents a rapid and cost-‐effective way of generating high-‐quality sequence under
these conditions. Using a phylogenetically diverse mixture of bait molecules and
flexible incubation conditions allowed me to capture target molecules from
practically any bird or placental mammal species. Theoretically, arrays could just as
easily be designed to target other groups (e.g. marsupials or squamates) for future
280
studies. Following sequencing, iterative read mapping allowed me to assemble near-‐
complete mitochondrial genomes for organisms with no reference data (including
from closely related species) by using information from previous rounds of mapping
to gradually reduce the phylogenetic distance between the reference and the target.
This combined hybridisation enrichment and mapping strategy will remain relevant
and valuable for conducting future de novo sequencing projects on extinct species,
helping to efficiently survey the extant and extinct diversity within a species or clade
(e.g. potential cryptic diversity in acanthisittid wrens), and identifying the origin of
morphologically non-‐diagnostic sub-‐fossil remains (e.g. small bones, bone fragments).
Most of the remainder of this final chapter highlights limitations I encountered
over the course of the research undertaken for this thesis. Some of these limitations
were inherent to the particular methodology that I used. However, others represent
issues for the field of phylogenetics and biogeography more generally. Throughout, I
suggest approaches that future studies might explore to overcome these limitations.
Towards the end of this chapter I focus more on how the field of biogeography might
expand to answer new and more fundamental questions, and identify some
interesting biogeographical problems that have yet to receive due attention in the era
of high-‐throughput sequencing.
Limitations of single loci
Due to the high information content of the mitogenome, phylogenies based on
mitogenomic sequence data are generally well resolved (as illustrated throughout the

281
chapters of this thesis). This is crucial when testing a hypothesis that predicts certain
relationships amongst a group of taxa. However, in order to test these hypotheses
using mitochondrial DNA alone it must generally be assumed that the mitochondrial
phylogeny is an accurate reflection of the true species phylogeny. In reality this is not
necessarily the case: the inferred evolutionary history of a given locus may deviate
from that of the species as a whole (Maddison 1997). Two phenomena that may cause
this discordance are incomplete lineage sorting and introgressive hybridisation.
Incomplete lineage sorting may mislead phylogenetic analyses when ancestral
polymorphism at a locus persists through multiple consecutive speciation events.
However, genetic drift will eventually result in the monophyly of alleles at a locus
within a population even if polymorphism was inherited from an ancestral species
(Rosenberg 2002). Consequently, incomplete lineage sorting should largely only
mislead inference of relationships among a group of taxa that diverged within a
relatively short space of time. To illustrate, the common ancestor of all human
mitochondrial lineages occurred approximately 99 to 148 kya (Poznik, et al. 2013).
We can be quite confident that none of the mitochondrial polymorphism present in
modern humans was present in the common ancestor of chimpanzees and humans,
since independent evidence places that divergence at least 5 mya (Scally, et al. 2012).
Therefore, no matter how the mitochondrial diversity present in humans today is
sorted into hypothetical daughter species, phylogenies reconstructed from
mitochondrial DNA should always recover monophyly of the human descendants
with respect to the chimpanzee. In general, since mitochondrial diversity within a
population is rarely observed to be older than several hundred thousand years (e.g.
Hundertmark, et al. 2002; Edwards, et al. 2011; Poznik, et al. 2013; Arbeláez-‐Cortés,

282
et al. 2014; Barnett, et al. 2014), inference of relationships among taxa separated by
intervals exceeding one million years should rarely be misled by incomplete sorting
of mitochondrial lineages. Indeed, we frequently observe a high degree of congruence
between reconstructions of the branching order among higher-‐taxa based on
mitochondrial and nuclear data (e.g. Reyes, et al. 2004).
Introgressive hybridisation is increasingly being detected among closely
related species and is potentially implicated in discordance observed between
mitochondrial and nuclear gene phylogenies in a range of taxa including hominins
(Reich, et al. 2010), salamanders (Canestrelli, et al. 2014), bears (Kutschera, et al.
2014), hares (Melo-‐Ferreira, et al. 2014) and kangaroos (Phillips, et al. 2013). Among
birds, ducks are exceptional in their propensity for hybridisation (e.g. Peters, et al.
2014). This is particularly true for the mallard (Anas platyrhynchos) and its close
relatives (McCarthy 2006); mallards have been recorded hybridising with numerous
congeneric species, members of species within closely related genera (e.g. the
Muscovy duck; Cairina moschata), and even species from different anatid subfamilies
(e.g. the Canada goose; Branta canadensis). In general, introgression should only
occur when hybridisation produces fertile offspring that are not at a significant
selective disadvantage relative to non-‐hybrid individuals. The likelihood of this
occurring is expected to decrease with increasing phylogenetic distance as barriers to
reproduction emerge. Concordantly, the hybrid offspring of the mallard and its more
distant relatives are frequently sterile while progeny from phylogenetically closer
crosses are more often fertile. For example, the mallard and the Muscovy duck
(Cairina moschatus) appear to be separated by around 15 million years of
independent evolution (see Chapter 5) and, though they can reproduce, their progeny

283
are sterile. Conversely, reproduction between the pintail (Anas acuta) and the
mallard produces fertile young (Phillips 1915). The mallard and pintail apparently
shared a common ancestor five million years ago (see Chapter 5), which while closer
than the mallard and Muscovy duck is still comparable in terms of time to the
divergence between humans and chimpanzees. Consequently, hybridisation can
potentially affect reconstruction of relationships among more distantly related taxa
than can incomplete lineage sorting.
When drawing conclusions about the evolution of species based exclusively on
mitochondrial sequence data it is crucial that the potential influence of both
incomplete lineage sorting and introgressive hybridisation is evaluated. In this thesis,
the results of Chapters 6 and 7 are largely corroborated by additional evidence: the
Chatham Islands parrot shares a number of derived traits with the kaka (Nestor
meridionalis) that separate these taxa from the kea (Nestor notabilis) (see Chapter 6);
previous morphological studies have grouped glyptodontids within the extant
armadillo crown group (Billet, et al. 2011); and morphology supports the reciprocal
monophyly of Hippidion and Equus (Prado and Alberdi 1996). However, results from
the remaining chapters of this thesis (2 – 5) may have been misled by discordance
between the mitochondrial phylogeny and the true species phylogeny, to varying
degrees.
Among marsupials, at least one potential incidence of incomplete lineage
sorting of nuclear alleles has previously been observed among kangaroos and
wallabies (Phillips, et al. 2013). A potential instance of incomplete mitochondrial
lineage sorting among marsupials can be identified from the analysis of combined

284
mitochondrial and nuclear data in Chapter 2 (see Chapter 2: Figure S1). The position
of the western barred bandicoot (Perameles bougainville) is poorly supported, but it
appears to be more closely related to the short-‐nosed bandicoots (Isoodon) than the
remaining long-‐nosed bandicoots (Perameles). The bandicoot nuclear gene sequences
used in Chapter 2 have been analysed in a previous study that found strong support
for a monophyletic Perameles (Westerman, et al. 2012), suggesting that discordant
phylogenetic signal in Chapter 2 arose from the mitochondrion. While Westerman et
al. (2012) also included several mitochondrial genes in their analysis, the data were
fewer than those included in Chapter 2 (2,300 bp versus ~10,000 bp), so any
discordant mitochondrial signal might have been overwhelmed by the more
numerous nuclear data. BLAST searches corroborate the phylogenetic results,
suggesting that both the western barred bandicoot mitochondrial sequences from
Chapter 2 and Westerman et al. (2012) are closer to sequences from short-‐nosed
bandicoots (Isoodon) that to sequences from the eastern barred bandicoot (Perameles
gunnii) or the long-‐nosed bandicoot (Perameles nasuta). The short internode (~670
ky) preceding the divergence of the western barred bandicoot lineage in Chapter 2 is
consistent with incomplete sorting of mitochondrial lineages. However, it is also
possible that ancestral introgression may have resulted in the discordance observed
in the position of the western barred bandicoot. While, introgression and
hybridisation can be difficult to distinguish (Meng and Kubatko 2009; Chung and Ané
2011), introgression has been observed in several marsupial species (Eldridge and
Close 1992; Bee and Close 1993; Neaves, et al. 2010; Phillips, et al. 2013).
In Chapter 4, determining whether the acanthisittid wrens persisted in
Zealandia throughout the Late Oligocene/earliest Miocene marine transgression

285
depended on estimating the age of mitochondrial diversity within the group. For this
question, the relative order of divergence among acanthisittids was not of paramount
importance. Further, unless the common ancestor of the wrens sampled in Chapter 4
possessed considerable mitochondrial diversity, the inferred divergence time
between Lyall’s wren and the remaining sampled mitochondrial lineages is likely to
be a reasonable approximation for the true age of the crown divergence. Given the
rapid divergence between the bush wren, rifleman and stout-‐legged/rock wren
ancestor, it is possible that incomplete lineage sorting has misled the relationships
among these three lineages. While this would ultimately have a rather minor impact
on our understanding of their initial radiation, it would have implications for the
taxonomy of the group. If Xenicus (sensu Chapter 4) were not monophyletic the
preferred taxonomic reassignment would be to subsume the rock wren (Xenicus
gilviventris) into Pachyplichas, leaving the bush wren as the monotypic member of
Xenicus. However, there also remains the possibility that the close relationship
inferred between the rock wren and stout-‐legged wren in Chapter 4 is the result of
mitochondrial introgression into the ancestor of the stout-‐legged wren from an
ancestor of the rock wren. This seems unlikely to have affected the branching order
among acanthisittids, as it would require successful reproduction between two
morphologically and ecologically distinct lineages that had been separated for over
10 million years.
The main results of Chapter 5 concern a group of species whose divergences
are separated by short internodes: the most recent common ancestor of the New
Zealand/sub-‐Antarctic teals occurs only ~280 kyr after the origin of the Chatham
duck mitochondrial lineage, while the two sub-‐Antarctic teals diverge after only

286
another ~210 kyr. These rapid divergences may have led to incomplete lineage
sorting, which could have misled reconstruction of the true relationships between
these taxa. However, if only the relationships among the New Zealand/sub-‐Antarctic
teals are affected then the biogeographic conclusion of Chapter 5 remains relatively
unchanged: the Chatham duck arose from an ancestral New Zealand/sub-‐Antarctic
teal species following the emergence of the Chatham Islands archipelago. A larger
concern for Chapter 5 is the potential for mitochondrial introgression. It remains a
possibility that the Chatham duck does not in fact truly form a clade with the New
Zealand/sub-‐Antarctic teals, but instead represents a more phylogenetically distant
lineage that captured the mitochondrial genome of the ancestral New Zealand/sub-‐
Antarctic teal, or vice versa.
The results presented in Chapter 3 suggest that most of the divergences
between major palaeognath lineages were separated by several million years. Most
importantly for the main conclusion of Chapter 3, the common ancestor of the kiwi
and elephant bird occurred at least five million years after the preceding node in the
tree: the divergence between the ancestor of the kiwi and elephant bird and the
ancestor of the emu and cassowary. Consequently, it is unlikely that the kiwi or
elephant bird could have inherited polymorphism that was present in the most recent
common ancestor of the kiwi/elephant bird lineage and emu/cassowary lineage.
Multiple mitochondrial lineages would have had to persist in the kiwi/elephant bird
stem lineage for at least five million years. Some of the internodes deeper in the
palaeognath tree are shorter than the internode preceding the kiwi/elephant bird
divergence, but signal in mitochondrial and nuclear datasets for the relevant nodes
appears largely concordant (Phillips, et al. 2010; Haddrath and Baker 2012; Smith, et

287
al. 2013). The main exception to this concordance between data sources is conflict
regarding the affinity of the rheas. However, neither data source provides high
support for one position over another. Consequently, this potential discordance may
be due, not to incomplete lineage sorting, but a lack of phylogenetic signal in the loci
analysed.
Discordance arising from introgression, when it can be distinguished, may
itself provide biogeographic information in some circumstances. This is because
hybridisation can only occur where there is actual physical contact between
organisms. Consequently, while unlikely due to the genetic distance involved, if the
inferred relationship between the kiwi and elephant bird in Chapter 3 actually
resulted from ancestral mitochondrial introgression, the biogeographic conclusion
that flight was the primary mechanism of dispersal among palaeognaths would not be
greatly affected. Introgression between the kiwi and elephant bird lineage would
require contact between the two taxa. This could only occur if one or both of the
lineages could fly, as New Zealand and Madagascar have not been connected by
contiguous emergent land since the Cretaceous (Ali and Krause 2011).
Ultimately, when inferring relationships from a single locus there will always
be a risk of discordance between the locus tree and the species tree. In some cases
(e.g. Chapters 6 and 7) there may be independent support for a hypothesis that gives
us greater confidence in the mitochondrial results. However, in other cases we must
more carefully consider possible sources of error and our ability to adequately test a
hypothesis with a given dataset. Despite these limitations, mitochondrial sequences
remain valuable for both technical (e.g. high information content, minimal

288
recombination) and practical reasons (e.g. relative ease of sequencing from extinct
species, conserved structure) (Rubinoff and Holland 2005; Zink and Barrowclough
2008). The conclusions presented in this thesis represent the most parsimonious
interpretations of the results from each chapter, and at the very least will help to
direct future studies.

289
Building better datasets
While mitochondrial sequences have been the workhorse of phylogenetics for
decades, the limitations associated with phylogenetic inference from a single locus
are driving the field towards datasets comprising many nuclear loci (e.g. Hackett, et
al. 2008), or even whole genomes (e.g. Jarvis, et al. 2014). Large multi-‐locus datasets
make it much easier to detect hybridisation and incomplete lineage sorting (e.g.
Kutschera, et al. 2014). Consequently, they have much greater power for resolving
certain phylogenetic questions, especially those concerning rapid radiations. This is
obviously important for biogeographical hypothesis testing, and data from more loci
is generally always desirable. However, one of the primary advantages of
mitochondrial DNA is that it is a cost-‐effective source of data. This is especially true
for ancient DNA from highly degraded remains where the initial concentration of
endogenous DNA can be very low compared to exogenous bacterial or environmental
background DNA. In this situation the higher copy-‐number of the mitogenome
relative to the nuclear genome in a cell becomes invaluable.
Many of the chapters in this thesis focus on mitogenome sequences of extinct
species that have been assembled from a total pool of only one to two million filtered
high-‐throughput sequencing reads. The Illumina MiSeq platform – a relatively low-‐
throughput next-‐generation machine – can generate tens of millions of reads per run
(Loman, et al. 2012). This means that the sequencing cost for a single ancient
mitogenome might be <US$100 following application of the hybridisation enrichment
technique described in Chapters 3-‐7. In comparison, hundreds of millions of shotgun
sequencing reads were required to retrieve a high-‐quality nuclear genome from an

290
ancient Denisovan hominin, despite relatively good preservation (Meyer, et al. 2012).
From a more poorly preserved specimen, such as Orlando et al. (2013)’s Pleistocene
horse, billions of reads may be necessary to get just a low-‐coverage whole genome
sequence. Even using Illumina NextSeq and HiSeq 4000 platforms (higher-‐
throughput, more cost-‐effective alternatives to the MiSeq and HiSeq 2500) this depth
of sequencing represents a substantial investment of resources, with costs exceeding
several thousand dollars ($US) per sample (Liu, et al. 2012). Whole-‐genome
hybridisation enrichment techniques can reduce the depth of sequencing necessary
for highly degraded samples (Carpenter, et al. 2013; Enk, et al. 2014). However, for
the present, genome sequencing still remains an expensive proposition.
In addition to the cost of whole genome sequencing there are bioinformatic
obstacles to obtaining usable data, especially when working with non-‐model
organisms. Most of the research in this thesis focused on de novo sequencing, such
that there was no available reference genome for the target species. De novo contig
assembly of ancient DNA is a challenge due to low-‐endogenous content, nucleotide
misincorporation and short fragment length (Rizzi, et al. 2012; Staats, et al. 2013).
Consequently, many previous projects have instead identified target reads by
attempting to align all reads to a reference sequence obtained from a closely related
extant species (e.g. Green, et al. 2008; Enk, et al. 2014; Llamas, et al. 2014). However,
in many cases there is no particularly close relative, meaning that aligned reads are
largely restricted to the most conserved portions of the target region. Attempting to
circumvent this limitation by relaxing the mapping stringency causes non-‐
endogenous molecules to be incorporated into the consensus (Llamas, et al. 2014).
Consequently, a proportion of endogenous reads must usually be discarded since they

291
cannot be confidently identified, with the size of this proportion being related to the
divergence between the target and the reference. In order to address this problem, I
developed an iterative mapping procedure whereby the genetic distance between the
target and the reference is gradually decreased by incorporating information from
previous rounds of mapping, eventually leading to a complete mitogenome sequence
given sufficient sequencing depth. However, this process is likely to be much less
effective and more computationally intensive for the nuclear genome, as the
mitogenome is much more structurally conserved across distantly related taxa.
A limitation of genome-‐scale data for phylogenetics is the identification of
orthologous loci (Fitch 2000; Gabaldon and Koonin 2013). Genes may be related to
each other in two ways: orthology and paralogy (Fitch 1970). Orthologous genes are
found in the genomes of different species and descended by speciation from a single
gene in the genome of an ancestral species. Consequently, barring the effects of
incomplete lineage sorting or introgression, a phylogeny reconstructed based an
orthologous gene should reflect the phylogeny of the species. Conversely, paralogous
genes result not from speciation, but from a duplication event in the genome of a
single species. Paralogous gene sequences can therefore potentially mislead inference
of the species phylogeny if the duplication event that created them occurred prior to
the species divergences being inferred. While methods for detecting paralogous genes
have been devised (e.g. Remm, et al. 2001; Wall, et al. 2003; Chen, et al. 2007),
orthology of many remaining genes often cannot be confirmed and they must
therefore be excluded from phylogenetic analyses. For example, in a recent
phylogenomic study of birds, orthology could be confirmed for less than half of all
protein-‐coding genes (Jarvis, et al. 2014). The necessity of discarding data in this

292
manner further reduces the cost-‐effectiveness of genome sequencing, both for extant
and extinct taxa.
Currently, the most cost-‐effective approach to creating large nucleotide
sequence datasets for phylogenetic inference would be to create a hybridisation
enrichment array specifically targeting only known orthologous loci. Many
orthologous nuclear exons have now been identified for birds and mammals
(Douzery, et al. 2014; Jarvis, et al. 2014). An alternative to exons is non-‐coding
ultraconserved elements (UCEs), for which orthologs have also been identified across
a broad range of taxa (Dimitrieva and Bucher 2013). However, one problem with the
UCE enrichment approach is that it relies on captured molecules overlapping a
phylogenetically informative flanking region (Crawford, et al. 2012; McCormack, et al.
2012). This is unlikely to be efficient for ancient DNA where the average fragment
length is often very short (< 100 bp). Exons may be preferable to UCEs in any case, as
they may also carry some functional genotypic information that could be desirable in
addition to the phylogenetic information. Whatever class of marker is chosen, a
hybridisation enrichment array could be designed based on previously identified
orthologs to target the number of loci and information content necessary to
confidently resolve relationships among the taxa of interest (Capella-‐Gutierrez, et al.
2014). For example, more loci will be necessary when the possibility of incomplete
lineage sorting or introgression is high, and either more loci or faster evolving loci
will be necessary when the hypothesis concerns events in the relatively recent past.
As enrichment methods and bioinformatic tools become more advanced,
genome-‐scale data from both extinct and extant taxa will become more viable for

293
phylogenetic inference. Currently however, sequencing whole genomes is a highly
uneconomical approach to answering phylogenetic and biogeographic questions
concerning extinct taxa. The most cost-‐effective strategy will be to use hybridisation
enrichment to target an informative subset of the genome. The phylogenetically
broad hybridisation array used in Chapters 3 – 7 could potentially be adapted to
target a limited number of nuclear loci from species for which there is no reference
data. By circumventing the limitations of single-‐locus phylogenetic inference we
should be able to more accurately reconstruct the relationships among species, and
therefore have greater confidence in biogeographic conclusions based on our results.

294
Inferring accurate evolutionary timescales
Thus far in this chapter I have identified potential pitfalls with using mitochondrial
data to infer the relationships among species, and described how datasets may be
improved in the future to mitigate this by including more characters and multiple
loci. However, larger and more robust datasets may still result in incorrect
reconstructions of evolutionary history if the models employed in their analysis are
misspecified, which may occur when assumptions about the processes underlying the
data are a poor reflection of reality. One area where model choice may have a major
impact on the final results is molecular dating analyses. The research presented in
this thesis highlights three interrelated factors that may substantially affect the
estimation of divergence dates: model of molecular rate variation (Appendix), taxon
sampling (Chapters 3, 7), and calibration choice (Chapters 3, 4, 5, 7; Appendix).
Regardless of the size of the dataset, results and conclusions will be unreliable if these
factors are incorrectly specified (e.g. Warnock, et al. 2012). This issue is non-‐trivial, as
testing many biogeographical hypotheses requires an accurate estimate of the
timescale of evolution in order to compare divergence times with the timing of
geological or ecological events (e.g. Chapters 2, 4, 5, 6 and 7).
In the Appendix to this thesis, I demonstrated how a single modelling choice
could substantially affect age estimates even when using a genome-‐scale dataset. A
recent study of bird evolution included a molecular dating analysis of 1,156 “clock-‐
like” orthologous nuclear loci (Jarvis, et al. 2014). This dataset was analysed using an
autocorrelated rates relaxed clock model, which assumes that the rate along each
branch is correlated with the rate of the preceding branch. Consequently, large

295
branch-‐wise rate changes are penalised. This can be justified when much of the
variation in rate is determined by morphological or life-‐history traits, and these traits
are largely conserved between parent and daughter lineages (Ho 2009). However,
alternative models exist which do not make this assumption: under an uncorrelated
model, the rate along a branch is drawn from a distribution that represents the rates
across the phylogeny as a whole. When I reanalysed Jarvis et al. (2014)’s dataset
using an uncorrelated model, mean node ages in many cases varied by over five
million years (often exceeding 10% of total node depth) from ages estimated under a
correlated model. Differences in dates of this magnitude can have a large effect on
biogeographic conclusions (Chapter 4, Appendix). However, assumptions about the
degree of rate correlation are not the only modelling choice that can affect age
estimates.
A general assumption of molecular dating analyses is that date estimation is
robust to taxon sampling. For example, the age of the common ancestor of humans
and chimpanzees inferred from a large phylogeny of mammals should ideally be
consistent whether or not sequence data from the mouse (Mus musculus) happens to
also be included in the dataset. This assumption is vital as it is rarely possible to
obtain sequence data from all taxa within a clade, especially for older groups that
contain many extinct species beyond the typical limits of ancient DNA preservation
(i.e. > 1 My). However, there is evidence that taxon sampling does in fact affect node
age estimation (e.g. Linder, et al. 2005; Schulte 2013). In Chapter 3, I demonstrated
that taxon sampling has a substantial impact on the inference of divergence dates
among palaeognathous birds when using an uncorrelated relaxed clock model. When
tinamous were included in the dataset, estimated divergence times amongst the

296
major palaeognath lineages became older (Chapter 3: Figure 2). Tinamous have
previously been identified as having an exceptionally high molecular rate relative to
other palaeognaths, suggesting that the different node age estimates in Chapter 3
resulted from inadequate modelling of rate heterogeneity. Indeed, Dornburg et al.
(2012) demonstrated that using an uncorrelated relaxed clock can mislead rate
estimation when there is a punctuated rate shift in one sub-‐clade, leading to
underestimates of the molecular rate in more quickly evolving groups. This is
consistent with the pattern observed in Chapter 3: an underestimated rate amongst
tinamous would lead to overestimated branch lengths, in turn leading to
overestimation of node ages immediately preceding the origin of tinamous.
A different class of clock model, the random local clock (Drummond and
Suchard 2010), may provide a solution to some modelling problems caused by rate
heterogeneity. The random local clock fits a number of strict (constant-‐rate) clock
models to sub-‐clades on a phylogeny by placing discrete rate transitions at the stem
of certain clades, with the number and timing of transitions co-‐estimated with the
rates (rather than being fixed a priori). For phylogenies where clade-‐specific rate
changes are expected this model has been shown to outperform uncorrelated relaxed
clock models (e.g. Dornburg, et al. 2012; Crisp, et al. 2014). However, Chapter 3
suggests that the assumptions of the random local clock model will be violated by the
true distribution of rate variation among palaeognaths. In Chapter 3, I conclude that
each of the six recent flightless palaeognath lineages evolved independently from a
flighted ancestor, which may have been similar to modern tinamous (or the extinct
Palaeocene/Eocene lithornithids) in many respects. Since evolutionary rate
correlates with many life history traits (e.g. Gillooly, et al. 2005; Lanfear, et al. 2007),

297
the ancestors of flightless palaeognaths may have shared the same high molecular
rate as tinamous. Consequently, it is likely that the difference in rates between the
tinamous and the other palaeognaths is not due to punctuated molecular rate
acceleration along the branch leading to tinamous but a convergent rate decrease
along the branches leading to each modern ratite lineage. This distinction is
important as it suggests that the internodes separating the major flightless groups
should have a relatively high rate, and even the long stem branches leading to each
modern crown group (along which the loss of flight presumably occurred) should
have a somewhat higher rate than branches within the crown group. Current clock
models cannot fully accommodate such extreme patterns of rate heterogeneity
(Kitazoe, et al. 2007; Waddell 2008; Steiper and Seiffert 2012), although
incorporating a priori information about the distribution of rate variation can in some
cases compensate for this (Yoder and Yang 2000; Worobey, et al. 2014).
It is clear that misspecification of the clock model can have a large effect on
inferred evolutionary timescales, and therefore affect conclusions about evolution
and biogeography (Chapters 3 and 4; Appendix). Consequently, methods have been
devised that attempt to select the most appropriate clock model by comparing the fit
of different models to the inferred pattern of rate variation in the data (e.g. Lartillot
and Philippe 2006; Baele, et al. 2012). However, these methods have several
limitations. Firstly, model comparison methods can only determine the relative fit of
models, meaning that even the best fitting candidate model may still be suboptimal
(Duchêne, et al. 2014). Secondly, the inferred pattern of rate variation may vary
depending on how the phylogeny is calibrated, which means different models may be
preferred under different calibration schemes (Duchêne, et al. 2014). In practice

298
there are usually many plausible calibration schemes for a given dataset, potentially
making it difficult to objectively determine the most appropriate clock model.
A common practice in phylogenetic studies is to employ node age constraints
as calibrations (Benton and Donoghue 2007; Donoghue and Benton 2007; Ho 2007),
which is also the approach I have used in this thesis. In a Bayesian framework node
constraints are implemented as prior probability distributions, and it is subjectivity
in the parameterisation of these distributions that largely contributes to uncertainty
regarding the optimal calibration scheme for a given dataset. The minimum bound for
the age of a node is generally set according to the oldest fossil occurrence of the clade
defined by that node. Conversely, maximum bounds are exceedingly challenging to
determine objectively as absence of a taxon is difficult to infer from the fossil record.
Common approximations involve setting the maximum bound at the age of a
preceding fossil-‐bearing layer from which the clade of interest is absent
(stratigraphic bounding; Benton and Donoghue 2007), or in which the sister-‐taxon to
the clade of interest is first observed (phylogenetic bracketing; Reisz and Müller
2004; Müller and Reisz 2005). However, there is considerable room for uncertainty
and disagreement in these approaches to ascertaining maxima: misidentification,
taphonomic bias or insufficient sampling may result in a false inference of absence. As
a consequence, basing conclusions on results that are heavily dependent on choice of
maximum age constraint is hazardous (see Appendix).
A further consideration for node constraints is the distribution of probability
between the minimum and maximum bounds. Two commonly used distributions are
uniform and lognormal. A uniform distribution assumes that the true node age is
299
equally likely to occur at any time between the minimum and the maximum bound.
This is biologically unrealistic given what we know about the fossil record (Ho 2007).
The fossil taxon used to set the minimum bound is unlikely to be the common
ancestor of the clade and will as such have a ‘ghost lineage’ of unknown length
connecting it to the true common ancestor. For example, the earliest known ostrich is
Struthio coppensi from the early Miocene (Mourer-‐Chauviré, et al. 1996). However,
other evidence suggests that the origin of the ostrich lineage likely occurred no later
than the Eocene (see Chapter 3), meaning that there is at least 20-‐30 My separating
the origin of ostriches and their first fossil appearance. As a consequence of ghost
lineages, in most cases we expect a relatively low probability of the true node age
immediately preceding the minimum bound. Similarly, we should also expect a
relatively low probability of the node occurring during the period immediately
following the maximum bound, assuming that the maximum bound has been set
conservatively. As opposed to the uniform distribution, the lognormal distribution
allows a low probability to be specified preceding the minimum bound and following
the maximum bound of the prior distribution, and is perhaps more realistic as a
result (Ho 2007). However, this comes at the cost of increased subjectivity, as
appropriate values for the mean and variance of the lognormal distribution cannot be
objectively determined. Selection of these values is non-‐trivial, as it can have large
effects on the final age estimates (e.g. Warnock, et al. 2012).
As highlighted by the research in this thesis, and as discussed above, molecular
dating is fraught with assumptions and choices that may have a large effect on
inferred rates and dates. Consequently, in many cases the most rigorous approach to
testing hypotheses concerning evolutionary timescales will be to explore the range of

300
biologically plausible scenarios rather than selecting a single set of assumptions. This
may involve including/excluding potentially problematic taxa (e.g. Chapter 3), trying
a number of different clock models (e.g. Appendix), or investigating the effect of node
age constraint choice both in terms of number and distribution (e.g. Chapter 4,
Appendix). Results that rely on a specific set of assumptions should be regarded
sceptically if the justification for preferring that set of assumptions over an
alternative is unconvincing. Unfortunately, this may mean that certain problems (e.g.
dating of basal palaeognath divergences relative to the KPg boundary) are currently
intractable using established methods. To make further progress towards answering
these evolutionary and biogeographical questions we will require more realistic and
biologically relevant models of rate variation, and more precise and objective
methods of calibrating these models. This is currently an active area of research, and
new approaches are being explored that will hopefully allow more accurate
estimation of absolute branch lengths and node ages (Ho 2014).
One approach to creating more realistic models of rate variation may be to
directly incorporate information from biological correlates (Ho 2014). By measuring
the covariation between molecular rates and phenotypic or life history traits (see
Lanfear, et al. 2010; Lartillot and Poujol 2011) we may be able to predict molecular
rates for ancestral taxa, and consequently better infer rate changes through time. For
example, Steiper and Seiffert (2012) identified three continuous morphological
variables that were correlated with molecular rates in extant primates: body size,
absolute endocranial volume, and relative endocranial volume. They measured each
variable in a number of extinct primates and used these data to help reconstruct the
ancestral values for the three variables at each node in the primate phylogeny. Since

301
the correlation between the value of these variables and the molecular rate had been
characterised, branch-‐wise rate estimates could be “corrected” according to the
morphology. Steiper and Seiffert (2012)’s corrected node age estimates were younger
than estimates from previous molecular dating analyses and more consistent with
some interpretations of the primate fossil record. While the use of biological
correlates to adjust rates of molecular evolution requires further testing on both
empirical and simulated datasets, it is an attractive avenue of investigation for a
number of problems. However, models of this type as currently implemented must
still derive absolute temporal information from the fossil record, and therefore
largely remain subject to many of the disadvantages of node age constraints.
An alternative to using node constraints for molecular dating is to use
temporally spaced DNA sequences to calibrate phylogenies (Rambaut 2000;
Drummond, et al. 2002; Drummond, et al. 2003). For example, DNA sequences
extracted from both ancient remains and modern tissue samples have been used to
reconstruct the evolutionary timescale of a range of vertebrates (e.g. Austin, et al.
2013; Sheng, et al. 2014). Similarly, serial samples from a rapidly evolving viral
population can be used to reconstruct the timing and speed of virus outbreaks (e.g.
Rambaut, et al. 2008; Firth, et al. 2009). Molecular rates can be inferred by comparing
the relative genetic change that has occurred since a common ancestor in lineages
sampled at different times. One of the advantages of this “tip-‐dating” calibration
method is that the age of the tips can be determined empirically (e.g. radiocarbon
dating) and with high precision, eliminating much of the uncertainty associated with
node constraints.

302
While tip-‐dating is useful for inferring intraspecific phylogenies and
demography over timescales of tens to hundreds of thousands of years it is not viable
for dating interspecific divergences, which often occur much longer timeframes. This
is because: i) evolutionary rates can only be accurately estimated with temporally
spaced data when the amount of change occurring during the period between
samples represents a substantial fraction of the total change occurring since the
common ancestor of the two sampled lineages (Drummond, et al. 2003), and ii)
except under exceptional conditions, ancient DNA can only reliably be obtained from
specimens up to around one hundred thousand years in age. Thus, a hypothetical
modern human DNA sequence and 10 kyr old human DNA sequence might be used to
estimate the age of their common ancestor that occurred 30 kya. However, a modern
human sequence and a 100 kyr old brown bear (Ursus arctos) sequence cannot be
used to estimate the age of the common ancestor of humans and bears, which likely
occurred over 50 mya (Meredith, et al. 2011). This is because the amount of change
occurring in the 100 kyr sampling interval will be insufficient relative to the total
amount of change occurring during the millions of years since the common ancestor
of the two lineages, and will likely be overwhelmed by lineage-‐specific rate variation.
The short temporal preservation window of aDNA does not apply to
morphological characters sampled from palaeontological specimens, and researchers
are beginning to experiment with using temporally spaced fossils to calibrate a
“morphological clock” (e.g. Ronquist, et al. 2012; Beck and Lee 2014; Lee, et al. 2014;
Arcila, et al. 2015). The rate of evolution of morphological characters may be
modelled using a generalised relaxed clock, such that fossils can be used to calibrate a
phylogeny in a manner analogous to temporally spaced DNA sequences. Depending

303
on the fossils available for a given group this approach may allow calibration of
timescales spanning hundreds of millions of years, making morphological clocks
practical for studies of interspecies phylogenetics and biogeography. “Total evidence”
dating involves combining this morphological clock with nucleotide sequence data in
a single phylogenetic analysis (Ronquist, et al. 2012): sequence data allows accurate
estimation of branching order and relative branch lengths, while morphological data
contribute both additional phylogenetic signal and absolute temporal information.
Incorporating fossils directly into the analysis in this way has several advantages over
using them simply to define node age constraints. Firstly, the length of ghost lineages
is estimated from the data rather than being subjectively parameterised. Secondly, all
fossil taxa assignable to a clade can be used to contribute temporal information, not
only the oldest putative member. Thirdly, temporal information can be derived from
fossils that cannot be confidently assigned to a specific clade, as Bayesian approaches
accommodate phylogenetic uncertainty by integrating over all sampled tree
topologies. A final advantage of including fossil taxa in a time-‐calibrated phylogenetic
framework is that it allows the distribution of these extinct species to be explicitly
incorporated in biogeographical reconstructions.
A total evidence dating approach could be useful for future research into some
of the questions I have considered in this thesis. For example, it could help to estimate
the evolutionary timescale of palaeognaths. One of the major problems with dating
the diversification of palaeognaths is that known palaeognath fossils are poorly
suited to serving as node age constraints: they are either too recent to serve as
informative minimum bounds (e.g. Struthio coppensi, Proapteryx micromeros and
Emuarius gidju) or are older but of uncertain affinity (e.g. Diogenornis, Palaeotis) (see

304
Chapter 3). Total evidence dating theoretically circumvents these limitations,
although additional morphological characters would first need to be scored for these
extinct taxa (most notably autapomorphies, see below). Total evidence dating could
also be extended to date the evolution of all birds, as their temporal origin remains
contentious (Appendix). A previous study has employed a morphological clock for
birds, but focused mainly on the evolution of non-‐neornithine birds during the
Mesozoic and did not include nucleotide sequence data (Lee, et al. 2014). Greater
sampling of morphological characters from more recent fossil taxa (e.g. Kuiornis
indicator, Chapter 4, Worthy, et al. 2010; Nelepsittacus, Chapter 6, Worthy, et al.
2011b) combined with expanded molecular datasets (e.g. Jarvis, et al. 2014) may help
to resolve the timescale of diversification for modern birds. Similarly, total evidence
dating has been applied to the evolution of mammals, but mainly to investigate
diversification over a relatively deep timescale (Beck and Lee 2014). Total evidence
dating could be extended to focus on dating more recent diversification of specific
mammal groups for which reasonably complete fossil records are available (e.g.
perissodactyls).
While total evidence dating provides several advantages over traditional node
age constraint based molecular dating, there are several limitations to the
morphological clock that will need to be addressed moving forwards (see Beck and
Lee 2014; Lee, et al. 2014). Firstly, morphological data is likely to be susceptible to
the same problems with model misspecification as nucleotide sequence data: that is,
accurately modelling the distribution of rate heterogeneity across the phylogeny. In
addition, it is uncertain to what extent it is appropriate to apply a single clock model
to morphological characters, which likely have highly heterogeneous evolutionary

305
dynamics. Other complications include difficulties with sampling a sufficient number
of characters from fossils that are only fragmentary (although total-‐evidence dating
appears to be relatively robust to missing data) (Ronquist, et al. 2012) and accurately
estimating terminal branch lengths in the absence of autapomorphies (changes
unique to a single taxon, often overlooked by morphological systematists as these
character changes are parsimony-‐uninformative). A final problem is the possibility
that morphology does not evolve according to a stochastic clock over timescales
relevant to the questions we wish it to answer: for example, adaptive radiations may
result in a discrete period of accelerated morphological evolution across a clade,
which could cause overestimated divergence dates to be inferred (Lee, et al. 2013;
Beck and Lee 2014; Lee, et al. 2014). However, this latter problem may also affect
estimates of molecular rates, and models have been developed to further explore this
possibility (Bielejec, et al. 2014).
Given the uncertainties involved in estimating evolutionary timescales, it is
currently difficult to precisely date divergences among members of many bird and
mammal groups. This can be a problem for biogeographic hypotheses that partially
depend on correlating the timing of divergences with other geological or evolutionary
events. New methods such as total evidence dating may in the future offer more
precise estimates. However, for now these methods still require refinement. In the
meantime, best practice for dating analyses is to explore the full range of plausible
biological scenarios, and report assumptions that have a large effect on the final
results. If conclusions rely heavily on a given set of assumptions, preference for these
assumptions must be justified.

306
Future directions
While there are still problems to be overcome in terms of building informative
phylogenetic datasets and devising realistic evolutionary models, recent advances in
both sequencing technology and analytical methods have greatly expanded the range
of hypotheses that may be tested. In Chapter 2, I exploit these advances to reconstruct
the biogeographic and evolutionary history of living marsupials. One of the most
powerful aspects of the dataset in Chapter 2 is its broad taxon sampling, which
encompasses multiple clades that have dispersed from Australia to New Guinea and
Wallacea. Consequently, I was tentatively able to identify patterns in timing and
changes in habitat preference that appeared to correlate with this biogeographic
pattern. Investigating these types of pattern is a step towards better characterising
the evolutionary processes underlying species distributions. Application of more
sophisticated models for this type of analysis in future studies will allow us to gain a
more mechanistic understanding of biogeographical patterns.
Analytical packages are available for investigating the relationship between
biogeography and many other aspects of evolution (e.g. Pagel, et al. 2004; Alfaro, et al.
2009; Goldberg, et al. 2011; Rabosky, et al. 2014). This includes identifying
relationships between biogeography and adaptive radiations, both in terms of rate of
morphological evolution (e.g. Millien 2006) and diversification rates (e.g. Wiens, et al.
2009; Almeida, et al. 2012). Analytical methods have also been developed that can
infer the probability and direction of changes in a discrete character (e.g.
biogeographical distribution) across user-‐defined epochs (Bielejec, et al. 2014). This
approach could be used to investigate differences in dispersal between climatic or
307
geological periods of interest. We could also identify potential phenotypic or life
history traits that act as dispersal filters (e.g. Phillips, et al. 2006; Forsman, et al.
2010). For example, body size has a large impact on dispersal ability, with larger
organisms in general dispersing over longer distances (Jenkins, et al. 2007). In
addition to phenotypic and life-‐history variables, in the near future we may also be
able to identify genotypic variables that correlate with biogeography. In this thesis I
have discussed genome scale data mainly as it pertains to reconstructing the
relationships among a group of species. However, the genome contains a wealth of
functional data, which may be important for understanding the processes underlying
biogeography (e.g. Hansson, et al. 2003; Liedvogel, et al. 2011).
One question that may be investigated using genomic data is the genotypic
basis for loss of flight. This is potentially important for biogeography, as the dispersal
ability of most birds is reliant on flight. In Chapter 3, I concluded that the major
palaeognath lineages each evolved flightlessness independently. If this were the case
we would predict that the genotypic basis for this loss of flight should be different in
each lineage. While some phylogenetically broad studies of functional genomics have
identified convergent sequence evolution (e.g. Parker, et al. 2013), this may be less of
an issue for flightlessness if the phenotype results more from a relaxation of selection
pressure rather than from positive selection (e.g. Meredith, et al. 2009). If
flightlessness does result from a relaxation of selection pressure at certain loci, then it
is possible that the time of flight loss might be inferred from the accumulation of
substitutions at those loci. This would be valuable for determining timing of dispersal
and colonisation, as birds often quickly become flightless upon reaching isolated
islands where there are few predators and selective pressure for flight is therefore

308
relaxed. However, there may be problems with distinguishing time-‐related affects
from the background rate of evolution or from normal variation within the genome.
This may potentially be addressed by contrasting patterns of variation in the
genomes of a range of flighted and flightless species: flightlessness has evolved many
times independently in palaeognaths, parrots, ducks, penguins, rails and pigeons. A
broad sample of taxa would also help in the identification of loci that may be
specifically associated with flightlessness. Further studies will be necessary to assess
the viability of this type of analysis.
To use the analytical methods discussed above to their full potential we need
to comprehensively sample clades of interest. Comprehensive sampling allows us to
more confidently estimate the total number of evolutionary or biogeographic events,
the precise timing of these events, and the full range of phenotypic and genotypic
variation within the target group. However, much of the world’s fauna has become
extinct since the Late Pleistocene, making it difficult to obtain sequence data from
these taxa. Using high-‐throughput sequencing techniques, ancient DNA can now more
readily be obtained from remains of extinct organisms from geographical areas that
were previously challenging, including Madagascar (e.g. Chapter 3; Kistler, et al.
2014), South America (e.g. Chapter 7; Clack, et al. 2012; Enk, et al. 2014) and
Australia (e.g. Murray, et al. 2013; Llamas, et al. 2014). Additionally, under
exceptional conditions DNA sequence data can be obtained from specimens hundred
of thousands of years old (Dabney, et al. 2013; Orlando, et al. 2013; Meyer, et al.
2014). Consequently, future ancient DNA studies should facilitate more powerful and
meaningful biogeographical analyses by continuing to expand the taxonomic breadth
of phylogenetic datasets.

309
Considerable work remains to be done in order to reconstruct the
biogeographical history of extinct elements of the Australasian fauna. For example,
the origin of the enigmatic adzebills (Aptornis) from New Zealand remains uncertain.
Like much of the New Zealand avifauna, these large flightless birds became extinct
after the arrival of humans (Tennyson and Martinson 2006). However, while they are
presumed to be gruiforms (e.g. Lanfear and Bromham 2011) and have existed in New
Zealand since at least the early Miocene (Worthy, et al. 2011a), their precise
phylogenetic affinity and geographical origin are unknown. Concomitantly, it is also
uncertain whether they are an element of the putative Gondwanan vicariant fauna, or
represent a more recent colonisation (see Chapter 4). Another biogeographically
interesting Australasian group is the terrestrial meolaniid ‘horned turtles’, which also
became extinct during the Holocene (White, et al. 2010). These large turtles were
distributed across Australia (Anderson 1925), New Caledonia (Gaffney, et al. 1984),
Vanuatu (White, et al. 2010) and Fiji (Worthy, et al. 1999). While dispersal by ocean
drifting probably explains at least part of their distribution (e.g. Palkovacs, et al.
2002), at least their presence in New Caledonian could also potentially be explained
by vicariance (Morat 1993). Similar questions surround the origin of mekosuchine
crocodiles (Mead, et al. 2002; Molnar, et al. 2002): an extinct subfamily of largely
terrestrial (or even semiarboreal) crocodilians endemic to Australia and the
southwest Pacific. Since these organisms only became extinct during the Holocene,
future ancient DNA studies should be able to resolve their biogeographic history
more precisely if suitably preserved specimens could be located.
310
Much as for Australasia, the origins of many elements of the extinct South
American fauna remain uncertain. Two important biogeographic events occurred
during the geological history of South America, which had major impacts on its
modern faunal communities: the separation of South America from the other
Gondwanan landmasses (beginning in the Cretaceous and culminating as recently as
21 mya; Lawver, et al. 2011) (see Chapters 2, 3 and 7) and the subsequent connection
between South America and North America ~3 mya (see Chapter 7). Marsupials (see
Chapter 2), xenarthrans (see Chapter 7) and meridiungulates (endemic hoofed
mammals that converged on many ungulate and rodent-‐like body forms) dominated
South America’s terrestrial mammal fauna during the period following the continent’s
isolation. Of these three lineages, the origin of the meridiungulates is most poorly
understood, and it has been suggested that they may not represent a monophyletic
group (summarised in Hunter and Janis 2006; Rose 2006). Thus, resolving the
relationships of the meridiungulates would greatly expand our understanding of the
evolution, distribution and movement of early eutherian mammals. At least two
meridiungulates survived into the Late Pleistocene -‐ Macrauchenia and Toxodon
(Cione, et al. 2003) – and would have been contemporary with Glyptodon and
Hippidion (Chapter 7). Consequently, if Macrauchenia or Toxodon remains can be
recovered from the same (or similar) layer as those in Chapter 7, ancient DNA
analysis should be able to resolve their evolutionary origin. Additional remains from
these deposits may also help better understand the evolution of more recent
elements of the South American fauna, which presumably arrived following the
formation of the Isthmus of Panama. For example, the South American short-‐faced
bears (Arctotherium) and gomphotheriids (e.g. Cuvieronius, Stegomastodon; distant
relatives of elephants and mammoths), which became extinct during the Holocene
311
(Soibelzon 2004; Soibelzon, et al. 2005; Labarca and López 2006; Rodríguez-‐Flórez, et
al. 2009). The exchange of fauna between North and South America concurrent with
the formation of the Isthmus of Panama will be an excellent biogeographical
laboratory for future study.
Ultimately, high-‐throughput sequencing will allow us to reconstruct
phylogenies with greater fidelity than previously possible, including both extinct and
extant species. These phylogenies will provide a framework for powerful new
analyses. Advanced and flexible Bayesian computational environments are under
development – BEAST2 (Bouckaert, et al. 2014) and RevBayes
(https://github.com/revbayes/revbayes) -‐ which will allow the evolution and
covariance of multiple variables to be analysed simultaneously in a phylogenetic
framework. The results of future studies will continue to expand our understanding
of evolutionary processes and principles underlying biogeographic patterns.

312
Conclusion
Biogeography is the study of how and why organisms are distributed the way they
are, and is consequently intimately tied to evolution. By investigating biogeographic
patterns we can learn more about fundamental evolutionary processes and the
history of life on Earth, and many of the most striking biogeographic patterns are
found in the southern hemisphere. In this thesis I investigated how patterns of bird
and mammal distribution were influenced by important geological events that shaped
the southern hemisphere over the past 100 My: the breakup of Gondwana during the
Cretaceous, Palaeocene and Eocene; the submergence of Zealandia in the Oligocene;
the emergence of New Guinea and Wallacea beginning in the Miocene; and formation
of the Isthmus of Panama and emergence of the Chatham Islands archipelago in the
Pliocene. As a result, I was able to resolve a number of long-‐standing biogeographical
questions, most prominently the origin of the ratite birds: the archetypal vicariant
taxon that never was. Ancient DNA from highly degraded remains was critical for
much of the research undertaken as part of this thesis, and high-‐throughput
sequencing technology was key in obtaining quality data from these specimens. The
system I developed for hybridisation enrichment and iterative read assembly for non-‐
model organisms will be a valuable tool for future de novo sequencing project,
diversity surveys, and identification of fragmentary sub-‐fossil remains.
The advent of high-‐throughput sequencing is revolutionising the fields of
phylogenetics and biogeography, and I make two main methodological
recommendations for future biogeographic studies. Future studies should: i) use
hybridisation enrichment to target a carefully selected suite of orthologous nuclear
313
loci in addition to the mitochondrial genome, and ii) adopt a cautious approach to
interpreting the results of molecular dating analyses, given current uncertainties with
choosing the appropriate clock model and the impact that these choices may have on
biogeographic conclusions. In addition, where possible, future studies should explore
alternative dating strategies that make greater use of biological correlates of the
molecular rate, and/or the fossil record (i.e. total evidence dating). By implementing
these recommendations, researchers will be able to take full advantage of advances in
high-‐throughput sequencing for biogeographical hypothesis testing. Using the
resulting datasets and advances in analytical procedures, we will continue to move
towards a more mechanistic understanding of biogeography, and therefore evolution
in general.
314
References
Alfaro ME, Santini F, Brock C, Alamillo H, Dornburg A, Rabosky DL, Carnevale G,
Harmon LJ. 2009. Nine exceptional radiations plus high turnover explain species
diversity in jawed vertebrates. Proc Natl Acad Sci U S A 106:13410-‐13414.
Ali JR, Krause DW. 2011. Late Cretaceous bioconnections between Indo-‐Madagascar
and Antarctica: refutation of the Gunnerus Ridge causeway hypothesis. J Biogeogr
38:1855-‐1872.
Almeida EAB, Pie MR, Brady SG, Danforth BN. 2012. Biogeography and diversification
of colletid bees (Hymenoptera: Colletidae): emerging patterns from the southern end
of the world. J Biogeogr 39:526-‐544.
Anderson C. 1925. Notes on the extinct chelonian Meiolania, with a record of a new
occurrence. 14:223-‐242.
Arbeláez-‐Cortés E, Milá B, Navarro-‐Sigüenza AG. 2014. Multilocus analysis of
intraspecific differentiation in three endemic bird species from the northern
Neotropical dry forest. Mol Phylogenet Evol 70:362-‐377.
Arcila D, Alexander Pyron R, Tyler JC, Orti G, Betancur RR. 2015. An evaluation of
fossil tip-‐dating versus node-‐age calibrations in tetraodontiform fishes (Teleostei:
Percomorphaceae). Mol Phylogenet Evol 82:131-‐145.
Austin JJ, Soubrier J, Prevosti FJ, Prates L, Trejo V, Mena F, Cooper A. 2013. The origins
of the enigmatic Falkland Islands wolf. Nat Commun 4:1552.
Avise JC. 2000. Phylogeography: the history and formation of species. Cambridge,
Massachusetts: Harvard University Press.
Baele G, Lemey P, Bedford T, Rambaut A, Suchard MA, Alekseyenko AV. 2012.
Improving the accuracy of demographic and molecular clock model comparison while
accommodating phylogenetic uncertainty. Mol Biol Evol 29:2157-‐2167.
Barnett R, Yamaguchi N, Shapiro B, Ho SY, Barnes I, Sabin R, Werdelin L, Cuisin J,
Larson G. 2014. Revealing the maternal demographic history of Panthera leo using
ancient DNA and a spatially explicit genealogical analysis. BMC Evol Biol 14:70.
315
Beck RM. 2012. An 'ameridelphian' marsupial from the early Eocene of Australia
supports a complex model of Southern Hemisphere marsupial biogeography.
Naturwissenschaften 99:715-‐729.
Beck RM, Lee MS. 2014. Ancient dates or accelerated rates? Morphological clocks and
the antiquity of placental mammals. Proc R Soc B 281.
Bee CA, Close RL. 1993. Mitochondrial DNA analysis of introgression between
adjacent taxa of rock-‐wallabies, Petrogale species (Marsupialia: Macropodidae).
Genetics Research 61:21-‐37.
Benton MJ, Donoghue PCJ. 2007. Paleontological evidence to date the tree of life. Mol
Biol Evol 24:26-‐53.
Bielejec F, Lemey P, Baele G, Rambaut A, Suchard MA. 2014. Inferring heterogeneous
evolutionary processes through time: from sequence substitution to phylogeography.
Syst Biol 63:493-‐504.
Billet G, Hautier L, de Muizon C, Valentin X. 2011. Oldest cingulate skulls provide
congruence between morphological and molecular scenarios of armadillo evolution.
Proc R Soc B 278:2791-‐2797.
Bouckaert R, Heled J, Kühnert D, Vaughan T, Wu C-‐H, Xie D, Suchard MA, Rambaut A,
Drummond AJ. 2014. BEAST 2: A software platform for Bayesian evolutionary
analysis. PLoS Comput Biol 10:e1003537.
Canestrelli D, Bisconti R, Nascetti G. 2014. Extensive unidirectional introgression
between two salamander lineages of ancient divergence and its evolutionary
implications. Sci Rep 4:6516.
Capella-‐Gutierrez S, Kauff F, Gabaldón T. 2014. A phylogenomics approach for
selecting robust sets of phylogenetic markers. Nucleic Acids Res 42:e54.
Carpenter ML, Buenrostro JD, Valdiosera C, Schroeder H, Allentoft ME, Sikora M,
Rasmussen M, Gravel S, Guillén S, Nekhrizov G, et al. 2013. Pulling out the 1%: whole-‐
genome capture for the targeted enrichment of ancient DNA sequencing libraries. The
American Journal of Human Genetics 93:852-‐864.
Chen F, Mackey AJ, Vermunt JK, Roos DS. 2007. Assessing performance of orthology
detection strategies applied to eukaryotic genomes. PLoS ONE 2:e383.

316
Chung Y, Ané C. 2011. Comparing two Bayesian methods for gene tree/species tree
reconstruction: simulations with incomplete lineage sorting and horizontal gene
transfer. Syst Biol 60:261-‐275.
Cione AL, Tonni EP, Soibelzon LH. 2003. The Broken Zig-‐Zag: Late Cenozoic large
mammal and tortoise extinction in South America. Rev Mus Argent Cienc Nat 5:1-‐19.
Clack AA, MacPhee RD, Poinar HN. 2012. Mylodon darwinii DNA sequences from
ancient fecal hair shafts. Ann Anat 194:26-‐30.
Crawford NG, Faircloth BC, McCormack JE, Brumfield RT, Winker K, Glenn TC. 2012.
More than 1000 ultraconserved elements provide evidence that turtles are the sister
group of archosaurs. Biol Lett 11.
Crisp M, Hardy N, Cook L. 2014. Clock model makes a large difference to age estimates
of long-‐stemmed clades with no internal calibration: a test using Australian
grasstrees. BMC Evol Biol 14:1-‐17.
Crisp MD, Trewick SA, Cook LG. 2011. Hypothesis testing in biogeography. Trends
Ecol Evol 26:66-‐72.
Dabney J, Knapp M, Glocke I, Gansauge M-‐T, Weihmann A, Nickel B, Valdiosera C,
García N, Pääbo S, Arsuaga J-‐L, et al. 2013. Complete mitochondrial genome sequence
of a Middle Pleistocene cave bear reconstructed from ultrashort DNA fragments.
Proceedings of the National Academy of Sciences 110:15758-‐15763.
Dimitrieva S, Bucher P. 2013. UCNEbase-‐-‐a database of ultraconserved non-‐coding
elements and genomic regulatory blocks. Nucleic Acids Res 41:D101-‐D109.
Donoghue PCJ, Benton MJ. 2007. Rocks and clocks: calibrating the Tree of Life using
fossils and molecules. Trends Ecol Evol 22:424-‐431.
Dornburg A, Brandley MC, McGowen MR, Near TJ. 2012. Relaxed clocks and
inferences of heterogeneous patterns of nucleotide substitution and divergence time
estimates across whales and dolphins (Mammalia: Cetacea). Mol Biol Evol 29:721-‐
736.
Douzery EJP, Scornavacca C, Romiguier J, Belkhir K, Galtier N, Delsuc Fdr, Ranwez V.
2014. OrthoMaM v8: a database of orthologous exons and coding sequences for
comparative genomics in mammals. Mol Biol Evol 31:1923-‐1928.

317
Drummond A, Suchard M. 2010. Bayesian random local clocks, or one rate to rule
them all. BMC Biol 8:114.
Drummond AJ, Nicholls GK, Rodrigo AG, Solomon W. 2002. Estimating mutation
parameters, population history and genealogy simultaneously from temporally
spaced sequence data. Genetics 161:1307-‐1320.
Drummond AJ, Pybus OG, Rambaut A, Forsberg R, Rodrigo AG. 2003. Measurably
evolving populations. Trends Ecol Evol 18:481-‐488.
Duchêne S, Lanfear R, Ho SYW. 2014. The impact of calibration and clock-‐model
choice on molecular estimates of divergence times. Mol Phylogenet Evol 78:277-‐289.
Edwards CJ, Suchard MA, Lemey P, Welch JJ, Barnes I, Fulton TL, Barnett R, O'Connell
TC, Coxon P, Monaghan N, et al. 2011. Ancient hybridization and an Irish origin for the
modern polar bear matriline. Curr Biol 21:1251-‐1258.
Eldridge M, Close R. 1992. Taxonomy of rock wallabies, Petrogale (Marsupialia,
Macropodidae) .1. A Revision of the eastern petrogale with the description of 3 new
species. Aust J Zool 40:605-‐625.
Enk JM, Devault AM, Kuch M, Murgha YE, Rouillard J-‐M, Poinar HN. 2014. Ancient
whole genome enrichment using baits built from modern DNA. Mol Biol Evol
31:1292-‐1294.
Firth C, Charleston MA, Duffy S, Shapiro B, Holmes EC. 2009. Insights into the
evolutionary history of an emerging livestock pathogen: Porcine Circovirus 2. Journal
of Virology 83:12813-‐12821.
Fitch WM. 1970. Distinguishing Homologous from Analogous Proteins. Syst Biol
19:99-‐113.
Fitch WM. 2000. Homology: a personal view on some of the problems. Trends Genet
16:227-‐231.
Forsman A, Merilä J, Ebenhard T. 2010. Phenotypic evolution of dispersal-‐enhancing
traits in insular voles. Proc R Soc B 278:225-‐232.
Gabaldon T, Koonin EV. 2013. Functional and evolutionary implications of gene
orthology. Nat Rev Genet 14:360-‐366.
318
Gaffney EF, Balouet JC, de Broin F. 1984. New occurrences of extinct meiolaniid
turtles in New Caledonia. Am Mus Novit 2800:1-‐6.
Gillooly JF, Allen AP, West GB, Brown JH. 2005. The rate of DNA evolution: effects of
body size and temperature on the molecular clock. Proc Natl Acad Sci U S A 102:140-‐
145.
Goldberg EE, Lancaster LT, Ree RH. 2011. Phylogenetic inference of reciprocal effects
between geographic range evolution and diversification. Syst Biol 60:451-‐465.
Green RE, Malaspinas A-‐S, Krause J, Briggs AW, Johnson PLF, Uhler C, Meyer M, Good
JM, Maricic T, Stenzel U, et al. 2008. A complete Neandertal mitochondrial genome
sequence determined by high-‐throughput sequencing. Cell 134:416-‐426.
Hackett SJ, Kimball RT, Reddy S, Bowie RCK, Braun EL, Braun MJ, Chojnowski JL, Cox
WA, Han KL, Harshman J, et al. 2008. A phylogenomic study of birds reveals their
evolutionary history. Science 320:1763-‐1768.
Haddrath O, Baker AJ. 2012. Multiple nuclear genes and retroposons support
vicariance and dispersal of the palaeognaths, and an Early Cretaceous origin of
modern birds. Proc R Soc B 279:4617-‐4625.
Hansson B, Bensch S, Hasselquist D. 2003. Heritability of dispersal in the great reed
warbler. Ecol Lett 6:290-‐294.
Ho SYW. 2007. Calibrating molecular estimates of substitution rates and divergence
times in birds. J Avian Biol 38:409-‐414.
Ho SYW. 2009. An examination of phylogenetic models of substitution rate variation
among lineages. Biol Lett 5:421-‐424.
Ho SYW. 2014. The changing face of the molecular evolutionary clock. Trends Ecol
Evol 29:496-‐503.
Hundertmark KJ, Shields GF, Udina IG, Bowyer RT, Danilkin AA, Schwartz CC. 2002.
Mitochondrial phylogeography of moose (Alces alces): Late Pleistocene divergence
and population expansion. Mol Phylogenet Evol 22:375-‐387.
Hunter J, Janis C. 2006. Spiny Norman in the Garden of Eden? Dispersal and early
biogeography of Placentalia. J Mamm Evol 13:89-‐123.

319
Jarvis ED, Mirarab S, Aberer AJ, Li B, Houde P, Li C, Ho SYW, Faircloth BC, Nabholz B,
Howard JT, et al. 2014. Whole-‐genome analyses resolve early branches in the tree of
life of modern birds. Science 346:1320-‐1331.
Jenkins DG, Brescacin CR, Duxbury CV, Elliott JA, Evans JA, Grablow KR, Hillegass M,
Lyon BN, Metzger GA, Olandese ML, et al. 2007. Does size matter for dispersal
distance? Glob Ecol Biogeogr 16:415-‐425.
Kistler L, Ratan A, Godfrey LR, Crowley BE, Hughes CE, Lei R, Cui Y, Wood ML,
Muldoon KM, Andriamialison H, et al. 2014. Comparative and population
mitogenomic analyses of Madagascar's extinct, giant ‘subfossil’ lemurs. J Hum Evol
79:45-‐54.
Kitazoe Y, Kishino H, Waddell PJ, Nakajima N, Okabayashi T, Watabe T, Okuhara Y.
2007. Robust time estimation reconciles views of the antiquity of placental mammals.
PLoS ONE 2:e384.
Knapp M, Hofreiter M. 2010. Next generation sequencing of ancient DNA:
requirements, strategies and perspectives. Genes 1:227-‐243.
Kutschera VE, Bidon T, Hailer F, Rodi JL, Fain SR, Janke A. 2014. Bears in a forest of
gene trees: phylogenetic inference is complicated by incomplete lineage sorting and
gene flow. Mol Biol Evol 31:2004-‐2017.
Labarca RO, López PG. 2006. Los mamíferos finipleistocénicos de la Formación
Quebrada Quereo (IV Región-‐Chile): biogeografía, bioestratigrafía e inferencias
paleoambientales. Mastozool Neotrop 13:89-‐101.
Lanfear R, Bromham L. 2011. Estimating phylogenies for species assemblages: A
complete phylogeny for the past and present native birds of New Zealand. Mol
Phylogenet Evol 61:958-‐963.
Lanfear R, Thomas JA, Welch JJ, Brey T, Bromham L. 2007. Metabolic rate does not
calibrate the molecular clock. Proceedings of the National Academy of Sciences
104:15388-‐15393.
Lanfear R, Welch JJ, Bromham L. 2010. Watching the clock: studying variation in rates
of molecular evolution between species. Trends Ecol Evol 25:495-‐503.

320
Lartillot N, Philippe H. 2006. Computing Bayes factors using thermodynamic
integration. Syst Biol 55:195-‐207.
Lartillot N, Poujol Rl. 2011. A phylogenetic model for investigating correlated
evolution of substitution rates and continuous phenotypic characters. Mol Biol Evol
28:729-‐744.
Lawver LA, Gahagan LM, Dalziel IWD. 2011. A different look at gateways: drake
passage and Australia/Antarctica. In: Anderson JB, Wellner JS, editors. Tectonic,
climatic, and cryospheric evolution of the Antarctic Peninsula. Special Publications.
Washington, DC: American Geophysical Union. p. 5-‐33.
Lee MSY, Cau A, Naish D, Dyke GJ. 2014. Morphological clocks in paleontology, and a
Mid-‐Cretaceous origin of crown Aves. Syst Biol 63:442-‐449.
Lee Michael SY, Soubrier J, Edgecombe Gregory D. 2013. Rates of phenotypic and
genomic evolution during the Cambrian Explosion. Curr Biol 23:1889-‐1895.
Liedvogel M, Åkesson S, Bensch S. 2011. The genetics of migration on the move.
Trends Ecol Evol 26:561-‐569.
Linder HP, Hardy CR, Rutschmann F. 2005. Taxon sampling effects in molecular clock
dating: An example from the African Restionaceae. Mol Phylogenet Evol 35:569-‐582.
Liu L, Li Y, Li S, Hu N, He Y, Pong R, Lin D, Lu L, Law M. 2012. Comparison of Next-‐
Generation Sequencing Systems. 2012.
Llamas B, Brotherton P, Mitchell KJ, Templeton JE, Thomson VA, Metcalf JL,
Armstrong KN, Kasper M, Richards SM, Camens AB, et al. 2014. Late Pleistocene
Australian marsupial DNA clarifies the affinities of extinct megafaunal kangaroos and
wallabies. Mol Biol Evol.
Loman NJ, Misra RV, Dallman TJ, Constantinidou C, Gharbia SE, Wain J, Pallen MJ.
2012. Performance comparison of benchtop high-‐throughput sequencing platforms.
Nat Biotech 30:434-‐439.
Maddison WP. 1997. Gene Trees in Species Trees. Syst Biol 46:523-‐536.
McCarthy EM. 2006. Handbook of avian hybrids of the world. New York: Oxford
University Press.
321
McCormack JE, Faircloth BC, Crawford NG, Gowaty PA, Brumfield RT, Glenn TC. 2012.
Ultraconserved elements are novel phylogenomic markers that resolve placental
mammal phylogeny when combined with species-‐tree analysis. Genome Res 22:746-‐
754.
Mead JI, Steadman DW, Bedford SH, Bell CJ, Spriggs M, Guyer C. 2002. New Extinct
Mekosuchine Crocodile from Vanuatu, South Pacific. Copeia 2002:632-‐641.
Melo-‐Ferreira J, Seixas FA, Cheng E, Mills LS, Alves PC. 2014. The hidden history of the
snowshoe hare, Lepus americanus: extensive mitochondrial DNA introgression
inferred from multilocus genetic variation. Mol Ecol 23:4617-‐4630.
Meng C, Kubatko LS. 2009. Detecting hybrid speciation in the presence of incomplete
lineage sorting using gene tree incongruence: a model. Theor Popul Biol 75:35-‐45.
Meredith RW, Gatesy J, Murphy WJ, Ryder OA, Springer MS. 2009. Molecular decay of
the tooth gene Enamelin (ENAM) mirrors the loss of enamel in the fossil record of
placental mammals. PLoS Genet 5:e1000634.
Meredith RW, Janecka JE, Gatesy J, Ryder OA, Fisher CA, Teeling EC, Goodbla A, Eizirik
E, Simao TLL, Stadler T, et al. 2011. Impacts of the Cretaceous terrestrial revolution
and KPg extinction on mammal diversification. Science 334:521-‐524.
Meyer M, Fu Q, Aximu-‐Petri A, Glocke I, Nickel B, Arsuaga J-‐L, Martinez I, Gracia A, de
Castro JMB, Carbonell E, et al. 2014. A mitochondrial genome sequence of a hominin
from Sima de los Huesos. Nature 505:403-‐406.
Meyer M, Kircher M, Gansauge M-‐T, Li H, Racimo F, Mallick S, Schraiber JG, Jay F,
Prüfer K, de Filippo C, et al. 2012. A high-‐coverage genome sequence from an archaic
denisovan individual. Science 338:222-‐226.
Millien V. 2006. Morphological evolution is accelerated among island mammals. PLoS
Biol 4:e321.
Molnar RE, Worthy T, Willis PMA. 2002. An extinct Pleistocene endemic mekosuchine
crocodylian from Fiji. J Vertebr Paleontol 22:612-‐628.
Morat P. 1993. Our knowledge of the flora of New Caledonia: endemism and diversity
in relation to vegetation types and substrates. Biodivers Lett 1:72-‐81.

322
Mourer-‐Chauviré C, Senut B, Pickford M, Mein P. 1996. Le plus ancien représentant du
genre Struthio (Aves, Struthionidae), Struthio coppensi n. sp., du Miocène inférieur de
Namibie. Comptes Rendus de l'Académie des Sciences Paris 322:325-‐332.
Müller J, Reisz RR. 2005. Four well-‐constrained calibration points from the vertebrate
fossil record for molecular clock estimates. Bioessays 27:1069-‐1075.
Murray DiC, Haile J, Dortch J, White NE, Haouchar D, Bellgard MI, Allcock RJ, Prideaux
GJ, Bunce M. 2013. Scrapheap Challenge: A novel bulk-‐bone metabarcoding method to
investigate ancient DNA in faunal assemblages. Sci. Rep. 3.
Neaves LE, Zenger KR, Cooper DW, Eldridge MD. 2010. Molecular detection of
hybridization between sympatric kangaroo species in south-‐eastern Australia.
Heredity 104:502-‐512.
Orlando L, Ginolhac A, Zhang G, Froese D, Albrechtsen A, Stiller M, Schubert M,
Cappellini E, Petersen B, Moltke I, et al. 2013. Recalibrating Equus evolution using the
genome sequence of an early Middle Pleistocene horse. Nature 499:74-‐78.
Pagel M, Meade A, Barker D. 2004. Bayesian estimation of ancestral character states
on phylogenies. Syst Biol 53:673-‐684.
Palkovacs EP, Gerlach J, Caccone A. 2002. The evolutionary origin of Indian Ocean
tortoises (Dipsochelys). Mol Phylogenet Evol 24:216-‐227.
Parker J, Tsagkogeorga G, Cotton JA, Liu Y, Provero P, Stupka E, Rossiter SJ. 2013.
Genome-‐wide signatures of convergent evolution in echolocating mammals. Nature
502:228-‐231.
Peters JL, Winker K, Millam KC, Lavretsky P, Kulikova I, Wilson RE, Zhuravlev YN,
McCracken KG. 2014. Mito-‐nuclear discord in six congeneric lineages of Holarctic
ducks (genus Anas). Mol Ecol 23:2961-‐2974.
Phillips BL, Brown GP, Webb JK, Shine R. 2006. Invasion and the evolution of speed in
toads. Nature 439:803-‐803.
Phillips JC. 1915. Experimental studies of hybridization among ducks and pheasants. J
Exp Zool 18:69-‐143.

323
Phillips MJ, Gibb GC, Crimp EA, Penny D. 2010. Tinamous and moa flock together:
mitochondrial genome sequence analysis reveals independent losses of flight among
ratites. Syst Biol 59:90-‐107.
Phillips MJ, Haouchar D, Pratt RC, Gibb GC, Bunce M. 2013. Inferring kangaroo
phylogeny from incongruent nuclear and mitochondrial Genes. PLoS ONE 8:e57745.
Poznik GD, Henn BM, Yee M-‐C, Sliwerska E, Euskirchen GM, Lin AA, Snyder M,
Quintana-‐Murci L, Kidd JM, Underhill PA, et al. 2013. Sequencing Y chromosomes
resolves discrepancy in time to common ancestor of males versus females. Science
341:562-‐565.
Prado JL, Alberdi MT. 1996. A cladistic analysis of the horses of the tribe Equini.
Palaeontology 39:663-‐680.
Rabosky DL, Grundler M, Anderson C, Title P, Shi JJ, Brown JW, Huang H, Larson JG.
2014. BAMMtools: an R package for the analysis of evolutionary dynamics on
phylogenetic trees. Methods in Ecology and Evolution 5:701-‐707.
Rambaut A. 2000. Estimating the rate of molecular evolution: incorporating non-‐
contemporaneous sequences into maximum likelihood phylogenies. Bioinformatics
16:395-‐399.
Rambaut A, Pybus OG, Nelson MI, Viboud C, Taubenberger JK, Holmes EC. 2008. The
genomic and epidemiological dynamics of human influenza A virus. Nature 453:615-‐
619.
Reich D, Green RE, Kircher M, Krause J, Patterson N, Durand EY, Viola B, Briggs AW,
Stenzel U, Johnson PLF, et al. 2010. Genetic history of an archaic hominin group from
Denisova Cave in Siberia. Nature 468:1053-‐1060.
Reisz RR, Müller J. 2004. Molecular timescales and the fossil record: a paleontological
perspective. Trends Genet 20:237-‐241.
Remm M, Storm CE, Sonnhammer EL. 2001. Automatic clustering of orthologs and in-‐
paralogs from pairwise species comparisons. J Mol Biol 314:1041-‐1052.
Reyes A, Gissi C, Catzeflis F, Nevo E, Pesole G, Saccone C. 2004. Congruent mammalian
trees from mitochondrial and nuclear genes using Bayesian methods. Mol Biol Evol
21:397-‐403.

324
Rizzi E, Lari M, Gigli E, De Bellis G, Caramelli D. 2012. Ancient DNA studies: new
perspectives on old samples. Genetics Selection Evolution 44:21.
Rodríguez-‐Flórez CD, Rodríguez-‐Flórez EL, Rodríguez CA. 2009. Revisión de la fauna
Pleistocénica Gompotheriidae en Colombia y reporte de un caso para el Valle del
Cauca. Boletín Científico. Centro de Museos. Museo de Historia Natural 13:78-‐85.
Ronquist F, Klopfstein S, Vilhelmsen L, Schulmeister S, Murray DL, Rasnitsyn AP.
2012. A total-‐evidence approach to dating with fossils, applied to the early radiation
of the hymenoptera. Syst Biol 61:973-‐999.
Rose KD. 2006. The beginning of the age of mammals. Baltimore, Maryland: The John
Hopkins University Press.
Rosenberg NA. 2002. The Probability of Topological Concordance of Gene Trees and
Species Trees. Theor Popul Biol 61:225-‐247.
Rubinoff D, Holland BS. 2005. Between two extremes: Mitochondrial DNA is neither
the panacea nor the nemesis of phylogenetic and taxonomic inference. Syst Biol
54:952-‐961.
Scally A, Dutheil JY, Hillier LW, Jordan GE, Goodhead I, Herrero J, Hobolth A,
Lappalainen T, Mailund T, Marques-‐Bonet T, et al. 2012. Insights into hominid
evolution from the gorilla genome sequence. Nature 483:169-‐175.
Schulte JA. 2013. Undersampling taxa will underestimate molecular divergence dates:
an example from the South American lizard clade Liolaemini. International Journal of
Evolutionary Biology 2013:12.
Sheng GL, Soubrier J, Liu JY, Werdelin L, Llamas B, Thomson VA, Tuke J, Wu LJ, Hou
XD, Chen QJ, et al. 2014. Pleistocene Chinese cave hyenas and the recent Eurasian
history of the spotted hyena, Crocuta crocuta. Mol Ecol 23:522-‐533.
Smith JV, Braun EL, Kimball RT. 2013. Ratite non-‐monophyly: independent evidence
from 40 novel loci. Syst Biol 62:35-‐49.
Soibelzon LH. 2004. Revisión sistemática de los tremarctinae (Carnivora, Ursidae)
fósiles de América del sur. Revista Museo Argentino de Ciencias Naturales 6:107-‐133.
Soibelzon LH, Tonni EP, Bond M. 2005. The fossil record of South American short-‐
faced bears (Ursidae, Tremarctinae). J South Am Earth Sci 20:105-‐113.
325
Staats M, Erkens RH, van de Vossenberg B, Wieringa JJ, Kraaijeveld K, Stielow B, Geml
J, Richardson JE, Bakker FT. 2013. Genomic treasure troves: complete genome
sequencing of herbarium and insect museum specimens. PLoS ONE 8:e69189.
Steiper ME, Seiffert ER. 2012. Evidence for a convergent slowdown in primate
molecular rates and its implications for the timing of early primate evolution.
Proceedings of the National Academy of Sciences 109:6006-‐6011.
Tennyson AJD, Martinson P. 2006. Extinct Birds of New Zealand. Wellington: Te Papa
Press.
van Dijk EL, Auger H, Jaszczyszyn Y, Thermes C. 2014. Ten years of next-‐generation
sequencing technology. Trends Genet 30:418-‐426.
Waddell PJ. 2008. Fit of fossils and mammalian molecular trees: dating
inconsistencies revisited. (http://arxiv.org/abs/0812.5114).
Wall DP, Fraser HB, Hirsh AE. 2003. Detecting putative orthologs. Bioinformatics
19:1710-‐1711.
Warnock RCM, Yang ZH, Donoghue PCJ. 2012. Exploring uncertainty in the calibration
of the molecular clock. Biol Lett 8:156-‐159.
Westerman M, Kear BP, Aplin K, Meredith RW, Emerling C, Springer MS. 2012.
Phylogenetic relationships of living and recently extinct bandicoots based on nuclear
and mitochondrial DNA sequences. Mol Phylogenet Evol 62:97-‐108.
White AW, Worthy TH, Hawkins S, Bedford S, Spriggs M. 2010. Megafaunal meiolaniid
horned turtles survived until early human settlement in Vanuatu, Southwest Pacific.
Proc Natl Acad Sci U S A 107:15512-‐15516.
Wiens JJ, Sukumaran J, Pyron RA, Brown RM. 2009. Evolutionary and biogeographic
origins of high tropical diversity in old world frogs (Ranidae). Evolution 63:1217-‐
1231.
Worobey M, Han G-‐Z, Rambaut A. 2014. A synchronized global sweep of the internal
genes of modern avian influenza virus. Nature 508:254-‐257.
Worthy T, Tennyson AD, Scofield RP. 2011a. Fossils reveal an early Miocene presence
of the aberrant gruiform Aves: Aptornithidae in New Zealand. J Ornithol 152:669-‐680.

326
Worthy TH, Anderson AJ, Molnar RE. 1999. Megafaunal expression in a land without
mammals -‐ the first fossil faunas from terrestrial deposits in Fiji (Vertebrata:
Amphibia, Reptilia, Aves). Senckenb Biol 79:237-‐242.
Worthy TH, Hand SJ, Nguyen JMT, Tennyson AJD, Worthy JP, Scofield RP, Boles WE,
Archer M. 2010. Biogeographical and Phylogenetic Implications of an Early Miocene
Wren (Aves: Passeriformes: Acanthisittidae) from New Zealand. J Vertebr Paleontol
30:479-‐498.
Worthy TH, Tennyson AJD, Scofield RP. 2011b. An early Miocene diversity of parrots
(Aves, Strigopidae, Nestorinae) from New Zealand. J Vertebr Paleontol 31:1102-‐1116.
Yoder AD, Yang Z. 2000. Estimation of primate apeciation dates using local molecular
clocks. Mol Biol Evol 17:1081-‐1090.
Zink RM, Barrowclough GF. 2008. Mitochondrial DNA under siege in avian
phylogeography. Mol Ecol 17:2107-‐2121.

327
APPENDIX:
Molecular dating, genomic data, and the temporal origin of
modern birds APPENDIX: Molecular dating, genomic data, and the temporal origin of modern birds
Mitchell, K.J., Molecular dating, genomic data, and the temporal origin of modern
birds.
In preparation for submission.


329
APPENDIX:
Molecular dating, genomic data, and the temporal origin of modern birds
Kieren J Mitchell1
1 Australian Centre for Ancient DNA, School of Biological Sciences, University of Adelaide, Australia
Abstract
The timescale for the evolution of modern birds is contentious. The majority of
previous molecular dating studies have recovered very old (Mesozoic) dates for the
origin of many bird orders. Conversely, the fossil record suggests that most bird
orders may have originated more recently, in the latest Cretaceous or early Cenozoic.
A recent study focusing on a large genome scale nucleotide sequence dataset seemed
to reconcile these disparate estimates (Jarvis, et al. 2014). Jarvis et al. (2014)
presented molecular dating results that largely agreed with some interpretations of
the fossil record. However, they make several key assumptions that may have led to
these results. In the present study, I reanalyse Jarvis et al. (2014)’s dataset under a
broader range of plausible prior assumptions and demonstrate that node age
estimates are highly sensitive to model and calibration choice, with changes to either
potentially resulting in older date estimates. Consequently, care should be taken
when interpreting other hypotheses in light of the molecular dating results of Jarvis
et al. (2014), or when employing their age estimates as secondary calibrations.
Ultimately, the temporal origin of birds remains unresolved.

330
Introduction
The antiquity of modern birds is the subject of sustained debate (Ksepka, et al. 2014).
Most molecular dating studies place the origin of the modern avian crown-‐group
(Neornithes) deep within the Mesozoic, implying that many bird lineages
independently survived the mass extinction at the KPg boundary ~66 mya (e.g.
Cooper and Penny 1997; Haddrath and Baker 2012; Jetz, et al. 2012). However, very
few neornithine fossils are known from the Mesozoic (reviewed in Mayr 2014), which
suggests that they may have diversified more recently. Jarvis et al. (2014) have
recently published a time-‐calibrated phylogeny of birds constructed from a large
genome-‐scale dataset and claim that their results support a recent origin of modern
birds, with most orders originating rapidly following the KPg boundary. As this
conclusion runs contrary to that of many previous phylogenetic studies, and has
important implications for our understanding of bird evolution and biogeography
(see Chapter 4), it should be subject to intense scrutiny before being accepted.
Several aspects of the analyses in Jarvis et al. (2014) warrant further
exploration, beginning with the strategy used to calibrate their phylogeny for
molecular dating. Jarvis et al. (2014) implemented a strong prior against the
diversification of Neornithes occurring more than 99.6 mya, based on the absence of
neornithine fossils from some Late Cretaceous deposits. However, this judgement is
largely subjective as misidentification or differences in taphonomy, distribution and
completeness of the fossil record may result in a taxon being unobserved when it is
actually present (Brocklehurst, et al. 2012). Consequently, more conservative
interpretations of the fossil record place this constraint at 117.5 My (Jetz, et al. 2012)

331
or even older. In contrast to their restrictive bounding of the age of Neornithes, Jarvis
et al. (2014) take a cautious and conservative approach to assigning fossil taxa to
living groups. Consequently, many of the minimum bounds they implement are
younger than might be suggested based on alternative interpretations of the fossil
record (e.g. Mayr 2009; Mayr 2014). This combination of restrictive maximum
bounds and permissive minima may bias the analyses of Jarvis et al. (2014) towards
the relatively young dates they obtained (compared to previous estimates), but this
limitation of their approach is not addressed in their study.
Another factor needing further exploration is the model of evolutionary rate
variation. The molecular dating analyses presented in Jarvis et al. (2014) employ a
relaxed clock that assumes rate autocorrelation. Under a correlated relaxed clock
model the rate at a given branch depends in part on the rate of the branch preceding
it: a change from a slow to a fast rate is generally less likely than a change from a slow
to a moderate rate over a given time period (Drummond, et al. 2006). This is justified
in certain circumstances as some characteristics that are inherited by descendent
species (e.g. body mass, generation time) are linked with the rate of molecular
evolution (e.g. Gillooly, et al. 2005; Lanfear, et al. 2007; Ho 2009). However, over very
short time periods correlation may be so strong that most variation in rate may in
fact be determined by non-‐phylogenetic stochastic factors. Conversely, over long
timescales there may be so much variation in the determining characteristics that
rate autocorrelation between branches begins to break down. In these situations it
may be preferable to use an uncorrelated relaxed clock model, such as implemented
in the popular molecular dating software BEAST (Drummond and Rambaut 2007). In
contrast to correlated clock models, the magnitude of rate changes permitted under

332
an uncorrelated model is relatively unconstrained: rates for a specific branch may
vary freely according to the distribution of rates for the phylogeny as a whole.
In this short study I aim to explore how choice of calibrations (both minima
and maxima) and model of rate variation may have contributed to differences
between the results presented in Jarvis et al. (2014) and those of previous molecular
dating studies.
Methods
I downloaded the sequence alignment used for molecular dating analyses in Jarvis et
al. (2014). This alignment comprises 1st and 2nd codon positions of 1156 orthologous
protein-‐coding genes that were judged to have undergone roughly clock-‐like
evolution (722,202 nucleotides) for 51 taxa (48 birds and three outgroups: Figure 1).
I used this alignment to explore the effects of calibration and model choice on
posterior node age estimates.

333
Figure 1: Total evidence nucleotide tree (TENT) topology from Jarvis et al. (2014) showing
nodes calibrated in calibration schemes 1 and 4 (1 = blue, 4 = red, both = purple) and their
variants: calibration schemes 2, 3 and 5. Node numbers correspond to Table S1, which
contains further node constraint details.
Red-crested turaco
Downy woodpecker
American flamingo
Crested ibis
Budgerigar
Yellow-throated sandgrouse
Rifleman
White-tailed eagle
Dalmatian pelican
Rhinoceros hornbill
Carmine bee-eater
$QQD·V�KXPPLQJELUG
Emperor penguin
Killdeer
Chimney swift
Turkey
Great cormorant
Medium ground-finch
Green turtle
Cuckoo roller
&KXFN�ZLOO·V�ZLGRZ
Zebra finch
American alligator
Turkey vulture
Junglefowl
Brown mesite
Red-throated loon
Great tinamou
White-tailed tropicbird
Golden-collared manakin
Speckled mousebird
Rock pigeon
American crow
Green anole
Great crested grebe
Grey crowned crane
Kea
Common cuckoo
Red legged seriema
Bald eagle
Adelie penguin
Sunbittern
Little egret
0DFTXHHQ·V�EXVWDUG
Mallard
Hoatzin
Bar tailed trogon
Ostrich
Northern fulmar
Barn owl
Peregrine falcon
1
3
4
5
7
18
22
28
30
45
48
1110
13
17
19
31
35
39
41
49
12
16
25
3234
36
43
50
6
8
159
14
20
23
33
37
38
40
44
46
42
47
24
26
2729
21
2

334
In the present study, divergence times were estimated in MCMCTREE in PAML
4.8 (Yang 2007), using the approximate-‐likelihood method with branch lengths
estimated using BASEML. As for Jarvis et al. (2014), I used the HKY85+GAMMA
substitution model with four rate categories for the gamma distribution of rates
across sites, time units were set to 100 My, the prior on the mean rate of evolution
(rgene_gamma) was set to 0.001 substitutions/My, and all data were analysed as a
single partition. The tree topology was fixed to Jarvis et al. (2014)’s total evidence
nucleotide tree (TENT), as this is the topology they favoured. Posterior distributions
were estimated by MCMC sampling every 2x10³ for 108 steps after a burn-‐in of 2x10⁷
steps. To check for stationarity and convergence, each analysis was run in duplicate
and monitored in Tracer v1.6 (http://tree.bio.ed.ac.uk/software/tracer/) to ensure
ESSs > 200.
I evaluated five different calibration schemes: 1) the same as presented in
Jarvis et al. (2014)’s Figure S28 (see Figure 1; Table S1), including the maximum
bound of 99.6 mya on the diversification of Neornithes; 2) the same as 1 but with the
constraint on Neornithes relaxed to 66-‐117.5 mya; 3) the same as 1 but with
Neornithes unconstrained; 4) an alternative set of calibrations derived from the
fossils and affinities presented in Mayr (2014), with Neornithes constrained to 66-‐
117.5 mya, and with outgroup calibrations as in Jarvis et al. (2014)’s Fig S28 (see
Figure 1; Table S1); and 5) the same as 4 but with Neornithes unconstrained. All
calibrations were implemented with soft (2.5%) minima and maxima. Each
calibration scheme was analysed under both the uncorrelated and correlated relaxed
clock models. I tested the fit of the correlated and uncorrelated models for each
calibration scheme by comparing estimates of the marginal likelihood obtained using

335
the harmonic mean estimator (corrected using 100 bootstrap replicates) (Suchard, et
al. 2001) implemented in Tracer.
Results
The constraint placed on the age of Neornithes (node 4 in Figure 1) has a large impact
on its posterior node age distribution. When I replicated the Jarvis et al. (2014)
constraint (calibration scheme 1: 66-‐99.6 mya) mean node age estimates were very
close to the maximum bound of this constraint, regardless of the clock model used
(Figure 2, Table S2). When this constraint was relaxed (calibration scheme 2 and 4:
66-‐117.5 mya), mean node age estimates still tended towards the upper limit of the
constraint. Removing the constraint entirely (calibration schemes 3 and 5) resulted in
much older age estimates than under either constraint, but also a much wider
distribution.
The age of nodes within the avian crown group (all descendants of node 4)
were strongly influenced by both the constraint on Neornithes and the clock model
(Table S2). For Passeriformes (node 38), the largest bird order, age estimates were
older under the uncorrelated clock model compared to the correlated model, and
became older when the constraint on Neornithes was relaxed (Figure 3, Table S2).
This pattern is representative of the trend across most ingroup nodes (Table S2).
Mean crown age estimates for Passeriformes (Figure 3) varied by up to 22 My
depending on whether the correlated or uncorrelated rate model was used, and by a
comparable margin depending on the constraint placed on Neornithes (e.g. 22 My
difference in mean age between calibration schemes 1 and 3 under the uncorrelated

336
clock model). Conversely, the alternative set of minimum constraints derived from
Mayr (2014) -‐ calibration schemes 4 and 5 – produced very similar results to the
more conservative minima implemented in Jarvis et al. (2014) (compared to
calibrations schemes 2 and 3, respectively).

337
Figure 2: Posterior node age distributions for Neornithes (node 4) for each calibration
scheme (1-‐5) and clock model: (A) correlated versus (B) uncorrelated. In calibration schemes
1, 2 and 4 (grey, purple, and yellow, respectively) this node is constrained (see Figure 1,
Table S1) whereas in calibration schemes 3 and 5 (red and green, respectively) this node is
unconstrained. Time is given in million years before the present.
100125150175200
Time (mya)
Calibration Scheme 1Calibration Scheme 2Calibration Scheme 3Calibration Scheme 4Calibration Scheme 5
Correlated Rates
Uncorrelated RatesB
A

338
Figure 3: Posterior node age distributions for Passeriformes (node 38) under each
calibration scheme (1-‐5) and clock model: (A) correlated versus (B) uncorrelated. Time is
given in million years before the present.
1100 90 80 70 60 50 40 30 20
Time (mya)
Calibration Scheme 1Calibration Scheme 2Calibration Scheme 3Calibration Scheme 4Calibration Scheme 5
Correlated Rates
Uncorrelated Rates
A
B

339
When the analysis was performed according to Jarvis et al. (2014) (calibration
scheme 1, correlated rates), I found that only three nodes (6.4% of all bird
divergences sampled) were older than the KPg boundary (Table 1, Table S2).
Switching from the correlated to the uncorrelated clock model caused the number of
nodes with mean ages older than the KPg to triple (up to 21.3%). When the constraint
on the maximum age of Neornithes was relaxed to 117.5 mya, this percentage further
increased to 29.8-‐63.8%. When I removed the maximum age constraint on
Neornithes, over three quarters of bird nodes in all analyses had mean age estimates
older than the KPg (Table 1).
Table 1: Number of crown-‐bird divergence events (i.e. nodes 4-‐50) that have estimated mean
node ages greater than 66 mya (KPg boundary), 75 mya and 85 mya for each calibration
scheme (1-‐5) and clock model (correlated versus uncorrelated). Percentage of total crown-‐
bird nodes (47 in total) is given in parentheses.
Analysis > 66 mya (KPg) >75 mya >85 mya 1 Correlated 3 (6.4%) 3 (6.4%) 1 (2.1%) 1 Uncorrelated 10 (21.3%) 2 (4.3%) 2 (4.3%) 2 Correlated 14 (29.8%) 3 (6.4%) 3 (6.4%) 2 Uncorrelated 26 (55.3%) 6 (12.8%) 2 (4.3%) 3 Correlated 37 (78.7%) 36 (76.6%) 24 (51.1%) 3 Uncorrelated 38 (80.9%) 35 (74.5%) 33 (70.2%) 4 Correlated 18 (38.3%) 3 (6.4%) 3 (6.4%) 4 Uncorrelated 30 (63.8%) 11 (23.4%) 2 (4.3%) 5 Correlated 37 (78.7%) 36 (76.6%) 24 (51.1%) 5 Uncorrelated 39 (83%) 35 (74.5%) 32 (68.1%)
For most analyses I found little reason to prefer a correlated clock over an
uncorrelated clock, or vice versa. While the correlated clock model receives a little
support over the uncorrelated model for calibration scheme 1 (Δ Bayes factor =
4.912), for all other comparisons the results were equivocal (Δ Bayes factor < 3).

340
Discussion
Molecular dating analyses based on the genomic dataset from Jarvis et al. (2014)
were strongly influenced by choice of clock model and maximum age constraints,
while the assignment of minimum age constraints based on a different interpretation
of the fossil record had relatively little effect (Figure 2, 3 and Table S2). Jarvis et al.
(2014) concluded that the main radiation of modern bird orders occurred following
the KPg boundary and global mass extinction ~66 mya. However, this conclusion was
not supported when either a different clock model or a maximum bound for
Neornithes was implemented (Table 1). Consequently, obtaining an accurate
timescale of bird evolution relies on correctly specifying these parameters.
Unfortunately, this process is not straightforward.
Determining minimum bounds from the fossil record is relatively simple: if a
fossil can be confidently assigned to a given clade, then the origin of that clade must
predate the age of the fossil. However, maximum bounds are a more difficult
proposition. To rigorously define a maximum bound, the fossil record must be
sufficiently well sampled such that we may have high confidence that a taxon would
have been detected were it present, even allowing for taphonomic biases and
misidentification. Further, this thorough sampling must be consistent through time
and across geographical areas. The Cretaceous fossil record of birds does not
currently meet these criteria meaning that we cannot confidently infer a maximum
bound for the diversification of Neornithes, particularly if modern birds originated in
the southern hemisphere (Brocklehurst, et al. 2012). Consequently, it is difficult to
defend any given choice of maximum bound and results that rely heavily on this
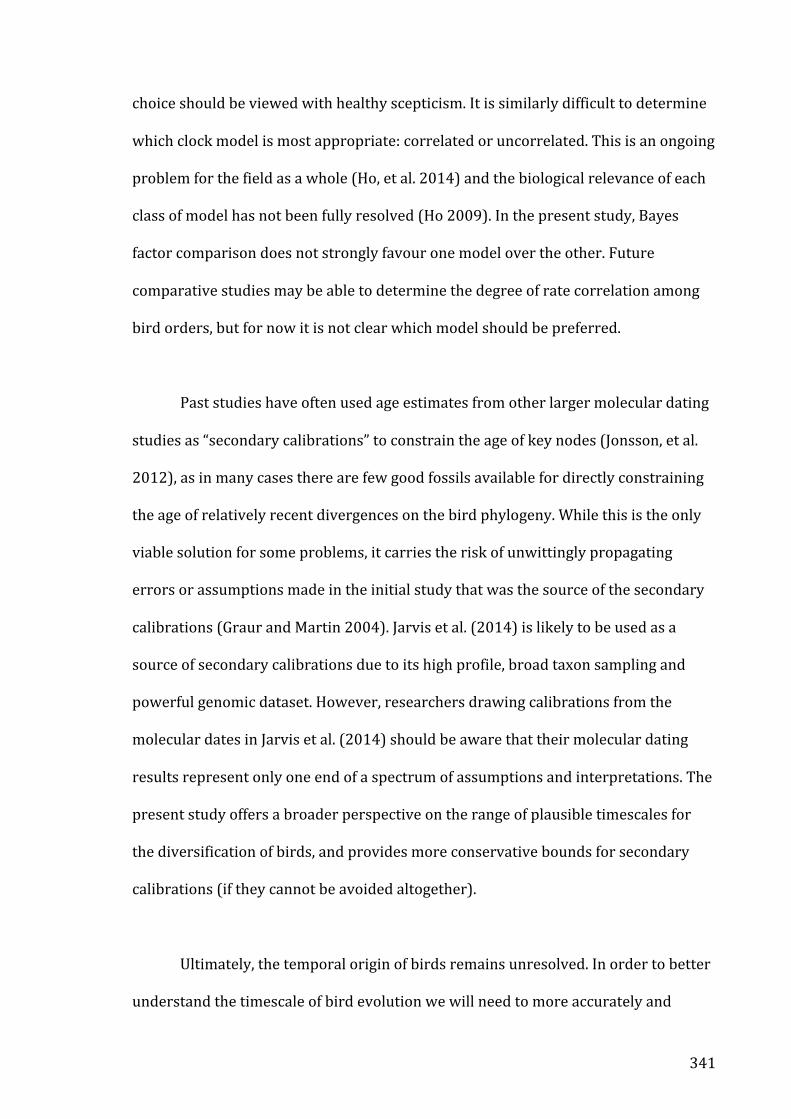
341
choice should be viewed with healthy scepticism. It is similarly difficult to determine
which clock model is most appropriate: correlated or uncorrelated. This is an ongoing
problem for the field as a whole (Ho, et al. 2014) and the biological relevance of each
class of model has not been fully resolved (Ho 2009). In the present study, Bayes
factor comparison does not strongly favour one model over the other. Future
comparative studies may be able to determine the degree of rate correlation among
bird orders, but for now it is not clear which model should be preferred.
Past studies have often used age estimates from other larger molecular dating
studies as “secondary calibrations” to constrain the age of key nodes (Jonsson, et al.
2012), as in many cases there are few good fossils available for directly constraining
the age of relatively recent divergences on the bird phylogeny. While this is the only
viable solution for some problems, it carries the risk of unwittingly propagating
errors or assumptions made in the initial study that was the source of the secondary
calibrations (Graur and Martin 2004). Jarvis et al. (2014) is likely to be used as a
source of secondary calibrations due to its high profile, broad taxon sampling and
powerful genomic dataset. However, researchers drawing calibrations from the
molecular dates in Jarvis et al. (2014) should be aware that their molecular dating
results represent only one end of a spectrum of assumptions and interpretations. The
present study offers a broader perspective on the range of plausible timescales for
the diversification of birds, and provides more conservative bounds for secondary
calibrations (if they cannot be avoided altogether).
Ultimately, the temporal origin of birds remains unresolved. In order to better
understand the timescale of bird evolution we will need to more accurately and

342
objectively estimate the molecular rate for branches deep in the bird phylogeny.
While genome scale data is a valuable resource for resolving phylogenies and
estimating relative branch lengths in terms of nucleotide changes, it is not a panacea
for molecular dating. The way in which temporal information is included and
modelled during analysis still has a large impact on the final results. A more robust
timescale for the evolution of birds will likely only come through new fossil
discoveries, or further integration of existing fossil data into the dating process (e.g.
Lee, et al. 2014).
Acknowledgements
Thanks to Matthew Phillips and Trevor Worthy for advice on analyses and
calibrations.

343
References
Alvarenga HMF. 1985. Um novo Psilopteridae (Aves: Gruiformes) dos sedimentos
Terciários de Itaboraí, Rio de Janeiro, Brasil. Congresso Brasileiro de Paleontologia
8:17-‐20.
Alvarenga HMF. 1983. Uma ave ratitae do Paleoceno Brasileiro: bacia calcária de
Itaboraí, Estado do Rio de Janeiro, Brasil. Boletim do Museu Nacional (Rio de Janeiro),
Geologia 41:1-‐8.
Bourdon E, Bouya BÇ, Iarochene M. 2005. Earliest African neornithine bird: a new
species of Prophaethontidae (Aves) from the Paleocene of Morocco. J Vertebr
Paleontol 25:157-‐170.
Bourdon E, Mourer-‐Chauviré C, Amaghzaz M, Bouya Bd. 2008. New specimens of
Lithoptila abdounensis (Aves, Prophaethontidae) from the lower Paleogene of
Morocco. J Vertebr Paleontol 28:751-‐761.
Brocklehurst N, Upchurch P, Mannion PD, O'Connor J. 2012. The completeness of the
fossil record of Mesozoic birds: implications for early avian evolution. PLoS ONE
7:e39056.
Cooper A, Penny D. 1997. Mass Survival of Birds Across the Cretaceous-‐ Tertiary
Boundary: Molecular Evidence. Science 275:1109-‐1113.
Drummond AJ, Ho SYW, Phillips MJ, Rambaut A. 2006. Relaxed phylogenetics and
dating with confidence. PLoS Biol 4:699-‐710.
Drummond AJ, Rambaut A. 2007. BEAST: Bayesian evolutionary analysis by sampling
trees. BMC Evol Biol 7.
Elzanowski A, Stidham TA. 2011. A galloanserine quadrate from the Late Cretaceous
Lance Formation of Wyoming. The Auk 128:138-‐145.
Gillooly JF, Allen AP, West GB, Brown JH. 2005. The rate of DNA evolution: Effects of
body size and temperature on the molecular clock. Proc Natl Acad Sci U S A 102:140-‐
145.
Graur D, Martin W. 2004. Reading the entrails of chickens: molecular timescales of
evolution and the illusion of precision. Trends Genet 20:80-‐86.
344
Haddrath O, Baker AJ. 2012. Multiple nuclear genes and retroposons support
vicariance and dispersal of the palaeognaths, and an Early Cretaceous origin of
modern birds. Proc R Soc B 279:4617-‐4625.
Ho SY, Duchene S, Duchene D. 2014. Simulating and detecting autocorrelation of
molecular evolutionary rates among lineages. Mol Ecol Resour.
Ho SYW. 2009. An examination of phylogenetic models of substitution rate variation
among lineages. Biol Lett 5:421-‐424.
Jarvis ED, Mirarab S, Aberer AJ, Li B, Houde P, Li C, Ho SYW, Faircloth BC, Nabholz B,
Howard JT, et al. 2014. Whole-‐genome analyses resolve early branches in the tree of
life of modern birds. Science 346:1320-‐1331.
Jetz W, Thomas GH, Joy JB, Hartmann K, Mooers AO. 2012. The global diversity of
birds in space and time. Nature 491:444-‐448.
Jonsson K, Fabre P-‐H, Irestedt M. 2012. Brains, tools, innovation and biogeography in
crows and ravens. BMC Evol Biol 12:72.
Kristoffersen AV. 2002. An early Paleogene trogon (Aves: Trogoniformes) from the
Fur Formation, Denmark. J Vertebr Paleontol 22:661-‐666.
Ksepka DT, Clarke JA. 2010. Primobucco mcgrewi (Aves: Coracii) from the Eocene
Green River Formation: New anatomical data from the earliest constrained record of
stem rollers. J Vertebr Paleontol 30:215-‐225.
Ksepka DT, Ware JL, Lamm KS. 2014. Flying rocks and flying clocks: disparity in fossil
and molecular dates for birds. Proc R Soc B 281.
Lanfear R, Thomas JA, Welch JJ, Brey T, Bromham L. 2007. Metabolic rate does not
calibrate the molecular clock. Proceedings of the National Academy of Sciences
104:15388-‐15393.
Lee MSY, Cau A, Naish D, Dyke GJ. 2014. Morphological Clocks in Paleontology, and a
Mid-‐Cretaceous Origin of Crown Aves. Syst Biol 63:442-‐449.
Louchart A, Tourment N, Carrier J. 2011. The earliest known pelican reveals 30
million years of evolutionary stasis in beak morphology. J Ornithol 152:15-‐20.
Mayr G. 2014. The origins of crown group birds: molecules and fossils. Palaeontology
57:231-‐242.

345
Mayr G. 2009. Palaeognathous Birds. In. Paleogene Fossil Birds. Berlin: Springer-‐
Verlag. p. 25-‐34.
Mayr G. 2003. Phylogeny of Early Tertiary swifts and hummingbirds (Aves:
Apodiformes). The Auk 120:145-‐151.
Mourer-‐Chauviré C. 1993. Les gangas (Aves, Columbiformes, Pteroclidae) du
Paléogène et du Miocène inférieur de France. Palaeovertebrata 22:73-‐98.
Mourer-‐Chauviré C, Tabuce R, El Mabrouk E, Marivaux L, Khayati H, Vianey-‐Liaud M,
Ben Haj Ali M. 2013. A new taxon of stem group Galliformes and the earliest record
for stem group Cuculidae from the Eocene of Djebel Chambi, Tunisia. In: Göhlich UB,
Kroh A, editors. Paleornithological Research 2013 -‐ Proceedings of the 8th
International Meeting of the Society of Avian Paleontology and Evolution. Vienna:
Natural History Museum Vienna. p. 1-‐15.
Peters DS. 1983. Die „Schnepfenralle“ Rhynchaeites messelensis Wittich 1898 ist ein
Ibis. Journal für Ornithologie 124:1-‐27.
Slack KE, Jones CM, Ando T, Harrison GL, Fordyce RE, Arnason U, Penny D. 2006. Early
penguin fossils, plus mitochondrial genomes, calibrate avian evolution. Mol Biol Evol
23:1144-‐1155.
Suchard MA, Weiss RE, Sinsheimer JS. 2001. Bayesian selection of continuous-‐time
Markov chain evolutionary models. Mol Biol Evol 18:1001-‐1013.
Yang Z. 2007. PAML 4: a program package for phylogenetic analysis by maximum
likelihood. Mol Biol Evol 24:1586-‐1591.
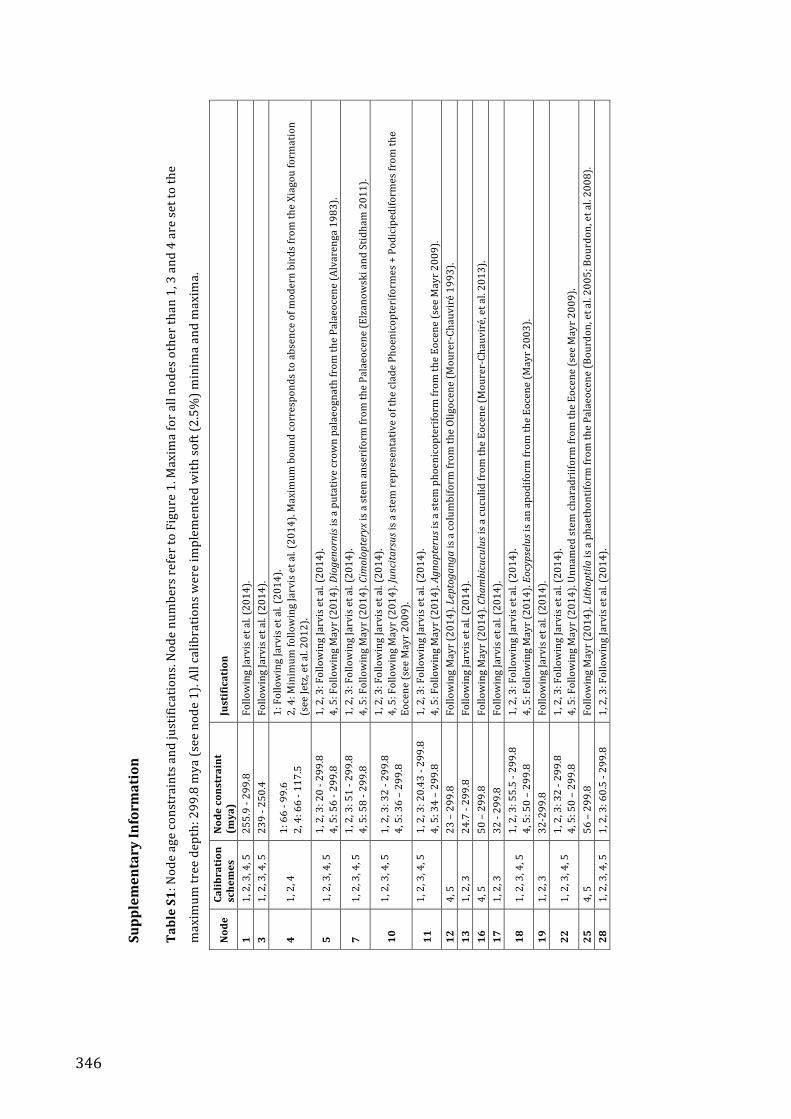
346
Supplementary Information
Supplementary,Inform
ation,
, Table,S1:"Node"age"constraints"and"justifications."Node"numbers"refer"to"Figure"1."Maxima"for"all"nodes"other"than"1,"3"and"4"are"set"to"the"
maximum
"tree"depth:"299.8"mya"(see"node"1)."All"calibrations"were"implem
ented"with"soft"(2.5%)"m
inima"and"maxima."
Node,
Calibration,
schemes,
Node,constraint,
(mya),
Justification,
1,1,"2,"3,"4,"5"
255.9"I"299.8"
Following"Jarvis"et"al."(2014)."
3,1,"2,"3,"4,"5"
239"I"250.4"
Following"Jarvis"et"al."(2014)."
4,1,"2,"4"
1:"66"I"99.6"
2,"4:"66"I"117.5"
1:"Following"Jarvis"et"al."(2014)."
2,"4:"M
inimum
"following"Jarvis"et"al."(2014)."Maximum
"bound"corresponds"to"absence"of"modern"birds"from"the"Xiagou"formation"
(see"Jetz,"et"al."2012)."
5,1,"2,"3,"4,"5"
1,"2,"3:"20"I"299.8"
4,"5:"56"I"299.8"
1,"2,"3:"Following"Jarvis"et"al."(2014)."
4,"5:"Following"Mayr"(2014)."Diogenornis"is"a"putative"crow
n"palaeognath"from
"the"Palaeocene"(Alvarenga"1983).""
7,1,"2,"3,"4,"5"
1,"2,"3:"51"I"299.8"
4,"5:"58"I"299.8"
1,"2,"3:"Following"Jarvis"et"al."(2014)."
4,"5:"Following"Mayr"(2014)."Cimolopteryx"is"a"stem
"anseriform"from
"the"Palaeocene"(Elzanow
ski"and"Stidham"2011)."
10,
1,"2,"3,"4,"5"
"1,"2,"3:"32"I"299.8"
4,"5:"36"–"299.8"
1,"2,"3:"Following"Jarvis"et"al."(2014)."
4,"5:"Following"Mayr"(2014)."Juncitarsus"is"a"stem
"representative"of"the"clade"Phoenicopteriformes"+"Podicipediformes"from
"the"
Eocene"(see"Mayr"2009)."
11,
1,"2,"3,"4,"5"
"1,"2,"3:"20.43"I"299.8"
4,"5:"34"–"299.8"
1,"2,"3:"Following"Jarvis"et"al."(2014)."
4,"5:"Following"Mayr"(2014)."Agnopterus"is"a"stem
"phoenicopteriform"from
"the"Eocene"(see"Mayr"2009)."
12,
4,"5"
23"–"299.8"
Following"Mayr"(2014)."Leptoganga"is"a"columbiform"from
"the"Oligocene"(MourerIChauviré"1993)."
13,
1,"2,"3"
24.7"I"299.8"
Following"Jarvis"et"al."(2014)."
16,
4,"5"
50"–"299.8"
Following"Mayr"(2014)."Cham
bicuculus"is"a"cuculid"from
"the"Eocene"(M
ourerIChauviré,"et"al."2013)."
17,
1,"2,"3"
32"I"299.8"
Following"Jarvis"et"al."(2014)."
18,
1,"2,"3,"4,"5"
1,"2,"3:"55.5"I"299.8"
4,"5:"50"–"299.8"
1,"2,"3:"Following"Jarvis"et"al."(2014)."
4,"5:"Following"Mayr"(2014)."Eocypselus"is"an"apodiform"from
"the"Eocene"(M
ayr"2003)."
19,
1,"2,"3"
32I299.8"
Following"Jarvis"et"al."(2014)."
22,
1,"2,"3,"4,"5"
1,"2,"3:"32"I"299.8"
4,"5:"50"–"299.8"
1,"2,"3:"Following"Jarvis"et"al."(2014)."
4,"5:"Following"Mayr"(2014)."Unnamed"stem
"charadriiform"from
"the"Eocene"(see"Mayr"2009)."
25,
4,"5"
56"–"299.8"
Following"Mayr"(2014)."Lithoptila"is"a"phaethontiform"from
"the"Palaeocene"(Bourdon,"et"al."2005;"Bourdon,"et"al."2008)."
28,
1,"2,"3,"4,"5"
1,"2,"3:"60.5"I"299.8"
1,"2,"3:"Following"Jarvis"et"al."(2014)."

347
Node,
Calibration,
schemes,
Node,constraint,
(mya),
Justification,
4,"5:"61"I299.8"
4,"5:"Following"M
ayr"(2014)."Waimanu"is"a"stem"sphenisciform"from
"the"Palaeocene"(Slack,"et"al."2006)."
30,
1,"2,"3,"4,"5"
1,"2,"3:"47"I"299.8"
4,"5:"50"I"299.8"
1,"2,"3:"Following"Jarvis"et"al."(2014)."
4,"5:"Following"M
ayr"(2014)."Rhynchaeites"is"a"ciconiiform"from
"the"Eocene"(Peters"1983)."
31,
1,"2,"3"
25.3"I"299.8"
Following"Jarvis"et"al."(2014)."
32,
4,"5"
26"–"299.8"
Following"M
ayr"(2014)."Pelecanus"is"a"pelecaniform"from
"the"O
ligocene"(Louchart,"et"al."2011)."
34,
4,"5"
56"–"299.8"
Following"M
ayr"(2014)."Paleopsilopterus"is"a"stem
"cariamiform"from
"the"Palaeocene"(Alvarenga"1985)."
35,
1,"2,"3"
54.6"–"299.8"
Following"Jarvis"et"al."(2014)."
36,
4,"5"
54.6"–"299.8"
Following"M
ayr"(2014)."Unnamed"stem
"passeriform"from
"the"T
ingamarra"LF"(see"Mayr"2009)."
39,
1,"2,"3"
13.6"–"299.8"
Following"Jarvis"et"al."(2014)."
41,
1,"2,"3"
7.2"–"299.8"
Following"Jarvis"et"al."(2014)."
43,
4,"5"
38"–"299.8"
Following"M
ayr"(2014)."Milvoides"is"a"stem
"accipitriform"from
"the"Eocene."
45,
1,"2,"3"
1,"2,"3:"56.8"–"299.8"
Following"Jarvis"et"al."(2014)."
48,
1,"2,"3,"4,"5"
1,"2,"3:"55.5"–"299.8"
4,"5:"56"–"299.8"
1,"2,"3:"Following"Jarvis"et"al."(2014)."
4,"5:"Following"M
ayr"(2014)."Septentrogon"is"a"trogoniform"from
"the"Palaeocene"(Kristoffersen"2002)."
49,
1,"2,"3"
47"–"299.8"
Following"Jarvis"et"al."(2014)."
50,
4,"5"
51"–"299.8"
Following"M
ayr"(2014)."Primobucco"is"a"coraciiform"from
"the"Eocene"(Ksepka"and"Clarke"2010)."
" " Table,S2:"M
ean"ages"and"95%HPD"bounds"(m
ya)"for"analyses"under"each"calibration"scheme"(1I5)"and"clock"model"(correlated"versus"
uncorrelated)."Mean"ages"older"than"66"mya"are"shown"in"bold"font."
Node,
Calibration,schem
e,,
1,Correlated,
1,Uncorrelated,
2,Correlated,
2,Uncorrelated,
3,Correlated,
3,Uncorrelated,
4,Correlated,
4,Uncorrelated,
5,Correlated,
5,Uncorrelated,
1"284.7"
(265I301.2)"
286.38"
(266.3I302)"
284.76"
(265.71I301)"
287.19"
(267I301.6)"
283.51"
(265I301.2)"
289.49"
(271I302.2)"
284.72"
(265.5I301.4)"
287.46"
(267.9I301.9)"
283.36"
(264.56I301)"
289.49"
(270.9I302.1)"
2"271.21"
(255.4I288.6)"
272.88"
(254.6I292.3)"
271.56"
(256.2I288.2)"
274.35"
(255.9I293.4)"
269.42"
(255.7I284.3)"
278.26"
(260.5I297.1)"
271.36"
(256I287.9)"
274.65"
(256.3I293.9)"
269.33"
(255.2I283.8)"
278.27"
(259.8I296.8)"

348
Node,
Calibration,schem
e,,
1,Correlated,
1,Uncorrelated,
2,Correlated,
2,Uncorrelated,
3,Correlated,
3,Uncorrelated,
4,Correlated,
4,Uncorrelated,
5,Correlated,
5,Uncorrelated,
3"244.0
3"(238.9I250.2
)"244.1
"(238.8I250.2
)"244.1
5"(238.9I250.3
)"244.2
6"(238.9I250.3
)"245.2
9"(239.2I250.6
)"244.7
"(239I250.4)"
244.0
6"(238.8I250.1
)"244.2
"(238.8I250.2
)"245.2
7"(239.2I250.6
)"244.6
9"(239I250.4)"
4"99.43,
(94.6
6I103.9
)"97.65,
(90.7
3I102.6
)"116.24"
(108.7I122.8
)"113.63"
(102I121.6)"
162.3,
(137.8I185.8
)"169.33,
(131.6I205.5
)"117,
(109.8I123.6
)"114.56"
(104.7I122.1
)"162.32"
(138.4I186.1
)"171.17,
(135.1I206.4
)"
5"77.31,
(65.0
9I86.92
)"68.41,
(46.4
6I87.2)"
89.74,
(75.5
4I101.6
)"78.16,
(53.4
1I101.9
)"130.56,
(101.4I157.5
)"114.97,
(69.5
8I161.8
)"91.01,
(76.5
7I102.8
)"80.28,
(58.3
I101.26
)"130.63,
(102.7I158.5
)"116.26,
(68.3
6I162.2
)"
6"83.18,
(77.9
I88.3
)"85.17,
(76.8
2I93.02
)"95.28,
(87.4
4I102.5
)"96.85,
(85.3
6I109.4
)"133.61"
(109.2I157.7
)"139.13"
(104.49
I175)"
96.73"
(89.4
4I103.6
)"98.56"
(87.2
5I109.6
)"133.64"
(109.3I157.1
)"140.86,
(106.5I175.7
)"7"
64.39
"(56.8
4I72.06
)"65.63
"(51.3
7I78.04
)"72.54,
(62.4
4I81.74
)"73.68"
(57.6
5I90.47
)"101.4,
(77.8
2I124.2
)"104.62,
(71.5
3I139.1
)"74.3,
(64.5
6I83.17
)"75.74,
(61.3
7I90.64
)"101.59"
(79.1
1I124.8
)"105.54"
(72.9
3I140.8
)"8"
20.46
"(11.8
7I29.63
)"27.65
"(13.3
I44.4
4)"
22.73
"(13.3
2I32.74
)"31.13
"(14.2
9I49.36
)"32.11
"(16.9
8I49.32
)"45.06
"(17.6
9I76.5)"
23.37
"(13.7
2I34)"
31.63
"(14.9
4I51.77
)"32.08
"(16.8
7I49.12
)"45.19
"(18.2
7I77.52
)"9"
65.41
"(60.0
1I70.7)"
71.08"
(63.1
1I79.18
)"72.86,
(65.4
6I79.93
)"78.03,
(67.0
6I89.99
)"100.97"
(79.2
8I122.3
)"106.86,
(77.5
9I136.7
)"74.68,
(68.0
2I81.72
)"80.46"
(69.5
4I91.77
)"100.88"
(79.8
2I121.3
)"108.41,
(80.5
5I137.8
)"10"
64.31
"(59.0
2I69.65
)"69.4,
(61.5
3I77.58
)"71.58,
(64.4
6I78.75
)"76.16"
(65.1
7I87.85
)"99.19,
(77.7
I120.14
)"104.22"
(75.3
9I133.1
)"73.41,
(66.7
1I80.27
)"78.71,
(68.2
5I90.33
)"99.11"
(78.4
1I119.3
)"105.96"
(78.0
7I134.3
)"11"
50.19
"(44.0
2I56.4)"
47.06
"(26.3
6I65.99
)"55.5"
(48.0
8I63)"
52.16
"(27.4
2I72.71
)"76.72,
(58.9
I95.4
)"70.71,
(35.6
9I106.5
)"57.25
"(48.8
5I65.25
)"52.39
"(30.6
3I73.27
)"76.85,
(58.3
8I95.83
)"69.31,
(34.0
1I103.9
)"12"
61.2"
(55.9
7I66.46
)"65.05
"(56.7
3I73.7)"
68"
(60.7
4I74.59
)"71.36,
(60.1
3I83.1)"
94.19,
(73.3
3I114.1
)"97.59"
(70.8
1I126)"
69.87"
(63.2
9I76.52
)"74.36"
(63.8
1I86.19
)"94.21"
(74.8
5I114.1
)"99.96"
(73.9
7I128.3
)"13"
57.35
"(52.1
I62.6
1)"
59.69
"(50.0
8I69.89
)"63.59
"(56.6
5I70.18
)"65.49
"(53.1
5I78.07
)"88.05"
(68.2
9I107.1
)"89.31"
(63.3
6I117.7
)"65.45
"(59.1
I72.1
4)"
68.81,
(57.8
2I80.79
)"88.12,
(69.5
2I106.9
)"92.25"
(66.7
1I119.1
)"14"
64.14
"(58.8
5I69.42
)"69.68"
(62.0
7I77.74
)"71.39,
(64.4
1I78.69
)"76.44,
(65.5
6I87.99
)"98.9"
(77.0
4I119.4
)"104.65"
(76.4
5I134.3
)"73.17,
(66.6
2I80.13
)"78.74"
(68.3
7I90)"
98.78,
(77.8
I118.6)"
105.98,
(79.4
5I135.6
)"15"
62.64
"(57.4
4I67.89
)"67.55"
(59.7
4I75.34
)"69.66,
(62.4
2I76.37
)"74.11"
(63.5
5I85.68
)"96.49,
(75.8
7I117.3
)"101.39,
(74.0
7I130.3
)"71.42,
(64.8
1I78.1)"
76.42,
(65.6
9I87.18
)"96.37"
(75.8
9I115.8
)"102.76,
(75.9
7I130.6
)"16"
60.78
"(55.7
2I66.05
)"64.82
"(57I72.87
)"67.54"
(60.3
6I74.02
)"71.13,
(61.1
4I83.07
)"93.52,
(73.5
5I113.9
)"97.2,
(71.1
8I125.7
)"69.27"
(62.8
7I75.91
)"73.56"
(63.3
2I84.74
)"93.41"
(74.0
2I113)"
98.79"
(72.2
7I125.5
)"17"
57.6"
(52.4
8I62.67
)"60.27
"(51.2
I69.1
8)"
63.91
"(57.3
1I70.72
)"66.22"
(54.6
1I77.95
)"88.47,
(69.5
3I108)"
90.22,
(64.2
5I117.3
)"65.6"
(59.5
4I72.25
)"68.82,
(58.0
3I80.02
)"88.36,
(69.6
4I106.9
)"92.24"
(67.1
1I118.4
)"

349
Node,
Calibration,schem
e,,
1,Correlated,
1,Uncorrelated,
2,Correlated,
2,Uncorrelated,
3,Correlated,
3,Uncorrelated,
4,Correlated,
4,Uncorrelated,
5,Correlated,
5,Uncorrelated,
18"
58.7"
(53.8
2I63.97
)"62.86
"(54.6
6I71.48
)"65.17
"(58.5
4I71.82
)"68.88,
(57.6
3I80.66
)"90.22"
(70.2
5I109.4
)"94.01"
(67.6
2I121.8
)"66.85"
(60.5
6I73.36
)"70.98"
(60.0
8I82.36
)"90.08,
(71.0
7I108.8
)"95.28"
(69.3
8I122.1
)"19"
41.42
"(34.9
7I47.48
)"44.49
"(31.5
2I57.37
)"45.79
"(38.5
2I53.22
)"48.53
"(33.6
I64.4
5)"
63.15
"(47.0
2I79.12
)"65.92
"(39.8
1I93.05
)"47.67
"(39.9
7I55.08
)"53"
(36.3
2I69.13
)"64.02
"(47.9
1I80.2)"
71.01,
(44.6
7I99.53
)"20"
62.62
"(57.5
4I68)"
68.33"
(60.8
4I76.22
)"69.64"
(62.5
5I76.6)"
74.91,
(64.4
7I86.39
)"96.46,
(75.9
5I117.4
)"102.54"
(74.6
9I131.4
)"71.35"
(64.9
8I78.23
)"77.01"
(66.7
5I87.97
)"96.27,
(75.9
6I115.8
)"103.55"
(76.2
3I131.2
)"21"
61.78
"(56.6
4I67.01
)"67.12,
(59.6
4I74.92
)"68.68"
(61.8
9I75.78
)"73.59,
(63.4
8I85.21
)"95.12,
(74.2
I115.17
)"100.68"
(74.2
8I130)"
70.34"
(63.8
5I76.95
)"75.55"
(65.3
1I86.39
)"94.87,
(75.1
8I114.6
)"101.49"
(75.1
7I128)"
22"
60.01
"(54.9
8I65.22
)"64.79
"(57.1
1I72.64
)"66.65"
(59.7
I73.3
1)"
71.06"
(60.6
2I82.32
)"92.29,
(71.9
6I111.9
)"97.09"
(70.8
8I125.2
)"68.21"
(61.7
1I74.56
)"72.67"
(62.3
1I83.65
)"91.94"
(72.6
2I111)"
97.44,
(72.0
2I124.5
)"23"
61.27
"(56.2
8I66.6)"
67.18"
(59.6
8I74.83
)"68.08,
(61.1
I74.8
8)"
73.6"
(63.4
2I85.02
)"94.28"
(73.7
9I114.5
)"100.75"
(73.5
1I129.4
)"69.76"
(63.3
I76.2
9)"
75.62"
(65.5
2I86.34
)"94.07,
(74.7
4I113.8
)"101.61,
(75.6
7I129.7
)"24"
60.13
"(55.2
1I65.4)"
65.78
"(58.3
I73.3
4)"
66.79"
(60.2
5I73.84
)"72.03,
(61.8
8I83.26
)"92.48,
(72.1
3I112.1
)"98.54,
(71.7
3I126.6
)"68.42,
(61.9
9I74.8)"
73.91"
(63.8
9I84.44
)"92.23,
(73.4
I111.76
)"99.24"
(73.2
4I126.1
)"25"
55.36
"(50.5
6I60.43
)"60.56
"(51.8
8I68.89
)"61.37
"(54.1
9I67.25
)"66.32,
(55.8
4I78.3)"
84.96,
(66.4
5I103.8
)"90.54"
(64.9
5I117.8
)"63.02
"(57.1
2I69.43
)"67.53"
(56.3
I79.1
9)"
84.85"
(67I102.8
8)"
90.03,
(64.0
1I116.6
)"26"
58.3"
(53.3
8I63.4)"
63.77
"(56.5
I71.4
7)"
64.69
"(58.0
2I71.27
)"69.76,
(60.0
7I81.03
)"89.57,
(70.0
3I108.9
)"95.33"
(68.9
6I122.3
)"66.24,
(60.2
I72.6
8)"
71.46,
(61.9
8I82.33
)"89.26,
(70.6
8I108)"
95.81"
(70.9
1I122.6
)"27"
56.52
"(51.6
7I61.52
)"61.87
"(54.6
8I69.53
)"62.68
"(56.5
8I69.47
)"67.59,
(57.6
5I78.34
)"86.76,
(67.7
7I105.5
)"92.28"
(66.8
I118.9)"
64.12
"(58.2
1I70.44
)"69.19"
(59.5
1I79.8)"
86.37,
(68.6
7I105)"
92.61"
(67.8
1I118.7
)"28"
54.96
"(50.3
1I60.03
)"60.11
"(52.8
5I67.67
)"60.91
"(54.4
4I66.96
)"65.6"
(55.6
8I76.03
)"84.29,
(66.0
5I102.9
)"89.39"
(65.2
1I116)"
62.26
"(56.4
1I68.42
)"67.18,
(57.6
3I77.85
)"83.83,
(66.5
4I102)"
89.75,
(65.5
9I115.6
)"29"
22.66
"(15.2
1I30.34
)"16.24
"(5.64
I30.5
)"24.96
"(16.8
4I33.64
)"17.77
"(5.91
I33.4
6)"
34.65
"(21.1
6I49.2)"
24.85
"(7.39
I49.0
8)"
25.52
"(17.2
6I34.37
)"17.79
"(6.34
I32.4
1)"
34.3"
(20.5
6I48.4)"
25.06
"(7.77
I49.8
)"30"
53.9"
(49.2
4I58.9)"
59"
(51.1
7I67.08
)"59.72
"(53.5
8I66.06
)"64.4"
(54.1
I75.6
4)"
82.65"
(64.6
9I100.8
)"87.76,
(63.0
6I114.2
)"61.09
"(55.2
5I67.27
)"65.9"
(55.4
6I77)"
82.25,
(64.7
7I99.7)"
87.97,
(64.3
3I114.7
)"31"
52.23
"(47.5
9I57.14
)"57.16
"(49.2
4I65.64
)"57.83
"(51.7
8I64.04
)"62.36
"(52.3
2I74.07
)"80.03"
(62.6
2I97.83
)"84.86"
(60.5
7I110.8
)"59.14
"(53.2
9I65.19
)"63.62
"(52.4
5I74.48
)"79.61,
(62.6
3I96.6)"
84.75,
(60.7
I110.24
)"32"
49.74
"(44.9
8I54.48
)"54.57
"(45.8
7I63.32
)"55.04
"(48.6
6I60.74
)"59.49
"(49.1
5I71.69
)"76.16,
(59.4
5I93.27
)"80.85,
(56.7
3I106.1
)"56.23
"(50.3
4I62.27
)"60.18
"(48.6
4I71.6)"
75.67"
(59.4
2I92.17
)"79.9,
(56.5
2I105.5
)"
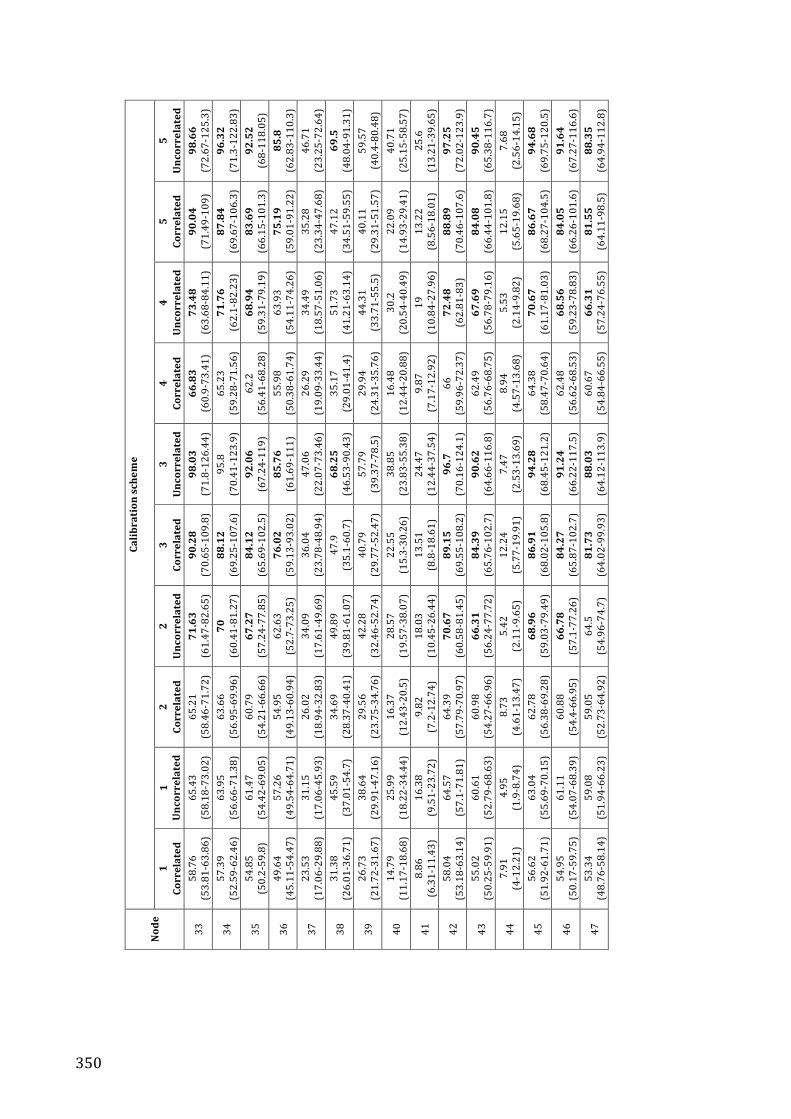
350
Node,
Calibration,schem
e,,
1,Correlated,
1,Uncorrelated,
2,Correlated,
2,Uncorrelated,
3,Correlated,
3,Uncorrelated,
4,Correlated,
4,Uncorrelated,
5,Correlated,
5,Uncorrelated,
33"
58.76
"(53.8
1I63.86
)"65.43
"(58.1
8I73.02
)"65.21
"(58.4
6I71.72
)"71.63"
(61.4
7I82.65
)"90.28,
(70.6
5I109.8
)"98.03"
(71.8
I126.44
)"66.83,
(60.9
I73.4
1)"
73.48,
(63.6
8I84.11
)"90.04,
(71.4
9I109)"
98.66"
(72.6
7I125.3
)"34"
57.39
"(52.5
9I62.46
)"63.95
"(56.6
6I71.38
)"63.66
"(56.9
5I69.96
)"70,
(60.4
1I81.27
)"88.12,
(69.2
5I107.6
)"95.8"
(70.4
1I123.9
)"65.23
"(59.2
8I71.56
)"71.76,
(62.1
I82.2
3)"
87.84"
(69.6
7I106.3
)"96.32,
(71.3
I122.83
)"35"
54.85
"(50.2
I59.8
)"61.47
"(54.4
2I69.05
)"60.79
"(54.2
1I66.66
)"67.27,
(57.2
4I77.85
)"84.12"
(65.6
9I102.5
)"92.06,
(67.2
4I119)"
62.2"
(56.4
1I68.28
)"68.94,
(59.3
1I79.19
)"83.69"
(66.1
5I101.3
)"92.52,
(68I118.0
5)"
36"
49.64
"(45.1
1I54.47
)"57.26
"(49.5
4I64.71
)"54.95
"(49.1
3I60.94
)"62.63
"(52.7
I73.2
5)"
76.02"
(59.1
3I93.02
)"85.76"
(61.6
9I111)"
55.98
"(50.3
8I61.74
)"63.93
"(54.1
1I74.26
)"75.19,
(59.0
1I91.22
)"85.8"
(62.8
3I110.3
)"37"
23.53
"(17.0
6I29.88
)"31.15
"(17.0
6I45.93
)"26.02
"(18.9
4I32.83
)"34.09
"(17.6
1I49.69
)"36.04
"(23.7
8I48.94
)"47.06
"(22.0
7I73.46
)"26.29
"(19.0
9I33.44
)"34.49
"(18.5
7I51.06
)"35.28
"(23.3
4I47.68
)"46.71
"(23.2
5I72.64
)"38"
31.38
"(26.0
1I36.71
)"45.59
"(37.0
1I54.7)"
34.69
"(28.3
7I40.41
)"49.89
"(39.8
1I61.07
)"47.9"
(35.1
I60.7
)"68.25,
(46.5
3I90.43
)"35.17
"(29.0
1I41.4)"
51.73
"(41.2
1I63.14
)"47.12
"(34.5
1I59.55
)"69.5,
(48.0
4I91.31
)"39"
26.73
"(21.7
2I31.67
)"38.64
"(29.9
1I47.16
)"29.56
"(23.7
5I34.76
)"42.28
"(32.4
6I52.74
)"40.79
"(29.7
7I52.47
)"57.79
"(39.3
7I78.5)"
29.94
"(24.3
1I35.76
)"44.31
"(33.7
1I55.5)"
40.11
"(29.3
1I51.57
)"59.57
"(40.4
I80.4
8)"
40"
14.79
"(11.1
7I18.68
)"25.99
"(18.2
2I34.44
)"16.37
"(12.4
3I20.5)"
28.57
"(19.5
7I38.07
)"22.55
"(15.3
I30.2
6)"
38.85
"(23.8
3I55.38
)"16.48
"(12.4
4I20.88
)"30.2"
(20.5
4I40.49
)"22.09
"(14.9
3I29.41
)"40.71
"(25.1
5I58.57
)"41"
8.86"
(6.31
I11.4
3)"
16.38
"(9.51
I23.7
2)"
9.82"
(7.2I12.74
)"18.03
"(10.4
5I26.44
)"13.51
"(8.8I18.61
)"24.47
"(12.4
4I37.54
)"9.8
7"(7.17
I12.9
2)"
19"
(10.8
4I27.96
)"13.22
"(8.56
I18.0
1)"
25.6"
(13.2
1I39.65
)"42"
58.04
"(53.1
8I63.14
)"64.57
"(57.1
I71.8
1)"
64.39
"(57.7
9I70.97
)"70.67"
(60.5
8I81.45
)"89.15,
(69.5
5I108.2
)"96.7"
(70.1
6I124.1
)"66,
(59.9
6I72.37
)"72.48"
(62.8
1I83)"
88.89"
(70.4
6I107.6
)"97.25"
(72.0
2I123.9
)"43"
55.02
"(50.2
5I59.91
)"60.61
"(52.7
9I68.63
)"60.98
"(54.2
7I66.96
)"66.31,
(56.2
4I77.72
)"84.39,
(65.7
6I102.7
)"90.62,
(64.6
6I116.8
)"62.49
"(56.7
6I68.75
)"67.69,
(56.7
8I79.16
)"84.08,
(66.4
4I101.8
)"90.45"
(65.3
8I116.7
)"44"
7.91"
(4I12.2
1)"
4.95"
(1.9I8.7
4)"
8.73"
(4.61
I13.4
7)"
5.42"
(2.11
I9.65
)"12.24
"(5.77
I19.9
1)"
7.47"
(2.53
I13.6
9)"
8.94"
(4.57
I13.6
8)"
5.53"
(2.14
I9.82
)"12.15
"(5.65
I19.6
8)"
7.68"
(2.56
I14.1
5)"
45"
56.62
"(51.9
2I61.71
)"63.04
"(55.6
9I70.15
)"62.78
"(56.3
8I69.28
)"68.96,
(59.0
3I79.49
)"86.91,
(68.0
2I105.8
)"94.28"
(68.4
5I121.2
)"64.38
"(58.4
7I70.64
)"70.67"
(61.1
7I81.03
)"86.67,
(68.2
7I104.5
)"94.68"
(69.7
5I120.5
)"46"
54.95
"(50.1
7I59.75
)"61.11
"(54.0
7I68.39
)"60.88
"(54.4
I66.9
5)"
66.78,
(57.1
I77.2
6)"
84.27,
(65.8
7I102.7
)"91.24,
(66.2
2I117.5
)"62.48
"(56.6
2I68.53
)"68.56,
(59.2
3I78.83
)"84.05,
(66.2
6I101.6
)"91.64,
(67.2
7I116.6
)"47"
53.34
"(48.7
6I58.14
)"59.08
"(51.9
4I66.23
)"59.05
"(52.7
3I64.92
)"64.5"
(54.9
6I74.7)"
81.73,
(64.0
2I99.93
)"88.03,
(64.1
2I113.9
)"60.67
"(54.8
4I66.55
)"66.31,
(57.2
4I76.55
)"81.55,
(64.1
1I98.5)"
88.35"
(64.9
4I112.8
)"

351
Node,
Calibration,schem
e,,
1,Correlated,
1,Uncorrelated,
2,Correlated,
2,Uncorrelated,
3,Correlated,
3,Uncorrelated,
4,Correlated,
4,Uncorrelated,
5,Correlated,
5,Uncorrelated,
48"
50.27
"(45.7
9I54.93
)"55.28
"(48.6
3I62.82
)"55.58
"(49.6
1I61.23
)"60.06
"(50.9
I70.2
8)"
76.9"
(59.5
I93.5
7)"
81.74"
(58.4
8I106.1
)"57.24
"(51.7
1I63.03
)"61.87"
(52.6
3I72.02
)"76.8,
(60.3
2I93.1)"
81.48"
(59.5
4I105)"
49"
46.97
"(42.5
7I51.52
)"50.45
"(43.0
1I58.32
)"51.88
"(45.9
2I57.26
)"54.7"
(44.8
3I64.83
)"71.75,
(55.3
7I87.55
)"74.22,
(52.6
8I98.19
)"53.55
"(48.1
1I59.15
)"56.98
"(47.2
5I67.28
)"71.69,
(56.1
5I87.1)"
74.24"
(53.8
3I96.76
)"50"
40.89
"(36.3
5I45.46
)"41.83
"(32.2
5I51.52
)"45.12
"(39.4
6I50.44
)"45.29
"(34.4
2I57.14
)"62.31
"(47.6
8I76.64
),61.31
"(40.5
3I84.1),
46.74
"(41.2
5I52.13
)"48.11
"(37.9
9I58.32
)"62.29
"(48.3
4I76.1),
60.84
"(42.9
I81.1
2),