usmef “new cuts” seminar carcass utilization: the “new” japan market brett stuart director...
TRANSCRIPT

USMEF “New Cuts” Seminar
Carcass Utilization: The “New” Japan Market
Brett StuartDirector of Trade Analysis
Omaha, NebraskaNovember 29, 2005

BSE Impact on Japan Beef Market
1. Eating less, yet paying more
2. Losers: N. America, domestic industry
2003 2005 (f)%
change
Consumption (mt) 903,781 810,300 -10.3%
Expenditures (yen) ¥ 6,639 ¥ 6,723 +1.3%
Imports (mt) 520,096 483,600 -7.0%
–Australia 289,123 435,000 +50.5%
–N.Z. 18,051 47,600 +163.7%
Production (mt) 353,695 348,600 -1.4%
Source: ALIC, USMEF

BSE Impact on Japan Market
0
100,000
200,000
300,000
400,000
500,000
600,000
me
tric
to
ns
1994 1995 1996 1997 1998 1999 2000 2001 2002 2003 2004
US Beef / BVM Exports to Japan
Japan BSE 9/01
US BSE 12/03
• BSE was a major impact to U.S. beef …

BSE Impact on Japan Market
Japan Meat Consumption
Poultry15%
Pork17%
Fish60%
US Beef2%
Beef6%
… but not to Japanese meat supplies

Cuts Analysis

U.S. Beef Cuts to Japan
2001
Others (26)18%Chuck eye roll
5%Hanging tender
5%
Skirt5%
Tongue9%
Intestine9%
Chuck short rib9%
Short plate40%
“Methodology and Results of the Value of Beef Exports Analysis, USMEF, 2002

U.S. Beef to Japan - Cuts
USMEF Estimates
0
5
10
15
20
25
Mil
lio
n H
ead
Shortplate
Chuckshort rib
Intestine Tongue Skirt Hangingtender
Chuckeye roll
U.S. Cattle Contributing Cuts to the Japan Market
2002
2003
These 7 cuts only represent 15% (87 pounds) of red
meat per carcass
Eligible Cattle Supplies - 2006

U.S. Supplies?
• A-40 Maturity– USDA Estimated at 7.7% of U.S. slaughter– Could be much lower
• Source Verified – documentation– Estimates range from 15-30%
• QSA Approved? _____ (fill in the blank) % of steer/heifer slaughter?
• Seasonality
Keep in mind: ONLY 2.4% of U.S. beef production was exported to Japan in 2003 -- Cuts are KEY! --

Available Cattle: Impact on Cuts
Example:
Lbs Exported in 12Traditional per months of 2003 % in
Cuts Head metric tons 2003 *123A Short plate 40 151,684 40%130 Chuck short rib 8 34,917 9%116A Chuck eye roll 20 27,784 7%121C Outside Skirt 6 20,275 5%Hanging tender 2.5 19,148 5%
TOTAL 76.5 253,808 68%
Avail supply2006 % of
metric tons 200388,367 58%17,673 51%44,183 159%13,255 65%
5,523 29%169,002 -33%
Assuming 15% of U.S. Cattle Qualify Under a BEV (QSA) Program
U.S. Annual Slaughter (2006 est) 27,100,000
qualifying A-40 3.5% 948,500 less A-40 in paper verified pool -0.5% (142,275)
Total A-40 3.0% 806,225 Total QSA Approved 15.0% 4,065,000 Total Head Available 18.0% 4,871,225

U.S. Beef to Japan - Cuts
USMEF Estimates
0
5
10
15
20
25
Mil
lio
n H
ead
Shortplate
Chuckshort rib
Intestine Tongue Skirt Hangingtender
Chuckeye roll
Head Contributing Cuts to the Japan Market
2002
2003
15%
20%

“New” Cuts

“New” Cuts
New CutsLbs/ Hd New Cuts
Lbs/Hd
Brisket 24 Bttm Srln, Butt Flap 6
Pectoral Meat 4 Bttm Srln, Ball Tip 6
Shoulder Clod 24 Bttm Srln, Tri Tip 6
Top Blade 11 Top Sirloin, Cap Off 18
Chuck Tender 6 Sirloin Cap (coulotte) 6
Lifter Meat 6 Top Rd, Cap Off 32
Inside Skirt 8 Top Cap 6
Flank Steak 4 Outside Rd, Flat 25
Knuckle, peeled 20 TOTAL LBS/HEAD 212
USMEF Estimates

‘Potential’ Available Supplies
2003 2006 (A) 2006 (B)
Eligible Cattle 28.0 mil 4.8 mil 4.8 mil
Key cuts exported (lbs/hd) 87 87 212
Supply potential (mt) 1,104,000 189,388 461,497
Source: Cattle-Fax, USMEF

“New Cuts”
• The majority of U.S. production of these new cuts will not be used for Japan
• However, they do provide opportunities to enhance value on underutilized cuts and expand supplies for Japan
• What about prices?

Current Prices
11/05
U.S. wholesale
(+tariff,frt)
9/05
Japan Imports
Aus/N.Z.
Japan Import $ as
a % of U.S. $
Full Set – short fed $2.29 cutout $3.32 145%
Loin $3.21 $4.27 133%
Chuck, Round $1.91 $2.16 113%
Ribs $1.93 $2.07 108%
Chuck Roll $2.73 $2.81 103%
Brisket - flat $3.34 $2.99 90%
Striploin $6.70 $4.89 73%
Topside $2.62 $2.27 87%Source: USDA, ALIC, USMEF; US price includes frt and 38.5% duty
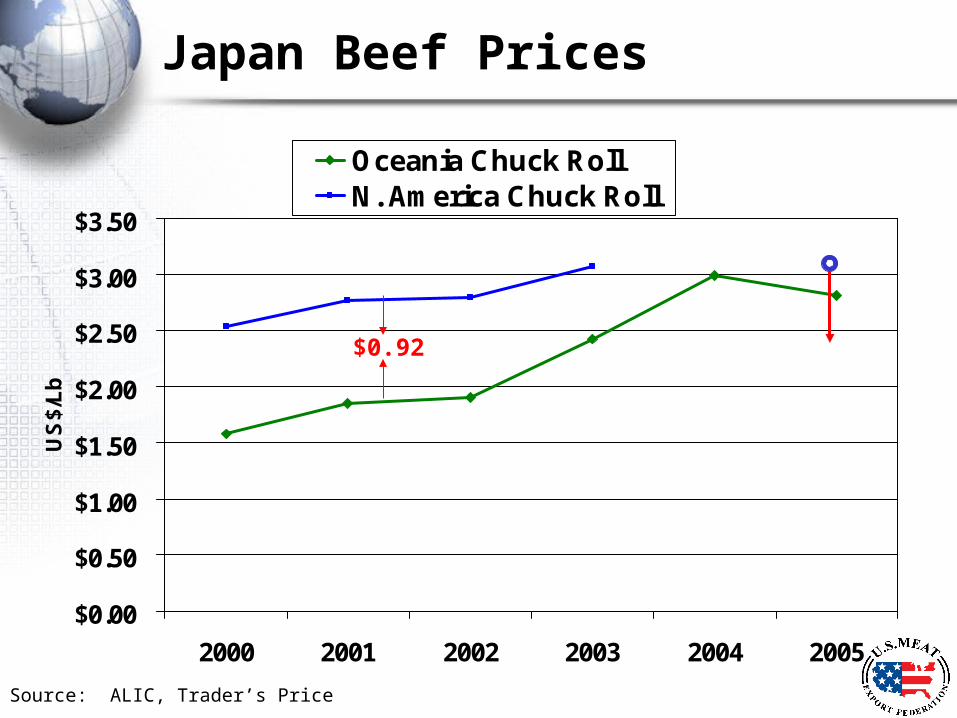
Japan Beef Prices
$0.00
$0.50
$1.00
$1.50
$2.00
$2.50
$3.00
$3.50
2000 2001 2002 2003 2004 2005
US
$/L
b
Oceania Chuck RollN. America Chuck Roll
Source: ALIC, Trader’s Price
$0.92

Cut Prices
$0.00
$0.50
$1.00
$1.50
$2.00
$2.50
$3.00
$3.50
$4.00
$4.50
$/lb
Shortplates
Shortribs
Intestine Chuckroll
Tongues Skirt HangingTender
Dec '03Nov '05
Brisket
Shoulder clod, Ball tip, knuckle
Source: USDA, USMEF
Flap
The question to ask yourself is: “What will short plates, tongues, etc, be worth when the market opens?”

What About Demand?
• 3rd Quarter 2005 Survey– Diet and price are most
common reasons for eating less beef
– Significantly fewer referring to BSE as cause for eating less beef
0%
5%
10%
15%
20%
25%
30%
35%
Q1'04
Q2'04
Q3'04
Q4'04
Q1'05
Q2'05
Q3'05
% Comfortable Purchasing US Beef
USMEF, Ipsos

Demand Points to Consider
1. Similar results in 2001 survey
2. 26% of 122* million= 31.7 million consumers
3. Foodservice beef is not labeled country of origin; US beef is used widely in foodservice
4. Australian beef has been high-priced
5. Domestic beef remains very high-priced
6. Retail sales will likely be most difficult to recover
7. Two years of negative press about US beef
USMEF Estimate: 4-5 years to recover to 2003 levels
* 127 million total population in 2005, 4% vegetarian
Summary
• Japan is hugely significant to the industry
• Traditionally, the U.S. has sent a few cuts from a lot of cattle, to Japan; supply of these cuts will be severely limited
• Demand for some segments will recover quickly, overall demand will take years to recover
• “New” cuts provide an opportunity to enhance supplies and profits


‘Potential’ Available Supplies
2003 2006
Eligible Cattle 28.0 million 4.8 million
Key cuts exported (lbs/hd) 87 212
Supply potential (mt) 1,104,000 461,497
Total exports to Japan (mt) 375,455 91,600
Qualified Supply Exported 34% 20%
Source: Cattle-Fax, USDA, USMEF