usn tps fixed wing performance theory and flight test technique
TRANSCRIPT

8/12/2019 USN TPS Fixed Wing Performance Theory and Flight Test Technique
http://slidepdf.com/reader/full/usn-tps-fixed-wing-performance-theory-and-flight-test-technique 1/245
SNAVAL TEST PILOT SCHOOLo FLIGHT TEST MANUAL
FIXED WING PERFORMANCE
S u- THEORY AND
FUGHT TEST TECHNIQUES
pj.~t4O 16 .,19
~LL~J~uU u~LiL~1 A
NAVAL AIR TEST CENTER
PATUXENT RIVERt MARYLAND
78 11 16 096

8/12/2019 USN TPS Fixed Wing Performance Theory and Flight Test Technique
http://slidepdf.com/reader/full/usn-tps-fixed-wing-performance-theory-and-flight-test-technique 2/245
Mrs. Crumbocker:
Attached is the Manual, "Fixed Wing Performance Theory and FlightTest Techniques" which we discussed on the telephone. The distributionsheet is inserted as first page. Please send us AD Number on thisrevised copy dated July 1977.
, Thank you for all your help.
JO E RIDGELL 4~ej:Q(•9 l) 863-4411
Our address is:
Naval Air Test Center
U. S. Naval Test Pilot School
Patuxent River, Maryland 20670
Head of Academics at the School is Mr. R. B. Richards

8/12/2019 USN TPS Fixed Wing Performance Theory and Flight Test Technique
http://slidepdf.com/reader/full/usn-tps-fixed-wing-performance-theory-and-flight-test-technique 3/245
IIN('IASS LFTEDISf` CU"ITY CLASSIFICATION OF THIS PAGE (When I)*#& f..ter~d) _________________
REPOT DCUMNTATONGEREAD INSTRUCTIONS_____ REPORT__ DOCUMENTATION___PAGE BE F O RE COMPLETING FORM
I. R4EFONT Numb- 12 GOVT ACCESSION NO. 3. RtECIPIENV'S CATALOG NUMBEIR
S USNTPS - lM - No. 104 _____________
4 I tL E a ~ S. TYPE OF REPORT II PERIOD COVERED
Ixed Wing Performancee Theory and Flight
Ili et Tchnique-. 6. PERFORMING ORG. REPORT HUMM~ER
7 AUjTHOR(s) S. CONTRACT OR 014ANT NUMBIER(a)
Anon
9 "FRFORMING ~rNGANIZATION NAME AND AOORFS5 10 POROGRAM rLI-MFNT, PROIFCT, TASK
1S.Naival 'rest Pilot School -
Naival Air rest CenterPatuxent River, Maryland 20670
It. CONTROLLING OFFICE NAME AND ADODWEbS
Head of Academics Jl 7
U. S. Naval Test Pilot SchoolC1 -&
______ __ __ _____ _____ _____ 241_ _ _ _ _ _ _
14 U40NITORING AGENCY NAME II ADORIESS0II different from ControllingOfi'ce) 1S. SIECURITYt CLASS. (.1 this report)
UNCLASSIF IED
IA DISTRIBUTION4 STATEMENT (of t is Report) Vý
Approved for public release; distribution ___________Flighttest _________
IT? DjT I .Q.LXAzM8.i E.A- -ffa oreF* tI Doe* to1, it 01IIeront fro, Rpol
S. Me ,'SmAll is We /Pruehcr
ISSUP,-L.LML TAY NOTES
19' KEY WORDS (Continue an feverso aid* ii nocesarane'md Identify by block number)
Aircraft flight testing Performance testingAircraft performance Test pilot traininig
Performance theory Test data reduction
tO.ASTRACT (Continue aunreverse side if nec~esary and identify by black number)
his manual is a guide for pilots, naval flight officers, and engineersattending the U. S. Naval Test Pilot School. The text presents basic
theory, test techniques, and data reduction methods for fixed-wing aircraft-performance testing. The scope of each flight investigation presented is
limited to that necessary to teach the principles of the test and its7assoc~iated data reduction methods. Students are encouraged to he alert,,,
original, and where possible, make appropriate modifications to general ',.t 4_1
DD P 3~f 473 EDITION OF I NOV 65 1S OBSOLETE ~SFE

8/12/2019 USN TPS Fixed Wing Performance Theory and Flight Test Technique
http://slidepdf.com/reader/full/usn-tps-fixed-wing-performance-theory-and-flight-test-technique 4/245
UNCLASSIFIED,•CCURI.TY CLASWFICATICN 01f THIS PAGO(wMNn Deoe EM19red)
•test techniques to obtain a specific result more efficiently. All flight
; --testing described in this manual is conducted to define engine and airframe
performance characteristics 'for use in determiining mission suitability and
specif icat ion compliance where applicable.
UNCLASSIFIED

8/12/2019 USN TPS Fixed Wing Performance Theory and Flight Test Technique
http://slidepdf.com/reader/full/usn-tps-fixed-wing-performance-theory-and-flight-test-technique 5/245
FIXED WING PERFORMANCE
THEORY
AN D
FLI•GHT TEST TECHNIQUES
Prepared by: Revised/Updated by :
LCDR S. M. SMALL LCDR R. C. WILLIAMSONLCDR J. W. PRUEHER LT A. M. GEMMILL
Flight Instructors Flight Instructors
Reviewed by: Reviewed by:
LCDR D. P. DUNBAR LCDR J. V. DETHOMAS
Chief Flight Instructor Chief Flight Instructor
Approved by: Approved by:
CAPT J. D. YAMNICKY CDR R. A. JOHNSON
Director Director
•8 11 i16 9'

8/12/2019 USN TPS Fixed Wing Performance Theory and Flight Test Technique
http://slidepdf.com/reader/full/usn-tps-fixed-wing-performance-theory-and-flight-test-technique 6/245

8/12/2019 USN TPS Fixed Wing Performance Theory and Flight Test Technique
http://slidepdf.com/reader/full/usn-tps-fixed-wing-performance-theory-and-flight-test-technique 7/245
REVISIONS
Insert latest changes, destroying superseded pages.
SECTION PAGES AFFECTED DATE OF CHANGE
2.
5.7i• ____. .... . .....__ _ _ __ _ __ _ _ __ _ __ _ __ _ _ __ _ __ _ _
• 7.
:• 10.
13.
14.
15.
16.
17.
18.
.g9
ZO.
8. _ _ _ _ _ _ _ _ _ _ __._ _ _ _ _ _ _ _ _ _ _ __'_ _ _ _ _ _ _ _ _ _ _ _
9. _ __ _ _ __ _ __ _ _ __ __"_ _ __ _ __ _ __i_ __ _ _ __ _ __ _ __,_ _

8/12/2019 USN TPS Fixed Wing Performance Theory and Flight Test Technique
http://slidepdf.com/reader/full/usn-tps-fixed-wing-performance-theory-and-flight-test-technique 8/245
PREFACE
"Consideration of the human variables involved in flight
leads me to the conclusion that the pilot must be as
wise in decision as a good chess player and as correct in
his tempo of transaction as it bullfighter."
L. I. KELLYAeronautics
The U.S. Naval Test Pilot School Performance Testing Manual has beer
prepared as a guide for the student who is learning the principles of performance
flight testing. The flight techniques discussed herein are many of those which are
used in performance flight test projects. The principles illustrated provide a basis
for modifying these techniques to fit a specific performance test problem.
The acquisition of data and data analysis are fundamental to performance
flight testing. Frequently it is a very laborious process. At the U.S. Naval Test
Pilot School, the quantity of data obtained and the data analysis methods used are
limited to those necessary to teach the principles. Though the data analysis
methods presented in this manual art, valid and are perfectly suitable for some
purposes, more refined and costly methods exist.
, i

8/12/2019 USN TPS Fixed Wing Performance Theory and Flight Test Technique
http://slidepdf.com/reader/full/usn-tps-fixed-wing-performance-theory-and-flight-test-technique 9/245
SECTION I
INTPODUCTION
8/12/2019 USN TPS Fixed Wing Performance Theory and Flight Test Technique
http://slidepdf.com/reader/full/usn-tps-fixed-wing-performance-theory-and-flight-test-technique 10/245
PURPOSE OF THE PERFORMANCE TESTING MANUAL
This manual is a guide for pilots and engineers attending the U.S. Naval Test
Pilot School (USNTPS). The text presents basic theory, test techniques, and data
reduction methods for fixed-wing performance testing. The scope of each flight
investigation presented is limited to that necessary to teach the principles of the
test and its associated data reduction methods. Students are encouraged to be
alert, original, and where possible, make appropriate modifications to general test
techniques to obtain a specific result more efficiently. All flight testing described
in this manual is conducted to define engine and airframe performance character-
istics for use in determining mission suitability and specification compliance where
applicable.
FLIGHT TEST SYLLABUS
The performance flight test syllabus is conducted concurrently with the
academic course ,nn airplane performance. A theoretical analysis of fixed-wing
engine and airframe performance is presented in the academic syllabus. In
addition, flight briefings on test techniques and "Scope of Test" are conducted prior
to each flight. Equipped with a knowledge of theory and test techniques, the
student plans, conducts, and reports on the assigned test flight.
Each fixed-wing stur)y group will be assigned an airplane for the specific
purpose of determining its engine and airframe performance characteristics. The
syllabus flights flown by the group to accomplish this evaluation are typical of
those cmidkited at the Naval Air Test Center (NATC) during Navy Preliminary
Evaluations (NPE), Board of Inspection and Survey (BIS) Trials, and Performance
Technical Evaluations (PTE). Many of the tests require several similar flights to
• I-I

8/12/2019 USN TPS Fixed Wing Performance Theory and Flight Test Technique
http://slidepdf.com/reader/full/usn-tps-fixed-wing-performance-theory-and-flight-test-technique 11/245
satisfactorily complete the scope of testing desired. For these tests, the various
flights will be divided among the group pilots.
Each student should prepare ,n informal written report for all performance
exercises ,ks soon as possible After each flight in order to record the pilot's treshest
impres,•ins and interprotations of the tt-'ut results. The report must be brief when
discussing satisfac-tory characteristics and as detailed as necessary to describe
part a-cularly good and bad character ist ics. As a mini mum, it should include
quantitattive data 0,n properly annot itted rough plots, ,llialitative commnents, and Any
airplaiie pecultarities Upon co mple tvin, the report will be presentod eiither as an
informal debriof or is a formal N.AlC written report. In any case, each individual
report will he crperatd into a project notebook which will provide A running
record of flight restilts for the teTntire group.
When all performance flights have bt-een coi, -ted, the data from each
individual report v ill be used to construct com1posite graphs of the various
performance paratnieters. These graphs enable the group tU evaluate the mission
suitability of the airplane- and to 6eoterm tne speci icai(onI ICompliance. At the end of
the performance syllabus, the group compiles data anid infor mation gathered during
the course into a fortrmaI oral report similAr to A PTE. Early in the perfor mauc,
syllabus, the various tt-sts inist be put in :errsptctiv e with a vietw' toward their
inclusion in this fin al rt, port.
SCHOOL APPROACht [0 PERFORMANCE IFES IlNi
The ',est Pilot S( ht+ol (TS) provid.es a mdserru airplaaie for pertormmlttct
testinig; and although the airplaie iN not t n•w one, the s-hool approach is to
assum• e that it has neve-r heetn tvalu.teuI hNy h, Navv. The test prject t llt''ss.m no
IN

8/12/2019 USN TPS Fixed Wing Performance Theory and Flight Test Technique
http://slidepdf.com/reader/full/usn-tps-fixed-wing-performance-theory-and-flight-test-technique 12/245
NPE was conducted and that BIS had designated TPS to conduct the secondary
phase Aircraft and Engine Performance Trials and Technical Evaluation. The
airplane is assumed to be designated for present day use. Stability and control,
weapons delivery, and other testing is assumed to be assigned to other divisions of
NATC. The TPS student is charged with the responsibility of determining and
reporting -,in the engine and airframe characteristics of the project airplane.
"Mission suitability" is an important phase at NATC, and its importance is
reflected in the whol- theme of flight testing at TPS. The fact that an airplane
imeets the requirements of pertinent Military Specifications may be of secondary
importance if Any performance characteristic degrades the airplane's normal
operation in its planned environment. The mission of each airplane will be
discussed, then students must conclude whether or not the performance character-
istics they evaluate are suitable for the intended mission. This conclusion must be
supported by a logical discussion and analysis of quantitative and qualitative
Observations. Since students possess and can communicate recent fleet experience,
their conclusions should be based on a 'users" concept.
The performance of an airplanrle cannot be evaluted for comparison with
contract guarantees or other airplanes without accurate quantitative data.
Consequently, accurate numbers are indispensable in providing the student with a
foundation on which to build a logical an(i analytical analysis. At TPS every effort
is made to, test under ideal A eather conditions mnd with all sensitive instruinenta-
tion operative, but problems in either of these areas inay cause slight errors in the
data. If the errors are not the result of imiproper test techniques, the test results
will show the desired data trents which are essential for a satisfactory report. If
bad weathe ni nention failure, or poor pilot test technique result in large

8/12/2019 USN TPS Fixed Wing Performance Theory and Flight Test Technique
http://slidepdf.com/reader/full/usn-tps-fixed-wing-performance-theory-and-flight-test-technique 13/245
magnitude errors or improper trends, critique on the data may be given; and if
warranted, the flight will be reflown. It is important to remember that the primary
purpose of the perforrmance testing syllabus at TPS is tearhing proper flight test
techniques and the basic ideas supporting the methods.
The fact that TPS does not require the data to be exactly correct before it is
presented in a report does not excuse the student from conducting a critical
examination of the data. It is important for the student to know that errors in the
final data do exist and that be should explain tbe effect of the errors on the results.
It has been the experience of the school faculty that some students are too critical
of the accuracy of their data because of the scatter they observe in their graphs.
Many factors enter into the degree of scatter observed in performance data. High
among these factors are inconsistent pilot technique and instrumentation errors.
Of Len a certain amount of scatter is to be expected depending on the particular
test under consideration. Again, a degradation in accuracy of results can also be
attributed to poor pilot technique, which may in turn be traced to a student who did
not prcpp.-ly prepare for a flight or did not follow instructions. Immediate flight
plannijg following a flight brief is imperative to ensure that the proper and
necessary preparation is accomplished. The flight brief will encompass the data
accuracy which is expected. If these limits are not achieved, an explanation in the
individual flight report is warranted.
1-4

8/12/2019 USN TPS Fixed Wing Performance Theory and Flight Test Technique
http://slidepdf.com/reader/full/usn-tps-fixed-wing-performance-theory-and-flight-test-technique 14/245
SECTION II
PERFORMANCE FLIGHT TEST CONDITIONS
AND PILOT TECHNIQUES
!0r---I

8/12/2019 USN TPS Fixed Wing Performance Theory and Flight Test Technique
http://slidepdf.com/reader/full/usn-tps-fixed-wing-performance-theory-and-flight-test-technique 15/245
PERFORMANCE FLIGHT TEST CONDIrIONS AND PILOT TECHNIQUES
PURPOSE
The purpose of this section is toý discuss periormaitce fligbt test technique&
which will be used in conducting the tests outlined in this manual. A demonstration
flight, discussed in Section tII, will be given to each student by a TPS flight
instructor.
DISCUSSION AND THEORY
Genral
There are three basic test coinditions under which a pilot will operate an
airplane while conducting performance testing. Each test condition requires special
flight techniques and utilizes different primary flight instruments for pilot
reference. These conditions are stAble equilibrium, unstable equilibrium, and
nonequilibrium. Equilibrium test conditions are present during tesig in which the
airplane is 3tabilized at a constant airspeed and altitude. A stable equilibrium
condition is a condition in which the airplane, if disturbed, will return to its initial
condition. An unstable equilibrium test point is a point from which the airplane, if
disturbed, will continue to diverge. A nonequilibrium test is a test during which
there is a change in airspeed and/or altitude.
Stable Equilibrium Conditions
A stable equilibrium test point represents a condition at which pressu,'e
altitude, thrust (power), and flight path angle are constant and airplane
accelrattion along each axis is zero. Stable equilibrium data points are obtained in
m ii! 1

8/12/2019 USN TPS Fixed Wing Performance Theory and Flight Test Technique
http://slidepdf.com/reader/full/usn-tps-fixed-wing-performance-theory-and-flight-test-technique 16/245
both level and turning flight when operating at airspeeds greater than the airspeed
for minimum drag (stable portion of the thrust or power required curve). The testtechnique for obtaining stable equilibrium data is to adjust altitude first, power
second, and then wait until the airplane stabilizis at the equilibrium flight
airspeed. It is important to point out that altitude must be maintained precisely at
the desired test level and that thrust/power must not be changed once set. If this
technique is followed, a time history of airspeed can be used to determine when the
equilibrium data point has been obtained. For most tests, when the airplane has
changed less than Z kt in the preceding I minute period, an equilibrium data point
can be assumed to have befn achieved. Stable equilibrium test conditions are
obtained most rapidly by approaching them with excess airspeed. This approach
ensures convergence, whereas an accelerating approach may converge only after
fuel exhaustion. The flight test technique used in obtaining stable equilibrium
conditions is called the constant altitude method in most flight test literature.
The primary parameters for pilot reference when obtaining data points under
stable equilibrium conditions arcr altitude, vertical speed, heading forstraight
flight, and bank angle for turning flight. There is no substitute for a good visual
horizon. Tn airplanes equipped with automatic flight control systems (AFCS) that
incorporate attitude, altitude and heading hold modes, stable equilibrium data
points can be obtained by usi ig these modes provided the sensitivity of the AFCS is
adequate for the test. In itraight flight, stable equilibrium conditions can be
achieved by using altitude and heading hold modes. In turning flight, stable
eqnilibriuru conditions can b,f achieved by using altitude and attitude hold modes.
11-2

8/12/2019 USN TPS Fixed Wing Performance Theory and Flight Test Technique
http://slidepdf.com/reader/full/usn-tps-fixed-wing-performance-theory-and-flight-test-technique 17/245
Unstable Equilibrium Conditions
Unstable equilibrium data points are more difficult to obtain but can be
obtained rapidly if proper technique is employed. For the unstable equilibrium data
points, indicated airspeed is held constant. Altitude, engine RPM, and bank angle
may be adjusted as required by the test being conducted. Since the indicated
airspeed must remain constant, it becomes apparent that good test techniques will
assist in obtaining good unstable equilibrium data points. Unstable equilibrium data
points are associated with the unstable portion of the thrust or power required
curve. To obtain data points under these conditions, the desired test airspeed is
established first, then the throttle is adjusted to climb or descend to the desired
test altitude. The vertical speed indicator is an important instrument in achieving
equilibrium conditions. With throttle set, the vertical speed is stabilized while
maintaining the desired test airspeed. A throttle correction is made and the
stabilized new vertical speed is observed. The approximate RPM required for level
flight can be determined by correlating the values. For example, while attempting
to obtain a level flight data point at 135 KIAS, it is determined that 88% P.PM
produces an 800 fpm climb in the vicinity of the desired test altitude and an 80%
RPM produces a ZOO fpm descent. The test pilot can determine that 1% RPM
change represents a 125 fpm change in vertical speed. By adjusting throttle to
81.6%, he should achieve equilibrium level flight conditions. Normal pilot technique
usually puts one within 1% or Z% of the proper RPM, but this averaging technique
then applies. A variation of this technique must be used in turning flight when the
throttle is set at MIL and cannot be used as the adjustable variable. In this case,
bank angle (or load factor) may be related to vertical speed in the same manner
11-3
lm
Imm

8/12/2019 USN TPS Fixed Wing Performance Theory and Flight Test Technique
http://slidepdf.com/reader/full/usn-tps-fixed-wing-performance-theory-and-flight-test-technique 18/245
that RPM was related to vertical speed in the straight flight conditions. The flight
test technique used in obtaining unstable equilibrium conditions is called the
constant airspeed method in most flight test literaiure.
The primary parameters for pilot reference when obtaining data points under
unstable equilibrium conditions are airspeed, vertical speed, heading for straight
flight, and bank angle for turning flight. In tests in which rate of climb can be
corrected to thrust or power required, it will not be necessary to achieve
equilibrium at zero vertical speed. A small altitude change over a small time period
(usually 5 min) can be used to correct the test results to level conditions. In other
tests, it will be necessary to achieve zero vertical speed. A small amount of
practice usually results in satisfactory ability to obtain zero vertical speed at a
desired test altitude in less time than it takes to determine an average
rate-of-climb correction. It should also be recognized that the constant airspeed
techniques can be used to good advantage by a proficient test pilot when obtaining
test data under stable equilibrium conditions. Normally, automatic flight control
systems offer little advantage over manual control in obtaining unstable
equi ibrium data p3ints. If control stick steering is available, this mode can be
useful if the unstable region of the thrust required curve is also an unstable angle
of attack region of flight. An airplane exhibits positive angle of attack stability if
it initially tends to return to the same angle of attack after a sudden disturbance.
If the airplane appears to exhibit positive or neutral angle of attack stability,
manual control will probably be preferable. Altitude hold mode used in conjunction
with throttle adjustment will seldom give satisfactory results in unstable thrust
required flight conditions.
11-4

8/12/2019 USN TPS Fixed Wing Performance Theory and Flight Test Technique
http://slidepdf.com/reader/full/usn-tps-fixed-wing-performance-theory-and-flight-test-technique 19/245
Nonequilibrium Test Points
Nonequilibrium test points are usually the most difficult to obtain. They
preclude the pilot's having stable conditions or being able to trim to maintain
constant conditions. The pilot does, however, have some schedule which he can
follow and which he can use to assist him in correcting to achieve a satisfactory
flight path or flight test condition. Some nonequilibrium tests such as acceleration
runs are performed at a desired constant altitude. Others such as climbs and
descents are performed according to a desired airspeed schedule.
The primary reference parameters for nonequilibrium tests will be dictated by
the specific test being performed. Automatic flight control system equipment can
be a great aid in obtaining nonequilibrium condition data. The degree to which it
can be employed will depend upon the specific test and the ability of the modes to
perform their design functions. Good heading hold and altitude hold modes can be
extremely valuable in obtaining level acceleration test data. If the altitude mode is
unable to maintain a relatively constant altitude (+100 ft), use of control stick
steering may be superior to manual control since this mode will provide automatic
longitudinal retrim. Climb and descent tests can be performed using Mach or
Indicated Airspeed hold modes if they are available and if they have sufficiently
high gain to maintain the desired schedule accuracy (+5 kt or +0.01M). If these
modes are not available, use of control stick steering will at least provide smooth
automatic retrim and relieve the pilot of that task.
11-5
n-si• H '' "i sal: P : I: FT • " i :I1•

8/12/2019 USN TPS Fixed Wing Performance Theory and Flight Test Technique
http://slidepdf.com/reader/full/usn-tps-fixed-wing-performance-theory-and-flight-test-technique 20/245
SECTION III
PERFORMANCE DEMONSTRATION FLIGHT
..
__

8/12/2019 USN TPS Fixed Wing Performance Theory and Flight Test Technique
http://slidepdf.com/reader/full/usn-tps-fixed-wing-performance-theory-and-flight-test-technique 21/245
PERFORMANCE DEMONSTRATION FLIGHT
INTRODUCTION
The performance demonstration flight conducted at TPS was established to
introduce the student to the fixed-wing performance testing syllabus. The flight
will usually be conducted in a different airplane than the student will utilize during
the performance phase of the syllabus. Prior to the demonstration flight, the
student must have completed the handbook exam, cockpit checkout, and at least
A one familiarization flight. In addition to test techniques, the student will be
instructed in the proper use of instrumentation and the importance of knowing the
correct preflight procedures and preparation required prior to each test flight.
PURPOSE OF DEMONSTRATION FLIGHT
The primary purpose of the fixed-wing performance demonstration flight is to
acquaint the student with the test techniques and method of tests utilized at TPS.
The knowledge gained during this flight will enable the student to practice the
correct techniques during succeeding familiarization and practice flights. The
purpose of the demonstration flight is to teach test techniques and not fixed-wing
performance theory. The importance of the various tests and the significance of
the test results relating to mission suitability will be emphasized. Methods of test
and pilot techniques will be demonstrated for the following tests:
a. Takeoff and climb performance.
b. Level flight performance (thrust required).
c. Constant altitude acceleration runs (specific excess power).
d. Level turning performance and buffet boundary characteristics (thrust and
lift boundaries).
i i• ]rn-i

8/12/2019 USN TPS Fixed Wing Performance Theory and Flight Test Technique
http://slidepdf.com/reader/full/usn-tps-fixed-wing-performance-theory-and-flight-test-technique 22/245
e. Stall airspe,-d determination.
f. Pitot - stat.,: system calibration (tower fly-by).
FLIGHT FORMAT
a. The student will be briefed on the proper operation and utilization of
photopanel and phenomenon lights and the proper flight test techniques.
b. The importance of altimeter settings (29.92), sufficient leader on
photopanel film and frame counter correlation will be discussed.
c. The flight will be conducted simulating a fully-instrumented airplane
(student in front seat).
Takeoff Techniques (Nonequilibrium)
The demonstration pilot will emphasize the importance of initial line-up and
trim settings in takeoff performance testing. The use of brakes can seriously affect
the takeoff distance and acceleration performance of the airplane. The technique
to obtain good nose wheel line-up is uniform, simultaneous braking while lining up
prior to takeoff. This will ensure that the nose wheel is not co;'•:1l at brake
release. If aose wheel steering is available it may be used. Photopanel data are
normally taken during the takeoff run. The photopanel is started prior to brake
release, usually after takeoff thrust has been obtained. Brakes are released at a
specified photopanel counter number and the phenomenon light is used to mark the
film at that time. Takeoff rotation will be at a specified airspeed, gear and flaps
will be retracted at a specified airspeed, and the climb schedule will be intercepted
at as low an altitude as is feasible for normal operating conditions. During
acceleration to iritial climb airspeed, rate of climb should not exceed 500 fpm.
IE-
i rrI-z

8/12/2019 USN TPS Fixed Wing Performance Theory and Flight Test Technique
http://slidepdf.com/reader/full/usn-tps-fixed-wing-performance-theory-and-flight-test-technique 23/245
Climb Techniques (Nonequilibrium)
The instructor pilot will demonstrate the transition to the climb schedule, pilot
techniques for maintaining schedule, and the proper uwe of test instrumentation.
The climb schedule represents a nonequilibrium flight condition in which the pilot is
following a predetermined airspeed vs. altitude schedule. The schedule for the
particular airplane will be described during the flight briefing. The demonstration
should cover techniques for transitioning from a constant altitude condition to a
climb schedule and should include demonstration of an interrupted climb. The
instructor pilot should emphasize the requirement for making smooth, early
corrections during the climb phase. In demonstrating an interrupted climb, it is
important to emphasize that the conditions at the time the climb is interrupted
must be duplicated exactly when re-establishing the climb. At least 1,000 ft of the
climb schedule should overlap.
Level Flight Performance
Stable equilibrium data points (points at airspeeds greater than the airspeed
for minimum drag) will be demonstrated in level flight at the altitude designated
for the particular demonstration airplane. Tf the test airplane is equipped with a
pointer counter altimeter, it is essential that even 1,000 ft altitudes not be used in
the demonstration because of the inherent altimeter instrument friction
characteristics about the 12 o'clock position. The proper technique is to set the
appropriate power or thrust setting first and allow the airspeed to decelerate and
stabilize. After setting the thrust and stabilizing the altitude, the pilot's stopwatch
should be started to determine airspeed acceleration or deceleration over a I min
interval. When accelerations or decelerations are less ther 2 kt/min, equilibrium
i 11I-3
" ! - e

8/12/2019 USN TPS Fixed Wing Performance Theory and Flight Test Technique
http://slidepdf.com/reader/full/usn-tps-fixed-wing-performance-theory-and-flight-test-technique 24/245
conditions can be assumed to have been achieved and the photopanel and/or cockpit
data can be recorded. It is essential that the student understand this time historyconcept in order to minimize test time requirements. This is called the constant
altitude method. The primary reference instruments are the altimeter, vertical
speed indicator, and RMI for heading.
Unstable equilibrium data points (points at airspeeds less than the airspeed for
minimum drag) will be demonstrated in level flight at the same altitude as the
stable equilibrium points. This technique is called the constant airspeed method.
The instructor pilot will emphasize that the airspeed must be maintained constant
for unstable equilibrium data points. Pilot techniques for determining thrust or
power required for level flight under these conditions will be demonstrated.
Trim the airplane at the desired airspeed and set a thrust (RPM) which results
in a stabilized climb of less than 1,000 fpm at the trim airspeed. Reduce the thrust
(RPM) to obtain a stabilized descent at the same trim airspeed. After determining
the rate of change of vertical speed with RPM, an estimate of RPM required for
level flight can be made. A throttle correction to position the airplane at the
desired test altitude will then be made as the airplane approaches within +100 it of
the specified test altitude. After the airplane has maintained level, stabilized flight
for approximately 60 sec, data can be recorded. An altitude gain or loss of Z5 ft in
60 sec is considered acceptable. This method is applicable in airplanes which have
no significant change in gross weight while obtaining unstable equilibrium data test
points. The primary instruments for this technique are the airspeed indicator, the
v'ertical speed indicator, the altimeter, and the RMI for heading.
ni1-4

8/12/2019 USN TPS Fixed Wing Performance Theory and Flight Test Technique
http://slidepdf.com/reader/full/usn-tps-fixed-wing-performance-theory-and-flight-test-technique 25/245
Acceleration Run (Nonequiiibrium)
The constant altitude acceleration run is another example of a nonequilibrium
flight test condition. In this case, a constant altitude will be maintained, but the
airplane will not be in equilibrium condition (except at V mrt) because it is
accelerating along the longitudinal axis. Level flight acceleration runs may be
performed by constantly trimming or by attempting to hold all forces with the
control stick. The trimming method is recommended; however, exact trim
conditions should not be attempted. A small amount of pull or push force should be
maintained throughout the run. The reason for this is to avoid the control systembreak-out forces about the force trim points. This condition may result in a force
reversal from push to pull during the run whirh generally produces an oscillatory
motion during the test. If the airplane has large excess thrust capabilities or slow
engine spocl-up time, it will be necessary to commence the acceleration run from
climbing flight conditions to conduct the entire acceleration run at stable engine
operating conditions. The instructor pilot should emphasize the importance of
making smooth corrections and discuss the use of speed brakes to facilitate the
start.
Level Turning Performance
The techniques for determining level turning performance (bot'i stable and
unstable equilibrium data points) will be demonstrated at the designated test
altitude. The instructor pilot should emphasize that V is a point in turning [ tort
performance (1.Og point). For the stable equilibrium points, set the thrust/power at
MIL, establish the airplane in a constant bank, stabilize the altitude with norma)
acceleration and allow the airspeed to stabilize. Stabilization can be assumted when
111-5___

8/12/2019 USN TPS Fixed Wing Performance Theory and Flight Test Technique
http://slidepdf.com/reader/full/usn-tps-fixed-wing-performance-theory-and-flight-test-technique 26/245
the airspe-d, normal acceleration, and altitude are stabilized for 5 sec within
1,000 ft of test altitude. The instructor should emphasize the importance of
trimming the airplane longitudinally to maintain the desired bank angle and normal
acceleration, and of using the visual horizon. For unstable equilibrium points,
advance the thrust to MIL and adjust normal acceleration ,in turn to maintain
desired airspeed. Once the airspeed is stabilized by applying the appropriate
normal acceleration, the bank angle required for level flight can be established.
The instructor should demonstrate the relationship of bank angle to vertical speed,
and of normal acceleration to airspeed. The stabilization criteria is the same as for
stable equilibrium conditions. This technique is difficult to master and will require
considerable practice for proficiency.
Buffet Boundary (Nonequilibrium)
The technique for determining the buffet boundary (lift limit) characteristics
of an airplane will be demonstrated at the same test altitude as level turning
performance. The technique is called the constant Mach number/airspeed wind-up
turn and is another example of a nonequilibrium test condition. Establish the
airplane at a specified Mach number/airspeed and smoothly increase normal
acceleration. In order to minimize scatter in the data, a constant thrust setting is
preferred. For load factors above the maxinmum level flight sustained g.-available,
use bank angl, (airplane weight vector) to supplement thrust in order to maintain a
constant Mach number/airspeed during the maneuver. Satisfactory data can be
obtiuned within 1,000 ft of test altitude. The instructor should emphasize the
importance of increasing the normal acceleration at 0.5g per sec or less to avoid
dynamic error•i in the data. The instructor should point out and discuss the
applicable buffet levels.
111-6I

8/12/2019 USN TPS Fixed Wing Performance Theory and Flight Test Technique
http://slidepdf.com/reader/full/usn-tps-fixed-wing-performance-theory-and-flight-test-technique 27/245
Stall Speed Determination iNcnequilibriuw)
In this test, the pilot is fllowing a kelcration schedule of l/Z kt/sec or iess.
The configuration of the airplane or engine limitations will determine the throttle
setting. The primary instruments in th-s particular maneuver will be the airspeed
indicator and the clock. Stalls at higher rates of deceleration (5 to 10 kt/sec) will
also be demonstrated to illustrate the effects of n,-nsteady flow conditions. The
instructor will also discuss or demonstrate the effects of trim setting on stall speed
data.
Photothodolite Tower Fly-by
The instructor will familiarize the student with the local course (currently in
use), and the student may perform practice pitot static source calibration runs if
time and fuel permit.
Student Participation
The student should be permitted to try each basic technique, but the instructor
pilot must maintain the pace of the flight in order to complete all demonstration
requirements. It is important to emphasize that the purpose of this flight is to
introduce the three basic flight test conditions and the techniques ased by test
pilots to collect performance data. Instructors will answer qutestions, but avoid
a;pecific details of theory which may not yet have been introduced in the academic
syllabus. Fu.irther detailed briefs and practicfe flights are incluode in the syllabus.
ITI-7

8/12/2019 USN TPS Fixed Wing Performance Theory and Flight Test Technique
http://slidepdf.com/reader/full/usn-tps-fixed-wing-performance-theory-and-flight-test-technique 28/245
SECTION IV
'PITOT STATIC SY STEM TESTING
B0
mS
I______

8/12/2019 USN TPS Fixed Wing Performance Theory and Flight Test Technique
http://slidepdf.com/reader/full/usn-tps-fixed-wing-performance-theory-and-flight-test-technique 29/245
SECTION IV
NOTATIONS INTRODUCED IN THIS SECTION
- lag error constant
P - static pressureS
P - ambiemt pressurei a
i T - free' stream total presasure
Pa - aunhient density
P SL - sea level density
- ratio of specific heats
q c - impact pressuro
1q - indicated impact pressure
SV, indlic-mt d airspesed
V - calibrat,.d airspeotd
6 P - (lifference in static source pre|ssurt, aznd arrhient pressure, P
PS
q1- static mource error -oefficient
Subscript w signiies dat a corrected to standard airplane weight
H Actual pressauro altitude of the tost mirpl,.n.
I I obs4erve.d pressiure. altitudle of tht test ttirpl:.n. (cockpit mn
pht topmlel ret ordinkt)
SIi presure, alt itutde ,0. the'odholit.
jp theodolit t
h ','Ape. ,eneight incrcement o( t est airpiane abov t M'SI,
hp vprt, kr•' height of the es, t iie-law atoo, MSI,.
IV- I

8/12/2019 USN TPS Fixed Wing Performance Theory and Flight Test Technique
http://slidepdf.com/reader/full/usn-tps-fixed-wing-performance-theory-and-flight-test-technique 30/245
W -. airp)ane gross weight
W - standard airplane gross weightS
AHpc- altimeter instrument error correction
A•Vc - airspeed indicator instrument error correction
AVpos - airspeed position error correction
SAHppos - altimeter position error correction
L
pp

8/12/2019 USN TPS Fixed Wing Performance Theory and Flight Test Technique
http://slidepdf.com/reader/full/usn-tps-fixed-wing-performance-theory-and-flight-test-technique 31/245
REFERENCES
Section IV
1. AGARD, Chapte-.s I and 10 .
2. NACA, Report 919.
3. Military Specification, MIL-I-6115A.
4. UFN'rPS - FTM - N3. IOZ, Section Il.
5. Petersen, Aircraft and Engine Performance.
6. NASA, Report TN-D-82Z.
7. NATC Technical Memo, TM75-ZSA, 19 Nov 1975.
Wr-3

8/12/2019 USN TPS Fixed Wing Performance Theory and Flight Test Technique
http://slidepdf.com/reader/full/usn-tps-fixed-wing-performance-theory-and-flight-test-technique 32/245
PITOT STATIC SYSTEM TESTING
INTRODUCTION
The altimeter, airspeed, and machmeter indicators are three universal flight
instruments which require total and/or static pressure inputs to function. It is
geneally assumed that a properly designed pitot tube can provide error free total
pre sure measurements. However, it is difficult to accurately measure ambient
static pressure. The error which results from the difference between the actual
ambient pressure and the static pressure measured at the aircraft static pressure
source is called position error. In addition, any pitot/static pressure system is
subject to errors associated with both the mechanical instrument and the tubing
which connects the instruments to the static pressure source. This section will
briefly discuss thLe errors and the various test techniques used for their
determination. The pertinent requirements of military specification MIL-F-6115A
will be presented as well as a brief discussion of the recovery factor for an outside
air temperature (OAT) probe.
PU RPOSE
TI-e purpose of this test is to evaluate the altimeter and airspeed position
errors of an airplane using the altimeter depression method. In addition, the OAT
probe recovery factor will be determined.
IV-4

8/12/2019 USN TPS Fixed Wing Performance Theory and Flight Test Technique
http://slidepdf.com/reader/full/usn-tps-fixed-wing-performance-theory-and-flight-test-technique 33/245
DISCUSSION AND THEORY
General
The errors associated with any pitot/static pressure system may be generally
classified as mechanical, operational, and installation errors. Mechanical errors
primarily include instrument errors. Operational errors include readability and
incorrect barometric settings. Installation errors primarily consist of lag errors and
position errors.
Instrument Errors
Instrument errors are the result of manufacturing discrepancies, hysteresis,
temperature changes, friction, and inertia of moving parts. A laboratory calibration
of all flight instruments must be accomplished to determine instrument errors prior
to an inflight determination of position errors. Sensitive instruments may require
daily calibration. When the readings of two pressure altimeters are used to
determine the error in a pressure sensing system, a precautionary check of
calibration correlations is often advisable. The problem arises from the fact that
two calibrated instruments, placed side by side with their reading corrected by use
of calibration charts, do not always provide the same resultant calibrated altitude.
Tests such as the "Tower Fly-By" or the "Trailing Bomb" for altimeter calibration
require an altimeter to provide a base line (reference) pressure altitude. These
tests normally require that the reference altimeter be placed next to the service
sy.item altimeter prior to and after each flight. Each altimeter reading should he
recorded, and if after calibration -corrections have been applied there still exists a
discrepancy between the two readings, this discrepancy should be incorporated in
the data reduction. ihbs correction is not made at TPS.
SIV-5

8/12/2019 USN TPS Fixed Wing Performance Theory and Flight Test Technique
http://slidepdf.com/reader/full/usn-tps-fixed-wing-performance-theory-and-flight-test-technique 34/245
LagEror
The presence of lag error in pressure measurements is generally associated
with climbing/descending or accelerating/decelerating flight and is most evident in
static systems. When changing ambient pressures are involved, as In climbing and
4M descending flight, the speed of pressure propagation and the pressure drop
associated with flow through a tube introduces lag between the indicated and
actual pressure being measured. The pressure lag error is basically a result of the
following:
a. Pressure drop in the tubing caused by viscous friction.
b. Inertia of the air mass in the tubing.
c. Instrument inertia and viscous and kinetic friction.
d. The finite speed of pressure propagation; i.e., acoustic lag.
Over a small pressure range, the pressure lag is small and can be determined as a
constant (),). Once a lag error constant is determined, a correction can be applied
through mathematical manipulations. Another approach, which is more suitable for
testing at the Naval Air Test Center (NATC), is to balance the pressure sysitems by
equalizing their- volumes. Balancing minimizes or removes lag error as a factor in
airspeed data reduction for flight at a constant airspeed. This is particularly
important for airplanes used as calibrated pacers.
Lag Constant Test
The pitot and static pressure systems of a given airplane supply pressures to an
unequal number of instruments and require different lengths of tubing for pressure
transmission. The volume of the instrument cases plus the vnlump of the tubing,
rv-6

8/12/2019 USN TPS Fixed Wing Performance Theory and Flight Test Technique
http://slidepdf.com/reader/full/usn-tps-fixed-wing-performance-theory-and-flight-test-technique 35/245
when added together for each pressure system, produce a. volume mismatch
between systems. Figure I illustrates a configuration in which both the length oftubing and total instrument case volumes are unequal. If an increment of pressure
were applied simu'*aneously across the total and static sources of Figure 1, the two
systems would require different periods of time to stabilize at the new pressure
level and a momentary error (lag error) in indicated airspeed and indicated altitude
would result. The time required for each system to stabilize can be related to the
system time constant.
BALANCE
VOLUME: I
TOTAL PRESSURE I_ _
PICK-UP
BAR ALTCONTROLLER
A/s 3, AL ALT
_....___
STATIC• "1 •'•PORT
LENGTH OF 3/16" VOTOi, VOLU?.¶T: OFSYSTEM ID) TU131- INSTR U,' 1 NT CAS FS
"Static 18 ft 370 x 10- 4 cu ft
Pitot 6 ft 20 x 10-4 cu ft
"Figure 1Analysis of Pitot and Static Systerns (-onstruction
"W-7

8/12/2019 USN TPS Fixed Wing Performance Theory and Flight Test Technique
http://slidepdf.com/reader/full/usn-tps-fixed-wing-performance-theory-and-flight-test-technique 36/245
If an increment of pressure is instantaneously applied to a system, the lag
constant (Ad )epresents the period of time required for the pressure of the system
to increase by an amount equal to 63.2 percent of the applied pressure increment.
This is shown graphically in Figure Z(a). A test to determaine the altitmeter and
airspeed indicator lag constants can be accomplished on the ground by applying a
suction sufficient to develop a AH equal to 500 ft or an indicated r.irspeed ofp
100 kt. Removal of the suction and timing the altitude drop tu 184 ft, or the
airspeed drop to 37 kt, results in the determination of A., the static pressure lag
constant, as shown in Figures Z(b) and 2(c). If a positive pressure is applied to the
total pressure pickup (drain holes closed) to produce a 100 kt indication, the total
pressure system lag constant (k.r) can he determined by measuring the tinie that i';
required for the airspeed indicator to drop to 37 kt when the pressure is r-emaved.
Generally, the XT will be much smaller than the AS because of the small volume of
the airspeed instrument case.
P'IRSSURIE (PSF) ALTITUDE(OT) AMIWPI&t (COT,)
APPLIED
PR~:SSUR ESS FE
INCREMENT
I It
0 0TIHT0ij(&3(b (c)
lDeterininition (if P tot/St-Atic Systern Ia 4A ,onstant (AI
P -8

8/12/2019 USN TPS Fixed Wing Performance Theory and Flight Test Technique
http://slidepdf.com/reader/full/usn-tps-fixed-wing-performance-theory-and-flight-test-technique 37/245
r-
Sst erri Balancing
The practical approach to lag error testing is to determine if a seriousý lag
error does exist and to eliminate it where possib'e. To test for airspeed system
balance, a small increment of pressure (0.5 psf) is applied simultaneously to both
the pitot and static systems. If the airspeed indicator does not fluctuate, the
combined systems are balanced and no lag error will exist in indicated airspeed
data because the lag constants are matched. Movement of the airspeed pointer
indicates ihat the addition of more volume is required in one of the systems. The
addition of cans or tubing (see Figure 1) will generally provide satisfactory airspeed
indications but will not help the lag in the altitude indicator as this lag is primarily
caused by tne ierngth of the static system tubing. For instrumentation purposes, lag
can he eliminated from the altimeter by locating a static pressure recorder
remotely at the static port.
Position Errors
Position errors or "insialiation errors" are the result of other than free stream
pressures at the pressure sený;or or errors in the local pressure at the source
resviting from the shape, location, or orientation of the sensor. In an airplane these
pressure errort. are usually pre sent only at the static wressure sensor and the total
pressure measurement (pitot tube) is assumed to be error-free. T'he limits for this
assurnm)tion c.re discussedt in NACA Report 919.
Based on thc assumption of an error-free totii pr,,ssure measurement, airsi)ced
and ai~imenoter systems may be cah brated by either the Altimeter depression rnethod
&" ,by the pace method. Since the altiumeter depression methods are generally more
economnical it terts (f light te:-t time and Io not require a calibrated pace
SI '
8/12/2019 USN TPS Fixed Wing Performance Theory and Flight Test Technique
http://slidepdf.com/reader/full/usn-tps-fixed-wing-performance-theory-and-flight-test-technique 38/245
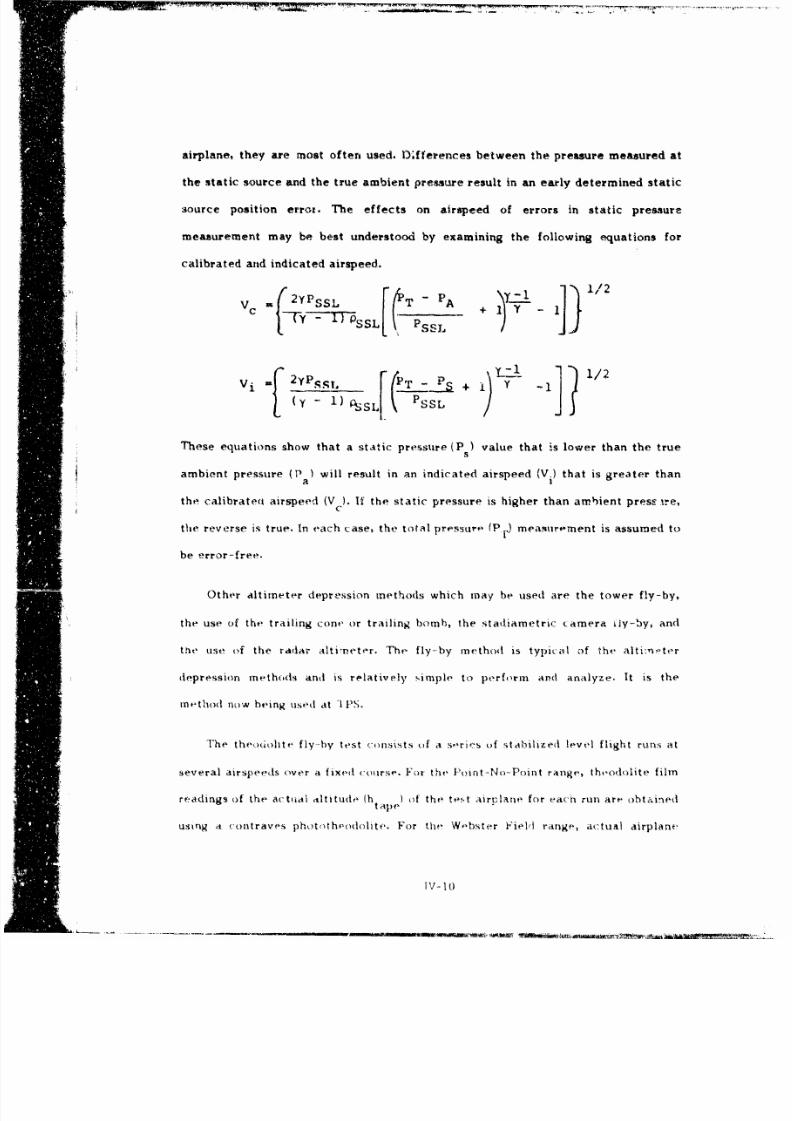
airplane, they are most often used. DOfAerences between the pressure measured at
the static source and the true ambient pressure result in an ea-rly determined static
source position error. The effects on airspeed of errors in static pressure
measurement may be best understood by examining the following equations for
calibrated and indicated airspeed.
A 1/2v SLA•ss + I Y -
f t-TT OSSL[ )SIYJ\•J•-i, k PssL -1
-i 2yP 1 KýT 1/
These equations show that a static pressure (P) value that is lower than the true; s
ambient pressure (P ) will result in an indicated airspeed (V.) that is greater thana
the calibratea airspeed (V). If the static pressure is higher than ambient press ire,C
the reverse is true. In each case, the total pressuro- )Pmeastirement is assumed to
be error-free.
Other altimeter depression methods which may be used are the tower fly-by,
the use of the trailing cone or trailing bomb, the stadiametric camera ily-by, and
tne use of the radar altineter. The fly-by method is typical of the altiln,:ter
ldepression methods anti is relatively simple to perform af(l analyze. It is the
method flow being used at 'IPS.
The theo(dolite fly-by test consists of a s,,ri,ý-s of stabilized level flight runs at
Sseveral airspeeds over a fixed comrse. For the P-tnt-No-Pomnt range, thtodolite film
readings of the actual altitudt- (h tae) of the tt .t airu lane for each run are obtci•nd
using a contrraves phototheodlolite. For the W,-bxter kFiel'l range, actual airplant,
iTV-it

8/12/2019 USN TPS Fixed Wing Performance Theory and Flight Test Technique
http://slidepdf.com/reader/full/usn-tps-fixed-wing-performance-theory-and-flight-test-technique 39/245
altitude is determined uusing a special camera which produces polaroid pictures with
a grid superimposed over the image. The altimeter position error is determined by
comparing the actual pressure altitude of the test airplane (tapeline altitude
corrected for temperature variations from standard) with the indicated pressure
altitude of the test airplane.. The airspeed position error (caused by the static
"' ~source error) may be calculated directly from the altimeter position error with the
assumption of no total pressue error. For airspeeds less than approximately 0.6M,
the airspeed position error is mainly a function of angle of attack, and the static
source position error coefficient (- determined in this test will be valid for all
altitudes at standard gross weight. Fromn the static source position error coefficient
i determined for the sth&ndard weight, the airspeed position error and the altimeter
error may be ca culated for other gross weights. For constant indicated airspeed,
S~hence constant angle of attack, the altimeter position error increases with
increasing altitude. This altimeter position• error variation can be calculated and
altimeter position error corrections for all altitudes and weights can be
extrapolated from the data (static source position error coefficients) obtained at
one altitude.
Ext rapo~lt ion of airspeed and altim•'ter posit ion error correctionrs based on sea
1ev cl dat a may not yield accept able results in all c as(-s. Ext rapIa t ion xeluires
c -rtadin s~ mplii ying ass mnp ti ni,m~ e.g., neglig i l, total pressure: •,our e error anil
t{ eynull's •lt mibe•r e ff,, •ts. For larry, e~xtrapola t ios (sea level to 40,0)()( f t) these,
j assi mpthios mnay fail, and the" po)sit ion error (,rre t ion f •r ,a tiirh}e t airphlane
,dettertnined from se'a le.ve (l:•ta ,,htain,.d must b,. v,•rifie'd by additional te,•ts at
:• ~high ,altituie using ,a (•diiratei 1)d,,. ri,r 1:•.'
n• I

8/12/2019 USN TPS Fixed Wing Performance Theory and Flight Test Technique
http://slidepdf.com/reader/full/usn-tps-fixed-wing-performance-theory-and-flight-test-technique 40/245
Milita=r Specifications
Military Specification MIL-I--6115A, Amendment 3, of 31 December 1960
states the allowable limits of the altimeter and airspeed position error:
a. Airspeed error - 4-4 kt at all airspeeds.
b. Altitude error - 25 ft per 100 KIAS.
DOD) Joint Chief of Staff memo of Z July 1963 stipulates that for all military
aircraft "THE MODE C ALTITUDE INFORMATION SHALL BE OBTAINED FROM
AN ALTIMETER WITH A MAXIMUM ALTIMETER SYSTEM ERROR OF PLUS OR
MINUS Z50 FEET AT ALL SPEEDS AND OPERATING ALTITUDES WHILE IN THE
MISSION OF FLIGHTS. ALTIMETER ACCURACIES IN OTHER PHASES OF
FLIGHT, i.e., LANDING, TAKEOFF, INSTRUMENT APPROACHES, etc., SHALL
MEET PRESENT MILITARY/FAA TSO SPECIFIC A'flON STANDARDS.-
Probe Recovery Factor
Tlie OAT is a necessary flight test parameter andl is used in conjunction with
airspi-ed~ andl aItit tide to det erni oa t rue- irsp~eed The OAT pvobeý recov ery factor
rAn he deteryniuied while -(m'duc ting I irst1)eCe and 'Alt itmeter posit ion error tests.
Phe indicati~on of the OAT gauge is a ftinrt ion of the amnbient air temperature, the
recuv erV factor of the; OAT IyteprObe, arid the airplane Mach numb~er. The
tower fly- by test is flowni ovter a range (if Mac(h nurnLers wide eniough to let-termine
Cait rer ,,)ov rv fart ot (K~')fro in t ht ( )AT r ead ings observed durin~g the ttest. Since the
r tecoverv fact or is It tieasure of th'. et fi-ienyý of the- probe lesign in p)reventing
lit-it, loss by radliation, it shmldd becomTiihu.vious that a rec(overy factor gre-ite-r than
1.0 cannot bej obtitArod1. lyI'wAl recovery fac to)rs range betwteen 0.85 to 0.98.
16eCoVerV fat torS for sj)',cial flight tvest iristrotmentattion ihmoldi be at oloast(.5
IV --I

8/12/2019 USN TPS Fixed Wing Performance Theory and Flight Test Technique
http://slidepdf.com/reader/full/usn-tps-fixed-wing-performance-theory-and-flight-test-technique 41/245
Data Recordina
a. This test requires three observers in the ground station. Two observers are
required to operate the camera equipment while a third observer calls "MARK"
whern the test airplane is over the Point-No-Point lighthouse or
abeam-the-Webester-Tower. Technical Supo.ort Division (TSD) will supply the
camera operators. TPS is required to supply the t'iirJ observer.
b. Photopanel data are generally more accurate than cockpit observed data
and will be used when available.
c. Sequence of Test Data: Tn config,,ration CR, commence runs at a
mid-range airspeed and work up tc maximum airspeed. "hen work down from the
initial airspeed to the slowest airspeed desired or allowed. For corifigurakior. PA,
begin at the maximum limit airspeed anm work, down to mini-onv) airspeed.
Correlate runs with other airplanes in the pattern to optimize safety and utilization
of the raages.
Preflight Procedures
a. i'equired Data:
1. Pilot - Kneeboard data card (Figure 3).
V , H at "MARK" called by the range observr.
0 AAT (recordi for configmation C•Z points r13y).
Configuration.
F iel remaining or fuel used.
Photopanel counter number-
PhotoUanel (if availabie).
Fnergize 10 spri:r to data point.
1Trn OFF hile libiteng downwild.
IV- 13

8/12/2019 USN TPS Fixed Wing Performance Theory and Flight Test Technique
http://slidepdf.com/reader/full/usn-tps-fixed-wing-performance-theory-and-flight-test-technique 42/245
2. Range Observer (prepare data card for each airplane).
Run No.
Theodolite end frame numbir for each run.
Time.
Ambient air temperature at beginning and. end of tower runs
(information only).
b. Know the following:
Airplane configuration details.
Airspeed ranges for each configuration.
Airp ane restrictions.
Traffic pattern.
c. Prepare data card (see Figure 3).
d. Inspect photopanel for loading and operation.
e. Note location of pitot tube and static 7,ources in order to reference the
applicable Military Specification and to discuss the test results proDerly.
lV--14

8/12/2019 USN TPS Fixed Wing Performance Theory and Flight Test Technique
http://slidepdf.com/reader/full/usn-tps-fixed-wing-performance-theory-and-flight-test-technique 43/245
W I htl
All
MII?. Li ,. , .;lF
:
$-'?:
+&U U-L±,
p, , :C,
i II.1. -
'

8/12/2019 USN TPS Fixed Wing Performance Theory and Flight Test Technique
http://slidepdf.com/reader/full/usn-tps-fixed-wing-performance-theory-and-flight-test-technique 44/245
Flight Procedures for Point-No-Point Range
a. Inform ground control that you will be operating in R4605, 1,500 feet to the
surface, in the vicinity of POINT LOOKOUT. Closest point of approach to the field
will be 7 miles.
b. After takeoff obtain clearance from Approach Control (354.8/Z81.8 mcs)
for clearance into R4005. Approach Control will shift you to project frequency
(385.2/330.4). Contact TANGO control (Point-No-Point Tower) on assigned
frequency and enter pattern on a 1,000--1,500 ft downwind leg (see Figure 4). Fly
the pattern depicted, descending to target altitude (500 ft) when established on the
inbound track. Call SIDE NUMBER, RUN NUMBER, and TARGET AIRSPEED when
inbound near POINT LOOKOUT. Call a 10 SEC STANDBY prior to passing over the
lighthouse. The tower observet should call a. "MARK" when your airplane is directly
over the )ighthouse and will record your run number for correlation of data.
c. Make the runs at approximately the target altitude in airspeed increments
to cover the range of airspeeds to be investigated in the time allowed. To obtain an
accurate measurement of height of the airplane aboie the lighthouse, it is essentiai
that the flight path be along a straight track over the lighthouse. The target
altitude for each run should be 500 ft AGL. For each run, allow sufficient
straight-avay to ensure that airspeed awt altitude are stabilized 10 sec before
passing over the lighthouse. Stabilized flight and good trim are essential to obtain
satisfactory data in this test.
d. After passing the lighthosse, be alert for traffic. Make a climbing left turn
and maintain 1,000-1,500 ft AGL. downwind. Do not descend below 1,000 ft until
l'ear of land.
IV-- 16LL.

8/12/2019 USN TPS Fixed Wing Performance Theory and Flight Test Technique
http://slidepdf.com/reader/full/usn-tps-fixed-wing-performance-theory-and-flight-test-technique 45/245
e. For each run record the observed altitude (H ) and observed airspeed (Vo)
as the airplane pa3ses over the lighthouse. When the photopanel is used, it should be
energized about 10 sec before passing the lighthouse and switched OFF when over
the lighthouse. This procedure results in a record of degree of stabilization in the
final approach with the last frame of this film burst being the actual data used.
Time and OAT may be recorded as soon as airspeed has stabilized on the inbound
leg. Record film counter number, configuration, and fuel on the downwind leg.
f. Photopanel data is desirable for this test; however, flight reports wilM be
submitted on kneepad daia in case of photopanel malfunction.
.- 1 i 7

8/12/2019 USN TPS Fixed Wing Performance Theory and Flight Test Technique
http://slidepdf.com/reader/full/usn-tps-fixed-wing-performance-theory-and-flight-test-technique 46/245
'7
RR-4006
0
1.77
- , ,;21 4406
--------IST RAN E- COTOLDAE
Noes - 1) otincernefo SPtx tAp ah
Control
(2-isedadat-uesaiie 1400sc efr
Notes (1) ObntaN-oi n TheodolitefromursePtxn Apoc
Control
8/12/2019 USN TPS Fixed Wing Performance Theory and Flight Test Technique
http://slidepdf.com/reader/full/usn-tps-fixed-wing-performance-theory-and-flight-test-technique 47/245
-77
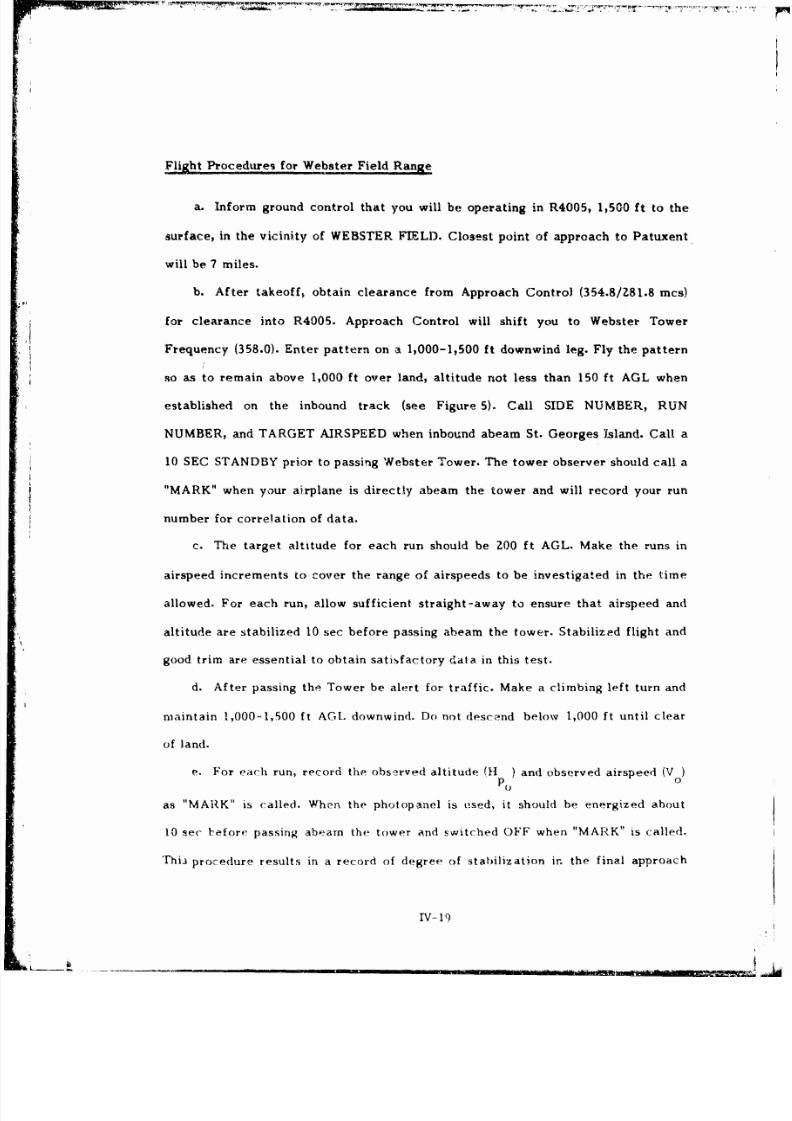
Flight Procedures for Webster Field Range
a. Inform ground control that you will be operating in R4005, 1,500 ft to the
surface, in the vicinity of WEBSTER FIELD. Closest point of approach to Patuxent
will be 7 miles.
b. After takeoff, obtain clearance from Approach Control (354.8/Z81.8 mcs)
for clearance into R4005. Approach Control will shift you to Webster Tower
Frequency (358.0). Enter pattern on a 1,000-1,500 ft downwind leg. Fly the pattern
so as to remain above 1,000 ft over land, altitude not less than 150 ft AGL when
established on the inbound track (see Figure 5). Call SIDE NUMBER, RUN
NUMBER, and TARGET AIRSPEED when inbound abeam St. Georges Island. Call a
10 SEC STANDBY prior to passing Webster Tower. The tower observer should call a
"MARK" when your airplane is directly abeam the tower and will record your run
number for correlation of data.
c. The target altitude for each run should be ZOO ft AGL. Make the runs in
airspeed increments to cover the range of airspeeds to be investigated in the time
allowed. For each run, allow sufficient straight-away to ensure that airspeed and
altitude are stabilized 10 sec before passing abeam the tower. Stabilized flight and
good trim are essential to obtain satisfactory data in this test.
d. After passing the Tower be alert for traffic. Make a climbing left turn and
maintain 1,000-1,500 ft AGL downwind. Do not descend below 1,000 ft until clear
of land.
e. For each run, record the observed altitude (H ) and observed airspeed (V0PO 0
as "MARK" is called. When the photopanel is Used, it should be energized about
10 sec tefore passing abeam the tower and switched OFF when "MARK" is called.
This procedure results in a record of degree of stabilization it. the final approach
V-V 9

8/12/2019 USN TPS Fixed Wing Performance Theory and Flight Test Technique
http://slidepdf.com/reader/full/usn-tps-fixed-wing-performance-theory-and-flight-test-technique 48/245
with the last frame of this film burst being the actual data used. Time and OAT
may be recorded as soon as airspeed has stabilized on the inbound leg. Record film
counter number, configuration, and fuel on the downwind leg.
f, Photopanel data are desirable for this test; however, flight reports will be
"submittedon kneepad data in case of photopanel malfunction.
,J*. . .\
2.. ¶ VI ErILD
C ,5..t....29 -qF
.5 ."...i
2fl 2 - /
yWebsterFieQld RaSge9
-IV-"O
-- 4, 4~-.3

8/12/2019 USN TPS Fixed Wing Performance Theory and Flight Test Technique
http://slidepdf.com/reader/full/usn-tps-fixed-wing-performance-theory-and-flight-test-technique 49/245
Tower Observer Procedures
a. Ensure a sensitive altimeter is available.
b. Arrange own transportation to the ground stations. Dress warmly in cold
weather -- both towers are well ventilated.
c. Monitor control frequency. Make transmissions as required for
coordination, call "MARK" as each data point is taken, and aid in recording data.
Record the pressure altitude of the theodolite (H ptheo) for each run, using the
sensitive altimeter in the tower. Obtain ambient air temperature (shaded area).
Post flight Procedures
a. Run photopanel film out after landing.
DATA REDUCTION AND PRESENTATION
General
Airspeed and altivaeter position error corrections for the standard gross weight
will be determined for both configurations tested. The OAT probe recovery factor
wiil also be determined. The first and last data points must be worked by hand.
Point-No-Point Procedures
From the theodolite observer's data sheet record the ambient temperature in
the tower. From the theodolite film (see Figure 6) determine:
a. Frame counter number.
b. The elevation angle of the cro.is hairs.
TV-Zli

8/12/2019 USN TPS Fixed Wing Performance Theory and Flight Test Technique
http://slidepdf.com/reader/full/usn-tps-fixed-wing-performance-theory-and-flight-test-technique 50/245
c. The error in trAcking "he airplane. This error in feet may be determined
directly from the film by using the airplane image to scale the film. When the cross
ibairs are below the airplane, the error is positive.
From the theodolite observer's data sheet and the information recorded from the
theodolite film calculate:
a. Theodolite cross hair tapeline height above the tower; use the cross hair
elevation angle and table I.
b. Airplane altimeter tapeline height above the tower; cross hair height plus
tracking error (Figure 7).
c. T (OF); use OAT data obtained at a low Mach number to approximate thisa
value.
d. III)( to ) = it + Alli c
Pic
e. Airplane pressure height above mean sea level
tape above tower
hPc4airiI-ane = te + - hta ' hta iie)
te ak~e ne - takelinhpt~werts xpane rower
Where Tstd is the standard day temperature at the tower (TStd and Ttest are in deg
Rankinr).
From kneeboard or photopanel data record the following information:
a. Altitude: Hp,
b. Airspeed: Vo0
c. Fuel used or Vuel rernaining
d. Outside: a.r ten-perature: OAT C)l0v 't

8/12/2019 USN TPS Fixed Wing Performance Theory and Flight Test Technique
http://slidepdf.com/reader/full/usn-tps-fixed-wing-performance-theory-and-flight-test-technique 51/245
E,LEVATION ANGLE
ALTIMETER
TRACKINGRROR
_
v1]r -vI 88
AZIMUTH ANGLE ,EL VATION *MGLIE P4AA COU kl rIt
Figure 6Point-No-Point Theodolite Film Data
Table 1
Theodolite Elevation Angle vs. Tapeline Altitude Above
-- e. - - " - "- '
ELEV. TAPE- ELEV.TAPE- ELEV. TAPE- ELEV TAPE- ELEV. TAPE-
ANGLE LINE ALT ANGLE LINE ALT ANGLE LINE ALI ANGLE LINE AL7 ANGLE LINE ALT
(DEG) (FT) (DEG) (FT) (DEG) (FT) (DEG) (rT) (DEG) (FT)
0 0 1.0 179 2 0 I 359 3.0 538 4.0 71 8
.1 18 1.1 197 2,1 376 3.1 556 4.1 736
.2 36 1.2 215 2.2 394 3.2 574 4,2 754
.3 54 1.3 233 2.3 412 3.3 592 4.3 772
.4 7? 1.4 251 2.4 430 3.4 610 4.4 790
.5 89 1.5 269, 2.5 448 3.5 628 4.5 808
.6 107 1.6 287' 2.6 466 3.6 646 4.6 826
.7 125 1.7 335 2.7 484 .3.7 664 4.7 844
.8 143 1.8 323 2.8 502 3.8 682 4.6 862
.9 161 1.9 341 i.9 520 3.9 700 4.9 880
1.0 179 2.0 3 538 4.0 718 5.0 898
IV-Z3

8/12/2019 USN TPS Fixed Wing Performance Theory and Flight Test Technique
http://slidepdf.com/reader/full/usn-tps-fixed-wing-performance-theory-and-flight-test-technique 52/245
TRACKINGERROR
PN PNP/...•L LIGH T HOUSE
PHCTOT I- tOO.L IT V-
"- Oo (ELEVATION ANGLE)
SAIRPLANE 52 0 ti
I AL.T IME TE R
3732 It TAPELINE 1 , HEIGHT
10,272 I .
Figure 7
Point-No-Point Theodolite Survey Data
Webster Field Procedures
a. From the tower observer's data sheet, record the ambient temperature (OF)
outside the tower.
b. From the tower polaroid film determine the scale length (inches) of the
test airplane and the ý,cale height (inches) of the test airplane above the reference
line (Figure 8).
c. Determine the actual iength (ft) of the test airplane from Appendix I.
(Airplane Details)
r\ i

8/12/2019 USN TPS Fixed Wing Performance Theory and Flight Test Technique
http://slidepdf.com/reader/full/usn-tps-fixed-wing-performance-theory-and-flight-test-technique 53/245
d. Calculate the tapeline height (ft) of the test airplane above the reference
line by the expression.
[airplane length (ft)1htape [scale Jength (inches scale heightabove reference
above reference (inches)
e. Calculate the pressure altitude in the tower by
hptower hpo + Ahpic
f. Calculate the calibrated pressure altitude of the test airplane by the
expression
tp wv .wehpcirpateower Tf77 I ht apelane -t htapelir '
airplane towe-r
whe-re
Sstds the standard day tem perature at the tower.
Tstd and Ttest are in deg R&nkine.
Position Error Determination
(,a. lli=tp + At1~P PO+'AiPL
b. Vi Vo + AVic
C Ili f (ifi) (Ti!he tables of P vs. H in Appendix IX.
. PA (1 PC ()Us tahles of P vs. t in Appendix IX .
V
' I~IV -

8/12/2019 USN TPS Fixed Wing Performance Theory and Flight Test Technique
http://slidepdf.com/reader/full/usn-tps-fixed-wing-performance-theory-and-flight-test-technique 54/245
qci f WO V j (Use charts of vs. Vcin Flight Test
Reference Book.)
9. Calculate
h. Wt Wr~tL -[Fuel used]or jj~piiy + Fuel remaining]
j WS (Use W from Airplane Details in Appendix I.)
w
J. Jw V WS 1/2
Plot the variation of P/q~ with V. and fair a smooth ciirve through the data.C. I
I w
Label this curve for the standard weight.
4 .-
Af q
77
Figure 8'i1
Poaviln DtafrinWest-r.6l

8/12/2019 USN TPS Fixed Wing Performance Theory and Flight Test Technique
http://slidepdf.com/reader/full/usn-tps-fixed-wing-performance-theory-and-flight-test-technique 55/245
The military specification requires that posiaon error be determined at sea
level (standard conditions) at a standard aross weight. In order to determine
specification complianci, use the faired curve of IAP/q vs. Vi to determine P
for varbous V & P P/q where q f(V ) since V V
iw j Ai P iw test W
Determine and plot the variation of A pos with V where tApos = Vc (based mi
qC + AP) less Vi (in this case equal to Vi ). Also determine and plot for s9ý:2, a
"t w
only the variation of AH = H less H (based on P + AP).pos Pc" Pi a
D et=ernnatlon of OAT Sxstem Recovery Factor
a. Calculate q for each data point flown
qc - qci + Ap
b. V = f(q c) (Use charts of q vs V in Flight Test Reference Book.)c C
c. Determine Mach number from VC, H p, and NA. Use V from step b *adHPC
determined earlier.
d. Calculate MN
e. Correct OAT for instr,.iment error
SA'T: OAT OAT,
f. Plot OAT.i against Mz and draw a straight line through the data extending
athe line so that It intersects the line of zero M
g. This plot is a graphical solution of the OAT equation:
OAT - Ta (1 + 0.2 KM2 ) -- 273, c
h. MWaJA'rt the slope, m, of the straight line.
IV-Z7

8/12/2019 USN TPS Fixed Wing Performance Theory and Flight Test Technique
http://slidepdf.com/reader/full/usn-tps-fixed-wing-performance-theory-and-flight-test-technique 56/245
•r2
Calculate T from t determined in statp ea a
T ta + 273, OK
,. Determine recovery factor, K
m
PresertaZion of Results
The following curves should be presented. Sample presentations are included in
the Guidelines to Flight Reports, and a sample data reduction sheet is included as
Figure 9.
a. AH versus Vi
b. AVpc,, versus Vi
C. APq,, versus Vi
d v s2. mversus OATi

8/12/2019 USN TPS Fixed Wing Performance Theory and Flight Test Technique
http://slidepdf.com/reader/full/usn-tps-fixed-wing-performance-theory-and-flight-test-technique 57/245
;~~ ....4.l
~i'~i~ E4~T --+ III I,
U1t
iv - -. 4-IL i
t~t-.. -. .- ".,TV ) mP9 j~

8/12/2019 USN TPS Fixed Wing Performance Theory and Flight Test Technique
http://slidepdf.com/reader/full/usn-tps-fixed-wing-performance-theory-and-flight-test-technique 58/245
III.. ,!.PL 411 i -l....-
-. /_ ! I I t+__4ti
I alo 01 _
"" I o, (1
r....r TV __,t
S.. ...~ ........-__ ,
C l I i~, LIl l:
I 1' T I ' , . I ' •I , t
2,i1~'*'I I

8/12/2019 USN TPS Fixed Wing Performance Theory and Flight Test Technique
http://slidepdf.com/reader/full/usn-tps-fixed-wing-performance-theory-and-flight-test-technique 59/245
SECTION V
STALL AIFSPEED DETERMINATION
:•I.mi

8/12/2019 USN TPS Fixed Wing Performance Theory and Flight Test Technique
http://slidepdf.com/reader/full/usn-tps-fixed-wing-performance-theory-and-flight-test-technique 60/245
i,-• r
REFERENCES
Section V
1. USNTPS - FTM - No. 1OZ, Section U[.
2. Flight Test Technical Memorandum 7Z-1, "Determination of Performance Stall
Airspeed at Altitude and Sea Level."
.V1 v-

8/12/2019 USN TPS Fixed Wing Performance Theory and Flight Test Technique
http://slidepdf.com/reader/full/usn-tps-fixed-wing-performance-theory-and-flight-test-technique 61/245
STALL AIRSPEED DETERMINATION BY THE PACING METHOD
PURPOSE
The purpose of this test is to determine the stalling airspeed of the test
airplane in the takeoff and landing configuration. The variation of indicated
stalling speed with airplane gross weight is required for presentation in the flight
handbook. The calibrated stall airspeed will be used to determine compliance with
the contract guarantee.
DISCUSSION AND THEORY
In the classic aerodynamic one g stall, the coefficient of lift increases as the
airspeed decreases until an angle of attack is attained at which the lift abruptly
diminishes and the airplane ceases to fly. The stall airspeed for this case is well
defined. In many airplanes, the classic stall does not occur. In these cases, the
airplane will exhibit some characteristic at low airspeed which defines a minimum
useable flying speed. This characteristic may be loss of effective control about one
or more axis or a high sink rate. Although the aerodynamic stall has not occurred,
the minimum useable flying speed is, in effect, the contract stalling speed of the
airplane. Frequently, this airspeed is not well defined and is subject to
interpretation by the particular pilot concerned. Therefore, it is most ilbportant
that the stall speed for a particular airplane be defined consistently.
A pilot is primarily concerned with the indicated airspeed at stall, and this
value is easily determined from the indication of the service airspeed system. In
performance testing, acc•urate calibrated, stall airspeeds are required to determine
liftoff and obstacle clearance airspeeds for takeoff performance and are used in
V-Z

8/12/2019 USN TPS Fixed Wing Performance Theory and Flight Test Technique
http://slidepdf.com/reader/full/usn-tps-fixed-wing-performance-theory-and-flight-test-technique 62/245
determining carrier launch criteria. In addition, they are used as an incentive or
penalty for airplane contractors (performance guarantees). Because of the large
angles of attack attendant to the ;tall, the service airspeed system position error
usually is large and not accurately known. One means of determining the- stall
airspeed precisely is by equipping the test airplane with a special pitot-.static
system with a known position error. Another method is to measure the stall
airspeed of the test airplane from a pacer airplane which has a lower stall speed.
The pacer airplane is equipped with a special pitot-static system for which the
position error is accurately known.
In an airplane loaded at one center of gravity (cg) location, the stall will occur
at the same coefficient of lift regardless of the airplane gross weight. Unless large
t'irust effects are present, the stalling airspeed will vary with the square root of
the airpiane gross weight. This relationship can be used to extrapolate stall speed
data for one gross weight to other gross weights. If the cg location moves as the
. airplane weight changes, tbe coefficient of lift at stall also will change and the
square root relationship will be approximate only. Another factor which influences
stall speed is altitude. As altitude increases, the maximum lift coefficient
decreases because of Reynold's number and Mach number effects. This , iults in
an increase in stall speed as altitude increases; however, this effect is usually
negligible for altitudes below 10,000 ft.
Nonsteady aerodynamic flow effects must be considered in the determination
of stall airspeed. These effects are caused by the change in vorticity over the
actual lifting surface. Any change in vorticity must take place over some finite
period of time. The problem has been treated by a number of researchers, and
analysis shows that airfoils changing flow patterns in distances less than Z5 chord
V-3

8/12/2019 USN TPS Fixed Wing Performance Theory and Flight Test Technique
http://slidepdf.com/reader/full/usn-tps-fixed-wing-performance-theory-and-flight-test-technique 63/245
lengths experience appreciable nonsteady flow effects. A satisfactory first
approximation for calculating the ratio of actual to steady state lFft values
following a step change in airspeed is shown in equations (1) and (Z). Equation (1) is
for accelerations and equation (Z) is for decelerations.
•;•, •. =R +___ I
LO R +2Z
L R + 2 (2),L-O
L is lift after travel of R semi chord lengths, and L is steady state lift after travel0
of an infinite number of semi chord lengths. For the decelerating case, this chord
travel can be expressed in terms of airspeed as shown in equation (3).
s ! -I- (Vo) (3)s
For uniform accelerations, the relation of actuai to steady state lift is a more
complex relationship, but still retains a primary relationship to chord lengths
traveled. The acceleration case has received considerable attention with regard to
catapult design. The deceleration case has been generally neglected in technical
literature. An empirical approach for determining R that appears to work well is
proposed in equation (4).
R LA (4)C.
V-4

8/12/2019 USN TPS Fixed Wing Performance Theory and Flight Test Technique
http://slidepdf.com/reader/full/usn-tps-fixed-wing-performance-theory-and-flight-test-technique 64/245
Here, Va is t"•_ measured (test) stall airspeed in KIAS; V is deceleration rate in
kt/sec, &1Ac 9 the chord in feet.
An example which demonstrates both the wze of these equation. and the
importance of a small deceleration rate follows.
Vs = 114 KIAiS
V = -0. , kt/sec
c = 3 ft
therefore,
R 114 = 76
76 + 2 (114) = 114.4 KIASOs 76 + i
However, at a deceleration rate of 5 kt/sec, ýhe test stall airspeed is 108 KIAS. In
this case
_ 08 7.
= 9.2 (108) = 114.4 KIAS
The example shows the importance of a deceleration rate that is no greater than
1 kt/sec, and that in the airspeed range of these test results, a 5 kt/sec
deceleration yields a test stall airspeed that is 6.4 kt too low. Such results please
contractors, but are cf little test value.
V--5

8/12/2019 USN TPS Fixed Wing Performance Theory and Flight Test Technique
http://slidepdf.com/reader/full/usn-tps-fixed-wing-performance-theory-and-flight-test-technique 65/245
TEST PROCEDURES AND TECHENiUES
Pertinent Particulars
a. Approach stall speed at a deceleration rate of 1 kt/sec or less (1/2 kt/sec
preferred).
b. Alternate the configurations being tested.
c. All data will be kneeboard data (no photopanel).
d, Self-paced flights may be conducted in appropriately instrumented air-
planes capable of obtaining calibrated stall airspeeds. Attempt to achieve the
maximum possible difference between the gross weight at the heaviest data point
and the gross weight at the iightest data point.
PreflihtProcedures
SaPrepare pilot's and pacer obscrver's data cards. In flight, at each stall,S~he follow•ing data:
S"rpan Pacer
Run No. Run No.
Airspeed Airspeed as read from specialairspeed system
Fuel u.ied ;r remaining Pacer configuration
Configuration Reraa;'ks as to validity of dat:t point(i.e., any relative motion betweea
Pres..ux e .•i titude airplanes)
b. Brief with pacer pilot as to rendezvous poir,t and altitude, radio frequency,
formation tc",tiomi, and hand signals in case of communication failure.
c. P-•eview 4k;*~l approach technique and stall recove•ry procedures,
V_6
8/12/2019 USN TPS Fixed Wing Performance Theory and Flight Test Technique
http://slidepdf.com/reader/full/usn-tps-fixed-wing-performance-theory-and-flight-test-technique 66/245
Flight Procedures
Before the pacer jorias the test airplane, the test pilot should perform at least
one stall in each configuration to observe stall characteristics. If the airplane
tends to pitch up or roll at the staUl, instruct the pacer to join on the "safe" side.
When cleared by the test airplane pilot, the pacer should take an echelon formation
position, but not so wide that quick detection of relative motion is lost.
When the pacer is in position, the thrust of the test airplane should be
smoothly set for the desired configuration and a steady deceleration of I/Z kt/sec
or less commenced. Control the deceleration rate by adjusting rate of climb or
descent. A few seconds before stall call out "STAND-BY" and at the stall "MARK."
Recover from the stall and record data.
Ai the test airplane decelerates, the pacer must maintain a constant relative
position. For the landing configurations, the pacer will usually require landing gear
and flaps DOWN and speed brakes EXTENDED in order to maintain position. If the
pacer tends to overrun the test airplane, the best results are obtained by allowing
the test airplane to descend below the pacer while maintaining a constant position
in the vertical plane. If there should be relative motion at the stall, make an
esýtimate of the relative speed and record this information on the observer's data
card. Keep the test airplane in sight during the stall recovery, but do not dive to
follow him. A quicker rendezvous is accomplished when the pacer maintains his
altitud. . When the pacer is again in position, repeat the test in the other
configuration. Continue to conuluct paced stalls in alternate configurations until
the required data is obtained cr innirniun fuel is reached.
V-,7
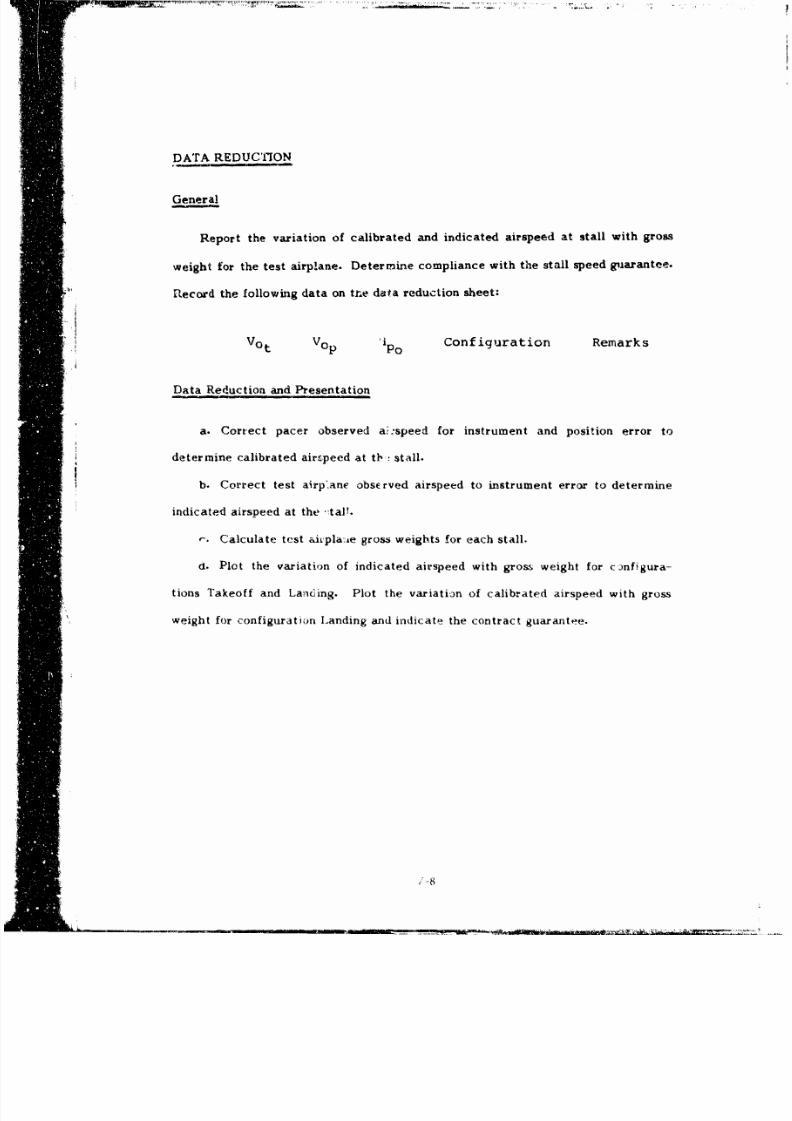
8/12/2019 USN TPS Fixed Wing Performance Theory and Flight Test Technique
http://slidepdf.com/reader/full/usn-tps-fixed-wing-performance-theory-and-flight-test-technique 67/245
DATA REDUCTION
General
Report the variation of calibrated and indicated airspeed at stall with gross
weight for the test airplane. Determine compliance with the stall speed guarantee.
flecord the following data on the data reduction sheet:
Vot VOp poO Configuration RemarksJ
Data Reduction and Presentation
a. Correct pacer observed a":speed for instrument and position error to
determine calibrated airspeed at ti! stall.
b. Correct test airp'.ane observed airspeed to instrument error to determine
indicated airspeed at the 1tall.
-- Calculate test aixpla:,e gross weights for each stall.
d. Plot the variation of indicated airspeed with gross weight for cinfigura-
tions Takeoff and Landing. Plot the variation of calibrated airspeed with gross
weight for configuration Landing and indicate the contract guarantee.
•m-8

8/12/2019 USN TPS Fixed Wing Performance Theory and Flight Test Technique
http://slidepdf.com/reader/full/usn-tps-fixed-wing-performance-theory-and-flight-test-technique 68/245
SECTION VI
DETERMINATION OF EXCESS POWER CHARACTERISTICS
.L•a

8/12/2019 USN TPS Fixed Wing Performance Theory and Flight Test Technique
http://slidepdf.com/reader/full/usn-tps-fixed-wing-performance-theory-and-flight-test-technique 69/245
SECTION VI
NOTATIONS INTRODUCED IN THIS SECTION
AHp Difference in pressure altitude at the upper and lower limit of an altitude
band centered at the test altitude
R/Ci Average indicated rate of ciimb, AHPi/At
WA Average test gross weight, sum of test weights at each pointnumber of points
Eh Energy ".eight, or ,Tp- .ific e;e:f7,
dEh/dt Rate of change of energy height
h Geometric altitude, ft
H Pressure altitude, ftP
a Subscript signifying standard day conditions and standard airplane gross
weight
At Increment of time required to climb through test altitude baiid
P Specific excess power, equas dEh /dts
4 r1
- !-
8/12/2019 USN TPS Fixed Wing Performance Theory and Flight Test Technique
http://slidepdf.com/reader/full/usn-tps-fixed-wing-performance-theory-and-flight-test-technique 70/245
,wm,•.. ... .. . W . ......... . . . . .. ........... ..... . . .. . ..
REF ERENCES
SECTION VI
1. AGARD Vol. 1, pp. 4:37-4:40 and 7:Z7-7:31
Z. Donmmasch, Airnlane Ae'odynaics, pp. Z89-Z90
3. Rutowski, DAC, "Energy Approach to the General Aircraft Performance
Problem," 1953
4. Ikyd, J. R., MAJ, USAF, "Energy - Maneuverability," 1966
VIn
L _

8/12/2019 USN TPS Fixed Wing Performance Theory and Flight Test Technique
http://slidepdf.com/reader/full/usn-tps-fixed-wing-performance-theory-and-flight-test-technique 71/245
DETERMINATION OF EXCESS POWER - LEVEL ACCELERATION RUNS
AND SAWTOOTH CUIMiS
PU RPOSE
The parpose of conducting acceleration runs and nawtooth climbs As to
determine the variation of excew twer with airspeed. For acceleration runa, the
data will be used to evaluate level accele.ation characteristics and maidimum level
flight airspeed, to determine one or more climb schedules, and can be used to
estimate level flight turning performance. For sawtooth climbs, the data will be
used to evaluate climb characteristics.
DISCUSSION AND THEORY
tGeneral
in aLnalyzing acceleration or climb perform&nce, it is advisable to consider the
airplane from the st&ndpoint of total energy (TE) which is the sum of potential (PE)
and kinetic (KE) energies. The total energy of an airplane at a given weight (W),
airspeed V), and geometric altitude *(h) is,
iT t It, Wl
dividing br W and defining energy height as:
tW A
*Geometric altitude asumied equal to g.ýopotential altitume
VVI3

8/12/2019 USN TPS Fixed Wing Performance Theory and Flight Test Technique
http://slidepdf.com/reader/full/usn-tps-fixed-wing-performance-theory-and-flight-test-technique 72/245
Energy height, or sp-.cific energy, can also be interpreted as energy 7ititude; the
altitude which could be attained if all the kinetic cnergy were per.kc,'rl converted
to potential energy. Differentiating, we obtain:
dEh dh V dVI. -- d t -_ - (3), dt i
Now consider the free,-body udiagram of an airplane in climbing flight where the
thrust (F) ia assumed to be along the flight path:
t •(v)
L V)
W dV9dt W
Figure 1
Free-Body Diagram
M1 i (2 11Vlr
dt g d t
and summing forces along the flig{ht path:
v - 1 W s il Y . . V
or, rearranging,
=•, , :u y~ ~~~~ VIt....I•(Y , d t
VIA
-

8/12/2019 USN TPS Fixed Wing Performance Theory and Flight Test Technique
http://slidepdf.com/reader/full/usn-tps-fixed-wing-performance-theory-and-flight-test-technique 73/245
ncting that:
substituting (7) into (6) and multiplying by V:
(III V IV V (F D)
Now notice that we have an expression for the airplane's excess pow-r V(F
Comparing with (3), we define speciic excess bower as.
((i-dEh 1h V dV f -
W it dt Jt ) - C
Level Acceleration Runs
I.1n acceleration tests, the first term of equation (9) can be erirl'naied b.
mo.intaining constant altitude ~t= 0%, and specific e, c.ess nower can be me,.su ,edd't
in terms of airspeed and linear acceleration [9,. The vawiation of spec&,ic e-ces5,
power with airspeed ii determined for one altitude over the entire ý .- A light
speed range of the airplare. This is done by conducting level accelet Atioý. uans
from near minimum aiispeee (V min to the maximum level flight airsp dýr
maximumr airspeed (Vmax).
V-I-5
S• ... .... ............ -, - ••- • ,-',• • =•• '" •- • ................ ,.....,.,.....,....-.........,>S
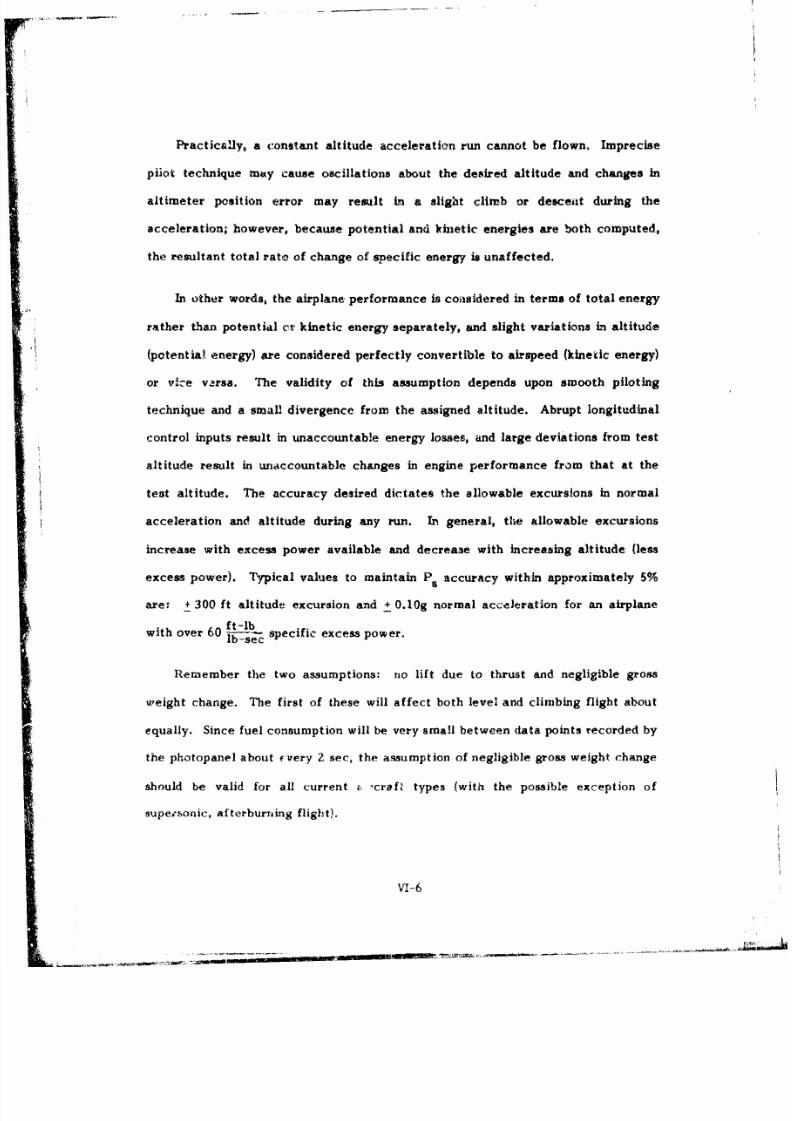
8/12/2019 USN TPS Fixed Wing Performance Theory and Flight Test Technique
http://slidepdf.com/reader/full/usn-tps-fixed-wing-performance-theory-and-flight-test-technique 74/245
Practically, a constant altitude acceleration run cannot be flown. Imprecise
pilot technique mxy cause oscillations about the desired altitude and changes in
altimeter position error may result in a slight climb or descent during the
acceleration; however, because potential and kinetic energies are both computed,
the resultant total rate of change of specific energy is unaffected.
In other words, the airplane performance is considered in terms of total energy
rather than potential or kinetic energy separately, and slight variations in altitude
(potential energy) are considered perfectly convertible to airspeed (kinetic energy)
or v.~e v-rsa. The validity of this assumption depends upon smooth piloting
technique and a small divergence from the assigned altitude. Abrupt longitudinal
control inputs result in unaccountable energy losses, and large deviations from test
altitude result in unaccountable changes in engine performance from that at the
test altitude. The accuracy desired dictates the allowable excursions in normal
acceleration and altitude during any run. In general, the allowable excursions
increase with excess power available and decrease with increasing altitude (less
excess power). Typical values to maintain Ps accuracy within approximately 5%
are: + 300 ft altitude excursion and + 0.10g normal acceleration for an airplaneft-lb
with over 60 ft-lb specific excess power.
Remember the two assumptions: no lift due to thrust and negligible gross
weight change. The first of these will affect both level and climbing flight about
equally. Since fuel consumption will be very small between data points recorded by
the photopanel about cvery 2 sec, the assumption of negligible gross weight change
should be valid for all current z. -crefl types (with the possible exception of
supersonic, afterburning flight).
VI- 6

8/12/2019 USN TPS Fixed Wing Performance Theory and Flight Test Technique
http://slidepdf.com/reader/full/usn-tps-fixed-wing-performance-theory-and-flight-test-technique 75/245
Sawtooth Climbs
In sawtooth climbs tests, the second terra of equation (9) is eliminated by
dVmaintaining a constant true airspeed (•. 0), and excess power is measured in
terms of vertical speed (4t). The variation of specific excess power with airspeed
can be determined for one altitude by conducting a series of short, constant true
airspeed climbs at various airspeods over the speed range of the airplane.
Since climb performance at given calibrated airspeeds is usually the data
desired from sawtooth climbs, true airspeeds may not be held constant. For this
case, true airspeed is increasing throughout the test climb which will result in
"actualPs being greater than the indicated rate of climb.
A graph of' the variation of rate of climb with airspeed for the test conditions
is prepared from these data. A horizontal tangent to this curve defines the
airspeed for maximum rate of climb at that altitude and gross weight. A tangent
through the origin (V = 0, R/C = 0) determines the airspeed for maximum climb
angle.
The observed climb performance is affected by changes in airplane gross.
weight and by variations in power or thrust available. A change in airplane weight
has two effects on climb performance. First, the rate of chirnb and climb angle are
inversely proportional to weight. In addition, a weight change causes variations in
induced drag, which atters the power and/or thrust required curve, thus affecting
the airspeeds at which wnxaiu•nu rate of climb and rnaimvrnv clhvib angie occur.
The change in these airspeeds is negligible for small variations around a sitandard
(mission - relaie) gross weight. Variat.ions in anbient ter.,mperature produce changes
V! 7

8/12/2019 USN TPS Fixed Wing Performance Theory and Flight Test Technique
http://slidepdf.com/reader/full/usn-tps-fixed-wing-performance-theory-and-flight-test-technique 76/245
- - '-,,,•ru• .•t ,.,•- • • •-•• • • N •
in power (or thrust) available that are essentially constant with airspeed for
propeller driven (jet) airplanes. Therefore, variations in power available will affect
only the value of the rate of climb for propeller driven airplanes and not the
airspeed at which it occurs. Similarly, the effect of variations in ambient
temperature on the airspeed for maximum climb angle for turbojet airplanes is
negligible.
When only the airspeeds for (and not the actual values of) maximum rate of
climb and maximum climb angle are of interest, the effect of decreasing weight
during the test may b~e minimized by obtaining the data in a particular order. If the
constant airspeed climbs are flown in ascending order of airspeed, than in
descending order at the same airspeeds, the average airplane gross weight for each
pair of data points will be approximately equal. This technique may be further
complemented by correcting each data point to an average test weight. A curve
faired through all of the data will be representative of the climb perforr,,m t.o
the average gross weight and the test day conditions (see Figure 7 for an example
of such a graph).
Other factors which may affect the test results are the influence c.f vertical
air cuarrents and changing wind velocity with altitude (wii.u thear). Vertical air
currents usually can be avoided by careful selection of test conditions. The effect
of wind sheai' can be minimized by performing climbs on a heading which is
perpendicular to the reported winds.
V'1- 8

8/12/2019 USN TPS Fixed Wing Performance Theory and Flight Test Technique
http://slidepdf.com/reader/full/usn-tps-fixed-wing-performance-theory-and-flight-test-technique 77/245
In general, high climb rates and excessive testing time render the sawtooth
climb method impractical for turbojet airplanes except in the high lift and single
engine configurations. The most significant advantage is that the data are
collected in the climb attitude and the reduction in induced drag associated with
climbs is accounted for.
TEST PROCEDURES AND TECHNIQUES-ACCELERATION RUNS
Preflight Procedures
a. Required data.
Time (or time increment).
V (continuous record during run).0
H (continuous record during run).p0
OAT (start and end of run) or Ta
Fu, used or fuel remaining (continuous record during run).
Photopanel is primary data source. Record correlating data on kneepad card.
b. Prepare da a card (Figure 2).
'i 9
., ....,,
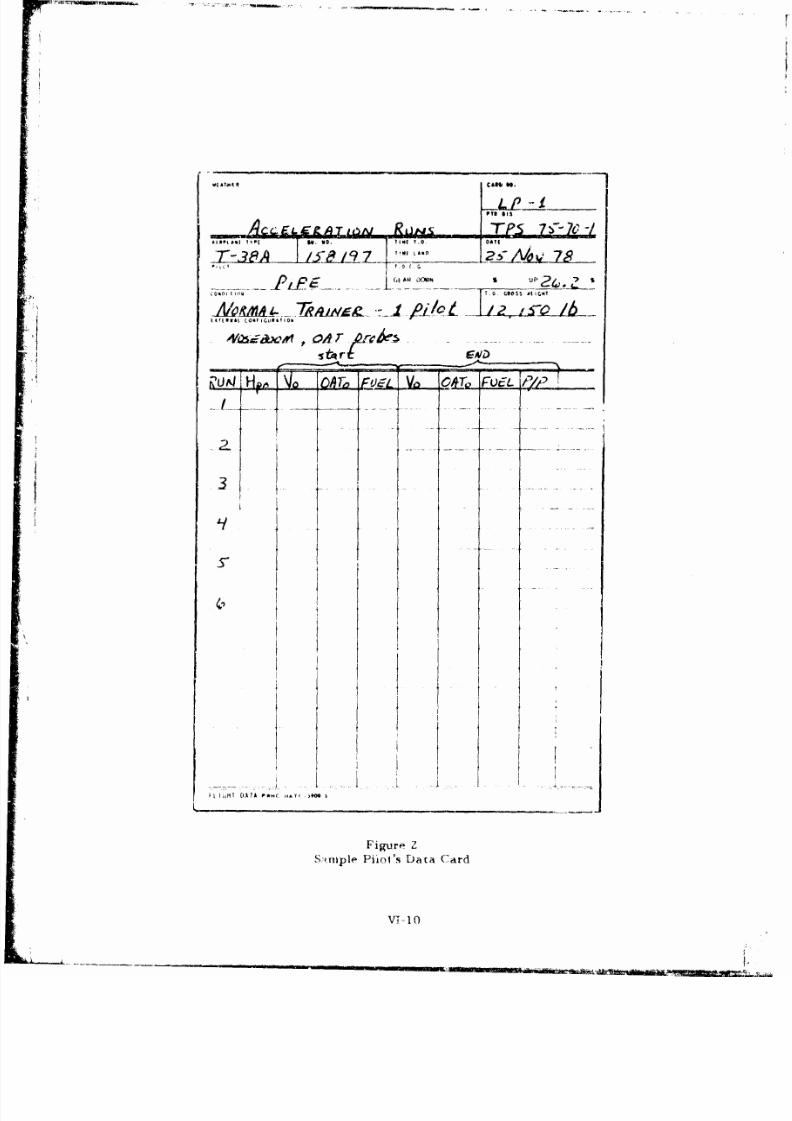
8/12/2019 USN TPS Fixed Wing Performance Theory and Flight Test Technique
http://slidepdf.com/reader/full/usn-tps-fixed-wing-performance-theory-and-flight-test-technique 78/245
01A.
CA" 1.
Ac cF-"9,AT Q JA/ AJ Teml 7ý&,-2.19ptp ~ ~ ~ ~ ~ 0II10K .,DT
- -7-e ,~J I' ;?S-A/0 7
61TAllfUP s
4., IIDTAP.Y 0
Fgu re
Slr-rnple Pfiol's Data Card
Wi 0O
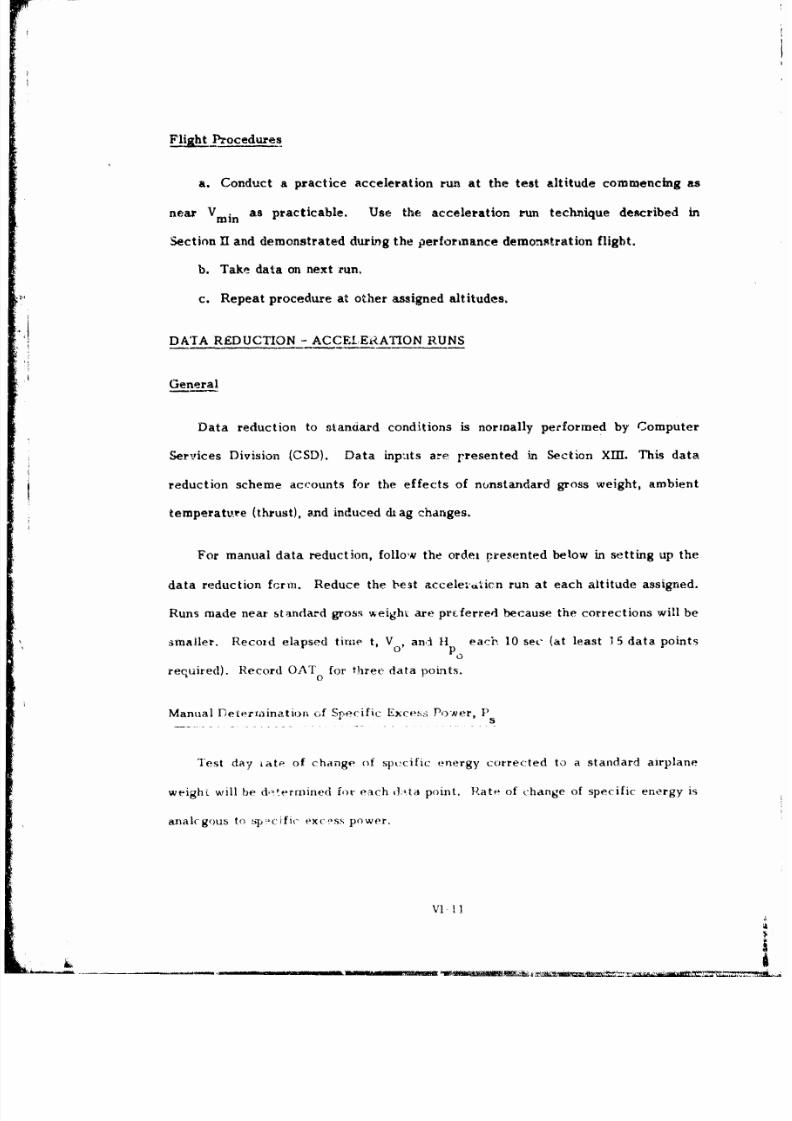
8/12/2019 USN TPS Fixed Wing Performance Theory and Flight Test Technique
http://slidepdf.com/reader/full/usn-tps-fixed-wing-performance-theory-and-flight-test-technique 79/245
Flight Procedures
a. Conduct a practice acceleration run at the test altitude commencing as
near V min as practicable. Use the acceleration run technique described in
Section II and demonstrated during the performance demonstration flight.
b. Take data on next run.
c. Repeat procedure at other assigned altitudes.
DATA REDUCTION - ACCELEi-RATION RUNS
General
Data reduction to standard conditions is normally performed by Computer
Services Division (CSD). Data inputs are 1 'resented in Section XII. This data
reduction scheme accounts for the effects of nunstandard gross weight, ambient
temperature (thrust), and induced dcag changes.
For manual data reduction, follow the order rresented below in setting up the
data reduction fcrtn. Reduce the best accele-.Aicn run at each altitude assigned.
Runs made near standard gross weight are prcferred because the corrections will be
smaller. Record elapsed time t, V0 , ani H each 10 sec (at least 35 data points
required). Record OAT for three data points.
Manual Peterraination of Specific Exce:-:- Power, Ps
Test day tate of change of specific energy corrected to a standard airplane
weight will be d-termined for each d:,ta point. Rate- of change of specific energy is
analhgous to spz-<cifir exceý-ss power.
I I-

8/12/2019 USN TPS Fixed Wing Performance Theory and Flight Test Technique
http://slidepdf.com/reader/full/usn-tps-fixed-wing-performance-theory-and-flight-test-technique 80/245
a. Correct V for instrument and position error to obtain V . Assume lag
0 C
error negligible.
b. Correct H for instrument and position error to obtain Hp
c, Determine Mach number correspondkg to above values of V and H .
d. If necessary, calculate T (0K) from OAT at three data points.t•a o
1. Correct OAT for instrument error.
2. Calculate M corresponding to time of observation of OAT.
3. Determine t by entering Appendix IV with OAT and M.a
4. Calculate T (0) = ta (00 + 273.-• a a
e. Calculate TAS for each data point. Use the average value of TS~a
determined in step d.
V = . 65.7 " a (fEs)
f. Construct a working plot of the variation of VT and H with elapsed tirne.
Use scales of 100 fps/in. for airspeed, 200 ft/in. for altitude, and Z0 sec/in. for
time. Fair a curve through the data points. After fairing the data,you
will
observe that at an instant when the data shown is greater than an average rate of
climb, the linear acceleration is less than average (see Figure 3 for an example of
such a plot).
VI- 12

8/12/2019 USN TPS Fixed Wing Performance Theory and Flight Test Technique
http://slidepdf.com/reader/full/usn-tps-fixed-wing-performance-theory-and-flight-test-technique 81/245
dt
id
AL
w
P) d U
cU
IA. 0
ELAPSED T IME ( A t ) - SEC
"Figure 3
Acceleration Run Working Plot
g. Gre.phically measure dV/dt and dHp /dt for at least eight poirktt on the c•irves of
step f. Record also the corresponding value of VT. Caution - a protractor should
not b,, used for measuring these derivatives.
h. ()0 Lain standard( day ainbient temperature kT) from I(CAO atmosphere table.a
Calculate rate of chinge of geometric altitude, dh/dt. This correct ion is necessary
• ~bec.-'use ot nonst and.?.I-d dens•i ty.
it(,it. (13
Vi

8/12/2019 USN TPS Fixed Wing Performance Theory and Flight Test Technique
http://slidepdf.com/reader/full/usn-tps-fixed-wing-performance-theory-and-flight-test-technique 82/245
i. Determine airplane weight for the run. Use fuel data recorded at the end
of the run.
j. Calculate ratio of airplane weight for test to standard airplane weight,
W /Ws. Use the values of airplane standard weight listed in TPS Airplane Details.
Correction of P to Standard ConditionsiS
In deterain'ng rate of change of specific entrgy for standard conditions, it is
necessary to account for the differences in airplane weight from standard weight
and ambient temperature at the test altitude from standard day ambient
temperature. Differences in weight affect the momentum and the induced drag.
These differences result in a different acceleration characteristic being observed
for the test conditions than would have occurred for standard conditions. While the
corrections for gross thrust and ram drag cannot be considered negligible
(particularly near the service ceiling of the airplane), these corrections are tedious
and will not be made manually. 'he induced drag correction is small in relation to
the rest of the terms and will also be neglected for the manual data reduction.
Both these corre-ct ions are included in the conminuter data reduction.
k. (Calculate rat of change of specific energy for standard conditions. The
gross weight correction is implicit in the equation.
S~VI 14

8/12/2019 USN TPS Fixed Wing Performance Theory and Flight Test Technique
http://slidepdf.com/reader/full/usn-tps-fixed-wing-performance-theory-and-flight-test-technique 83/245
a'7ý
1. Comptute Marb number for ,-ch value of V, obtaned .instep g.
G. lhcal Prresentation of Results
a, Plot the variation of specific excess power for standard weight and ambient
temperature with Mach number or calibrated airspeed (Figure 4).
U
MACH NUMBER (OR CASý
( 4
teraph of Exw-×esti Power (Characteristics
b Wilt Ie s , iitt iogF Ow' f g t r t, m, Iti (Irt, th~ O in plot x. the vb a
'A ii

8/12/2019 USN TPS Fixed Wing Performance Theory and Flight Test Technique
http://slidepdf.com/reader/full/usn-tps-fixed-wing-performance-theory-and-flight-test-technique 84/245
~ ~ ~ -..-..... '.... ..... ... ,. ......
TEST PROCEDURES AND 'rFECHNy U:S -SAWTOOTr{ CLIMBS
Pertinent Particulars
a. Make several constant airspeed cli.nbs (or descents) in ascending order of
observed airspeeds from the mininmum test airspeed to the maximum. Then mahe
the same number of climbs in descending order at approximately the same
airspeeds.
b. Use military or c7ombat rated thrust in jets. Maintain constant power in
propeller driven airplanes by adjusting MAI" or torque as neceasary during the
climb. For the altitudes at which full throttle is reached attempting to maintain
constant power, usz the MAI' or torqtut, at the test ltiitudt- &%sn average value.
Note the dltittde at which full throttie &: reached.
c-. |Phoopanel data are desired; however. prepare the report ort the basis of
knit-ehoard data if photOI'panI.- datta are not available.
Prlt fhlght Prucedurls
Altitude band i ý11
i•tkt remlaitlng.
V'l at te-st iltitd- for F -
P i'kr od \ -d. ,e t,, rk5 lu" -1 L s AttM t .it"
1ýý rol,- ai,%Car' O"S kil-, Y
V 1 1
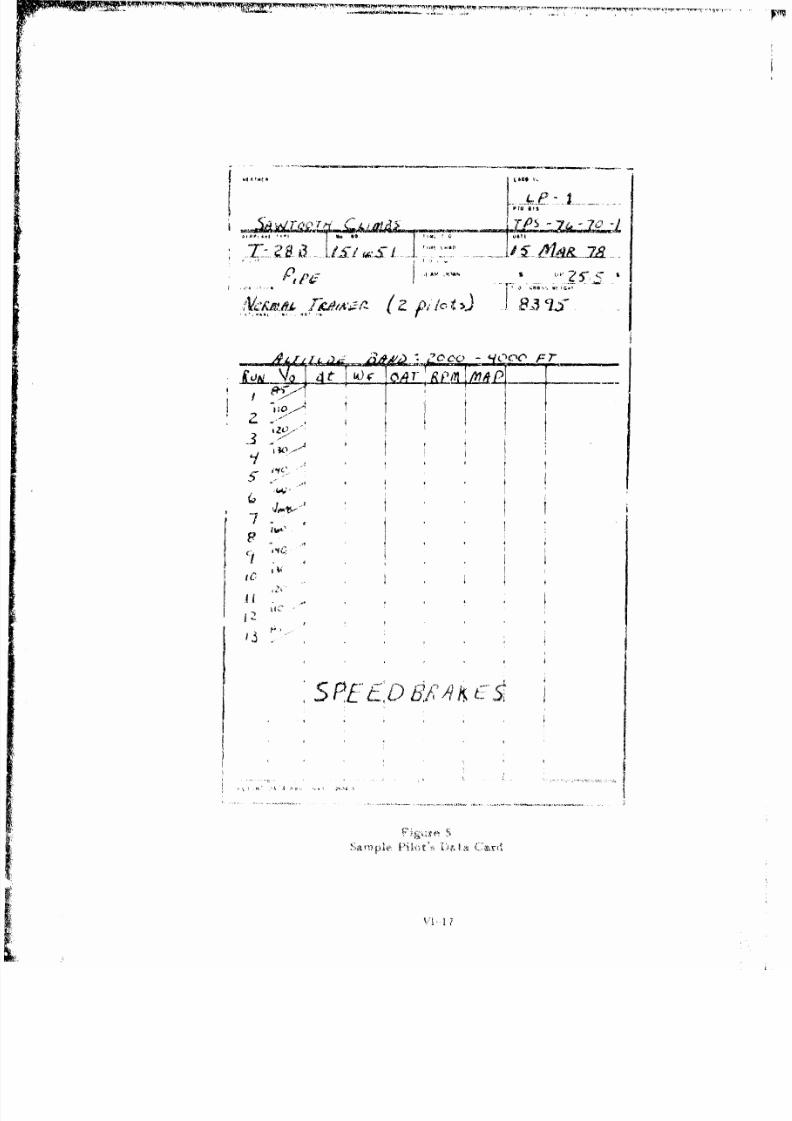
8/12/2019 USN TPS Fixed Wing Performance Theory and Flight Test Technique
http://slidepdf.com/reader/full/usn-tps-fixed-wing-performance-theory-and-flight-test-technique 85/245
.1 AM 1041
S~~ GIOt'A
K.4A' Of 2, 7 A m

8/12/2019 USN TPS Fixed Wing Performance Theory and Flight Test Technique
http://slidepdf.com/reader/full/usn-tps-fixed-wing-performance-theory-and-flight-test-technique 86/245
.,•,4ww~'-,. . ,,• *. .- ..... , ., . ,, ... ••.. , :.
c. Review assigned scope of test and wAke notes on data card to be used as a
reminder during the test, such As: configuretion details, desired c6imb airspeedq,
and altimeter barometrlc setting of 29.9Z in Hg.
"d. Obtain teat altitude forecast winds from aerology.
e. Carry a 60-sec stopwatch.
f. Rc-iew photopanel operating procedures and switchology. For this test,
use a camera speed of I/Z frame per second.
g. Before leaving the flight line, check the operation of the photopanel.
The .aw:oth climbs, method consists of a series of constant observed airspeed
climbs through an altitude band. All climbs are perforrued on the same heading
perpendicular to the forecast wind at the test altitude.
a. At 300 to 500 ft below the altitude band on the required climb heading,
trim the airplane in evel flight a•t the desired climb airspeed.
b. Set the power or thrust and establish a stabilized climb. Chech
(configuration details and trim the airpline. Maintain constant power by adjusting
MAP or torque freqtently in tht climb.
: Energize the photo,•aji l about 10 b•: fore ent,ýýriig thk altitude band.
d. With the sitopw &tch, Ies~eh4em.rne uired to t ani~it. trmgh the
'ir' lP I'MAra ~

8/12/2019 USN TPS Fixed Wing Performance Theory and Flight Test Technique
http://slidepdf.com/reader/full/usn-tps-fixed-wing-performance-theory-and-flight-test-technique 87/245
LEVEL -- RECORD FUEL, At,OAT, dh, KIAS, RPM, MAP
OWATCH -NERGIZE P/P
TOP 200'-300'
NOTE RPM, Q, MAP, OA TTEST ALT TEST AL T
I, ~ STARI STOPWATCH/
NOTE IAS
BOTTOM200' -300 ' STABILIZED AND TR'iHMED
ENERGIZE P/P
SET (O)NFIGURATION, X-WINDHDC, TRIM AT DESIRED IAS
Figure 6Savwtooth Climb Flight Procedures
8/12/2019 USN TPS Fixed Wing Performance Theory and Flight Test Technique
http://slidepdf.com/reader/full/usn-tps-fixed-wing-performance-theory-and-flight-test-technique 88/245
g. Reverse coutrse, descend, and repeat the procedure at thc: next desired
airspeed.
h. Since the rate of climb will be zero, tCe maximum airspeed run must be
made at the test altitude. Ensure tha the airplane has stabilized in airspeed
before recording data.
i. It is not imperative that the climb airspeeds be precisely the planned
airspeed for the climb. For good results, the airspeed at the upper limit of the
band must be identical with the airspeed at the lower limit. In the climb, attempt
to maintain airspeed within +1 kt of the initial value.
j. If the wind at the test altitude is not strong, it is preferred to make the
climbs in a racetrack pattern. In stronger wind conditions, use an "S" pattern with
all turns upwind.
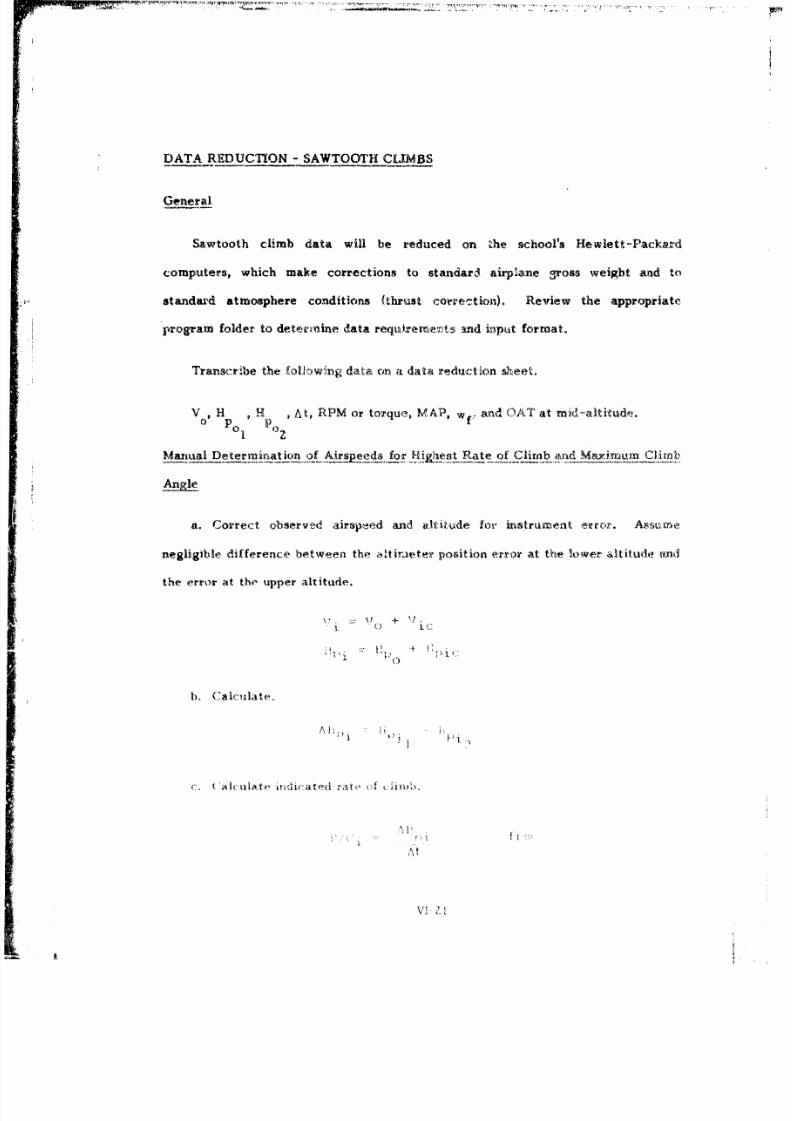
8/12/2019 USN TPS Fixed Wing Performance Theory and Flight Test Technique
http://slidepdf.com/reader/full/usn-tps-fixed-wing-performance-theory-and-flight-test-technique 89/245
.....- . - . -- ,,
DATA REDUCTION - SAWTOOTH CUMBS
General
Sawtooth climb data will be reduced on ,'he school's Hewlett-Packard
computers, which make corrections to standard airplane sross weight and to
standard atmosphere conditions (Thrust correction). Review the appropriate
program folder to determine data reqi Aiethe,,rts 3nd input format.
Transcr'be the folfowo)ng data on a data reduct ion -teet.
Vo, Hp o At, RPM or torque, I1AP, 6f, and OTAT at mTid-aititude.
Manual Deterrijeationr of AirILeedI for aiiheatate of Climb and M"xiruini Climb
An4e•
a. Correct observed airspeed and aith'.ude for instrum•nt rr.'. e
negligible difference between the atirntiter' position error at the lotrer altitud~e and
the error at the upper altitude.
+4I - c
' . ' 40I
b. Calculate.
A I.,
4piAt
\f I Z
8/12/2019 USN TPS Fixed Wing Performance Theory and Flight Test Technique
http://slidepdf.com/reader/full/usn-tps-fixed-wing-performance-theory-and-flight-test-technique 90/245
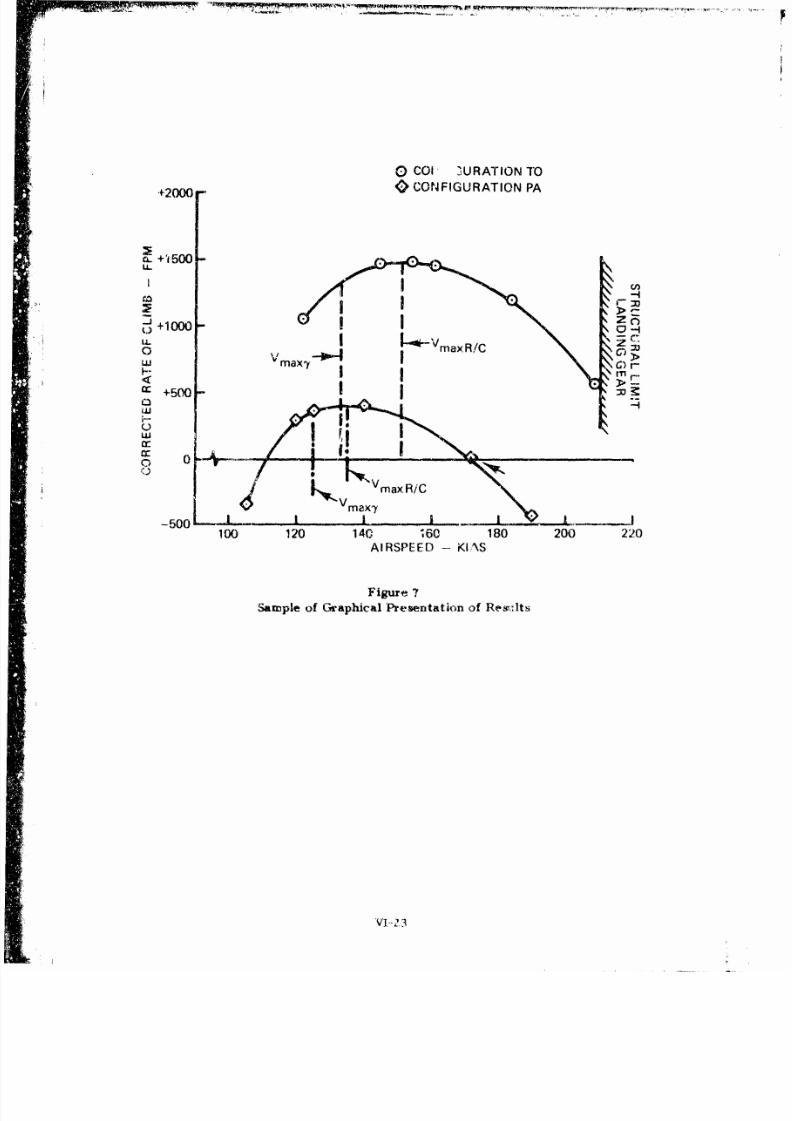
8/12/2019 USN TPS Fixed Wing Performance Theory and Flight Test Technique
http://slidepdf.com/reader/full/usn-tps-fixed-wing-performance-theory-and-flight-test-technique 91/245
O Cal' •URATION TO
+2000 -CONFIGURATION PA
ciL +1500 -
~+1O00()
~~~ -- •-2u
0
cc
•1, ,Vmax•.•,-500.
100 120 140 60 180 200 220AIRSPEED - KIAS
Figure 7Sample of Graphical Presentation of Res,,Its
V1-2

8/12/2019 USN TPS Fixed Wing Performance Theory and Flight Test Technique
http://slidepdf.com/reader/full/usn-tps-fixed-wing-performance-theory-and-flight-test-technique 92/245
SECTION V-1
LEVEL FLIGHT PERFORMANCE

8/12/2019 USN TPS Fixed Wing Performance Theory and Flight Test Technique
http://slidepdf.com/reader/full/usn-tps-fixed-wing-performance-theory-and-flight-test-technique 93/245
REFERENCES
Section VII
1. AGARD, VOL Iq Chapter 4; pp 4:1-4:Z3; Chapter 6, Sec 6.2.
Z. Petersen, Aircraft and Engine Performance, Chapters 4, 5, and 6.
vii- I

8/12/2019 USN TPS Fixed Wing Performance Theory and Flight Test Technique
http://slidepdf.com/reader/full/usn-tps-fixed-wing-performance-theory-and-flight-test-technique 94/245
NOTATIONS INTRODUCED IN SECTION VII-A
Fg/ 6 Engine referred gross thrust (a function of the engine exhaust nozz.le
presure ratio)
Wf Fuel flow, pph
Fn, 6 Referred net thrust, lb
W f/ 6 Referred fuel flow, pph
N/ f- Referred engine speed, percent of rated RPM
W/6 Referred gross weight, lb
WF Fuel weight
NOTATIONS INTRODUCED IN SECTION V\T-.C
SlP Chart shaft horsepower detemrnined from the"manufacturer's engineoperating chart for the conditions of the test.
Slip Test shaft horsepower actually delivered by the engine for the testt conditions. Determined from correction of SHP or from engint-
tor.tuem(r.ter instaliation.
.:?SllPRiLj Slip correction fujr rate of clia~b or descent.
BliPrt Brake horsepowi-r r•qufirt-d for stabdh:'ed, level flighit (i.e., airplanert drag) for the te•st conditlQ.is (grOss weight, pressure altitude, and
,• aibient airi temperature,).
Sill) Equivalfent shaft horstpowe•r z 4quirkdd referred to a standard airplanv'gr.ss weight.
VId Airspeed for mlni mum drtg.
Sf R(-f'-rrvt' fuel t low.
.1 1 r ! a
i/ , i.

8/12/2019 USN TPS Fixed Wing Performance Theory and Flight Test Technique
http://slidepdf.com/reader/full/usn-tps-fixed-wing-performance-theory-and-flight-test-technique 95/245

8/12/2019 USN TPS Fixed Wing Performance Theory and Flight Test Technique
http://slidepdf.com/reader/full/usn-tps-fixed-wing-performance-theory-and-flight-test-technique 96/245
changes of airplane drag caused by Mach number effects are accounted for, and a
wide range of airplane gro:s weight can be analyzed in only a few flights. But
thrust is difficult to measure and correct to standard conditions (EPR gauge would
be useful), and we are more concerned with range and endurance data. In order to
evaluate range and endurance, we must define the combined performance of the
airframe and the engine. By dimensional analysis of the factors affecting jet
engine performance, we can show that:
w f f (M, N) (2)
SF :D = f(M, N) (3)
These relationships describe the installed jet ;ngine. Combined with the airframe
relationship (Equation (I)) t- gent rali~ed equation for the total airplane in level
flight is
-W f f(M, W)
Now x e an tIly ,)ur urplttile o" ,onst,;.t r,.tio-s of (W), n ,.'sure led) tune flowV
when st amiiiLed ir leve'l flight at sev .rat M ch iumbe:s, .iid define curves
def-scribing the performaii, e of the airplane over a wide range of gros-s weights anrd
altitude;.
NCHA ASIN(
W/S-- /
1½1
:/4

8/12/2019 USN TPS Fixed Wing Performance Theory and Flight Test Technique
http://slidepdf.com/reader/full/usn-tps-fixed-wing-performance-theory-and-flight-test-technique 97/245
Two assumptions were made: no lift due to thrust (high a) and negligible Reynold's
number effects.
In level flight, referred gross weight decreases as fuel is uied. A constant
value of V, 6 may be maintained by increasing pressure altitude at a predetermined
schedule as airplane gross weight decreases. In obtaining a series of level flight
thrust required data points each at the same value of W/6, the altitude must be
increased for each successive data point with the airplane arriving at each altitude
with sufficient excess fuel to stabilize in airspeed before the desired W/6 occurs.
The flight path may be visualized as a series of ascending steps.
TEST PROCED URES AND TECHNIQUES
Pertinent Particulars
a. Use constent altitude technique for data points at airspeeds above that for
minimum drag and constant airspeed (thrust adjustment) techniques forr airspeeds
near and below minimum drag where ,utAbilization at constant thrust is diff'icult.
b. Obtain stifficifnt data to define airframe and engine characteristics for oxie
value of W/6- . 1w,:mntrate -)'m defining the minimutm t07rwst (fuel flow) and
maxi mum ratigi, porttio.s of the citvt, if prliminary data are tav :dlab1 e.
C. It is reco mmended that the. V xdata point at ,i<signerv: Wi/' be taken firstrrtax
and the rem. inder of the W/!5 data be obtained in order o• (decreasing airspeeds.
d. Determin(- the thrust or fuel flow ic.',?aiiahle at the assigned reference
Pressur- altit ide, ,Isiaw an acceleration uti technique. UL tain data fro c '7 V tort
ZLohe axi•mIam leVl flight , "pe,,. or ttI e,•s W/6 va lee the th1ut,-t
availabie data ,ilioutil he obtirned r-,v ' ordi r to te e airplane 's groas weight
,n*ld ibis w t'Yi!(rW theý ;-iitial W ý,• t'-st fltitu ,,o
V T.

8/12/2019 USN TPS Fixed Wing Performance Theory and Flight Test Technique
http://slidepdf.com/reader/full/usn-tps-fixed-wing-performance-theory-and-flight-test-technique 98/245
Preflight Procedures
a. Obtain W/6 assignment.
b. Pr-epare pilot's data card. In flight, at each &tabilized airspeed at the
assigned W/6 value, reccrd the following data op the data card and the photopanel.
Airspeed (V)
Pressure altitude (H
Fuel flow (Wf)
Engine RPM (N)
Engine Pressure Ratio
OAT or Ta
Fuel remaining (WF) or fuel used
Photopanel counter number
c. Construct a W/6 card. The W/d card is a kneeboard size graph which shows
a variation of pressure altitude (corrected for instrument error) with fuel. It is
used to maintain a constant referred gross weight (W). The card is construLted _s
follows: for at least four fuel weight values between the appropriate initial
airplane weight at altitude and 1,000 lb fuel remaining:
I. Calculate airplane gross weight, W.
27. Calcutlte $ required to maintain assigned W/6
3. Obtain corresponding pressu'c- altitude frotm interpolation of ICAC)
at siperh t-abie,
VO -6

8/12/2019 USN TPS Fixed Wing Performance Theory and Flight Test Technique
http://slidepdf.com/reader/full/usn-tps-fixed-wing-performance-theory-and-flight-test-technique 99/245
5. For severa valuea of Mach number at the. average pressure altitude of
the test, determlne the ajtimeter iosition error correction.
6. Construct a graph of the va•riation of H P AH wivith fuel used.
include altimeter position error information in a table on the graph.
d. Use of W/6 card. Estimate the fuel used or remaining value for the next
data point, enter the graph, and obtain the required pressure altitude. Subtract
from this figure the approximate position error and stabilize the airplane at this
comuuted observed pres-ure altitude. An example of such a graph is:
8W/8
00.
I~~) f ORM 1, 0
aS07 i b (HANrDBOOK DATA;:0.8 ' 6
0. 9 4 7
FUEL USED (LB) --
FUEL REMAINING(LB) -LB)
e. A simple and easy method of del ermining the observed pre.r:sure altitude
required to maintain an assigned W/6 value is to have radio contact with a flight
test engineer who can compute the required attitude as the airplane gross we;ght
decreases during the flight. The pniot infornms h.'ii of tae estimated fuel and the
airspeed at the next data point. The engineet comp dtes tae airplane gross weight
aand the pressure altitude rfeiuired t,; maintain the as.igned W/j aZ that weight. lie
then subtracts the alti neuter p;•.-,ition error and 7,,trum ,nw. ,-rro..• and in frins the
pi'tot 'A the reqUU-re( .tbserved 1)r1ci-sure talittile.
V.11-?

8/12/2019 USN TPS Fixed Wing Performance Theory and Flight Test Technique
http://slidepdf.com/reader/full/usn-tps-fixed-wing-performance-theory-and-flight-test-technique 100/245
F*jht 'Procedures
a. Constat Altitude Technique (Stable Equilibrium Conditions)
I. This technique requires the pilot to esttmate the fuel required to
stabilize at each data point. T"he amount of fuel required will be dictateý.. by: (a)
engine/airplane characteristics, (b) weather conditions, and (c) pilot proficiency,
'For constant altitude points, 5 min or 300 lb fuel can be used as an initial allowance
Zor s.abilization until the pi')t beco. -s more familiar with the requirements. At
the first porint, subtract the estimated fuel required from the present fuel reading;
the tesulting figure will be the fuel weight reading at 04• data point. From the
W/S card determine the observed pressure altitude required to maintain the
assigned WA6 at th~it fuel reading. Record the computed observed pressure altitude
and fuel :eading for reference.
2t. Climb to the computed observed pressur@- altitudex set the thrust, and
allow the airsp eed to stabilize. Military Rated Thrust is recommended for the first
data point (V irt point).
3. Check configuration.
4. Precisely m-aintain the computed altitud,. until tc teference fuel
reading is obtained. If the airspeed is stabilized, recoind the data. If not stabilized,
rez7ord data. ,nyay, it set up a new point at the same thrust.
5. Estimate fuel weight at th. next data point and repeat steps Z, 3, &nd 4.
b. Constsnt Airsped or Thrust Adojustmcnt Techniques (Unstable Equilibrium
I. At airspei-ds less th the airspeed for minimum drag. where atabiliza-
NflU 41 a eow-t ax. t altilude .vnd thrux\t5fet i - lif393 fF u'e O to ii r
-.........--.--..------. .aw ewIa e t ~ ~ A.~tr J> .
8/12/2019 USN TPS Fixed Wing Performance Theory and Flight Test Technique
http://slidepdf.com/reader/full/usn-tps-fixed-wing-performance-theory-and-flight-test-technique 101/245
Z. Determine the reference fuel reading and pressure altitude as in the
constant altitude technique.
3. At the required altitude, maintain the desired airspeed and adjust the
thrust to maintain level flight. The task is made more difficult by the necessity of
attaining the required test altitude. A certain degree of pilot skill and patience is
required to do this well. First set a thrust which results in a climb at the trim
airspeed. Then reduce the thrust to obtain a descent. At the required altitude,
adjust thrust to obtain level flight or a slight climb. Continue these "bracketing"
corrections until stabilized at the required altitude and airspeed.
4. When the reference fuel reading is obtained, record data.
c. If using a fuel used system, record fuel remaining at the last W/6 data
point also. Later, calculate gal fuel remaining and add to final fuel used reading to
check accuracy of fuel used counter.
d. Determination of thrust available. Before or after obtaining the required
W/6 data, fly to the assigned reference altitude. Stabilize at approximately
0,7 Vmrt with MIL thrust set ,und the speedbrakes partially extended. When the
engine thrust has stabilized, energize the photopanel, leave M1L thrust set, and
retract the speedbrak(s. As the airplane accelerates in level flight, engine
pressure differentiail airspeed, pres.iure altitude, and OAT or Ta will be recorded
out to VMrt. These data define a curve of the variation of MIL thrust with airspeed
for the test day conditions. For engines without thrust measurements, referred
fuel flow data will be used. These data will later be corrected to standard day
conditions to deterniine standard clay VMrt (correlated with dhrunt required data).
e. The recormeunded airspeed for endurance is sometimtes deterimined from
mininrure ac eptabie flying qualities rather than mininum fuel flow. D)uring the
flight, rt:'(crd thc airspeed which you would consider the minitum (desiratle from
the it.aJrdp4Mirt of satisfactory hanc hng qualities.
&v- 9 X

8/12/2019 USN TPS Fixed Wing Performance Theory and Flight Test Technique
http://slidepdf.com/reader/full/usn-tps-fixed-wing-performance-theory-and-flight-test-technique 102/245
DATA REDUCTION
General
Airframe (drag) ind engine (fuel flow) characteristics will be determined in
terms of the variation of referred gross thrust, referred engine speed, and referred
fuel flow with Mach number for one value of W/S. Because this presentation of
results is generalized, data obtained on different days but in the same airplane
should be compatible. Normally, data reduction is performed on the Hewlett-
Packard computer with the first and last data points worked manually. Record the
following data on the data reduction sheet:
V t H , Engine Pressure Ratio, wf I WF, NO, OAT or T0 p a
Data Reduction - Thrust required (Omit Steps d, e, and f if thrust data not
available
a. Correct observed airspeed and pressure altitude for instrument and position
error.b. Determne Mach number from V - M - H chart.
p
c. Determine $,. Intterpolate from ICAO Standard Atmosphere table.
d. Calculate ambient air pressure.
P - L9. 9Z (6) (in. 11g)
e. (Cahlculate and/or correct engine exhautst total Iprossure (iW ) or (11,1,71 for
Sinpstiru ent error al*| a, cultd o1'. • " )a
tra t i rurvc for t -st (-ugini- With to obtain (:oLrespnio
V11-

8/12/2019 USN TPS Fixed Wing Performance Theory and Flight Test Technique
http://slidepdf.com/reader/full/usn-tps-fixed-wing-performance-theory-and-flight-test-technique 103/245
g. Correct observed furl flow for instrument error.
h. Calculate total fu-rl flow in lb/hr. Assume density of Jl'-5 fuel is 6.8 lb/gal
"knd JP-4 fuel is 6.5 lb/gal.
i. Correct observed OAT for instrument c-rrmv and detfrip-&nr armbint air
temperature from Appendix IV.
j. Calculate•
=, ÷ 737-3
k. (Calculi",, airplane gross weight.
I. Calculate, :
referrd fucl tflow (wt )
referred gross weight
m. (C'onistruct the followin'g graphs for the averaigt value' of W/ts flown.
Airframe (drag) Chharac teristics (F /6 vs. M)
(omnit for airplao-s withotit thrust miasuretment)
Airplant- Charam terist ics (w,,/6•'h vs. M)
n. On the graph k.f the' variatiio of r-cferred gross tfWl-st requi•ed with Mac-h
number also plot the variati nt of riferretl gross. dhvu: , f!di,'rom th e
acc.lerattion run) at the rt, fernctu- altitode. F',r airplan-s in w hic h inflight thr,,st
was not measured, plot the vartationM of reterred tmx-i flow available Ott thi
r fe-t' eu. e ,Atitml-d "vt tic graph ol the, variatim of re•t rred tet l flow r-equtirtd with
iA-. ht nunbo r. i h,' in ters -tionf A e e -larvs d t inelts t•h maxi uulllu airslpe.ed at
ti-' *eteern, v a0 i'to int at 0the rpl)unes gross wug}iht for the test d•ly ambtn|item
& vii. i

8/12/2019 USN TPS Fixed Wing Performance Theory and Flight Test Technique
http://slidepdf.com/reader/full/usn-tps-fixed-wing-performance-theory-and-flight-test-technique 104/245
temperature. Correction of the thrust available (or fuel flow availabie) data to
standard temperature as discussed in Section VU-B will give the standard ulay
maximum level flight airspeed.
o. From the faired curve of w vs. M, read values of referred fuel flow
for several values of Mach.
p. Determine the ambient air prensure ratio, 6, at the reference altitude from
the standard atmosphere tables, Appendix I.
q. Calculate specific range for each value of Mach (step o) .
R.Tti IIr. Construct a graph of S.R. vs. M for the value of W/A flown.
s. Using the equation
Wf o6vwf/' ,)h.) 1 h
the standard day values of actual fuel flow may be plotted against V0.
V11- 1I

8/12/2019 USN TPS Fixed Wing Performance Theory and Flight Test Technique
http://slidepdf.com/reader/full/usn-tps-fixed-wing-performance-theory-and-flight-test-technique 105/245
SECTION VHl-B
DETERMINATION OF STANDARD DAY MAXIMUM LEVEL FLIGHT AIRSPEED
General
The maximum level flight airspeed of a thrust limited jet airplane is
determined by the intersection of its thrust available and thrust required curves for
one altitude. In Section VII-A, methods for determining standard day thrus-t
required and test day thrust or fuel flow available were determined. The thrust or
fuel flow of a jet engine at MR. thrust varies with altitude, airspeed, and ambient
temperiture. Standard day thrust or fuel flow for the test altitude can be
,.omputed by making an incremental correction fo'- the temperature difference
from standard based on est-mnated or previously determined engine characteristics.
If the engine is not operating at rated RPM, a similar thrust or fuel flow correction
can be made for the nonstandard RPM setting. Correctionm to engine thrust and
fuel flow data are usually imprecise. However, large corrections to inflight engint
;paramet-.r measurements should be treated with c-aution. It is important to realize
that morte rigorous and tedhiou, data reducction procedures exist.
Duiter nination of Standard lay Thrust Available
a. For thef several values of M1L thruM available discussed in Section VII-A,
calc-ulate staadard day referred gross thrust available.
iraqaif)' ( T
~V)/s>I~ cit
dt ~
-~ r

8/12/2019 USN TPS Fixed Wing Performance Theory and Flight Test Technique
http://slidepdf.com/reader/full/usn-tps-fixed-wing-performance-theory-and-flight-test-technique 106/245
Obtain values -)f d(F from graphs Pimilar to Figure I for the appropriate
engine.
t 10
loG; .--.__ ----
b IIJ-532-PSA6-A-4
70
Hp -1000 FT
Figure 1
Engine Performance
b. Fiot the standard day referred gross thrust available for each altitude on
the graph of referred gross thrust required. Read the standard day maximum Mach
number and calculate the corresponding true airspeed.
L)eterm•nation of Standard Day Fuel Flow Available
"Tailpipe pressure ratio data from which to compute F /s sometimes is notg
available. Referred fuel flow, based on total temperature and pre's.sure conditions
(w f/ rT) r is a function of throttle setting, OAT, and Mach number. Since the
thruttle setting is constant (MIL.), and sincýe Mach effects &re generally small, it is
possible to plot wf i •T vs. OAT for one throttle setting. With this graph of
referred fuvi flow avaiiahle, the test day data may be corrected to standard dlay
Condlit ions. The follow;ing proc(edutre is used.
VIT -14
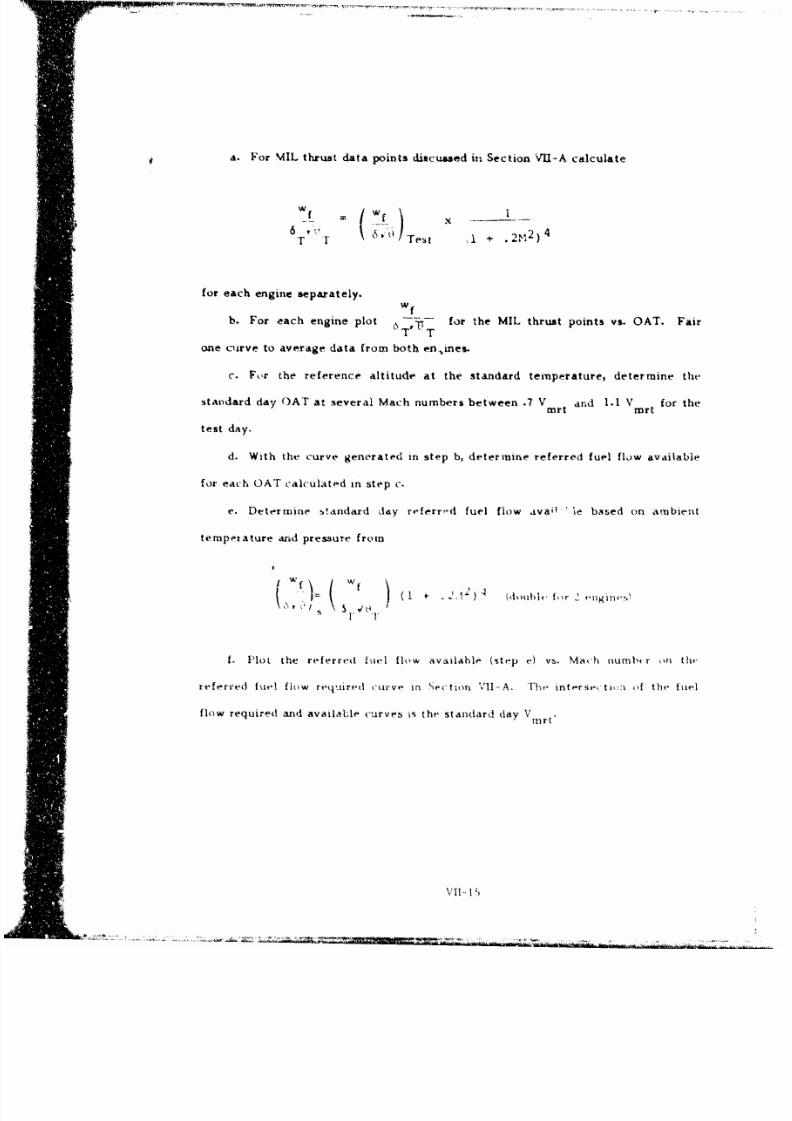
8/12/2019 USN TPS Fixed Wing Performance Theory and Flight Test Technique
http://slidepdf.com/reader/full/usn-tps-fixed-wing-performance-theory-and-flight-test-technique 107/245
a. For %AIL hrust data points discussed in Section VU,-A calculate
wf ( w_)_
i 6 ,• , 2 ?2 4
T r Test ,+ + 1)
for each engine separately.wf
Wf
b. For each engine plot for the MIL thrust points vs. OAT. FairT T
one curve to average data from both enines.
c. For the reference altitude at the standard temperature, determine the
standard day OAT at several Mach numbers between .7 V and 1.1 V for theandt tort
test day.
d. With the curve generated in step b, determine referred fuel flow available
for each OAT calculated in step c.
e. Determine standard ddy referr,-d fuel flow avail 'le based on ambient
temperature and pressure from
-f) ()(! +- . 2 . ) . (domihl, foV 2. ,ngin,,s)
s I T
f. Plot the referred itel flow available (step e) vs. Mat:h numbcr in thc'
referred fuel flow required curve in Sect TorIVII-A. The int -r sr. tit :i (if the fuel
flow required and available curves is the standard day Virt.
Vl-• I f)
8/12/2019 USN TPS Fixed Wing Performance Theory and Flight Test Technique
http://slidepdf.com/reader/full/usn-tps-fixed-wing-performance-theory-and-flight-test-technique 108/245
S IEC 110N VU- C
PWRREQU1REl) AND) FUEL CONSUMPTION
PU RPOSE
The purpose of Inis test is to deterniiiie the hzeneralizo-d power required
characteristics for a propeller driven airplane and to determnine the variation of
referred fuel flow Alth reterred shaft horsepov ,er )'a turboprop engine for one
atltitude. Tliese charicteristics aire required to describe the level flight
per for cnati':L If the airplane.
DIS(LIcSSI)N -\NID iHlEO RY
Gienera i
hl descr ibing aiirplane ltevtl flight pert ormraiice, the paratnet er of gr ea1test
pm ere %t is spe( If& r~nm -, t he r~ttro Af true airspeedt to fuel flow. Cirude ly, speI fic
rmikne IIA y he~ ke t t'r ruinedi by flIy mug t he a1irp latrie a! ai const tit t A rspeedt mi i alIt it (ide
AII(mt-,svr g the c o)rrespondrog fueli flow. The level f light per fori ifc e for a
k~rge- rmigt of air ert-vtl, ltit tdtes, awi jwý,_ weights is 1url ' ,AffCIt-ietlIN e'valuaItedt
by-1;I vr-t~g ,tin!Igtj.r.ittI-I t he a ir trxnne- hanic t eri st I(, (powe-r requirted( f,)- lwevel
lightI Mitt thte t'oIkilu. It, . iraterjstiws (ftiel flow variatiori with 1-ow- ind Altitude).
TIJVI-40-1iArsrn IAllySus ot .hv, ltevel flighrt perhor rniure oft a L(vW spte::Ld aiplafl~
show'x- that fi give Il'a0tiig mil ,migur% ,ttioti, the' vari-ii~tm of C'tpli%.lelot shaftt
hor,',-.j ý\A VIC uir \vitItl -k1 itit,. ,I ,ýit .iree '1 Single kurvc whIl I "h 'is h kpi'llc
h, ati allitmilts Yf Airpla'iv opo)r.AtlIsO. I'lhis ~ r-lia Is v,0)1 if d,: 01il;tAiit
larawI-to tIrLa ret'f I -ntit, li- 'pol t~ ' ll Ittllr , Mind rftle tlVe e t u-Atltm All tit
r~~~iie~~~i.Il l~ f ''~l! ibV1101 f~r ht-e rt- -pe rmlýzr- o
VII -t
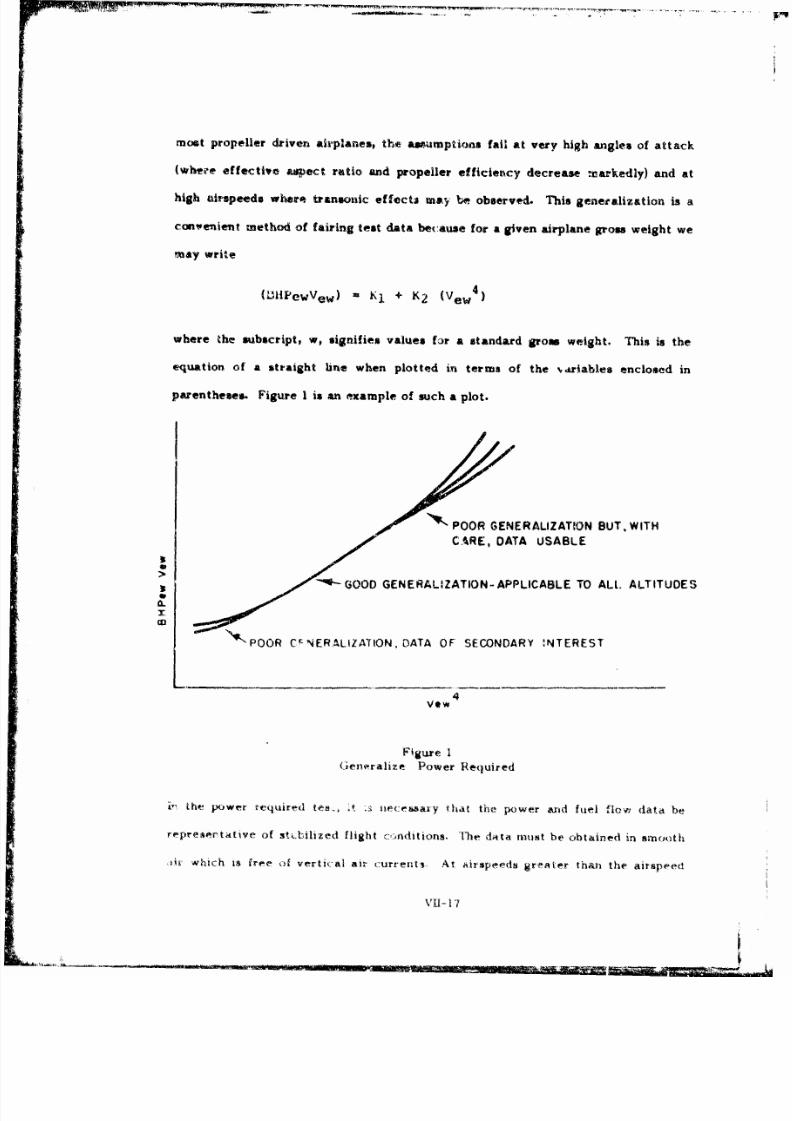
8/12/2019 USN TPS Fixed Wing Performance Theory and Flight Test Technique
http://slidepdf.com/reader/full/usn-tps-fixed-wing-performance-theory-and-flight-test-technique 109/245
mcst propeller driven airplanes, the aspumptions fail at very high angles of attack
(wheee effective aspect ratio and propeller efficiency decrease markedly) and at
high aairspeeds wher. transonic effects inay, t observed. This generalization is a
convenietnt method of fairing test data because for a given airplane grosw weight we
may write
(1L3IPewVew) - K1 + K2 (Vew 4 )
where the subscript, w, signifies values far a standard gross weight. This is the
equation of a straight line when plotted in terms of the %ariables enclosed in
parentheses. Figure I is an example of such a plot.
"*POOR GENERALIZATION BUT, WITH
CARE, DATA USABLE
> _ • GOOD GENERALIZATION-APPLICABLETO ALL. ALTITUDES
i :)' ,POOR r-NERALIZATION, DATA OF SECONDARY NTEREST
4Vow
Figure I(eneralize Power Required
1" the power required teft, -s iwecaxy that the power and fuel flow data be
repreer tative of std;ilhzed flight c.onditions. TIhe dAta mtit be obtained in smooth
,ir which is iree of vertical air currents At airspeeds rearer than the airspeed
V-17
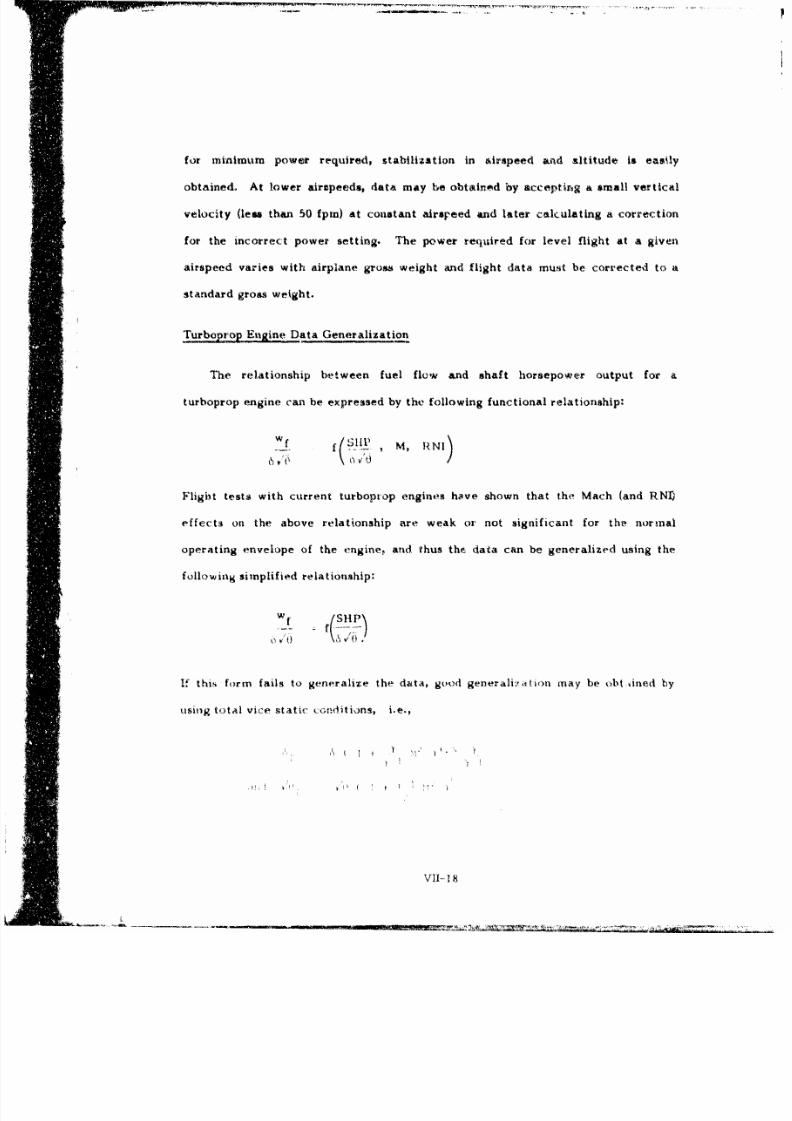
8/12/2019 USN TPS Fixed Wing Performance Theory and Flight Test Technique
http://slidepdf.com/reader/full/usn-tps-fixed-wing-performance-theory-and-flight-test-technique 110/245
for minimum power required, stabilization in airspeed and altitude is easily
obtained. At lower airspeeds, data may be obtainod by accepting a small vertical
velocity (less than 50 fpm) at conatant airspeed and later calculating a correction
for the incorrect power setting. The power req•uired for level flight at a given
airspeed varies with airplane gross weight and flight data must be corrected to a
standard gross weight.
TurboProp Engine Data Generalization
The relationship between fuel flow and shaft horsepower output for a
turboprop engine can be expressed by the following functional relationship:
w f -, M, RNI)
Flight tests with current turboprop engines have shown that the Mach (and RNI)
effects on the above relationship are weak or not significant for the normal
operating envelope of the engine, and thus the data can be generalized using the
following simplified relationship:
if this form fails to generalize the data, good generali.ition may be obt lined by
using total vice static confditions, i.e.,
VII-. 1 8

8/12/2019 USN TPS Fixed Wing Performance Theory and Flight Test Technique
http://slidepdf.com/reader/full/usn-tps-fixed-wing-performance-theory-and-flight-test-technique 111/245
TEST PTOCEDURES AND'ECM4tIyUES
Pertinent Particulars
a. For reciprocating engines, set the power neesded to obtain the desired
airspeed but keep BMEP high by maintaining a minimum RPM and maximum MAP
within the handbook limits.
b. Use the constant attitude technique at airspeeds faster than the airspeed
for minimum drag (Vmd) and the constant airspeed technique at airspeeds slower
than Vmd-
c. It is recommended that the Vmrt data point be taken first and the
remainder of the data be obtained in order of decreasing airspeeds.
d. The photopanel will not be used for this flight.
Preflight Procedres
a. Review engine limits, single engine ope-ation, and airstart procedures.
b. Prepare data cards. In flight at each data point, record:
Run number
Pressure altitude
Airspeed
OAT/CAT
Torque/MAP
Fuel Flow
Fuel rernatining
RPM/EGT
C(on figur it ion
-

8/12/2019 USN TPS Fixed Wing Performance Theory and Flight Test Technique
http://slidepdf.com/reader/full/usn-tps-fixed-wing-performance-theory-and-flight-test-technique 112/245
Fliht Prccelureas
a. Performa
series ofstabilized, level flilht runs at the awasned altitude
using varicus power settings. Although A particular sequence of data is iCot
required, it is recommended that the 1 point be obtained first and the
remaining data he obtaineai in order of decreasing airspeds.
"b. For the csmttaiit *Attude method, set the maximum cruise power settIng
ax1ia allow the airplan. to stab ize in etrapaeed while ,nalntirting a constai t
altitude. Several minutes At constant power and altitude are necessary to obtain
goo)d stahilization of AirspeCtd. When certain of stabilization, record data. Reduce
power setting to that estimated to give the itext desired airspeed and wait for
airspeed to msabilize.
c. For the constant airspeed method, est.Ablish a trimmed, constant airspeed
and adjust the- power until level flight is Achieved att the test altitude. A
brackteting technique, similhiw to th, one desciribed in Section I1and demonstrated
on the performance demonAtration flight, should be uised. If level flight cannot he
achieved after .Aeve,,a' power adjuxstmeuts, acceptable data can be obtained with
the, airplane in it litmb or dt-m ýrnt of 10 ftpm or less. When htis condition is
xttabli.sd, 'trecord datt aad comtienco a ) mwin runi aý constant air4sopid and 1. wer
setting. After ) minn recordi data again to obtain the averagt- ralt of c'limb mltr.
aiverage pow,'r for thi-s imterval. The data wilN laietr be corrected for this condition.
d. The airspeeld at which thte airpliioii, exhibits mninnimuin cctteptahle flying
qu&II ti for mnaxo mIumi. flying shouldt eo rc irtk td lr lat-r %%%t-n dIeter mining the
t ~V 1I 2•(1

8/12/2019 USN TPS Fixed Wing Performance Theory and Flight Test Technique
http://slidepdf.com/reader/full/usn-tps-fixed-wing-performance-theory-and-flight-test-technique 113/245
DATA REDUCTION
General
Follow the ýorder of the data reduction presented below in setting up the data
reduction form. Normal data reduction is by Hewlett-Packard Computer program
but the first and last data points must be done rnma:.ally.
Manual Data Reduction - Fuel Flow and Generalized Power-]Re ired for Trbovro
Airplane
a, Correct observed pressure altitude for instrument and position error.
"lipc = LIpo + LIP + A±IPPoS
b. Correct observed airspeed for instrument and position error.
V - Vo + AVic + AVpos
c. Calculate equivalent airspeed. Use Appendi.x II for compressibility
correction.
V V 0 + 'V
d. Correct observed OAT for instrument error.
SDetermine M by use of M V - 1i chart.C p
f. t rmin ambient air teninerature I VT) using Appendix IV (Assume
g. De'term .nilc o by en tf,-'ring L3niC t u ýY't I a)" A'
Mp a
h ,, e e m n f ro m P NI s iw da r d .tikh.• e e ' a le tiýa wlnN.
V11., I
... ,.,.-- - .- ~--..a~t~o.*oo-

8/12/2019 USN TPS Fixed Wing Performance Theory and Flight Test Technique
http://slidepdf.com/reader/full/usn-tps-fixed-wing-performance-theory-and-flight-test-technique 114/245
i. C.ompute Vu from Ta + 'cl30) L/
j. Compute
k. Correct observed torque and RPM for instrument error for one engine.
L. Compate test shaft horsepower
SHtP (%K) (Q) (RPM)
where K is the engine turquemeter constant, Q is torju- or pressure (psi or ft/I1 )
and RPM is propeller RPM,
ra. Repeat steps k and i for the other engine.
n. Compute total test Aaft horsepower (sum of both engines).
o. Compute airplane test grons weight (W .
p. For constant airspeed data, compute raeý of clihtb. Assume that the
altimeter in~trumnent -ind position error covrrtions, remaii const;Ant over the test
interval.
AHR/C PO fpm (+50 fpm maximum)
At
or
•I(. : H o) fpin (T Itt,,I
A t A
ct. Calc~ulatt shafthor.se••iover corre('tion f r rdte of climb.
flte0.8S "an itye.- a1f-,k -,

8/12/2019 USN TPS Fixed Wing Performance Theory and Flight Test Technique
http://slidepdf.com/reader/full/usn-tps-fixed-wing-performance-theory-and-flight-test-technique 115/245
r. Compute shaft horsepower required for stabilized, level flight for the test
conditions.
SliPrt SlIPt + ASIIILV/C
9. Compute equivalent shaft horsepower required.
Slipe -WSHPrt
1/
t. Compute ratio of standard gross weight to teat grosa weight Ws/Wt and the
correction factors (Ws/Wt) and (Ws/Wt)/
u. Correct equtivalent shaft horsepower required and equivalent airspeed to
the standard gross weight.
vew =
v. Compute V and V 4 SliPew ew ew
"w.For each engine compute referred shaft horsepower
"ll t
6/
x. For each engine, correct obscrved fuel flo(. for instrument error and
COtipute referred fuel flow.
~Wf
VII-4Z3

8/12/2019 USN TPS Fixed Wing Performance Theory and Flight Test Technique
http://slidepdf.com/reader/full/usn-tps-fixed-wing-performance-theory-and-flight-test-technique 116/245
Manual Data Reduction - Fuel Flow and Gene~ralized Power Reuired-
Reciprocatin Enzine Air lane
a. Perform steps a through g listed under turboprop data reduction.
b. Correct observed RPM and MAP for instrument error.
c. Determine chart shaft horsepower from engine chart. The chart method is
not az accurate as the engine torquemeter which should be used if available.
d. Obtain standard day ambient air temperature for test altitude from
standard atmosphere tables.
(T Tk + 273a K
e. Correct observed CAT for instrument error.
f. Compute test day shaft horsepower
as
CAi't oK
g,, Perform steps o through v,
V1II 1 4

8/12/2019 USN TPS Fixed Wing Performance Theory and Flight Test Technique
http://slidepdf.com/reader/full/usn-tps-fixed-wing-performance-theory-and-flight-test-technique 117/245
• Graphical Presentation of' Results
ONE PLOT PER ENGINE SPECIFIC RANGE NEW PLOTS
~1000 4
SHP/ o'VT V ow
FUEL FLOW CHARACTERISTICS GENERALIZED PO"ER PEQUIRED
1:1
Vew 4 Vow
GENERALIZED POWEIk REQUIR'ED COMPUTED POWER REQUIRED
AI?S

8/12/2019 USN TPS Fixed Wing Performance Theory and Flight Test Technique
http://slidepdf.com/reader/full/usn-tps-fixed-wing-performance-theory-and-flight-test-technique 118/245

8/12/2019 USN TPS Fixed Wing Performance Theory and Flight Test Technique
http://slidepdf.com/reader/full/usn-tps-fixed-wing-performance-theory-and-flight-test-technique 119/245
RE.FERENC ES
Section VIII
1. USAF ARPS PTM: Chapter IV of Techniques
Chapter V of Theory
Z. Dorav'tasch, Airplane Aerodynam"ic, Section 11:5
3. Hurt, A n cs for Naval Aviators, pp. 176-18Z
4. Petersen, Aircraft and Engine Performance, Chapter 9
5. Boyd, J.R., MAJ, USAF, Enýr -Maneuverability, 1966
6. Patierno, Stevens, Evanbar, Campbell, Maneuverability of Air Superiority
Fighter Aircraft, 1971
vJjj I

8/12/2019 USN TPS Fixed Wing Performance Theory and Flight Test Technique
http://slidepdf.com/reader/full/usn-tps-fixed-wing-performance-theory-and-flight-test-technique 120/245
MANEUVERING PERFORMANCE
INTRODUCTION
Aircraft maneuverability can best be defined as the ability to change direction
and/or magnitude of the velocity vector. While this definition is accurately
described and clearly understood by most pilots, the best method to optimize
aircraft maneuverability it more difficult to define due to the complexity and
dynamic nature of the combat maneuvering situaton. Pilot selection of turning
maneuvers, in terms of the change of direction achieved ss a function of energy
state, is strongly dependent on many factors, not the least of which is the energy
state aiud position of the opponent aircraft or his weapons system. Assuming
paramet'srs such as pilot proficiency, roll performance, flying qualities, field of
view, and fuel management t,.chniiques are eqtial, we have learned 5otn experience
that the offensive advantage i.i available to the airplane which initially has %a d
caan maintAin the highest energy level. In addition, the airplane with the
highest energy lev.'el has a better cpp-Artunity to engage and disengagt- ,M.twill. 'c.
achieve or d.'ny this adva'Itage dep,-mds pritoarily on two ,aý Zors:
a, The weapons %ystern capability.
h. The air-raft maneu.ver.'ng per for Umance.
Quant itat ve ly, the wea'tpons system t apability can be (depicted By releast, or
firing en yvelopes, And oiti v these initial conditions are known, the optimization
nr- h1b in 1AeA oft a neiiverknk intto th- t-fec ti Ive weRapols OUllveIoi)e.e lS h
mauiwd vWrmg iAs diperident ntww'l the aiiAity o! til imhlot to , AntrAl tturn, altmtldt,,
airsj fd ael ldiii ar(A i'e.~~i i ,e tol i'tt sA
VIII A
-. b W

8/12/2019 USN TPS Fixed Wing Performance Theory and Flight Test Technique
http://slidepdf.com/reader/full/usn-tps-fixed-wing-performance-theory-and-flight-test-technique 121/245
PU RPOSE
The purpose of this section is to discuss aircraftmaneuverAbility in terms of
sustained and instantaneous g available, turn rate, turn radius, and the interface of
these performance parameters with specific excess power characteristics.
DISCUSSION AND THEORY
A measurement of the relative tactical value of high performance airplanes is
the maximum normal acceleration available at a given airspeed and altitude. It is
important to distinguish between sustained g available which can only be arhieved
while maintaining a constant energy level, and instantaneous g available which can
be achieved while gaining or losing energy at a given rate.
Sustained j.'Available
Sustained g available is determined by level flighi turning performance. When
an airplane is in straight, level flight, it develops lift equal to it.i weight. When this
airplane is banked into a level turn, the lift increases so that the vertica)
component of lift re mains equal to the airplane weight. Because the lift has
increased, the drag has increased also, and the engine thrust must he increased to
naintain the airsp,,,'d. ihe max mun hank angle for which both airspeed and
altitude can be maintained is a ftinction of both t he aerodynamic and thrust
characteristics hut it is usoa ly 1-Nnited by the thrust available. if this maximum
lmn.k Angle (or nmrnt l ja celera tin) i.• mn,-et s•red at se'oral airspeed .,, the sustaime.-
tun"ing preforioaiiy e is ic lerm in'(d.
VI A

8/12/2019 USN TPS Fixed Wing Performance Theory and Flight Test Technique
http://slidepdf.com/reader/full/usn-tps-fixed-wing-performance-theory-and-flight-test-technique 122/245
Instantaneous p, Available
Instantaneous g available is determined by the variation with Mach number of
the normal acceleration for onset, tracking, and limit buffet. As an airplane is
maneuvered more and more vigo-ously, a normal acce'leration will be attained at
which butteting of the airframe is first detected (onset buffet). As the normal
acceleration is increased further, the buffeting increases in intensity until it
becomes so severe as to prevent satisfactory accomplishment of an offensive
mneuver (tracking buffet). When the normal acceleration is incieased still more,
a maximum buffet acceptable for defensive operation of be airplane is observed
(limit buffet). The variation with Mach number of the normal acceleration at
which a specified level of buffet it; observed is known as a buffet boundary, and for
the specified condition, this buffet boundary defines the operational V-n envelope
of the airplane (Figure 1).
S1 RUCTURAL LIMIT
NJ
LIN,
0
LI.
SI +l . . . ... l IAM
L j VI[ 1a't i d

8/12/2019 USN TPS Fixed Wing Performance Theory and Flight Test Technique
http://slidepdf.com/reader/full/usn-tps-fixed-wing-performance-theory-and-flight-test-technique 123/245
For most flight conditions, th, imit buffet 1ev=l may be defined by: the
structural limit, aerodynamic limit (CL ;, longitudinal control linmit, ornax
maximum load factor for acceptable flying qualities of the airplane.
In all cases, buffet levels must be defined in relation to the n.ssion of the
airplane. Some airplanes (trariports, straight-wing trainers, etc.) may have no
offensive or defensive maneuvers related to their missioa which bear upon
instantaneous turning performance. These airplanes may exhibit little or no
buffeting prior to reaching their aerodynamic limit (stall); or they may he
prohibited from buffeting flight due to comfort or structural safety reasons. Onset
and limit buffet may be coincident; and there may be no relatable or applicable
tracking buffet level for an airplane.
Airframe buffet is associated with the disturbance of airflow somewhere on
the airplan s structure. The intensity of the disturbance will vary with angle of
attack and Mach number. For a given Mach number, a qpecified buffet level wiHl
occur at the samne angle of attack (or lift coefficient). Figure Z depicts butfet
charactkristic-i typik al of a sLp•ersonic fighter airplane.
C1
ON t i:0 t
V'il~ ,

8/12/2019 USN TPS Fixed Wing Performance Theory and Flight Test Technique
http://slidepdf.com/reader/full/usn-tps-fixed-wing-performance-theory-and-flight-test-technique 124/245
Rate and Radius of Tux
For a given normal accelerition, nz at a given altitude, the radius of turn is
given by
VT' (fps)
R -ftg zw - I
and the rate of turn is given by
57.3 VT z
- die 'secR
VT
Turn xite is perhaps the most tactically significant ol all the parameters uRed
to measure turn performance. It neasures rate of change of flight path direction
as a function of sustain. I or instantaneous g available and airspeed. In the
Pir-to-air maneuvering environment, the relative turn rate capbility f two
adversaries will directly influence the tactics used by each combatant. Of course,
turn radius (which also is a fun1 -tion of TAS and g available) must be considered
when det-rmining tne mission suitability of an airplane. An example of the use of
t tr'n radius is the gun tracking solution in waich a ce-rtain arnmont of lead (sznalit,;
turn radius) is rtequired.
Tactical (Considerat ons
Another important consider 1 t ion in maneuve-hnng per:or'nan(e is the uste of the
vertlicri gravity vector to efft- t ively adA to the airplane's lipý XCtor. The effect
of inc'reasiog h)ank angde orn tun rate ti, sho4wn in Figure 3. the rtequiremeri'.s of the
rniss)l3., wili ,ic tstt ac'ut ab load fart irs, turn rates, and rad i. Cons.iderationi
most he; given t, re'quired inarrerivs, V unit I , -'t dis tn, e-;, ;,'rf, rma of
poýiential dver xari e s, pilot ln ad fa ll t d-"ance and the ,oxpercted lt.itli odei at
V1II o

8/12/2019 USN TPS Fixed Wing Performance Theory and Flight Test Technique
http://slidepdf.com/reader/full/usn-tps-fixed-wing-performance-theory-and-flight-test-technique 125/245
which var.ous maneuvers will be cc.nducted. The tnfhAunce of flying qua•lties,
energy level maintenance, and weapons xystemm must also by cons•iered when
evaluating the turning perfornu'nce of an airplane.
'tONSI ANT AL TITUDLE
K- ~ ~MAXINION-1C TA -- -2I URN
AXIMMUM N-N9ANTANt OtIS I.JRN `Wt 01N
yVr i' At PI AN [
.... I)IP,.UON I A, HI AN I
Figurehr m, -Dirnnsioial Tu''•rn Compar ison
V4,
4i' e ~ e3 ~ ~ a .~S ~ Z ~ ~ i W f~t

8/12/2019 USN TPS Fixed Wing Performance Theory and Flight Test Technique
http://slidepdf.com/reader/full/usn-tps-fixed-wing-performance-theory-and-flight-test-technique 126/245
Vng~ainand Thrust to -Weight Considerat ions
Assuming there is no appreciable lift due to thrust, the relationship of wing
loadrng (W/S) on turn performance may- be expressed
,L CL 1 P VT s
where
L, W.~n kavailable instantaneoui)
Rea\-r~nge~ent of this expression results in
C7 L
n avai - L WV TSz ~~inst ( /)
At any given altitude and airspeed, instaintantou.a g available is solely dependent
upon wing loading (W/S) and the ai-phane litt coefficient ((C[).
The effect of thrust- . weiglit ratio (T/W) on turn pf'rformarct, may he
e;'pressed in stabhiiiz ed, unaccehrated flight as
T . D
:ie rra m•n [ thi. ,,×21 eshion r,•••
av'iw" .

8/12/2019 USN TPS Fixed Wing Performance Theory and Flight Test Technique
http://slidepdf.com/reader/full/usn-tps-fixed-wing-performance-theory-and-flight-test-technique 127/245
The sustained T, ailabie is directly proportional to the thuxt-to -w light ratio
(T/W).
Sustalied g available is also a function of aerdynsuic (airfrawe)
characterstice through its relationMip with the lift-to-drag ratio (CL/CD).
A graphical presentation of the variation in ruitained and instantaneous turn
rate wil.h wing loading and thrust-to-welght ratio is shown ii Figures 4 and 5,
reapecttvely. A. a constant &Atitude and Mich, the subtained turning pe7formance
in Figure 4 is incized with higher thrust-to -weight ratios and improved
aerodynamic chatratterietics (reduced wh&g loadtg). However, at the same
constant altitude and M&ch, the instantaneous thrninr parformance in Figure 5 is
incrensed with Inwer wing loading and is unaffected by ýhe thrust-to-weight ratio.
ALMhTUO-M - OONSTAINfM ikC H - OON S' ANT
F12Firar
"- o f... . . ... ... .. .g..... . "

8/12/2019 USN TPS Fixed Wing Performance Theory and Flight Test Technique
http://slidepdf.com/reader/full/usn-tps-fixed-wing-performance-theory-and-flight-test-technique 128/245
.* .. ._ _ _ _ _ _ _ _ _. ...
'C
GiVIN MACH & ALTITUDE
NO LIFT DUE 10 THRUST
IsI
•' ~~~AL ý.M ".
'<10
:,
40 60O go 100
WINI'j 0 A'DiN;G PSF
Effec' Of (W/S) oil In~tantaneopis Turning PerformSrince- b
Si Th.ui fNr, tirc:raft maw-euvertbility has been expleined in terms of directional
• i ~~change (turn) only but magnitude.• changea of' the' vekoc•,i•y vector are equally
' ~ im~port,,%nt, F'roai. the specific energy eNuatkm
h ,
,ii.• ~~it can ne- deduzed th.-t SU. STAI.ANED maneuverability in clop,e-A r'elated to sptcific"
i(•.energy 'evela in terms of altitude ane. airspeed,, By observing the c:orrelation of
e~nergv rate varfaicm'i with twrabihg perfo:ri-xance,,, tact ic:al maneuverabifitt• can he
r'elattvd to the amount of energy ,px)eaaepýed and how well that energý k ni:,anagttd.
(I V l N0
!io
iz

8/12/2019 USN TPS Fixed Wing Performance Theory and Flight Test Technique
http://slidepdf.com/reader/full/usn-tps-fixed-wing-performance-theory-and-flight-test-technique 129/245
A comparison of specific exceas power characteristics (Po) can be used to
determine the operational flight envelope in which an airplane can gain or lose
energy more quickly than an adversary. The amount of energy gained or lost is
directl7 related to maintaining maneuvering position against an adversary aircraft.
The envelope for optimum erirgy maneuverability. may be represented on an
altitude vs. Mach number (H-V) diagram containing contour lines of constant
specific excess power (Figure 6). Energy gain per unit time is maximum at the
points where the lines of constant energy altitude (E h) are tangent to the lines of
const,.nt Ps. Flight along the maximum energy path will allow the most efficientenergy conversion of altitude and airspeed.
S~I
MAX ENERGY
-- MAX R/C
(CONVENTIONAL)
" CONSTANCTP.
_j -*-CONSTANTSENERGY
UALT (Eli)
0
LU
(D.
MACH NUMBER
1i--V Diagr im
SVIUI-i }I
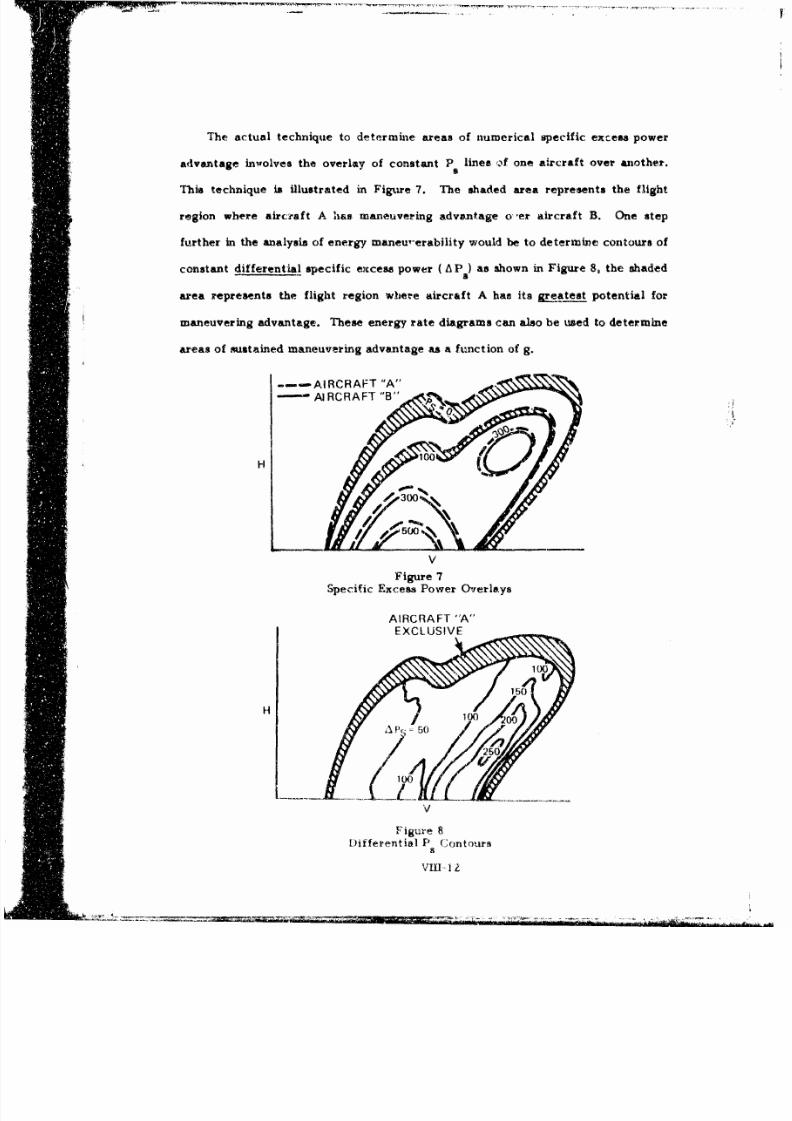
8/12/2019 USN TPS Fixed Wing Performance Theory and Flight Test Technique
http://slidepdf.com/reader/full/usn-tps-fixed-wing-performance-theory-and-flight-test-technique 130/245
The actual technique to determine areas of numerical specific excess power
advantage involves the overlay of constant P lines of one aircraft over amother.5
This technique is illustrated in Figure 7. The shaded area represents the flight
region where aircraft A has maneuvering advantage o'er aircraft B. One step
further in the analysis of energy maneu,-erability would be to determine contours of
constant differential specific exccess power ( AP ) as shown in Figure 8, the shaded
area represents the flight region where aircraft A has its geatest potential for
maneuvering advantage. These energy rate diagrams can also be used to determine
areas of sustained maneuvering advantage as a ftmction of g.
--- AIRCRAFT "A "
V
Figure 7
Specific Excess Power OverlaysAIRCRAFT BA"
H10
V
EXCLUSIVE
Jirferential P Contours
8
VII-- I
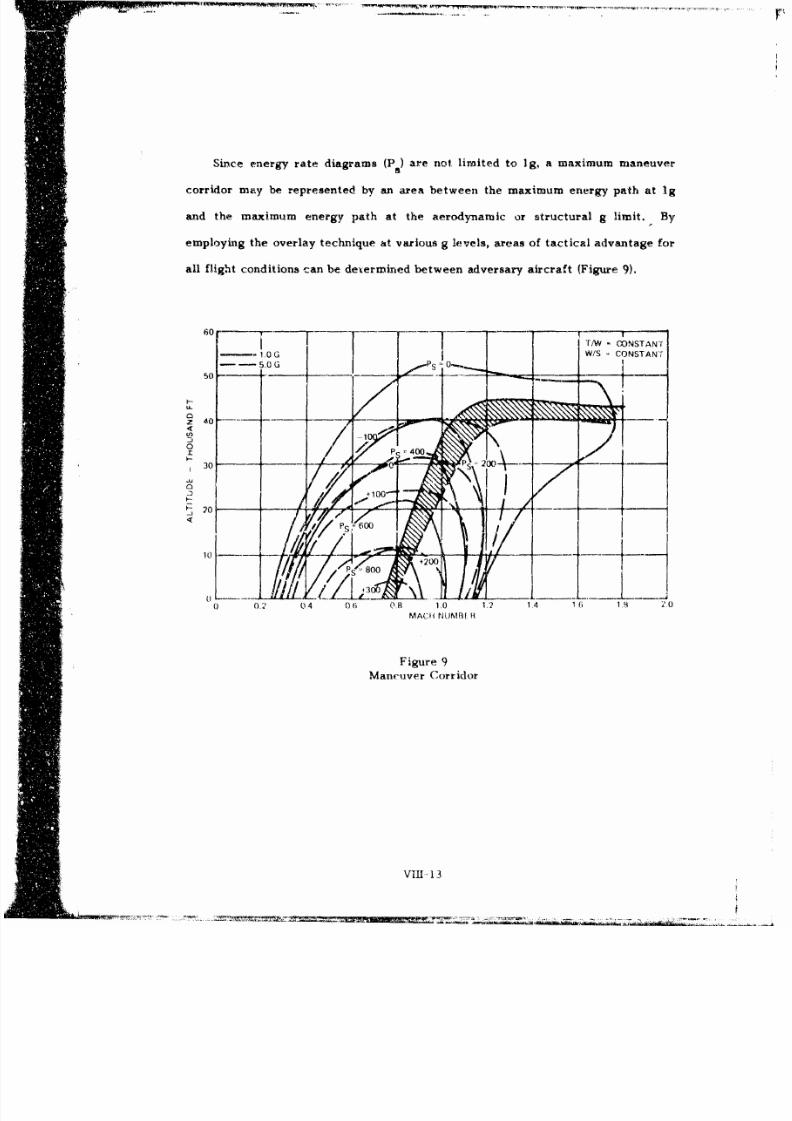
8/12/2019 USN TPS Fixed Wing Performance Theory and Flight Test Technique
http://slidepdf.com/reader/full/usn-tps-fixed-wing-performance-theory-and-flight-test-technique 131/245
Since energy rate diagrams (P8 ) are not limited to 1g, a maximum maneuver
corridor may be represented by an area between the maximum energy path at Ig
and the maximum energy path at the aerodynamic or structural g limit. By
employing the overlay technique at various g levels, areas of tactical advantage for
all flight conditions can be determined between adversary aircraft (Figure 9).
50o__ _--.. ... __1. G•... . ... .. TAN
oP
03 P S"|.-
-D +100 "
20
PS ,
o -.. .---• •-_ _ ----- .... .
0 ., 04 0 6 O". 1.0 1.2 1.4 1C 1,4 2.0
MACH NUIMB R
Figure 9Maneuver Corridor
VIII 13

8/12/2019 USN TPS Fixed Wing Performance Theory and Flight Test Technique
http://slidepdf.com/reader/full/usn-tps-fixed-wing-performance-theory-and-flight-test-technique 132/245
The energy rate variation from a turn rate of zero (Ig) to the maxl.num tlarn
rate achievable (aerodynamic or structural g limit) characterizes the complete
spectrum of energy maneuverability for any given airspeed and atlttude
comblination. The typical variation Illustrated in Figure 10 provides three useful
weasures of maneuvering performance. The Ig energy rate indicates a measure of
acceleration and/or climb perforamance. The turn rate at zero energy rate (P. = 0)
is that which can be sustained without energy loss. The maximum instantaneous
turn rate corresponds to the hiqhest energy loss rate. By improving the lift
characteristics and/or reducing the drag characteristics, the energy rate variation
with turn rate will be less pronounced and a general fanning out of the curve will
result (Figure 11).
SPECIFIC EXCESS POWER 0 1 G
SIS fAIN.L)D I URN HP T'F
W N
o
..
M f lk" tW'e
j •' Eo'er-gy- Maneuverb1,kyt~'!~

8/12/2019 USN TPS Fixed Wing Performance Theory and Flight Test Technique
http://slidepdf.com/reader/full/usn-tps-fixed-wing-performance-theory-and-flight-test-technique 133/245
F0
.GIVEN ENGINE
THRUST &WINGAREA
W
W IMPROVED AND CL MAX
U
IURN RATE DEG/SEU
Figure 11Influence of Imprcved Aerodynamics
The effect of wing leading on the energy maneuverability curve is illustrated
in Figure 12. The greatest benefit of reduced wing loading occurs at and near to
the maximum instantkneous 'j formance limit. The influence of thrust-to--weigbt
on the energy maneuverability c.rve im illustrated in Figure 13. Increasing the
thrust -to--weight ratio has no significant effect on the instantaneous ti.rn
performance, but significantly improves the Ig and sustained maneuvering
capabilit ies.
yi

8/12/2019 USN TPS Fixed Wing Performance Theory and Flight Test Technique
http://slidepdf.com/reader/full/usn-tps-fixed-wing-performance-theory-and-flight-test-technique 134/245
''ALTT CONSTANT
A/S -CONSTANT
Uj
cl --400
w8
w
120
-~1600 -______
TURN RATE -- DEG/SEC
Figure 1Z
Effect of Reduiced Wing Loading
ALT CONJSTANT
MiS; CONSrANIT/W -CONSTANT
1N ~- ........ 4. k- . . . .. .L - -
4 6 8 IG 1 4 16 Im A
Figure 13
E~ffect of Improved Thrust -to- Weight
vflI-- 1

8/12/2019 USN TPS Fixed Wing Performance Theory and Flight Test Technique
http://slidepdf.com/reader/full/usn-tps-fixed-wing-performance-theory-and-flight-test-technique 135/245
Maneuvering Performance §jMperiortty
A conceptual evaluation of the relative maneuvering performance of two
aircraft can be made by comparing their energy rate variations with turn rate
characteristics as indicated in Figure 14. The friendly aircraft depicted has a
margin in turn rate regardless of the energy rate and/or turn rate employed by the
threat aircraft. The specific excess power margin at zero turn rate provides the
friendly aircraft with the advantage of engaging or disengaging at will. Th e
sustained turn rate margin enables the friendly aircraft to maintain an energy level
above that of the threat aircraft. The maximum instantaneous turn rate an ddeceleration margins allow turning superiority for the friendly aircraft in defensive
maneuvering situations.
4- SPEC IFIC LXC('-ýSSPOWER IG MARGIN4
U -''-¶IS;TAINED !UHN RATE~ MARC IN
Ln
W1 -k tIURNHAI tI UN("
•'g ), (A ý I HA IIO)N
AA GIM
i. N-I AN 1I tLh. II URN RA "l
F'igure 14
Fnerj2v Ma,ixv-urabihty (onprisoi
yVI1 17

8/12/2019 USN TPS Fixed Wing Performance Theory and Flight Test Technique
http://slidepdf.com/reader/full/usn-tps-fixed-wing-performance-theory-and-flight-test-technique 136/245
In summary, this analysis of aircraft maneuverability, particularly when
supplemented by a specific excess power comparison, can be an extremely useful
tool to the tactician seeking to determine flight envelopes of advantage ordisadvantage. His ability to translate the results of an energy maneuverability
analysis into tactical maneuvers will contribute to mission sccess. Of course, the
ultimate measure of a pilot's achievement is still how well he takes advantage of
his aircraft's capabilities, whatever they may be.
ANALYSIS OF SUSTAINED VS, INSTANTANEOUS CAPABILrFIES
The major factors influencing sustained and instantaneous turning performance
have been discussed. A combined graph such as Figure 10 cannot be constructed
without P data, but much can be learned from analysis )f a graph like Figure 15.S
A deficiency in sustained turning capability must be due to low 'T/W atio and/or
CI,/C) characteristics, while a defic ie'ncy in (limit) instantaneous n available
must be caused by ow values of ( 1 and/or -xcssive wing loading. Th, onset
inaxof buffet may occur at low ii., indicating airfhl.w separation. In the example
shown: (1) a low T/W ratio may linit sustained capabiiities, (J) early onset of
buffet may (,ctse degraded flying qualities ,,nd high energy lossc du- ing
maneuvering flight, while (3) thv aerodynainic and 51trut tural n linits mav Pro vide,
adequate turn roets arnd .Wuii {(r all ri-qmired unan,.uvtl-s. A kntrdctor might
correct the d&,ieti,-• ýes bl using iiamonvorivng leading CO,-I slat: to ilouprve ( I//
-n0d delay ,Iirstrealn se-,iration (oiit 1ittt, aiiil by incnreasing egine thrust to
inipr.ve stistaiiid • pioix)iht je.
!: ~VIIL t

8/12/2019 USN TPS Fixed Wing Performance Theory and Flight Test Technique
http://slidepdf.com/reader/full/usn-tps-fixed-wing-performance-theory-and-flight-test-technique 137/245
INSTANTANJEOUS
.N7 .- • / - BUFFET LEVELS
SUSTAINED
MACH NUMBER
Figure 15
Engine-Airframe C.ompatibility
LEVEL FLIGHT TURNING PERFORMANCE
TE.ST PROCEDURES AND TECHNIQUES
1Thefli ht Procedures
a. Prepare pilot's data cardi. hi flight, -n each stabil~zed tturr, recird the
following cockpit data,
AiL'sp eO
Prewture altitude,
Normal acceleration.
Fuel used or fuAl r-m;,ining.
OAT.
1). On the 0.cAt % card wake a brief tabh of the variation ot normal acceleratIon
%ith bank ar'(le and have a blank plot of n vs. V (or M) to plot rrough data as
co.llected.
i-

8/12/2019 USN TPS Fixed Wing Performance Theory and Flight Test Technique
http://slidepdf.com/reader/full/usn-tps-fixed-wing-performance-theory-and-flight-test-technique 138/245
M:I
Flight Ptroce-doresa
A, Obtain V point first. Record the actual rv'adhig of the senastivenirt
accelerometer at this ig point. Any disparity from I Og should be noted as n tare.
b. Set a bank angle for the next data point. A 30° bank angle is
recommended. Assume that stable equilibrium conditions cin be obtained and use
the constant altitude test technique. Maintain the 30U bank ' le, test altitude,
and MIL thrust until equilibrium airspeed is attained, Tri•m out stick forces as
speed decreases. Record data when cquihlbriuc, conditions are achieved for 5 sec.
c. The constant altitude technique inmy be repeated for greater bank angles
and higher normal acceleration until the r.a" Imua level flight, normal accelerations
0has been achieved. At bank angles greater than about 60 , the high variation of n
with bank angle may makp stabilization very difficult.
d. If desired, the constant airspeed technique may be used for these difficult
test points. For airspeeds less toan that for peak normal accela ýtion, the test
technique will be that for unstable equilibrium conditions. The c matant airapeei
technique must be used. Fly smoothly and make small corrections as shown during
the performance demo flight until equilibrium conditions have beeI achieved for at
least 5 sec, then record data. Satisfactory datt muay he chbtdined within 1,000 ft of
the desired test altitude.
e. Some airplanes (mainly propeller driven) exhibit d 4 fferent tdrning
charam-teristics in r-t and right tUrns, The direction of tarn should be alternated to
establish wbh-thrr the characteristics vary.

8/12/2019 USN TPS Fixed Wing Performance Theory and Flight Test Technique
http://slidepdf.com/reader/full/usn-tps-fixed-wing-performance-theory-and-flight-test-technique 139/245
DATA REDUCTION ANT) PRESENTATICN
General
The varlatlon of m'iximuw normal acceleration in level flight with Mach
number will be presented for a standard airplane gross weight. From tlii
characteristic (faired test data), the variation of radius of turn and rate of turn
witlh Mach number will be computed.
Usually, the appropriate Hewlett -Packard program will be use4 for data
reduction. mlai program corrects the data to standard day temperature and
standerd gross weight conditions. Review necessary input parameters doring
preflight planninug.
MaAual
a. Correct obsetved airspeed for instrument and position error,
b. Determnine Mach number from the M - V -H chart.
c. (.orrect observed normal acceleration for instrument error und for i. tare.
Assurne thŽ, tare correction is constayit through.out the rangc, of the sensitive
accelerometer &id •.apply, it to all obse2rved .,'ahue,
o. ComŽrpute ta i'pla" rovo ght, W,
R

8/12/2019 USN TPS Fixed Wing Performance Theory and Flight Test Technique
http://slidepdf.com/reader/full/usn-tps-fixed-wing-performance-theory-and-flight-test-technique 140/245
e. Compute normal accleraton for the standard weight.
f. Construct a graph of the variation of standard weignt normal accelaration
with Mach nunwbr or velocity. From the faired curve, read vahles of n at varius
airspeeds.
g. Corrrect obs,"rved OAT for instrument error to determine T (if necessary)"
h. Comnpute true airspeed
VT 65.8 M 1/ ( K) fpa
i. Calvthate radifus of turnV~TZ
. - .ft
g ýn
. ,Calculate rate of turn
57.3 V1. 5i73 g Vr 1
oj d~g/spc- T
k-, Present the following gryahs for :ac&h altitude tested:
Varia~ion of sustained normal aocelerAtion with Mach nm•aber/KC>AS,
Variation of suatnedI rad.us of turit with Macah namber/KCAS.
Variation of sustained rite of turn with Mach •nb•;r/KtAS.
imaw, x'tL, )
8/12/2019 USN TPS Fixed Wing Performance Theory and Flight Test Technique
http://slidepdf.com/reader/full/usn-tps-fixed-wing-performance-theory-and-flight-test-technique 141/245
BUFFET BOUNDARY
TEST FROCEDIULES AND "rECHNIQ•IES
refligh t Procedure
a. Review stall/spin characteristics and recovery techniques. Prepare pilot's
data card. For each altitude at several speeds, record the following cockpit data:
Mach number.
l [Pressure altitude.
Normal acceleration at onset buffet.
Normal acceleration at tracking buffet.
Normal acceleration at limit buffet.
Fuel used or fuel rtmaining.
AOA, remarks, etc.
SFihht Procedche
a. The maneuver best suited to obtain the data required for thiii test is the
wind-up tun in which normal acceleration is steadily increased while maintaining
a constant Mach nrumber, Stabilize at the desired airspeed with a mission..-related
power setting (climb may be necessary) and slightly &bove the assigned 14itude.
Smoothly roll into a turn anti Msaedky increase nz . Whe he Mach number shows a
"tendency to decrease, us;:! more bank angle to increase nose down attitude. V pte
the normal acceieratios when onset buttet and ;racking buffet oc'ur, C:cntinve to
increase n untllimit buffet or tne structutral iimit of tho airplane ik, attained.
.Recover and record dirai.ao ':-tif v data way, obteained ?k atny alti ztudr within
S1,COO ft of OhW ic.,igutd dt )t If pm: i'ble, 'recoý,d altitude, t:or each bufh'et levvel
o.at a poirt.. 'h'x will pv' i h *Yito{t 3( rUr£Ž ta and mirnim ize al-titwt• ef fe'its
:V T
S\,"1 t . ?4Cil~*wn~~llll a~llllM~4

8/12/2019 USN TPS Fixed Wing Performance Theory and Flight Test Technique
http://slidepdf.com/reader/full/usn-tps-fixed-wing-performance-theory-and-flight-test-technique 142/245
. . ., , - , ,7.7 7, . .. , .'t ,- '
b, Repeat this procedure for otbir airspeeds until the buffet b•nnary for 'the
entire maneuverir, airspeed range Is defined. For some Mach numbers it may be
necessary to .epeat the wind-up turn, obtaining onset and tracking buffet in the
first turn, and limit buffet in the aecond. The use of augmented thrust may be
useful in Loae airplanes to maintain speed or to reduce altitude loss during the
maneuvers, but should be recorded and noted on the graphical data plot.
DATA REDUCTION AND PRESENTATION
Generai
The Hewlett-Packard programs will usually be used for reducing these data.
Chitput is in the form of lift coefficient (CL) for the various buffet levels vs. Mach
number. Once the variation of CL with Mach number is smoothly faired for each
buffet level, n vs. M curves can be constructed using the formulaz
C_ V. S
ninst =C- PVL. sfI[ ZW
where S is the wing area In (ft ) This procedure may indicate that C curves
generalize between altitudes, which would allow generation of nmany curves after
testing only two or three altitudes.
Manual
a. Correct observed Math number for, instrument and position error.
bi Correct observed normal acceleretion for instrument error, and for nz ta,'e.
c,. mpt airplane gross weight,
d. tor.1ninubo normval )crcel(Aratit.,,ritfr aw andaxd weight,
N W
.s. na
V1 21"1

8/12/2019 USN TPS Fixed Wing Performance Theory and Flight Test Technique
http://slidepdf.com/reader/full/usn-tps-fixed-wing-performance-theory-and-flight-test-technique 143/245
e. Contruct graphs of the variation of normal acceleration for onset,
tracking, and limit buffet with Mach number for each test altitude.
f. Conmpute and construct graphs of:
Variation of instantaneous rate of turn with Mach number/KCAS.
Variation of instantaneous radius of turn with Mach number/KCAS.
__VIR-2

8/12/2019 USN TPS Fixed Wing Performance Theory and Flight Test Technique
http://slidepdf.com/reader/full/usn-tps-fixed-wing-performance-theory-and-flight-test-technique 144/245
SECTION IX
"CLIMB PERFORMANCE
!i.

8/12/2019 USN TPS Fixed Wing Performance Theory and Flight Test Technique
http://slidepdf.com/reader/full/usn-tps-fixed-wing-performance-theory-and-flight-test-technique 145/245
REFERENCES
SECTION IX
1. AGARD, Section 4:10 - 4:13
Z. Dommasch, Air lane Aerodynamics, Section 9:7
3. Petersen, Aircraft and Airplane Performance, Chapter 8, p. 156
4. Rutowski, DAC, "Energy Approach to the General Aircraft Performance
" 4 Problem"
.4 5. USAF, ARPS PTM, Sections 4.4 and 4.5 of Theory
fX --
LA *--.i a.:,.

8/12/2019 USN TPS Fixed Wing Performance Theory and Flight Test Technique
http://slidepdf.com/reader/full/usn-tps-fixed-wing-performance-theory-and-flight-test-technique 146/245
CLIMB PERFORMANCE
PU RPOSE
The purpose of this test is: (1) to determine the ,limb performance of a
turbojet airplane; (2) to determine compliance with the combat ceiling (500 fpm
rate of climb) or climb performance guarantee of the applicable Detail
Specification; and (3) to check proposed climb schedules and obtain data for
presentation in Flight Handbooks.
DISCUSSION AND THEORY_
"The excess power (specific energy) characteristics of an airplane can be
determined at several attitudes using the level acceleration run tests described in
Section VI. Maximum rate oi climb and maximum energy climb schedules can be
derived from these data using the procedures set for'th in Sect~on XII. Since
computation of time to climb data from acceleration runs (or sawtooth climbs) is
tedious and does not always yield accurate results, time to climb data are normally
determ ined•-l•,Tflffig•g-t6hili-idiib climbs to service ceiling.
Normally, the contract guarantee ceiling would be checked using the
contractor's recommended climb schedule. For the purposes of this evaluation, TPrS
derived schedules will be flown. The maxhnuxr energy climb schedule results in
minin.um time to a given energy altitude. Variations of Lhis schedule may result in
minimum time to a pressure altitude, rdaximnum range or greater cruise ceiling.
Crlose approximation may be obtained by using a constant KCAS/Mach schedu e
which is easie- for a plot to fly.
Ix I

8/12/2019 USN TPS Fixed Wing Performance Theory and Flight Test Technique
http://slidepdf.com/reader/full/usn-tps-fixed-wing-performance-theory-and-flight-test-technique 147/245
An important aspect of climb performance is the time and fuel required to
accelerate from brake release to the climb schedule airspeed near sea level. Trest
climbs are usually divided into two phases: (1) the acceleration ard transition to
climb schedule and (Z) the climb from near sea level to the ceiling.
In performing the climb test, it is important to fly the desired climb sche dule
precisely and smoothly. If the pilot strays from the schedule momentarily but
corrects his airspeed smoothly, the average rate of climb for the interval will
closely approximate the rate of climb which would have been achieved had the
schedule been flown precisely. This is based on the principle of interchangeibility
of potential and kinetic energy and was applied in the acceleration runs test also.
There are energy losses in this exchange, of course, and the effect of deviations
from the desired climb schedule becomes more critical as altitude increases.
Another factor which must be considered in the climb test is the effect of
wind velocity gradient with altitude. If the climb were flown at constant true
airspeed into a headwind which increased with altitude, the velocity of the airplane
(relative to the ground) would decrease as altitude increased. Some of the
9 airplane's kinetic energy would be converted to potential energy (in effect, a zoom
manenver), and the observed rate of climb would be greater than that observed on a
similar climb in still air conditions. Correction for horizontal wind gradients with
altitude and for vertical movements of the air mass are tedious and beyond the
ascope of this exercise. Gradient effects can be minimized by performing the test
clir.Ls on a heading perpendicular to t.oe average whids.
Ix 3

8/12/2019 USN TPS Fixed Wing Performance Theory and Flight Test Technique
http://slidepdf.com/reader/full/usn-tps-fixed-wing-performance-theory-and-flight-test-technique 148/245
The correction of jet climb performance data to standard day conditions is
similar to the corrections required for acceleration run data - temperature
correction for thrust, momentum correction for weight, and induced drag
correction. The thrust correction uzt:7ily is the most significaat although the
weight and induced drag corrections must always be considered. An asstulption in
the correction of climb data is that the standard day calibrated airspeed at a given
altitude is the same as the test d-y airspeed. When evaluating a climb performance
guarantee which prescribes a standard rate of change o; airspeed, an additional
correction to rate of climb for nonstandard dV/dh or dV/dt must be made.
TEST PROCEDURES AND TECHNIQtUES
PrSeflght Procedures
a. Required data (Photopanel required - set on 1/2 frame/sec).
Time.
Pressure altitude.
Airspeed.
OAT.
Fuel used (or remaining).
RPM (for reference).
Take photopanel data every 4,000 At interval for altitudes below 30,000 ft and
every 2,009 ft for higher altitudes but no less frequently than every 2 rain. Fo r
high performance airplines, it is usue.lly desirable to take continuous plictopaylel
data to a snedium altitode, Take covrtltI ing dat a on kneeboard.
IX 4

8/12/2019 USN TPS Fixed Wing Performance Theory and Flight Test Technique
http://slidepdf.com/reader/full/usn-tps-fixed-wing-performance-theory-and-flight-test-technique 149/245
b. Prepare data card (see Figure 1).
c. Obtain assigned climb schedule from group leader.
d. Obtain upper air wind velocities from aerology. Estimate average direction
weighting strnng vertical gradients more heavily.
e. Review takeoff technique.
"f. Carry a 60-sec stopwatch or navigator's hack watch.
-- -~I • -5

8/12/2019 USN TPS Fixed Wing Performance Theory and Flight Test Technique
http://slidepdf.com/reader/full/usn-tps-fixed-wing-performance-theory-and-flight-test-technique 150/245
-~ wChas w
vi.'..pi avia. ~
LA-,-
KiW08* - .WIh-
Z OAT- P~oB5
H A
ZII X

8/12/2019 USN TPS Fixed Wing Performance Theory and Flight Test Technique
http://slidepdf.com/reader/full/usn-tps-fixed-wing-performance-theory-and-flight-test-technique 151/245
Fl1iiq_1Pyoce~dures
The climb 1wrformanco test will be conducted in two part* brake release to
3,000 ft (an arbitrary altitude) and climh to cruise cviling from near ea& level.
Eatmtmatd takeoff perfortinc.ne will also be netrtrminod during the first part of the
test.
a. Energize the phot~opanel and release brakes Pt a predeterm.ined film
counter nmmber. The takeoff should commence at a runway marker so that a
reasonable eatimatv of ~est ety taleoff performance can be made. Record timne
and distance to lf--off. Start watch at brake release. Record time and fuol
required for takeoff, acceleration, and climb to 3,000 ft above field elevation. The
acceleration phose Otould be conducted at as low an altitude an poxaible
comnmen•uraite with safety, cours, rules, and sound judgment.
b. E,•ahlth thv- ,0tp'a&N on 6 heading prpendicular to the avorAge wind
direction. Energize photopanel. Set M11. thrust and mtabilize on the required climb
s.-hedul.- to pass through 2,500 ft pressure altitkide in a stabilized, trimmed cli-nib.
When the takeoft heading in within 30 deg of the climb headin•, the climb may he
d(Ue. in on,- continumis miaueuver from brake release, Dlo not exct-ed to deR bani
aogh, while ad 111t'I; '•,,di•he clmbh,
C. onim~i-ne tii ing Ow~ c lfn tý At1.000 ft preo.nure. Altituode. Recrud
kv,,e•board and photopanel data at 4,000 ft in*trval%. fLt thel, pjotopanol run
c.mtlnuous'ly until well exst"llshrd in the' climb. Thore f tier, enorgize th,ý,
jhoto•ntA.l for 10 to &(0 ioc whil,' pIe)vng through ench dotna utiitud.,
[C
A IX

8/12/2019 USN TPS Fixed Wing Performance Theory and Flight Test Technique
http://slidepdf.com/reader/full/usn-tps-fixed-wing-performance-theory-and-flight-test-technique 152/245
d. Above 31,000 ft record dati at ,000 ft lnter'xzls, but no lsa requt•ny
thar. ea•a c 2, mitt -ntil cr'uise ceiling is attained. t:.ttxris,,hat the rate of climb is
less than 300 fprnt by obrcrvýng a time history of altitude. It 6s important thAt this
ptin of the clhno schedule be flown precisely.
e. if it W uiecesnnry to reduce thrust to maintain EGf lhinit, note this on tho
a%4 ,.ard.
f. Should it beconte necesnary to interrupt the climb for any reason, the groas
weight chanie must be kept to -t mjinimum. At low altitude, thin is best
accomplished by a rapid deacending, turn at idle thrust supplemented by the use of
speedbrakas, if necessarý'.Pa
high altitudes, it may be necessary to make the turnat MIL or MAX thrust to pre,:evt excessive altituide/airspeed ioss and suffering the
attcndant iicreuse in furl used attempting to regain lost altitude and/or airspeed.
g. The airspeed indiczAor, vice the Machmeter, ehould be used for the climb
schedule sinve the Macbhu - .er is of insufficient accuracy,.
MANUtJ DATA REDUC'ION
General
SThe cliinib data may lbe presented for test day conditions. For a more exact
mnalyrL, the data should be coarrected for the effects of nonstandard thrust and
gro.ss weight,, Record the following data fronm the photopani kiln .. at brake
reeas~:.. at climb a-i1spec,', and 1t. 3,000 ft hbove field elevation; in th0 climb at
4,0,0 ft interiv•s, fi-•mo 3,000 ft presiire altatde to 30,0O0 ft -nd at Z,000 ft
Pft3i 1,, ,,~~000i ;,t, bu.t at iZFId rverv
OafxpzA T.r-1 V W OA 1'

8/12/2019 USN TPS Fixed Wing Performance Theory and Flight Test Technique
http://slidepdf.com/reader/full/usn-tps-fixed-wing-performance-theory-and-flight-test-technique 153/245
Dat, Reduction Teat Day C lb Performance to Cruise Ce i,.ni
a. Correct observed altitude and. airspeed for instrument ax, •osttion erroro.
=b. Determine Mach number from V - --. 1-1 hart,
c. orrect observed OAT for hateument rror and detcrv'r.ne the aiJhient
terapt-rature from Appendix TV.
d. Calculate true airspeed-
V. 39 0 k(" ) kt
e. Compute fue) used in lb.
f. On a sheet of 16" x N0" graph paper, construct a rAot of the variation of
pressure altitude with the time for both parts of the climb test. Use scales of
about 5,000 ft/in. awd 5 rnin/ir. Assume that the data recorded at field elevation
and 3,000 ft above field elevation ar ý equivalent to data which might have been
recorded on another day at sea level and 3,000 ft pressu..e altitude. On the smne
graph sheet ala plot the variation with altitude of calibrated airspeed or Maca
number (dependingon
clinib scheduleused),
bothtest day aid ,itandxrd dav arabirant
temperature and fuel used, 'Fair a smooth curve thro~igh the time to climb and
airspeed data. In fairing these curves, observe that xhan the airspeed wa5 faste,
than the mean, the climb data •,,omts ,vill tall below the f[ired dAimi: curve and vice
versa. There may be a slight t;co::iu iy i4- th'e time to climb -ui ec at an altitude
when it wai necessary to njdu,- thru t, or at an altitude where the tonperatore
lapse rate changed abrupt lý Fair a ct',rv, tbrt,,. . fu used lt a
bth the time to cml -irin tiel oami 1 ýa; level.
j

8/12/2019 USN TPS Fixed Wing Performance Theory and Flight Test Technique
http://slidepdf.com/reader/full/usn-tps-fixed-wing-performance-theory-and-flight-test-technique 154/245
.From the falre-d time to c<limb curve, graphically mtasin-c the ind•ated
rate of climb, (dli p/dt)t at 5,000 ft Witervals beginning at sea ievel. Plot the
variation of indicated rate of climb with altitude. Mark the combat ceiling
(500 ipin) and cruise ceilldg (300 fpm).
h. From the faired curves of time and tuel used, record the time to climb &0,1
Euel required at 5,000 ft intervals for a climb from sea levl (At climb airspeed) to
cruise ceiling.
i. Compute the time to climb through each 5,000 it interval, At,
J. For each interval, compute the no-wind distance flown.
xjd VT .1nx•&V Ov k)0
k. Compute the distance flown from start of climb to each altitude.
1. Deternmxine the time and fuel required for takeoff and 6,cceleration to climb
.iripeed by subtracting tiiem and fuel required for chi.nb from sea level to 3,000 it
-eztrapolak•ota of climxb data) fromh this observed time and fuel required from br;ke
r-lel ae to 3,000 ft.
ni, Tese '•esitt may he prLetrad as the t oTl•time, fuel us.At, and ;i r
distancc (frout sea level at climb airspeed) to cruise ceiling ýn 5,000 ft hitervals of
altitude. Slt+, the timre and fu-ýl requiced for takeoff and accelcratiou in a
foote t"' 0 .
10~

8/12/2019 USN TPS Fixed Wing Performance Theory and Flight Test Technique
http://slidepdf.com/reader/full/usn-tps-fixed-wing-performance-theory-and-flight-test-technique 155/245
Data Reduction - Ceiling Guarantee
The rate of climb observed at acme arbitrarily chosen altitude can be
corrected to standard conditions of thrust and groas weight. If such corrections are
made to rate of climb oLserved at several altitudes neat, the guarantee ceiling, a
curre ,'-fining the variation of standard day rate of climb with altitude may be
3 - drawn, and the guarantee ceiling at standard conditions .f thrust and gross weight
establlshed. The ceiling also is affected. by aL-q.,jed. This test was flown at
severad climb schedules, one of which will resuIt in the greatest ceiling for the
conditions of the guarartee.
n. For the F,•,veral data points obtained at 34,000 ft and above correct
observed pressure alt,;tude and airspeed for instrument and position error.'.
c., Determine Mach number from V - M -- 'I chart,
p. Correct observed OAT for -nstrument error and determine ambient
temperature from Appendix IV (note some ol the ambient ':empera~ure d ta
computed ix( step c may be used if suitable)
q. Calculate true air•speed.
I):teT n -;e irpl ,t gr/xs weig( t frau : ue or foe ernainiag.
s,, Obtai:: -.esure ra.tio, iý, aA4 At \ddakr Li.y arnbient temrera.iure T , from
Appendx VII.
t "• 'the ý,Aiation of :nne.. tkmb ax.iod ir airi p eý with altitde. Fdr ac r e thi,,•.UghI t heýýe d xta. Gr tip IIic a Ily 'f ekrk njnf ý'.ndi L,t edI t-ata o c- ii b,
{dli.,/d~t) "i '( 00 ft 1ib h 'ia A 0 0 ra Ie bI ,. 4 -e r zýkPýi

8/12/2019 USN TPS Fixed Wing Performance Theory and Flight Test Technique
http://slidepdf.com/reader/full/usn-tps-fixed-wing-performance-theory-and-flight-test-technique 156/245
-•% • a%•Pwrt - ,, T,, .-. - -
tu. Calculate actual rate of climb for test day.
(ft/C)t (1 f pmTaG
,v. Compute net thrust correction (nonstandard temperature).
:•, xacI=1 .... \ (-v Ta)'
NY L' n-P) (T8 53 T 9•i s ] dT as
-•, where
.70 Ib/°K (J57-P-4/8/16 engine)
-40 Ib/ 0 K (J-5Z-P8A engine)
- -i6 lb/°OK, (J-85 engine)
w. Compute induced drag roerection.
LC .,•-oT' as OI2 - WVb) fpm
where
lZ gR 5.4 U- for A.-4P eb W
Si 0OS x106 for T--38
LOS x 10 for F.-8K
- ~ ~ ~ ~ ~ ' ----- I-----

8/12/2019 USN TPS Fixed Wing Performance Theory and Flight Test Technique
http://slidepdf.com/reader/full/usn-tps-fixed-wing-performance-theory-and-flight-test-technique 157/245
x. Compute standard day rate of clihb for the conditions of the guaa&ntee.
O ( /c ) t 4S + (/C) + /C)
y. Plot the variation of atandard rate of climb with altitude, Extrapolate as
necessary to determine service ceiling. On the same graph, show the test day rate
climb variation and the test conditions (average gross weight and average
difference of ambient temperature from standard).
COMPUTER DATA REDUCTION
Climb data is normally reduced by CSD (Computer Services Diviaion) with
resultant plots reduced to standard day conditions. Determination of climb
schedules from acceleration run data is contained in Section XII of this manu~al.
IX 131

8/12/2019 USN TPS Fixed Wing Performance Theory and Flight Test Technique
http://slidepdf.com/reader/full/usn-tps-fixed-wing-performance-theory-and-flight-test-technique 158/245
SECTION X
D ESCENT PERFORMANCE
4p,
S -

8/12/2019 USN TPS Fixed Wing Performance Theory and Flight Test Technique
http://slidepdf.com/reader/full/usn-tps-fixed-wing-performance-theory-and-flight-test-technique 159/245
REFERENCES
Section X
1. Petersen, Aircraft and Engine Perforimance, Chapter 10 .
Z. USAF, ARPS PTM, Section 4.7 of Theory.
Ix I
L __

8/12/2019 USN TPS Fixed Wing Performance Theory and Flight Test Technique
http://slidepdf.com/reader/full/usn-tps-fixed-wing-performance-theory-and-flight-test-technique 160/245
DESCENT PERFORMANCE
PURPOSE
The purpoce of thib test is to Aetermine the idle thrust descent performance -
time, fuel used, and range - in a desr.ent from 40,000 ft to rear sea level at landing
grows wcight. Such descent tests are required to determine the most desirable
airspeed for descent ant, to obt'ain data for preseatatio, in Flignt Handhookr,
DISCUSSION AND THEORY
For •tabilized, level flight, engine flrust is adjusted by,:anc e the airpiane
drag. In terms of power, we say that engine power equals po,;er requirfd
(FV = DV, ft-lb/sec). If the thrust were reduced to zero, then the power recuired
to maintain the airplane's airspeed must come from the airplane's time tate of
change of kinetic and potential energy. The rate of expenditure of this energy
varies directly with the rate of descent -and linearý acceleration. The minimum rate
of descent will occur at the airspeed for minimum power required. The maximum
gliding range will be obtained at a faster airspeed where the maximum ratio of true
airspeed to power required occurs.
The airspeed for minimum rate ot descent at idle thrust in the jet airplane isapproximately the airspeed which results in the maxirmam ritio of C h3e/C/T
L "'" Th
airspe:ed for maximum range in the idle thrust glide is approximately the airspeed
for maximum ratio of CL/CD. The idle thrust descent airspeed schedule can be
estimated on the basis of these theoretical ratios; however, ýor a more precise
result, the. effects of residual thrust also must be considered. The estimated idle
descent -3irspeed schedule can be refined by performing a sieries of desc:ents at
several constant tirspeeds. Usually, a constant (calibrated airspeed descent
x -- ,

8/12/2019 USN TPS Fixed Wing Performance Theory and Flight Test Technique
http://slidepdf.com/reader/full/usn-tps-fixed-wing-performance-theory-and-flight-test-technique 161/245
schedule which will give near opttmum performance can be determined. For this
testv idle thrust r.escents will be made at one gross weight, and the effects of
weight changes will not be considered. Qualitatively, an increase in airplane gross
weight has the effect of increasing the airspeed required to maintain the desired
lift coefficient which is stated above. The rate of deacent observed at the heavier
gross weight will be greater because the power required is greater; however, the
glide angle will not change, and the range in tha descent will be unchanged by an
increase in weight. This statement must be qualified in that it does not consider
the effect of resrdu.•J 'thrust at the idle thrust "etting or steady winds. Generally,
the residual thrust effects re-dlt in increased descent range as airplane weightdecreases. Because a change in airplaae kinetic and potential energy is involved in
the idle thrust descent test, wind gradients will affect the observed rate of
descent. The descent must be flcwn on a heading perpendicular to the average
wind direction to minimize vertical wind gradient ef;'cts.
TEST FROCEDURES AND TEGHNIQUES
Preflight cedurs
a Required Data (photopanel desired 1/2 frame/sec)
Tim e
IPkeu-sure i. t ude
Airspeed
OAT
F'uel used
k PMA (forrer 'tx
____ __ 3

8/12/2019 USN TPS Fixed Wing Performance Theory and Flight Test Technique
http://slidepdf.com/reader/full/usn-tps-fixed-wing-performance-theory-and-flight-test-technique 162/245
Record both photopawel and kneeboard data at 5,000 feet intervals commencing at
40,000 ft. Record last data at 3,000 ft .
b. Prepare data card (see Figure I).
c, Obtain upper air wind velocitie. from aerology. Estimate average wind
direction, weighting strong vertical gradients more heavily.
d. Carry a 60-sec stopwatch or navigator's hack watch.
~A
""Cc
-i . ... .. . .. ... . . .. .. . . . . .. . .. .. .. . .. 4

8/12/2019 USN TPS Fixed Wing Performance Theory and Flight Test Technique
http://slidepdf.com/reader/full/usn-tps-fixed-wing-performance-theory-and-flight-test-technique 163/245
Flight Phocedures
Normally, the idle thrust descent test will be performed in the same flight as
the service ceiling climb test. It is desirable to perform the descent along a
reciprocal flight path of that used for the climb because it will probably allow the
ambient temperature information obtained in one of the tests to be used for both.
a. Proceed to the required starting >,oint at about 4Z,000 ft. When fuel
remaining is Z,000 lb (1,600 lb in T-38A) e tablish a heading inbound to the field
en•nd perpendicular to the average wind direction. Stabilize in level flight at the
required airspeed. Set idle thrust and quickly retrim so as to be stabilized in the
glide at 40,000 ft.
b. Energize the photopanel briefly and record required data at 40,000 ft and
at 5,000 ft intervals in the descent. Record "ast data at 3,000 ft pressure altitude.
c. At 3,000 ft after mentally ýiotihg r quired data and advancing the throttle,
record the data on the kneeboar#, Be dlert to the possibility of fuel control icing
and be prepared to take proper ,orrective action immediately if the engjie fails to
accelerate.
MANUAL DATA RED)UCT-CION
Sc:neral
The descent diata will bet presented for test day condit ions. For a nore rxac t
analysis, the rite of descenxt should bc corrected t(, a standard gross weiglht.
(:orrections to thrust are not siglifiý-lant in this test. RP(,:rd thet .Ol oWing ltt.
,romi the W11(1 t~aii t ,000 ft in t '- v aýs t ki~nrirg c 4 0, M-)0 ft a'11f fI
3,000 it:
X

8/12/2019 USN TPS Fixed Wing Performance Theory and Flight Test Technique
http://slidepdf.com/reader/full/usn-tps-fixed-wing-performance-theory-and-flight-test-technique 164/245
Elapsed time H W OAT W
I *for reference only
Data Reduction - Idle Thrust Descent -
a. Correct observed altitude and airspeed for instrument and position errors.
b. Determine Mach number from V - M - 11 chart.SC p
c. If the idle descent was performed over the same flight path as the service
ceiling climb and the weather conditions were stable, use ambient temperature
calculated in step c of the climb data reduction. Otherwise, correct observed OAT
for instrument error and determine the ambient temperature from Appendix IV.
d. Calculate true airspeed
3VT3 9.0 M W"Ta (OK) kt
e. Compute fuel used or fuel remaining in pounds.
f. On a sheet ,Af 10" x N" graph paper, construct a graph of the veariation of
pre&,sre I.ltitudv with time in the desctent. Use scales -f atout .,000 ft/in and
o /n. Fair a simnoi t• cuirve thrv, g thie dat.i and e-xtrapolate to sea levtL. ()i
zhte timIe to (lescenxt curve, note. the ('A- si hedih, flown.
g. From the Ltir, ii ine t,) desk en rv,, gr A h oiV;'!m ,urt. in' luatf'd rate,
of des ent, (kil (It) it , 0t)() • ntervals hegjizinnwg A 40),t0)) i. Aki,o [],)t thisil
tla t t on the large g'r Iph.
h Pop~ uve l~e~ f tme o~dfel usd eidtetime tiý (Ies( en d
.n. thetW i ii,W III I cl'tntr fmn 401,0001 ft to) P.Avl epeat .It 1,0b(0 ft
IA 'iV 1"
. I 'A ,- i•.•:•• . :, , . • • ,.. .. ..
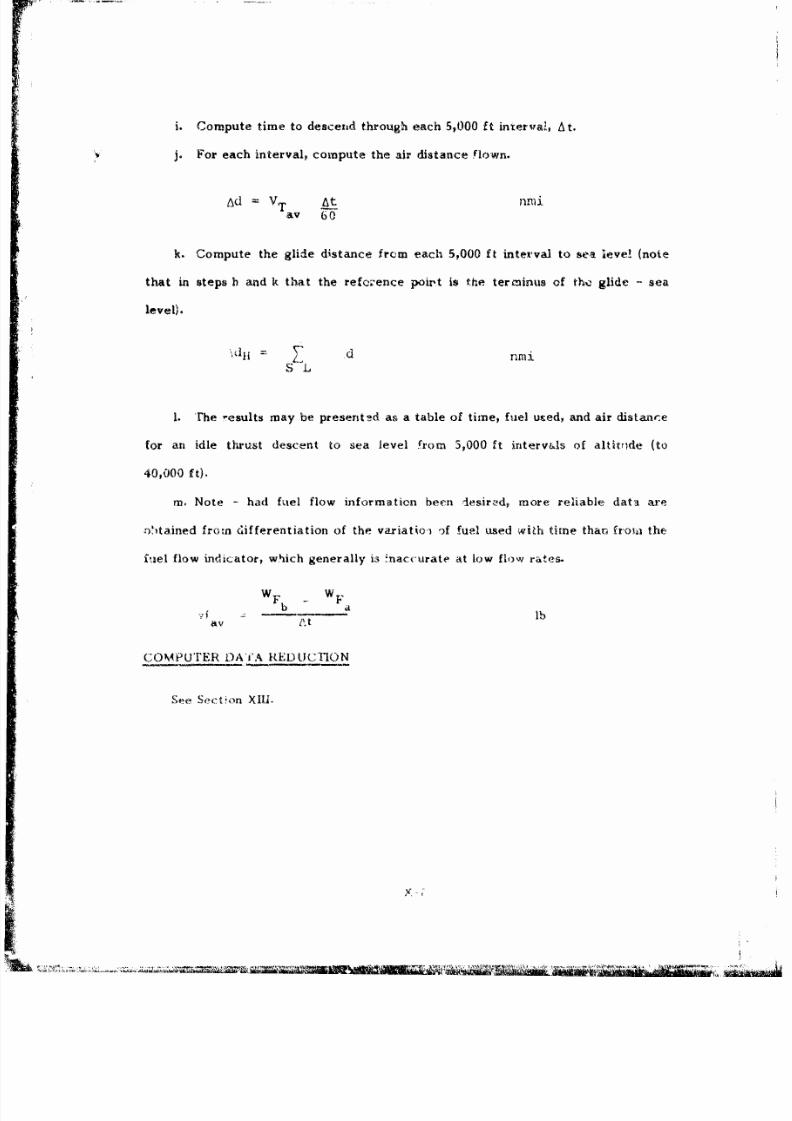
8/12/2019 USN TPS Fixed Wing Performance Theory and Flight Test Technique
http://slidepdf.com/reader/full/usn-tps-fixed-wing-performance-theory-and-flight-test-technique 165/245
i. Compute time to descend through each 5,000 ft interval, At.
j. For each interval, compute the air distance flown.
Ad = VT At 11nmiav 60
k. Compute the glide distance from each 5,000 ft interval to sea leve (note
that in steps h and k that the reference poirt is the terkninus of tho glide - sea
level).
"d nni
S L
1. The results may be presented as a table of time, fuel used, and air distanr.e
for an idle thrust descent to sea level from 3,000 ft interv&ls of altitride (to
40,000 ft).
m. Note - had fuel flow information been Iesirýd, more reliable data a-e
ýrtained fromn differentiation of the variatio.i of fuel used with time than froin the
fuel flow indicator, which generally ii inaccurate at low flow rates.
SWb - W
-. r( lbv tl
COMPUTE R DATA REI L.CL.10N
See Sect~on XII.I
x

8/12/2019 USN TPS Fixed Wing Performance Theory and Flight Test Technique
http://slidepdf.com/reader/full/usn-tps-fixed-wing-performance-theory-and-flight-test-technique 166/245
SECTVON XI
STOL PE•FORMANC E
- '

8/12/2019 USN TPS Fixed Wing Performance Theory and Flight Test Technique
http://slidepdf.com/reader/full/usn-tps-fixed-wing-performance-theory-and-flight-test-technique 167/245
NOTATIONS INTRODtMCf) N THIS SECT•O.N
RIG Rate of Climb
y Flight path angle
V Airspeed for greatebt flight path cliirzb anglei "•'max
V R/C Airspeed for greatest rate of cirnb
MIXQ Engine rorque presswu•
N Engine speed - percent
xi
8/12/2019 USN TPS Fixed Wing Performance Theory and Flight Test Technique
http://slidepdf.com/reader/full/usn-tps-fixed-wing-performance-theory-and-flight-test-technique 168/245
T~V8STtGA'TION OF STOLI PERFORMANCE
PUJRPOSE
lh~n purpose Af this test. is to determiine the STOL performance of a fixid
inidphncc- turboprop airp~an~e, Axrspeed for stall, 6est cli-nlb angle, best rate of
climb, and best approach aungle -:A be determined. Test day takeoff and landing
distancea will be determined.
DISCUSSION AND) THEORY
The performance of a STOL. tirplane will derend greatly upon its engine thrust
tine angle, its variable geometry or incidence features, and its gross weigilt. In the
cane of tbe fixed incidence STOL, airplanes, the principle source of lift will be the
*wing, therefore, the excess power character-A'stics will Oictate ýt potential takeoff
and anding performance. Add4ticinal limiiations may be imposed by flying qual-Iv,
deficiencies.
The siv~tooth climb method can be ased to deter-mine excess power
characteristics and airspeed~s for best. a~igle and rate o; climb. The best appw(.oiý.h
configviratiori and nirsyneed can be detertnine-d by a sawtooth dercent method. The
effect of gross weight on thes~. airspeedi- caninot always be calculated by the
classical sq4u;nre root weight ratio mrthc-d since the airplane pitch angle~ may be so
large tlhat the thrust component supplies a signifi(cAnt e.mount of lift. TIbis mneans
that test data 13oints imust be talkten at both 1-hv .~And light gros's weights,
YRe Ia t i; y smnall varia t ior in Wross %veight can be correcto'd by the i-lassira I
~trihod In order to correct ttest dat~a to oneý we ght. After~ best a'rspeeds hatve been
& ier~ineactuI alet andl la.d in~g di, tiances inust be, me asu,'-d. A numbe-r of
sp- Ia teŽst r-coýrding devi-f-s are ava il~hlý-fe vtýkeof &11d lkanrding 'Ia a coll'ct ion
X!
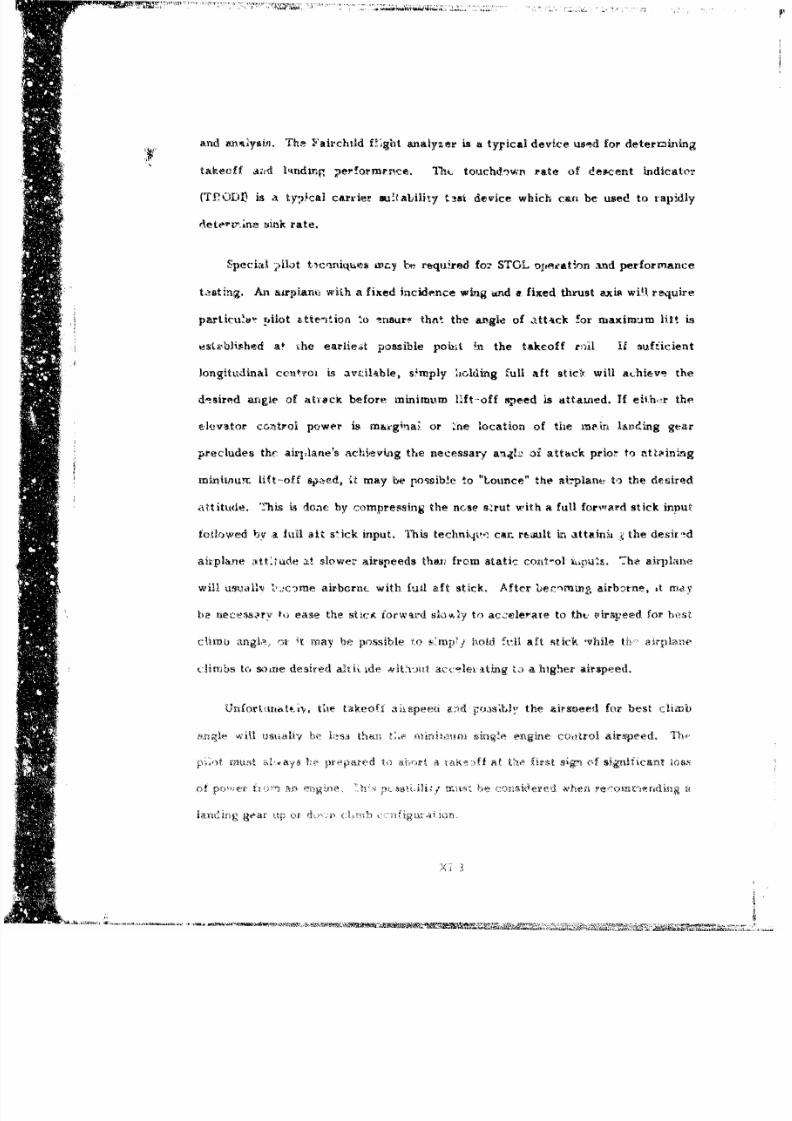
8/12/2019 USN TPS Fixed Wing Performance Theory and Flight Test Technique
http://slidepdf.com/reader/full/usn-tps-fixed-wing-performance-theory-and-flight-test-technique 169/245
and an-6ysill. The Fairchild f~ght analyzer is a typical device use~d for determining
takeoff aAr kniding, per orrnrnce. 111c touchdo-wn rate of depscent indicat'or
(TfCO)L; is a,. ty,,kal carrier ai Cability tnt3x device which can be used to rapidly
dleterutane Mtii& rate.
Speci~al ?,;Ibt t~icnnicp~es way be~ r~tqured fo-. STOL operation %ndperformance
tosting. An asrpiaxw with a fixed incidence wing wtnd a. fixed thrust axis wi tt require
particu~v' pilot atte'ition to ensure, that the angle of att-ick or maximum lilt is
etst~lblished at die earlieit possible point hi the takeoff mu I If sufficient
longtudnalccnkrox is avtzilabte, s~mply acolding full aft stics will achiveth
desired angle of at~eck before minimum Hift--off speed is attauied. If eiI.h,-r the.
elevator con-trol power is maz-ginr~ai or .'ne location of the mp~rt Lcmiding gear
precludes thc air;Aanie's achieving the necessaxy angli2 oi attack prior,, to ntteining
minixnumt lift--off spýýCd, it. may be possible to 'Lounce" the. ai-plane ta the dxesired
Mttitude. Thsi one, by compressin-g the nose Crut with a full forward stick in~put
foeiowed Wy a fulil alt stick input. This techniqwý: cr. reult in attainia , the desir-ýd
aikpline ý:Rt tude at. slower- airspeeds thai; from static cont'"ol ~s~.Teairplane
will US\alIsv '42:OcflIC airborn( with full aft stic~k. After bernmtnj, airbcrne, it mray
be nec. usArv to; ease the stifc&- iorward ski A~l to acc:elerate to thc virapeed for hv~st
angbtn :.a, it na'y be prssible ~o<jhold 4 aft stick wvhile 6\-~ asi-phne
climjbs to- SoY*C desired alt k, ice> itstacltdn . a higher airspeed.
Unfor~uts~til.te take-Off Auspoefa icnd 1 :tns~b, the. airsaeed for best cli'mi
ýn- '611 tisiitll'y hie l;>SA tha;%, 6~elh¶fi~e> engine cuo.trol airspqeed. TliV
Qo rlnut "i.vays V-prviparf*,d aitworl a i~ n'xs.)ft Ulýiw rvt s'g>,, of signfUýtiCRn! AGis
.3
k '41
ý& M~m %Wq

8/12/2019 USN TPS Fixed Wing Performance Theory and Flight Test Technique
http://slidepdf.com/reader/full/usn-tps-fixed-wing-performance-theory-and-flight-test-technique 170/245
The importance of best climb angle for clearing an obstacle after takeoff is
obvious. Theairspeed for best climb angle
willbe
lowerthan the airspeed for best
rate of climb., While there will be a best climb airspeed for every airplane, the
method of acceleratkig to that speed, or the requirement for actually accelerating
tc th&t airspeed will depend upor, the airplane's perform ance and mission.
The short fkeld landing also requires some special pilot techniques. Minimum
landing distance will depend upon -A combination of reverse pitch and brakes.
Peverse pitci is as'aally the primary means of controlling landing roll distance. As
,meral rule, if full power is available in reverse pitch, little or no braking will be
req, When less than 50% power is available in reverse pitch, brakes will be
required,, ,,-d special pilot preca :.tions must be taken to avoid blown tires.
"Wheaever any amount of reverse pitch is used, it must be applied while ibh mngine
piiwer USAill relatively high. This means the approach should be made with the
highest ossib)• power requirement. This may result in airspeeds that are on the
uw.,: Tble side of :he power required curve,, Again, this airspeed will usually be
lower ;I'tn the minimum single engine airspeed. The approach may be a coastant
rate (i de•ient (mirror type) or a level approach with a fixed throttle high dip and
flare to touchdown (flap paddles type). The type of approach will be dictated by
\,hF requirement to maintain sufficiently high power for effective reverse pitch
operation and a sufficiently safe airspeed--power--dltitude relatiocMiship to avoid
single engine catastrophe. As soon as the airplane touches down, full available
re,',ers,, powar must be appied. If liose wheel steering is available, the nose wheel
r:,.:tst be held on deci during reverse pit h op <ation. In some short field work
.K ViaN;%Fr instance), re.v"-'sw pitch may be applied prior to actial
kou.. 'hdw'i 'b7,ý tý mique ustially, reqiuire*s an outside observer or L , J JAiii
hit I.IbS*ISe t UX 1-4,
Xl -4

8/12/2019 USN TPS Fixed Wing Performance Theory and Flight Test Technique
http://slidepdf.com/reader/full/usn-tps-fixed-wing-performance-theory-and-flight-test-technique 171/245
TEST PROCEDURES AND TECHTNIUE,_
Pertinent Particulars
a. At the time these tests are performed, the student test pilot should have
completed both the performance and the longitudinal, lateral-directional syllabus
test flights.
b, Determine stall characteristics before conducting low speed tests near the
ground.
c. Ensure that autofeather feature operates properly prior to conducting
actual takeoff and landing tests.
Preflight Procedures
a. First flight required data.
1. Stall airspeed at heavy and light weights.
-. Sawtooth climb infcrmation, Vo, R/CG, H , WR, Configuration, and
Remarks.
3. Sawtooth descent information, Vo, R/Co, Hp W R, Configuration,
Torque, RPM, N
b. Second flight required data.
1. Takeoff data. Configuradtion, V V , tt, t 1 S .lLO N~cLO' p" ' 0
2. Landing data. V , V 1, .onfi.uratiMn RP M0 A 0l O "U ) i~ia~ PA' PA.PA •; I e
3. Pýrepare pilot's data c irk:l•i (sv, ,e ]Figires 3, 4, and 5).
&VA[vW1_

8/12/2019 USN TPS Fixed Wing Performance Theory and Flight Test Technique
http://slidepdf.com/reader/full/usn-tps-fixed-wing-performance-theory-and-flight-test-technique 172/245
FLighjt P1rocedures
First. Flight:
Determine stall airspeeds, airspeeds for berst climb angle and rate of climb,
arnd best approach airspeed and configuration for approach. The airrpeed range for
- ~.,this investigation should be I 'om Vstall to a mideruise airspeed. Configurauion
takeoff should be invesfilgateQý witi LG down and retracted. Power approach
configuration should be mnvestigated with speedbrakes in and out, full flaps, gear
down. At least two constai.)t power settings should be investigated. The most
desirable approach configuration wil 5e one that requires sufficient power to
ensure 'that engine RPM is high, but does not require a power setting that would
preclude successful recovery from a sudden cengine failure, Data must be obtained
at a relatively heavy and a relatively ýýght weight.
Sawtooth climbs and descenits wili use indicated rate of climb or descent in
lieu of a timed climb. Lindicated rate of climb information will be sufficiently
accurate for STOL e~valuation purposes. If refinement of results is required, the
time method could be employed.
The ý-ecornmend 'd sequence of events on the first flight is as follows: ,Vter a
nor'n.al CAkeoff, climb to 7,000 ft If arnd determnine stall airspet.dA in each
c(i.i.ng rati(.n1 br b(- kested. Thim descend to 3,000 ItH and conduct sawtoo h chtohs
and,~ q~s St ari. at the high irjiidand collect data by alternating ,imnbs and
desc'n". Tae to atm frca' 1,si ;ih t itid of 3,000 ft H- and &ensurt-t that data
p
COrded heP t inlý ý; I)loht w ie tht pilot rPStalbhshed e-quilibriumi condit ios
1 ~a~ ~1}~Ii,-Aall 1Ar. ý'peids at 7,000 ft and with wupro xinixite ly
40 1)t tiU ',',1f i~ikt- no-inald lad ing.
X il
0

8/12/2019 USN TPS Fixed Wing Performance Theory and Flight Test Technique
http://slidepdf.com/reader/full/usn-tps-fixed-wing-performance-theory-and-flight-test-technique 173/245
9 Second Flight:
The second flight will be used to determine takeoff and landing distances
and proper pilot techniques for minimum STOL distances. Takeoffs should be
investigated by using neutral stick and then rotating normally at lift-off airspced
by using full aft stick and by using a dynamic lift.-off technique. The dynamic
technique is full back stick at VSTO_10 kt. At this airspeed, apply full forward
stick followed by full aft stick. The effect of cocking the airplane to overcome
initial torque should also be investigated, Nose wheel steering should be used for
all takeoffs. STOL's ar.e not to be conducted with autofeather inoperative.
Takeoff time, distance, and lift-off speed will be recorded.
Landing approach and landing will be evaluated using both flat and descending
appro iches. Reverse pitch and nose wheel steering will be used. Brakes should be
uýc only after thhi landing roll is essentiilly complete. Landing distance, approach
airspeed, touchdown airspeed, and configuration will be recorded.
VATA REDUCTION AND PRES "NTATION
First F ligjht
a C"orrect stall data to indicated stall a.3 peed at one heavy and one light
sta-ndard %--ight.
+ VI~C:: Vi
V -V (
m)i : XV i•

8/12/2019 USN TPS Fixed Wing Performance Theory and Flight Test Technique
http://slidepdf.com/reader/full/usn-tps-fixed-wing-performance-theory-and-flight-test-technique 174/245
b. Correct sawtooth climb data to indicated airspeed and observed rate of
climb at heavy standard weight for heavy weight data points, and at light standard
weight for light weight data points.
V0 + Vic = Vi
t(W C1/2
11/C0 k /C o t(W l/
c. Plot variation of observed rate of climb with indicated airspeed, in
configuration TO at both standard weights (see Figure 1).
d. Determine airspeed for best rate of climb.
e. Determine airspeed for gr ýtest climb angle by plotting a tangent as shown
in Figure 1. The airspeed at the tangent point represents best chrnb angle airspeed
since
mm ~ ir•- = S irl (niaxS\Ii ax ( a
f. Determine whethEr there is any advantage in retractir.g the main landing
gear to c, I o-v,, best clinb angle after takeoff from. an analysis of sawtooth climb
data. Consider operational aspects. Figure Z is an example of results which would
indicate gear should be kept down.
g. Correct sawtooth descent data to indicated airspeed and observed rate of
desicent at 11.000 lb standard gross weight and plot results as shown in Figure 1.
h. Determine airspeeds for mirtimum rate of descent approach and descent
angle at that 0speeed for hotth power setting in vest iga te-d, , - xa mphn
Figure 1.
XI-8

8/12/2019 USN TPS Fixed Wing Performance Theory and Flight Test Technique
http://slidepdf.com/reader/full/usn-tps-fixed-wing-performance-theory-and-flight-test-technique 175/245
i. Plan second flight from test results determined in steps a through h.
Include evaluation of at least two airspeeds and configurations for landing
evaluations.
Second Flight
j. Discuss the most saccessful STOL pilot techniques which you determine
* from these tests,
XI-Q

8/12/2019 USN TPS Fixed Wing Performance Theory and Flight Test Technique
http://slidepdf.com/reader/full/usn-tps-fixed-wing-performance-theory-and-flight-test-technique 176/245
Ws : 13000LBONFIG TO
mAk 4GEAR UP
_ •0 GEAR DOWN
u-J
0 I .
w
(Ix
o v, vx, ×
INDICATED AIRSPEED (KNOT%.S)
0o Ws ; 10,000 L B /
•E ~CON FI G P A
.. J(.) [-Q 3:5 Peiu- AQ ?O2pal
w
r7
(-1
0
Xr0 I
A I ~ APe~'. t~t ir
8/12/2019 USN TPS Fixed Wing Performance Theory and Flight Test Technique
http://slidepdf.com/reader/full/usn-tps-fixed-wing-performance-theory-and-flight-test-technique 177/245
-.of*TOrjOor up
LL.0
4 ~TOgeor down -
I5VMAXT
INDICATED AIRSPEED
Figu.reSamj-Ie Data Presentation

8/12/2019 USN TPS Fixed Wing Performance Theory and Flight Test Technique
http://slidepdf.com/reader/full/usn-tps-fixed-wing-performance-theory-and-flight-test-technique 178/245
41POLA41~~ ciaL,u *.0.41
_ _ _ __ _ _ - GOO=a -- I
W RA~*ALTlk-U4A I u O.*
j Tc
L.2
I)Ci
Fir High

8/12/2019 USN TPS Fixed Wing Performance Theory and Flight Test Technique
http://slidepdf.com/reader/full/usn-tps-fixed-wing-performance-theory-and-flight-test-technique 179/245
7Th.?'.-rr.,,',¶rg;.... . . ...... .
>I tA .f7i7~I I j./t?
.,A i & I
I~ h
I, I
I t
A
7I

8/12/2019 USN TPS Fixed Wing Performance Theory and Flight Test Technique
http://slidepdf.com/reader/full/usn-tps-fixed-wing-performance-theory-and-flight-test-technique 180/245
J'A TA
AlLAL S 1. I
1.A I I
_ 1±U 7I2J..1*1 11
IAF k1*N
1' IIfllS
C dA/
4v _
i _____
t jI
1
1 L
u
1O '* * . . 'I
gur
It 1.1
'A
I.
8/12/2019 USN TPS Fixed Wing Performance Theory and Flight Test Technique
http://slidepdf.com/reader/full/usn-tps-fixed-wing-performance-theory-and-flight-test-technique 181/245
SEC.'flON X11
)E'TE)'ZMYN AflON OF CLIMB SC HEDJL.ES
F"ROM ACCFL,%RAlON, IRUN DATAX
li
8/12/2019 USN TPS Fixed Wing Performance Theory and Flight Test Technique
http://slidepdf.com/reader/full/usn-tps-fixed-wing-performance-theory-and-flight-test-technique 182/245
DATA REflUCrTON PROCEDURE FPOR DETHRMINING GL MB sCf:EDULEs
FROM ACCELERATION R.UN IUATA
GE NERAL
The variation of rate of change of specific excess powc:r or specific energy (P
orn dFh/dt .,t MlvIL thrust at several altitudes was determined fromn acceieration
runs. To ~klterynine &~ limb schedule from these results, the acceleration run data
mut e Plotted in a single graph, faired as a family, and cross-piouttvld Us il, cýf
coustant rate (,1 cliange of P on icoordinates of ýtltitude and airspeed.s
In deducing Ahe a;-celeration run data, corrections were made for nonstandard
airplane weight. h cor,ýections for gross thrust and ram drag variations becau~iý
of nomitandard lemperature were assumed to be negligible and1 were not itade. for
mbanuadl data reduction. If automatic data reduction was employed, these
correction,; were includled. In the preliminary fairing of manually reduced data, it
may bce necessary to consider the effect of nonstandard temperature.
DATA REDUCTION
In the *wceieratiOn run test, the results werte preseit~t-d in the fora, (if
v ~triatiun of P dE 11/dt with Mach nu~mber or C.AS for seve~ral liue.irtr
d ta ro h t ion will orn inence with those- rei'lits.
k- -g ". 1 g2)~apl ,Jw'et. 1PJI, tilt' v ,V it of P with "'A f,11 11
aIit-x' :.l, i ta i o c I00V -. tý I rt VQ'IIfj 11M~i a N Ik lWt it.I it I I A 10
k O 1.c t(I tVv., t r ' iI t-ýI - t.ý k. : l tt O A-1 V
ly wIke t z,

8/12/2019 USN TPS Fixed Wing Performance Theory and Flight Test Technique
http://slidepdf.com/reader/full/usn-tps-fixed-wing-performance-theory-and-flight-test-technique 183/245
.1 ,
a. Warmer than standard ambient Mir temperahtre w-.1 temd. to shift tie cu:.,ues
downward ' relation with those obtaired at staxndard conditions, Th.,.s feature is
more apparent at nigh altitudes.
b. The curves will tend to break downward sharply at the same Mach number.
4'
I 2 A
,/ / 4
M3CH NUMIE-R
Figure I
Specific Excess Powe-r VWcrking PhN
When the taivi 1,,; of the, workiag pZot. iV cormplete,ý LOP" he , fS lesi
-f~tilttp on (-rse fAl wd atld true .+~rxpoeed ks-s bte pn',pi -,M,
Spoc-- ic.f.,• e.',"gy Anaaiyt.-is graph.
It S,, C
Ipk), PS .'' .Ir4-& x , K. iq(uce Ia"
p e ktA :<> vi: xtt~ ~i.t-'
-A.?

8/12/2019 USN TPS Fixed Wing Performance Theory and Flight Test Technique
http://slidepdf.com/reader/full/usn-tps-fixed-wing-performance-theory-and-flight-test-technique 184/245
c.Plot these data as lines of constant P3 on tile Spec(-,fic Energy Analysi'.
Sgrz'ph. Tfhis plot should form a family simailar to 'Figure Z. If inusual bends or
anoinalies occur in~ these curves, refer to the working plot. T ,,e fairing of that data
may be at fault.
,~-CONSTANT ENERGYALTITUDE
/ 6
< dE1,
-MAXIMUM ENERGY
K -MAXIMUM R/C
K~ K4
T AS
is approximately a niaxizn1im rýite of hirn[L,; homdtle. A himw coneti ,hý tht, fichW~ 'tSIL'ýti11.hoi,, te-ý1cj"pe o ir,ý,yheght ý, J , na 7yi, n rgii-yk i ls ( nluc i r hpup'ý,o
hf-Wh it 0 ,IV W h -

8/12/2019 USN TPS Fixed Wing Performance Theory and Flight Test Technique
http://slidepdf.com/reader/full/usn-tps-fixed-wing-performance-theory-and-flight-test-technique 185/245
SECTJIOU XIII
COPUTER DATA REDCTO
lo

8/12/2019 USN TPS Fixed Wing Performance Theory and Flight Test Technique
http://slidepdf.com/reader/full/usn-tps-fixed-wing-performance-theory-and-flight-test-technique 186/245
COMPUTER DATA REDUCTION
ACCELERATION RUNS, CLIMB AND DESCENT PERFORMANCE
GLENERAL
Analysis of level acceleration, climb, and descent data by digital computer
routines is common practice at both military and contractor test facilities. The
Wautomatic data reduction process provides a rapid and accurate method of
obtaining corrected performance results from raw recorded data.
DATA REDUCTION ROUTINE
'Phe data reduction routines used by the NATC Computer Servi2es Division
(CSD) are mathematically similar to the methods described in applicable sections.
The net thrust and indu ed drag corrections are added for level accelerations. Thte
method requires inputs of observed airspeed, altitude, elapsed time, OAT, and fuel
rýmnaining or fuel asc-. L nstram-tnt corrections and positive error corrections can be
aWt matic ally applied frrn : corre.(ion subroutine.. The engine r•ef thru,.
7 '4 ,.,t~iOr', is pro,,iol fey a suhti :ut fnv X0,,,t i. na' ed On ir nI a infac tuit r's dat i.
) A TA WP UT
Pc11oiut err-tor '-roito'A for ea,.i ty)C ,,i0,'plAm- toust be S#,!U i (")
4.

8/12/2019 USN TPS Fixed Wing Performance Theory and Flight Test Technique
http://slidepdf.com/reader/full/usn-tps-fixed-wing-performance-theory-and-flight-test-technique 187/245
AIRPLANE TYPE Bu~o
(TYPE INS'FRUENT)/ (DATE OF CAL) (TYPE INSTRUMFNT)/ (DATE OF CAL)
OBSERVED INSTRUMENT OBSERVED INSTRUMENT
INST READING CORRECTION INST READING CORRECTION
Fig•ure 1
Sample Format for Instrument Calibration Submission
A performance data sheet for each acceleration run, climb, or descent must be
submitted in the format shown in Figure Z. Data should be recorded every 4 sec
(every other frame) for acceleration runs. For climbs it should be recorded every
4,000 ft (Z,000 f, above 30,000 ft) or every 2 min, whichever comes first. For
descents, record data every 5,000 ft. The elipsed time (A0t is from start time (1)
and should be measureed in minutes and seconds.
Prior to submitting data to CSI) for processing, a rough plot of V vs. time foro
acceleration runs or average rate of climb (or descent) vs. altitude for c limb. or
de'.c('nt ) should be miude to ensure you are su'jmittting your data correctly. Any
(such t(.s)account for climb intterruptt i will e it mediattclvSwr(ýss o•*rrors ( Ih -S'fallingn
(ibViL l•ur,'0 these plots and Lo1e,( e'ssary titne delays will be .oc•.lcI.
Xii

8/12/2019 USN TPS Fixed Wing Performance Theory and Flight Test Technique
http://slidepdf.com/reader/full/usn-tps-fixed-wing-performance-theory-and-flight-test-technique 188/245
AIRPLANE TYPE BuNo
PILOT DATE OF FLIGHT
Standard Gross Weight
Start Gross Weight (fuel used counter)
Empty Gross Weight (fuel remaining system)
Operational Weight for Climb Intercept
Counts Per Gallon (6.8 lb/gal)
t V0 N Fuel used or O Fr Fuel Flowmin (kt) Po Fuel remaining (0C• gpui. or pph)
+ seconds (counts)
Figure 2
Sample Format for Computer Data Submission
DATA REDUCTION AND OUTPUT
After both data sheets (Figures I and Z) have been completed, these sheets will
be deivered to CSD. Punched cards are then prepared by datb reduction personnel'
these cards arue used for computer inputs. After the computer is programmed and
th, data reduction is completed, the results will be printed out automatically. The
r,'i:ults will be presented in tabular form and will be plotted automatically. A
typik al automatic plot is show., in Figure- 3.
it,

8/12/2019 USN TPS Fixed Wing Performance Theory and Flight Test Technique
http://slidepdf.com/reader/full/usn-tps-fixed-wing-performance-theory-and-flight-test-technique 189/245
1,3u.Q01
100.00. Al 1
5 6
I 5W80.00.a
W
20.00.1,0. O0
0 ..24 0.32 0. 0 0. 48 0.56 n.64 0_7P 0 00 0.86
• , AV MAC ,
S~Figure 3S"Typical Computer Printout from Accel Run
•;: NOTATIONS
"• The notations used in the CSD data printout axe,.
I ~ ~HPO (b.•vdAlItitideý--,'e
i• tPI (criected for Instrurnent Error F- c:t
,PA I ." ~ • ? ' e s r " f r o m I . l b s 'f -
SVO Obse~rved Airsp•te.-l - knots - V4

8/12/2019 USN TPS Fixed Wing Performance Theory and Flight Test Technique
http://slidepdf.com/reader/full/usn-tps-fixed-wing-performance-theory-and-flight-test-technique 190/245
Vi - Corrected for Instrument Error - knots - V.I1VC - Corrected. for Position Error - knots - V
C
QC - Impact pressure from V - lbs/ft2
c
QCI - Impact pressure from V. - lbs/ft 2
I
OAT - Outside Air Temperature -0 C or F
TI - Corrected for Instrument Error
MI - f (qC./p)a.I I
MACH f (q c/Pa)
TA Temperature Ambient in "C
TAS - Temperature for Standard Day in C
DT -T -T Ca aS
VTS - True Airspeed for Sta.•dard Day - V,S
V r True Airspeed for 'rest Day - VTt
SRT' (TA/TAS) - Square Root of T a/Ta
F,,T Observed Fuel 'eruptr tur..
FAT - ( orrec-ted foxr Instrroinent Error
WF bse'rv,-l Fuel Ft"ow
WFI (7()rrutt-d for Instruam(ent Error
E UEl. (' N O-herv ed fuel used ()r fuel reirnaining (. s on tlbs)
F'1 ( ()rre( te(i for InstrumLent Flrý,i
-- UE1. (N L.B Fu'el •mio it,'r ,mivtC ,-. t'I
IW T t r)( w ,ight Pt ' ',i l-A
I ItN[)I xvt'ef thI RP•0'1. ng
SRPN•I: '~~t(ir,,,¾(Id br lii';truo); <it rett¢r

8/12/2019 USN TPS Fixed Wing Performance Theory and Flight Test Technique
http://slidepdf.com/reader/full/usn-tps-fixed-wing-performance-theory-and-flight-test-technique 191/245
RPMC - Corrected for Tachometer Error
DFN - Thrust Correction - AFn
DRiC I ( V,Vs x 101.3)/Wr,
R/CO - Observed rate of climb
(COSO)SQ Cosine of the climb angle squared
" - Lift Coefficient
2 2(B) SQE Wing span2 x Efficiency Factor (b e,
WS Varying weight standard calculated for fuel used
or constant W
DR/C b69877 .0 x VPs x COS 2 x (W 2 - WT2) induced draq1 -2e V correction
t, x PaX VTS X
RC/S RCO + (I)RC 1 DRC Z2) S
AV HPC (HPC HI"TC ) Sn + 1
RCSW RC/S x (WT/WS) DR/C 2 . weight correction
Z
8/12/2019 USN TPS Fixed Wing Performance Theory and Flight Test Technique
http://slidepdf.com/reader/full/usn-tps-fixed-wing-performance-theory-and-flight-test-technique 192/245
SECTION XIV
"IPS AIRPLANE DETAILS
AS

8/12/2019 USN TPS Fixed Wing Performance Theory and Flight Test Technique
http://slidepdf.com/reader/full/usn-tps-fixed-wing-performance-theory-and-flight-test-technique 193/245
AIRPLANE DETAILS
XIV- Z T-ZC
4 TA-4J
6 T-38A
8 A-7C
10 OV--1B
mvl
.- t in a, ,W, nla•ra 4.wwrt .$.i '•' 'fM ', .if 'V

8/12/2019 USN TPS Fixed Wing Performance Theory and Flight Test Technique
http://slidepdf.com/reader/full/usn-tps-fixed-wing-performance-theory-and-flight-test-technique 194/245
MODEL T--ZC AIRPLANE
GENERAL
Loading Condition: Normal Trainer (one or two pilots)
T.O. Gross Weight: Approx 13,180 Ib
Standard Gross Weight: 11,Z00 lb
Fuel Capacity: 696 gal/4,700 Ib JP-5
Wing Span: 38.1 ft Area: Z54.9 ft'° Aspect Ratio: S.07
POWER PLANT INFORMATION
Engine: Two J85-GE-4
Ratings:
Co:~ii tior. Desiq•n Static ,'P.. lax 1GSL Thr.ust
(uninstalled-l >)
MIlL 2,950 101 .7 732
(per engine) max.rum
CONFIGURATIONS
Cruise (( F)
Landing g iar and flapit UP, mpt. edbrakei CLOSEDu, thrut for level flight at
,+~ ~ p , , +il~~)~~j ~I
w.,e. .
8/12/2019 USN TPS Fixed Wing Performance Theory and Flight Test Technique
http://slidepdf.com/reader/full/usn-tps-fixed-wing-performance-theory-and-flight-test-technique 195/245
.. .~. ... -.
Glide()
Landing gear and flaps UP, wpeedbrakesCLOSED, Idie thrust.
Power Approach (PA)
Landing gear DOWN, flaps FULL, speedbrakes EXTENDED, thrust for lewm\.
flight at trim airspeed.
Landing gcae DOWN, flap5 FULL, .-peedbrakes EXTENDED, Idle thrust.
W&ve-off (WO;,
Landhng geir DOWN, flaps FULL, speedbraken CLOSED, MIL thrust.
Takeoff (TO)
Landing gear DOWN, flaps IiZ/ speedbrakes CLOSED, Mi1 thrust (takeoff
trRiki
A%irwii& . . k~N It

8/12/2019 USN TPS Fixed Wing Performance Theory and Flight Test Technique
http://slidepdf.com/reader/full/usn-tps-fixed-wing-performance-theory-and-flight-test-technique 196/245
MODEL TA-4J AlIRPLANE
GENERAL
lmte na *Fuel Capacity: 660 gal/4,490 lb (JP-5)
T..O. Gross Weight. Ap;rox 18.,000 lb
St&ndard Groxn Weight: 15,500 lb
POWER PLANT INFORMATION
Engine• 1,r.tt anrd Whitney J-5.-P6A/B
Coodi Lioll Desiqn Static EGT
SL Thrust
(uninstalled)-1b 0 C
AlL 800 97-100 610
.14 40,- 3 590
Engine: Pratt and Whitney J--S - P--8B
(L t oll i:;at iC IIh tu s t'
CO',t)NFbIGUR<A TIO)N S
A IIAX I A 0;cv
(!.4eUU

8/12/2019 USN TPS Fixed Wing Performance Theory and Flight Test Technique
http://slidepdf.com/reader/full/usn-tps-fixed-wing-performance-theory-and-flight-test-technique 197/245
Power (P)
Landing gear and flap:i UP, xpeedhrakes CLOSED, MIL thrust.
Glide (G)
Landing gear and flaps UP, speedbrakes CLOSED, Idle thrust.
Power Approach (PA)
Landing gear DOWN, flaps FULL, speedbrakes EXTENDED, thrust for level
flight at trim airspeed.
Wave-oft (WO)
Landing gear DOWN, fiaps FULL, speedbrakes CLOSED, MIL thrust.
Takeoff (TO)
Landing gear DOWN, flaps 1/2, speedhrakes CLOSED, MIL thrust (takeoff
Ltrim).
N

8/12/2019 USN TPS Fixed Wing Performance Theory and Flight Test Technique
http://slidepdf.com/reader/full/usn-tps-fixed-wing-performance-theory-and-flight-test-technique 198/245
MOI)EL I-38A AIRPLANE
GENERAL
Loading Condition: Normal Trainer (one or more pilot.)
T.O. Gross Weight: Approx 12,000 lb
Standard Gross Weight, 9,950 lb
Fuel Capacity: 583 gal/3,750 lb (JP-4)
Wing Span: Z5.Z5 ft Area (S): 170 ft Aspeet Ratio: 3.75
POWER PLANT INFORMATION
Engine: Two J8S-GE-5
Ratings:
S,;(.,U•dcl t ic-11 I),..i X.t•,1'xi1, IMIZ , i1. 'ihru,;t/l:nqine Steady State
S(uninstal lc,/ Gi
jlstdlled) l1j
SiA.i ,.~/J3 V,•O, "- )U 645 9.
(: ONFIGII ATIO)NS
Cruisie ((-R)
Landing gear and flaps UP, ;predbrakes CLOASED, thrus.t for level flight a•t
trim Airsp.cl.
• YIV .L

8/12/2019 USN TPS Fixed Wing Performance Theory and Flight Test Technique
http://slidepdf.com/reader/full/usn-tps-fixed-wing-performance-theory-and-flight-test-technique 199/245
N wr•:•.... r-T'•¸.' "- .. .. , -,.. • u •..•••... ..••........... Tr'- r- 'v ' , - - , .. .. '," -',rT. r r
Combat (CO)
Landing gear and fIAps UP, speedbrake.s CLOSED, MAX A/B thrunt.
Glide (G)
Landing gear antd flAps UP, spe'db•akets CLOSED, Idle thrust.
Powe'r Approach (PA)
Lan|inag gear D)OWN, flaps 100"o, spve(e-hrak,.s CLOSE:D, thrust for level flight
iat tnr , airsped.
l.wand'ng -,&,r DOWN, flaps 100", speedbrakes CLOSED, Vdle thrust.
) Wave-off (We)
Landing gtear DOWN, flaps 100%i,, spe-cdhbrkes (CLOS1E), MI . thrust.
Takeoff (170)
landing gear DOWN, flaps -00'o, spjIdbrakes C I. ISEL), MAX A/B thrust.
\ i

8/12/2019 USN TPS Fixed Wing Performance Theory and Flight Test Technique
http://slidepdf.com/reader/full/usn-tps-fixed-wing-performance-theory-and-flight-test-technique 200/245
MODEL A-?C AIRPLANE
GENERAL
Internal Fuel Capacity: 10,17Z lb/1,496 gal (JP-5)
-r.T.O. Gross Weight: Approx 29,500 lb
Standard (.1ross Weight: 26,000 lb
POWER PLANT INFORh'MATION
Engine: Pratt and Whitney TF-30-1P408
Condition Design Static xr M EoGT
I SL Thrust CI ~~(uninlst alled) -lb]
C o N 16 JRAT(ONS
Cruise ((,A)
.ndn ,,g- And flAl)pN UP, speedhrakkes (CLOSED. thrust for 'evel flight at
trihv airspet-ti.
:'•LJ•~~~~.. .............. ...

8/12/2019 USN TPS Fixed Wing Performance Theory and Flight Test Technique
http://slidepdf.com/reader/full/usn-tps-fixed-wing-performance-theory-and-flight-test-technique 201/245
Landiug gear arnd flaps; UP,- sp-edhrakes C LOSED , Idle- t hrust
Power Apzn'oach (PA)
ithndinjy gear D)OWN, flaps FULL, speedbrakt-s CLOSED, thrust for 'evel flight
(or 3 deg glihe slope) at trim airspeed.
Wave-off (WO)
Landing gp,'r DOWN, flaps FUI., ,p-,,dbrak-s ('CLSED), MR, thrust.
Takeoff (TO)
Land&mln ge ir DOWN, flaps 25 dt-g, specdbrakes Cl.OSED, MII. thrust (takeoff
trim).
\ I ~:,

8/12/2019 USN TPS Fixed Wing Performance Theory and Flight Test Technique
http://slidepdf.com/reader/full/usn-tps-fixed-wing-performance-theory-and-flight-test-technique 202/245
MODEL OV-IB AIRPLANE
GENERAL
Loading Condition: Normal Observation
T.O, Gross Weight: Approx 13,300 lb
Standard Gross Weight; 1Z,500 lb
Fuel Capacity: (JP-4) 1,930 Ib (no external)
3,880 lb (internal and external)
Wing Span: 48 ft
POWER PLANT INFORMATION
Engine: Two Lycoming T-53-L-7
Ratings:
o- , 1 I.0 1n S I11 Zr • EI V I .L,
MIL II I I'
J ,rin,'ot 1,1(,(lCI) t,7t n v}Jl~ax jti X ji01.:,
{'.;.fr*-n oin TO and MIL r.' in throttle dt'teit .)Mlv. Filve mnir mam ,)peration in*
TO,) W min inx operation in MAP..
C NFIGUP rTi)NI)
mH la sl fia)Ll,

8/12/2019 USN TPS Fixed Wing Performance Theory and Flight Test Technique
http://slidepdf.com/reader/full/usn-tps-fixed-wing-performance-theory-and-flight-test-technique 203/245
Power (P)
Landing gear and flaps retracted, MIL power.
Glide (G)
Landiiig gear and flaps retracted, flight idle detent, min RPM.
Power Approach (PA)
Landing gear DOWN, flaps 45 deg, max RPM, torque as required for level
flight or fixed as required.
Landing (L)
Landing gear DOWN, flaips 4 S kt'g, niax N'PM, Hlight idle detent.
Wave--off (WO)
Lantling geatr Dt )W N, fla'tj~ -1 ki ) () poe
Takeoff 10)
L~anhng g",r ld) WN, fltp 1') d,.g, 1I jw .r, IrmtL i deg, NO), ` detg Hw'I),
5 (eg NHZ
-- , I

8/12/2019 USN TPS Fixed Wing Performance Theory and Flight Test Technique
http://slidepdf.com/reader/full/usn-tps-fixed-wing-performance-theory-and-flight-test-technique 204/245
SECTION XV
COCKPIT EVALUATION
_m=• _•.r : • • • -'¸ , • • . . . .. :,r : , • • . .• • • • , 7 , - • • . • • • • ••: • - • • -• ,• • • •

8/12/2019 USN TPS Fixed Wing Performance Theory and Flight Test Technique
http://slidepdf.com/reader/full/usn-tps-fixed-wing-performance-theory-and-flight-test-technique 205/245
REFERENCES
Section XV
1. Anthropometry of Naval Aviators, 1964, NAEC-ACEL--533.
2. Cockpit ArAthropoinetric Survey of Mtodel A-4C, A--6A, A--TE, AV-8A, F-4J,
-- 8D, and OV-1OA Airplanes, ST-1ZOR-71.
3. Investigatien of A-4 Aircraft Escape System Clearance Envelope, ST-53R-7Z.
4. MIL-STD-147ZA, Human Engineering Design Criteria for Military Systems,
Equipment, and Facilities.
5. MIL-A-8806, General Specification for Acoustical Noise Levels in Aircraft.
...
gI
i"I

8/12/2019 USN TPS Fixed Wing Performance Theory and Flight Test Technique
http://slidepdf.com/reader/full/usn-tps-fixed-wing-performance-theory-and-flight-test-technique 206/245
C'OCKPlT IiVALUAToiO
INTRODUCl~TION
The trot r O1titn a Coc~kpit avaluatiton At TI'S is to &CqualtIt 111(
istuihnt with tho evaluation of human ongignooring dvaign requiremoonts as rolateil to
aircraft t~atftng BncAuse the cockpit in the focal po~int of tho moan-mochine
ant~nfaro, It is the aroa which should roceive rnaxinum human engin~ering dosign
emphasis. Utitorttintately, many Ind~vidual cockpit itoms recolvo little or 11.
vnprl concerning humnan ac' mdtint.r c-otxip&ttbility. It is often not until
All cockpit Itenix Are Anxtmbed into a mockup or actual cockpit dtiring design %mnd
te~sths evshimtions that hmiimainoineering dosign kieficient-ios be-cotu Idontifiabke.
Not titil tho working r"lat ionahipw of cotrolhi, dIisply., lightinia. And cockpit
onvironment Are analyired cmi An intoligent evalwi-o~ r.n i-otkwteI 1Regardieass if
itrln pofrmnt mid flying~ kiAmli y po tential. hri in~.tn in hr. c~ockpit mulot
&cz~oniplish the frm~taifrr ftu-t omv of t'hsmiinM alrplane poteontidl into rtesli ty.
lImprtant var'lAbler. whichl vt'onrol thl~ii trinsfir function Are (1) capothili ties and
kiniNmt t ioin of the ~iv iator 4110 U1 the ý.ockpi t dtesign which 1,. the link bet weon
a4 tov '%n rv'ut iot) perlotrivitA by the p~ ot tua mtilt of ainform ~t iom rrct ive't Avid
1'6v i-irnerrv irplavie mbskistb nimait kr cmjiiinpat~igo Oturi n hkno vvrjinevrinbt
evan t ton. A41d io -ly. "w orpt caisr& kovoztt uwct br k-minsHred~ -cit'l 4M d~a
Ihv, mk~ g mnllfriil prink ipie' to' ko ' miw wht pt--r m ltg
vV.-1118t, n 'w on vp w:vd n' o .Wt'"

8/12/2019 USN TPS Fixed Wing Performance Theory and Flight Test Technique
http://slidepdf.com/reader/full/usn-tps-fixed-wing-performance-theory-and-flight-test-technique 207/245
to evalu~tekt item's siuch as cont rid avidi dis~plays from~ a very nub ectlve. viewpoint,
i~e., flU? own) 4apn1bli ties, Iimititiotns, mid ebpbr I he fact tchat pilots are, il
dl fieretit atust be thoroughly unultrstood wh-xn evaltuating cockpits,. Test pilo~ts, in
particular, aret perhaps 7iot always entirely objective when ia oe to admnittinq
thot particular human engineering dimsign deficiencies are a problem as far as the'ty
are concerned. The following differences are amiong the mocst imnportanit in c~ockpiit
evale'ut ion.
AN11PIOPOM E'1RY
Body sizes vary (onsiaterably. Reference I is a compilat inn of 96 body
dimensions biased on measurerments oif ],'A4) Nava Av 1s he daita wre preseiited
in inches an(i centimetetrs as woll ats pu'rceiitilt's.
Ovtiail atirplanco' spiec ificait itns generally rtetiuire that cockipits ac~ oae5th
through 95th percentile size~d a vial otturor older airplanie cockpits and cre~w stat ions
(prior to 1970) arid 3tIrd through 98th. percentile lbe arckinn moda ted hin ne~wer
cockjpits (since 1970). It i'seniera iy a~i5'i.riti t at if int s body meitasuremen(rts, stcicl
ats height ant weight .art- -0th poruntil iverigo) tht all is dlwuerniiowi will be
S0th percen iti; this is ot true. Unliiform ity in Oody huivaxiious is very rdr, ; e.gy it
Ali (hotbt in t hat it a pt'rson's sit t ing -ye loheigh t is 04 )h pe'rceniht thlat )it's Wlui-OOt NAl
reach will a)4so bt 7Gth pe- etIt it mlua raumt tO know one ii' owýu pewrcezntileý-
ranks of body dimwtenitmfis,
I'~s.hg a)6. ' lirl othr)fec~tipi ihIii
8/12/2019 USN TPS Fixed Wing Performance Theory and Flight Test Technique
http://slidepdf.com/reader/full/usn-tps-fixed-wing-performance-theory-and-flight-test-technique 208/245
1. Total sitting height.
2. Sitting eye height.
3. Sitting shoulder height.
4. Bideltold diameter (shoulder width).
5. Functional reach (grasp btween thumb and forefinger).
6. Fingartio reach (Cptxh-buttun" reach with extended forefinger).
Only by knowing your own vaLious perce.tile ranks can you make relative
judgments a3 to the overall anthropometric accommodation of a particular cockpit;
e.~g, if you know your functional reach is 35th percentile and th.at yoa cannot reach
a particular control when fLlly restrained, you therefore know that anyone with a
functional reach less than 35th percentile, when fully restrainedi, also cannot reach
the control.
Equipments exist which can obje'tively measure anthropometric pA-ametera
Ssuch as reach .istances, angles of vision, and ejection seat iýgress clearances
"E~gre•.e cleanre" ývý ejoction cockpits are often jeopardized when
modifications wuch ao cameras, control boxes, or other equipmentrý are added to
Scanopy raiils glare shlelds, etc. Htuman e~gineering persokmet are prepared to se
particuiar equipments to attain quarititative data in cockpi' anthropometry
N NOT"E: It 13 crticml:a thAt the- ir3. Teu["e Pof~t4,on (OI')UP bo thr ,ýoanre (A
re~ ~JVeh)Ct:for afl po Vi evabit °IA EP jis th* p~i n A,ace
where the pfuo A l bhoui 4, gfo ý,, i i-%pby.i t,-d e:.dequ 1.'t
XV

8/12/2019 USN TPS Fixed Wing Performance Theory and Flight Test Technique
http://slidepdf.com/reader/full/usn-tps-fixed-wing-performance-theory-and-flight-test-technique 209/245
vision. To further define the DEP, other prolininary dcfhifnLiozne are In order
and are prese"nted below.
a. Seat Reference Point Js a center line intersection of the seat back tangent
line and seat surface.
b. Neutral Seat Refercnce Point {NSRP) it the locatlon of the seat reference
point when the seat is adjusted to the mid-point of vertical adjuati-ent; e.g., with
5 in. of vertical seat travei available, the seat would be adjusted to 2.5 in. above
-.he lower limit.
The DEP is then defined as the point in space located at the sitting eye height
dimension ot the 50trt percentile average aviator (31.5 in.) measurwed vs-tically
above th- NSRP and 13 in. measured horizonta.ly forward of the seat back tangent
line. All anthropometric evaluations must originate at the DEP. Whatever the size
of the indididual evaluating items, such as control reach, display visibility, or
cockpit space acczt modation, the sent must be idjusted to place his eyes at the
DEP. The necessity of a.djusting the eyes to the DEP when mahing anthropometric
evaluations is wre*. cri ical xnuw than ever with the hnc -esr-g eznphaMs on
head"s-.up displays •. d ut4- o)pt.ý &x devico• wlhich tequire sirict adlierence tou
As with ali huinmani' •-aineeriag tahoitions, art hropo tnetr'y :nasi be chechrked
"ax*6ina " ,,vorst Cfudi tinsAn t-dxafile of a ~ cam'"~vof.'(1 ;r Nkmh bt.Qld
ae cri ticiu fonv n sti' &I- Owur~~un v stores jvth~tll)u v bcn hilly
miaie : dw dr ýt hdi u; wo
.. 4~t ifu•,,itch

8/12/2019 USN TPS Fixed Wing Performance Theory and Flight Test Technique
http://slidepdf.com/reader/full/usn-tps-fixed-wing-performance-theory-and-flight-test-technique 210/245
xddAtional items of ,nthropometric doficiency include insufficient sitting
height, inability to reach ruider pedals or foot controls, inability to fit through
emergency egrean openlngs, etc.
CONTROl. DESIGN
Contiols must meot various criteria to be satisfactory; these criteria include:
The criticality of control function establishes the priority of location
within a crew station. The most important controls should be the easiest to reach
and manipulate. Controls should never be located such that the hand or arm
manipulating the control is mn the line of sight required to see the display effect or
setting of the coatrol,
Z. Natural Direction- of-Motion Relationshipls
Actuating controls such as toggle switches forward or up shouid turn
system.- on- Turning rotary controls clockwise should increase system output,
Standard direction-of -motion relationships should be adhered to in cockpit control
actulation-
3.hae odng
C.ontrols which may require mt, iptilation without direct visual monitoring
should feel different to the touch if they are niear controls of dissimilar systenms.
4. inadvertent Actuation
IUvtrlshich h.e A( tivntt- inrvrectI should ce, designed to prevect
,• , ,k tivatk-m Z-ithe~r by n.: nk-, crm<:+irtttry or mnecharnwtal g~uawtla% e-.xI, forward
WW14-l•-+ e•e+-t. Atttkiati n (tllring ,+p0)st I g! ht reg~ime's whiol w•mud het+•ll •
"dtcamogiu~g t" ftirplarie' 'neht k0,~1 it' ctially c% icnthe~rci ally jirevteuctotl-
SX~ : -

8/12/2019 USN TPS Fixed Wing Performance Theory and Flight Test Technique
http://slidepdf.com/reader/full/usn-tps-fixed-wing-performance-theory-and-flight-test-technique 211/245
Care should be exercised in determining propt- safeguards to prevent
inadvertent actuation of controls, switches, etc., which might be actuated by flightclothing or items of personal equipment, such as survival vests, flotation devices,
anti-exposure garments, etc.
5. Actuation Feedback
Controls should have proper tactile cues relative to actuation, One should
"feel" the click of a toggle switch or push button without necessarily hearing it.
Controls should have the proper resistance and range of displacement as specified
by Reference 4.
DISPLAYS
The content and format of displays should be limited to essential information
but should not require mental computation or translation to be usable. There must
be provisions within displays to alert an operator to display failure if tho fAilure is
not immediately obvious.
The location and arrangement of displayn shall be assigned priority relative to
importance for normal and emergency operations. Other criteria, such as viewing
distances, grouping, ;nd transilluminated display requirements, are specified in
Reference 4.
LABELING
items of esiuipment which must be identified, manipulated, or located Should
be adeqtuately labeled to permit efficient haman perfozinance. BlueprH'ts which
*, ustrate control panels often portray a ttratght- n,-viewo Howe-ver, when the.
ccnr-troi panel is in4talled in at ockpit, it is often offset from direct line of Aight,
The three ditmensitonal r - f °, 8 ht offset oftatn re-tult, in iaheln (nu mbers, ()N/()F
XV-1

8/12/2019 USN TPS Fixed Wing Performance Theory and Flight Test Technique
http://slidepdf.com/reader/full/usn-tps-fixed-wing-performance-theory-and-flight-test-technique 212/245
legends, or other nomenclature) being obscured by the very controls to which they
are related.
It is important to evaluate abeling legibility in low ambient light (dark)
conditions as well as in daylight. If an item must be labeled for normal daylight use,
it should be legible at night.
"ENVERONMENT
Heating, ventilation, and air conditioning shall be evaluated and compared with
the criterion specified in Reference 4 or in the applicable specification listed in the
detail specification of the airplane being evaluated. Hand-held instruments aze
available to measure temperature as well as relative humidity. Specifications
generally require an Environmental Control System (ECS) to maintain between 60
and 80OF ambient temperature in a crew station and 10 F maximum differential
between head i4nd foot level.
Interior ambient air should also be sampled throughout the flight regime or
mission profile of any aircraft. Carbon monoxide or other toxic fumes can be
potential hazards, particularly during operations such as taxiing downwind, gun or
rocket firing, and during refueling operations when directly behind a tainker.
Noise is the most serious and persistent problem among those associated with
aircraft environment. The maximum allowable noise limits relative to aircraft type
a-e described ir Peferenc-e S. It should be recognized that high ncise levels of less
inter'sity than thos. •peuifind as physically d Rniaging to hearing can produce hu, an
fatigue and degrade' an ,avia or'• •'ffectiveiiews.
FV

8/12/2019 USN TPS Fixed Wing Performance Theory and Flight Test Technique
http://slidepdf.com/reader/full/usn-tps-fixed-wing-performance-theory-and-flight-test-technique 213/245
As a project officer, you shculd evaluate am 'lent exterior noise which
ma~intenance or deck personnel are exposed to as a result of being; :n the immediate
vicinity of the aircraft during ground operations. Maintenance personnenl often
neglect the required ear protection because hearing losn is a slow insidlous >process.
Various levels of instrumentation are available in evaluatlag the acoustical
environment ranging from small pocket sized decibel meters to sophisticated type
recording devices that record noise samples which can be analyzed in detail for
various frequency bands.
NOTE: When conducting an interior noise survey, exercise any additional
equipments which may increase the acoustic level, such as air conditioning or
defogging systems, heater blowers, ambient air 'ents, and the extended
configuration of in-flight refueling prusbus.
LIGHTING
A concerted effort in the evaluation of cockpit lighting usually identifies
numerous lighting deficiencies. Often there is little emphasis on. lighting ex-alua-
tion. Typically, during u•ight flights general lighting observations are made by
crewmen who are busy flying or conducting other airborne tasks, thereby
overlooking namerous liphtinv deficienci-s.
A particular procedure which has been effective in static"Righting evaluation is
diestiitbed lbeiuw.
I. G et into the airplane a'thted in the c-mplete complitmen of pruper 11Pght
laot hing and Ž(IIuipime it (take ia tape recorc'v r with yo I)
: •. .<'-r9
8/12/2019 USN TPS Fixed Wing Performance Theory and Flight Test Technique
http://slidepdf.com/reader/full/usn-tps-fixed-wing-performance-theory-and-flight-test-technique 214/245
Z. Have the canopy covered with an opaque cover preventh.g any ambient
light from entering. Thi9 allows you to conduct the evtluation day or night.
3. Have ele,_ctrica, power supplite to the aircraft to enable interior light
actuation.
4. Adjust your seat to place your eyes in the design eye position (or where you
normally fly).
5., Allow your eyes to become adjusted to the dark (10 to 15 min).
6. Begin by lccating the auxiliary light (if you can find it in the dark) and see
if it i suitable forminimum illumination if all other lights were lost.
7. After the auxiliary light evaluation, sy-stematically exercise all light
controLs in the cockpit. Vary the intensity, look for instrument lightz on a
particular rheoatat which extinguish before others when adjusting from bright to
OFF. Look for brightness imbalmace such that, at a given light adjustment, soine
instruments may be too bright or too dim when riost other instruments on that
particular lighting control are at a reasonable intensity. Identify mny glare or
reflection wihich might possibly be shielded.
8. Verbally record on your tape recorder any deficiencies nouted,; this ailows
evaluation uninterrupted by tu.rning on floodligh•t.• or flashlights to write down
4eficiencies which in turn would require ireadjutstmentnt of the eyes to low ambient
light.
9. Adjust your seat to various positions to determine it lighting is sufficient
throuAghout a typical c-mge of particular eye iocatiori. This may be Ome of the few
times yoU eVa.lual fikighting strictly for its own sake. Týý'ake as much timtits ik
-'2quired io eva)oate at ligf ir 8 v-r ott I egibiitycf labelm, visibibtly ul
S~XV 10)
; • :*,n•i•:• • r~l ,• tt i , • • , •,K-r. . ... . .. ..

8/12/2019 USN TPS Fixed Wing Performance Theory and Flight Test Technique
http://slidepdf.com/reader/full/usn-tps-fixed-wing-performance-theory-and-flight-test-technique 215/245
SPECIFICATIONSI
A partial listing of Human Engineering Specifications is listed below which
may be of assistance in establishing Military Specification noncompliance.
MIL-STD-1472 Human Engineering Design Criteria for Systems,
Equipment, and Facilities
MIL .STD-203E Aircrew Station Controls and Displays for Fixed
Wing Aircraft
MILRSTD-Z50C Aircrew Station Controls and Displays for Rotary
Wing Aircraft
MIL-STD-411D Aircrew Station Signals
SDZ4J Vol. 1 General Specification for Design and Construction
of Aircraft Weapons Systems, Fixed Wing Aircraft
SD24J Vol. Z General Specification for Design and Construction
of Ai craft Weapo is Systems, Rotary Wing Aircraft
-

8/12/2019 USN TPS Fixed Wing Performance Theory and Flight Test Technique
http://slidepdf.com/reader/full/usn-tps-fixed-wing-performance-theory-and-flight-test-technique 216/245
APPENDIXES
4'ii

8/12/2019 USN TPS Fixed Wing Performance Theory and Flight Test Technique
http://slidepdf.com/reader/full/usn-tps-fixed-wing-performance-theory-and-flight-test-technique 217/245
APPENDIXES
I. ICAO Standard Atmosphere Tables
U. Compressibility Correction
MI. Airspeed - Altitude - Mach Number Crossplot
IV. Mach Number - Indicated Temperature - Recovery Factor - Ambient
Tempera ture
V. Centigrade .- Fahrenheit Temperature Conversion
V1. Calibrated Airspeed - Energy Relations
VIU. Static Pressure versus Pressure Altitude*
VIII. Impact Pressure (qc versus Calibrated Airspeed*
* C
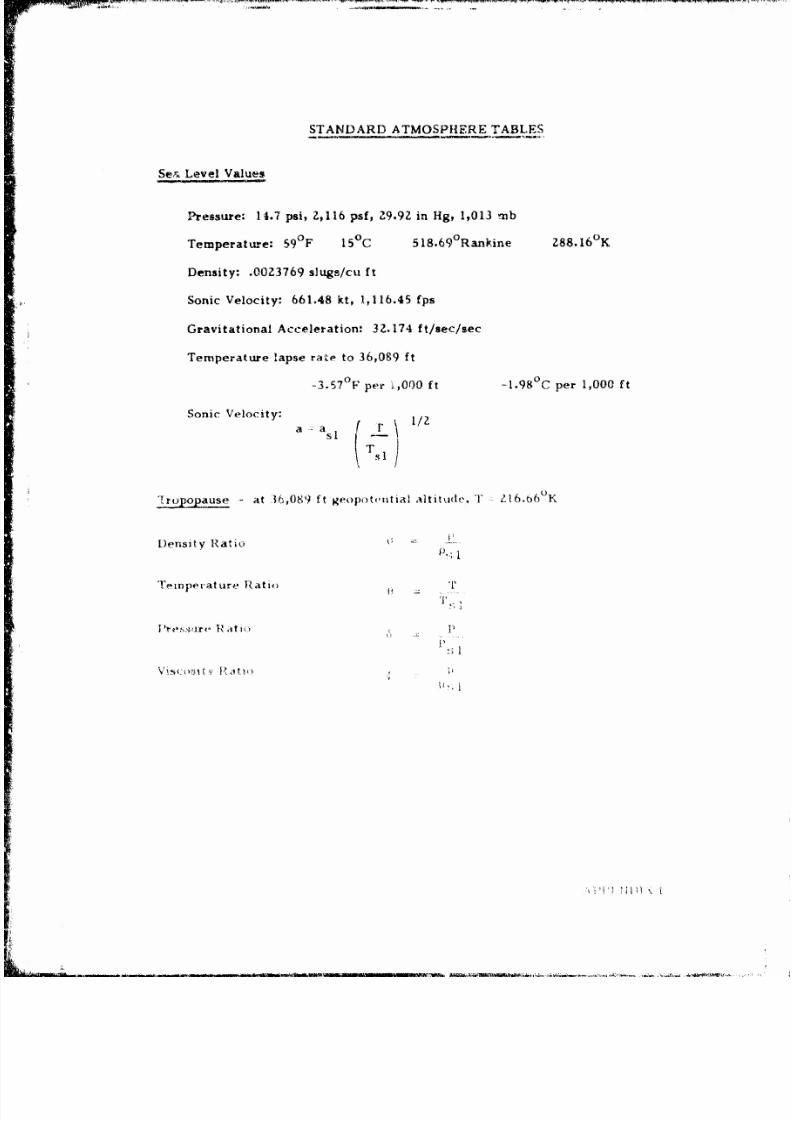
8/12/2019 USN TPS Fixed Wing Performance Theory and Flight Test Technique
http://slidepdf.com/reader/full/usn-tps-fixed-wing-performance-theory-and-flight-test-technique 218/245
STANDARD ATMOSPHERE TABLES
Ser, Level Values
Pressure: 14.7 psi, Z,116 psf, Z9.9Z in Hg, 1,013 m-b
Temperature: 59 F 15 0 C 518.69 0 Rankine Z88.16'K
Density: .00Z3769 slugs/cu ft
Sonic Velocity: 661.48 kt, 1,116.45 fps
Gravitational Acceleration: 3Z.174 ft/sec/sec
Temperature lapse rate to 36,089 ft
-3.57 0 F per i.,000 ft -1.98 0 C per 1,000 ft
Sonic Velocity: a La\-1is
-ro.pause - at Th,089 ft geopotertial altitkide, T ý16.66(K
Density Ratio
Teinpevature Ratio t . . .
.1*

8/12/2019 USN TPS Fixed Wing Performance Theory and Flight Test Technique
http://slidepdf.com/reader/full/usn-tps-fixed-wing-performance-theory-and-flight-test-technique 219/245
.11&'f~ g -
ob ýD 40* 4" M- .0 a
cfI Lb
~~~~~~~~~~ r.jO '~00~O~00O0 Ig~
o cr00 0 o 'J a0
cr~ ~ ~ 'qQO&'aa
O'o C1C- - "V
- 0 0.0 ~~~~~'1 ;0 010 0I~CO...'00 . ' 0' 8 f .0 C !0 .0
r- C5 Ni; C".? ~ ~ ~ C ?LDae s a
11 on4Cr t1 060ý-

8/12/2019 USN TPS Fixed Wing Performance Theory and Flight Test Technique
http://slidepdf.com/reader/full/usn-tps-fixed-wing-performance-theory-and-flight-test-technique 220/245
-VI *'3C t-
o~ ...V"r t4J'I"'4 "41
-4-r
$o 9- f .7 4-0.0N
'tint~~~0 r-QJ'0 'O I
01fN- a-c ot 1 J''C~~
so00 0 13kIIOO -aoc " 05
0 A AiA
0 C" ' In@i' a.4

8/12/2019 USN TPS Fixed Wing Performance Theory and Flight Test Technique
http://slidepdf.com/reader/full/usn-tps-fixed-wing-performance-theory-and-flight-test-technique 221/245
- - - 4.. ... r~rrnw~ w'fl .fr'-".4' r'Y . 'r ~~
I- - . -- -- -- - --
AW -
-. 44 4N v I'l 3
t'3-7. - 47 l. 4 'tWNOJ 9
Ii ,+ 1' %114
* ;:t~ ..
ewa'-ka- 2Nt19
q-~' ~-~rr"'"'-r"'a ltmu.241-4'n 4 0 ).t '(4
*V.490'U'tt4$-w *' .Vt'4 @'0 .4Y'~Z-r - I"* e 4* es4

8/12/2019 USN TPS Fixed Wing Performance Theory and Flight Test Technique
http://slidepdf.com/reader/full/usn-tps-fixed-wing-performance-theory-and-flight-test-technique 222/245
- ,. - ,- ' -:- -. -..- --.- 11-T-1. - .... --
ci~ ~~~~~~~~~~~~ '0?A0 - .. 4. 14 10A a ia- 0' @ A Ml- 00 - 0
so 3 '.33- 'o wa2
N~ ý4o. O.,1 N N to. OANJN*a04
p421...a,. 4flI 930 ' 11444'N i SZ4;.C. I*
""I -. '-'- ow-.--;."A- '
HeJ'A 'aN . 0N3- 0 -, wC'." .0I- mto wr 00P wrf /o 19g13'0 0 Mic
;, 9pi- Z'nI-11N-0Up z a .0 . 0'01,CaI'm WO0tffisa";~j -jg t~o
go cc IQ . . . .
ITI
a'.~~~W a-'t~t.Kq N 4 4 -1 a-iC~t
tr-a-~~~~~~~l'~W 41M'~~'o- 03 0C .O,. ~ 0
I -V-'I'0 <-rr 0- 0 t~~ 7 ' 'ap--ra
fl¶ ' z 7 0 41k r----r
:ew 0 XrCf<1i~0
i.--0C~' .-- e3- C A )0A-- 100 *jr.. t~3A'
IM,- . -
6kCMp3' Z7
IaTt'~)A SAJN.A N)
4n t- 4fý i-A(I W. '0410104e-- .

8/12/2019 USN TPS Fixed Wing Performance Theory and Flight Test Technique
http://slidepdf.com/reader/full/usn-tps-fixed-wing-performance-theory-and-flight-test-technique 223/245
I41 w.41f
tý Z:3~~ ";"'tI 5~ 044#.~ 'd
~zz;44.; e%' 0 mi.-.*-
41.4~f N~ -
v&, -a v _1w" W".'a- A) 0 PIZ
lie lF,-4-'~4 t; a ~V,4 ;P? INN .. 444A AN
~~~~~~~~~~~*~ ~ ~ ~ ~ ~ ~ W' -r A41't. i t mF..a 4. ¶~N '4
C344-F~~~)~''I'~~4l.
ý4 ~ ~~ ~ ~ ~ ' 'A40 AL 0 I
S 1,
InI~ I I~0'4'.i~O~. JS 4.A4I.. F-4 42¼14'N~i ...71.4p. hnO
i Fs 4't t'9 ' '5
6'.IP4
.td W.f4
::;;;: ;1: ý'.~''4'4S'4 44 1 '4
_6 r o 00n 1' C C- F '.C.I' 4ICFmIV~~~~~Q'' 4Pi'' * qtS' C fC # t o ~ 9
-. ý1'4~'' C44 A J,' 4t4N Z. 3''-t.:~.4.,r
M5 1"iI?4fllC, 4 ý . '4s-.~,-I.4, '.It4i '4JO .9-IS ~ 2'Ii.' 'I5 "I~ '44 ~ ~ C4CC4'15915 C414 <~ti"'. n-
I~'4.4~ 4 4''*, q,4.*4 ',4i4 -
5 4fl
915"'r'P~T t
5ln~ it,.
4.;i.'L' -I *444
*~~~~~ ~4 0)~i5'w',44.4
A'I 1

8/12/2019 USN TPS Fixed Wing Performance Theory and Flight Test Technique
http://slidepdf.com/reader/full/usn-tps-fixed-wing-performance-theory-and-flight-test-technique 224/245
4-r 10 Q WO 41-
it R.t.
I p aAInn -0
N N
0~.4 ')W, d
+.t . .'.f ,<t4• 4 -" 40 '' 1 ' .' . .l 4 .
'4 4+ I., '4,'-.1. ', - - i,' ' - -..... 4-' .•, -*Y. '.. .. 4 .. . . . .4,+ 0 ,,
t- I /
41•-'- '*. ... ,.... . w ... . ....r -4 '?.4''* ' * e **'.r* ,.
-- - -- - - - - ----
0,0 0 C. f. 0
o.# c-l1112.
aj ,* I .
3.• + o +, . ... . .. . . . . . .. 'S4S +i' - :'4'++S.... •+. .. . .. H- 44-+ '4 4'Of 21Z "I •
Ige 6 7~vPE••,.I
44+ ...+ .... . . .. . . . . . . . .. +
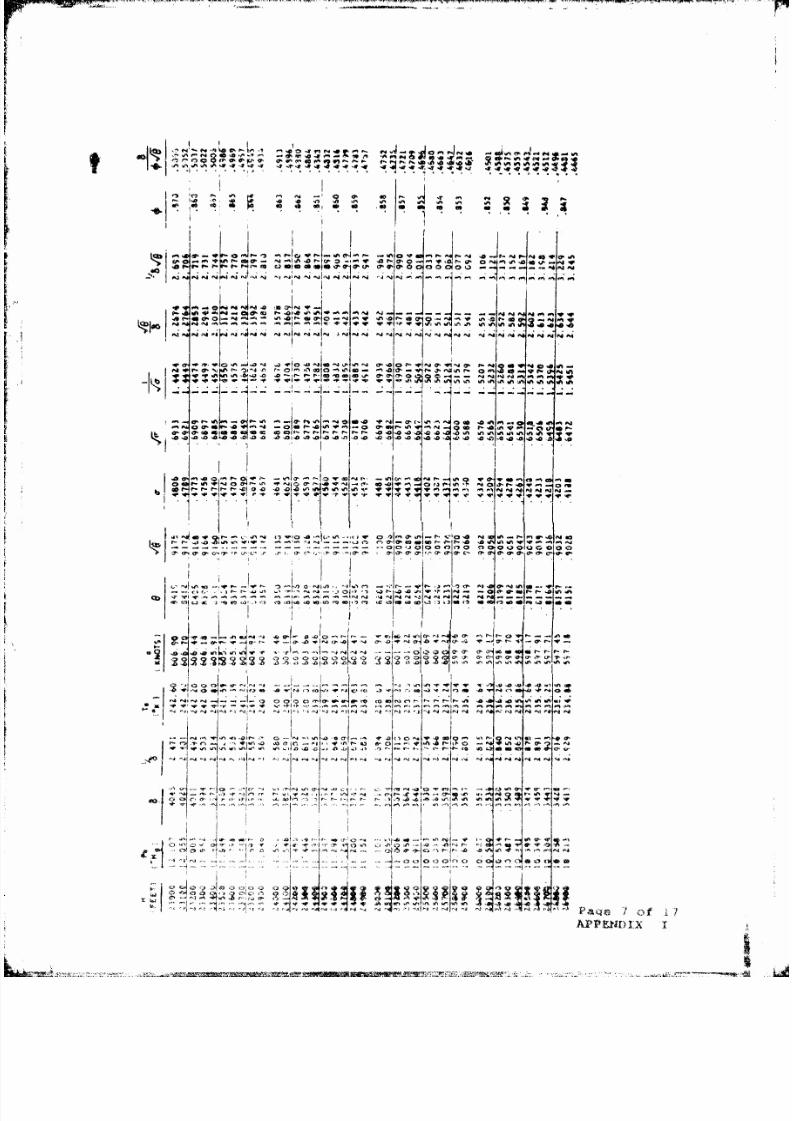
8/12/2019 USN TPS Fixed Wing Performance Theory and Flight Test Technique
http://slidepdf.com/reader/full/usn-tps-fixed-wing-performance-theory-and-flight-test-technique 225/245
IN 4 1 c. 0I0e . Z ( V. '0 00 0In
~i..., . .N~N .
-- -~- ~ -4 - -. - - -
4.~~c 09N0~' '4004'
ca 4e---a-oD V-- V Z
0.~t- cr o-, 7- a , ro ý 0. Ca-C
v~- 44q 0 "1-.. I~ .)*) 0 .. 01 a.,
j'''g'. ' ll'~t
2't 23 " ý00I 20 a-')' 0-1,2
I do
091v 4ý. V W
-~~~~ 0~ C'a.-
,,.nnw,)'.ni 0.4.~,04.04 .',--,-.--, -,--r---sO a. It 025'.
17 AVWNNNNN'NN )NN~N15N:49~ 0'j(5'1 1 r9N fl "4,-4C~ . * OO*014 -
,AMUM r

8/12/2019 USN TPS Fixed Wing Performance Theory and Flight Test Technique
http://slidepdf.com/reader/full/usn-tps-fixed-wing-performance-theory-and-flight-test-technique 226/245
I'I
4L
a-~~~ !0W .V
'II -4 0I'TI 0I0 I (I y .0 - Iý ' ; i
N~4 a,
J_ .6-it'
I JA I sa
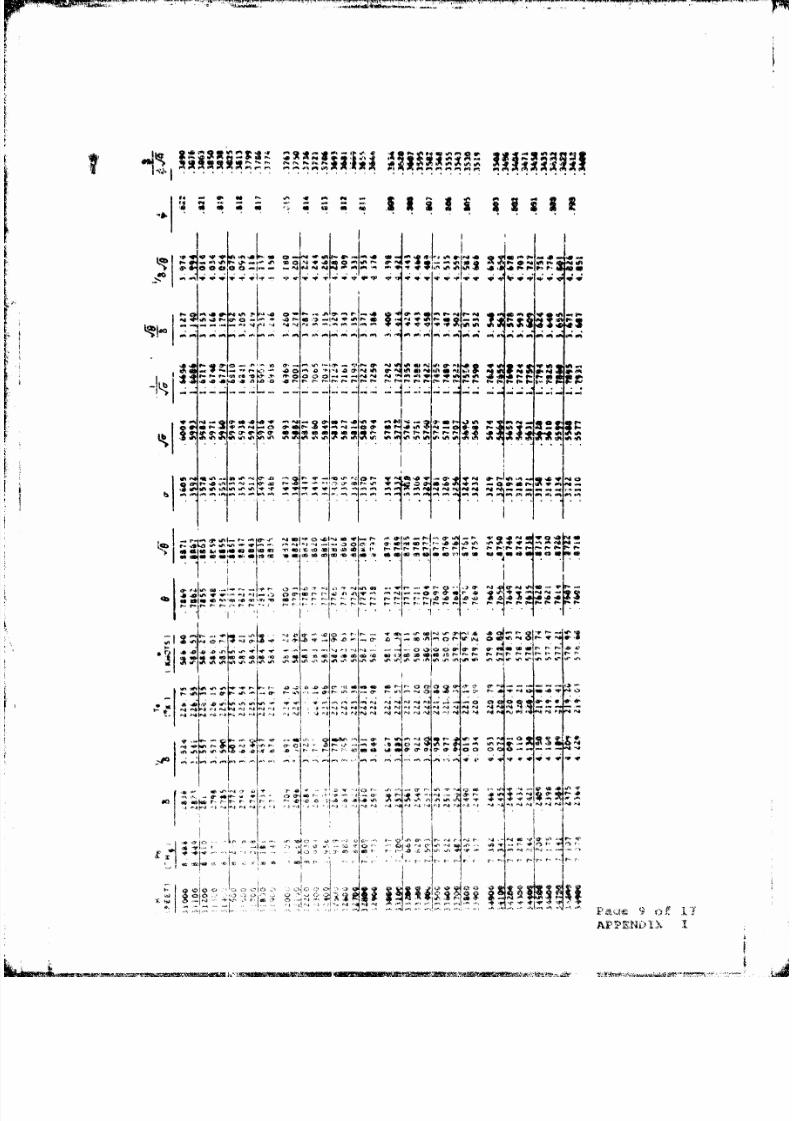
8/12/2019 USN TPS Fixed Wing Performance Theory and Flight Test Technique
http://slidepdf.com/reader/full/usn-tps-fixed-wing-performance-theory-and-flight-test-technique 227/245
-- s it - t sL.. 5t A; rs
1 40f do a 4Q ft-5 III
IV 'ou0' ,sk a ap- 6,.~ a, Iq a .I4 f SaC S -
e IS [ ,I
&9
r - S4JA 4 *4 do
A lu 0 10~,f ,. % n:a . fl % 0 0
C3, ~ 0 CNIJ4 .nea 4a aý- .10 1
'~4a ta40 5% ea ea f-. 4ý-.P
1 toa , a, 0s1l a-emea"'a w o e Sen32
I L I Ir'5 ew0 11 Q4h,..A'All Mr,-' ;;4:-.I'7JlA 1. f I#-"-.4.-g-. s r -
.clt1'"tI i ' -C. -
MA., 0, 1j wt~ J
W ,7 o.p& o0ý11NTv
ýa~~ ~~ ~ ~ --4Im o v I k
I Ir
~ 21 ~AP2EI4OIX

8/12/2019 USN TPS Fixed Wing Performance Theory and Flight Test Technique
http://slidepdf.com/reader/full/usn-tps-fixed-wing-performance-theory-and-flight-test-technique 228/245
A~~~ý F. 0. 0Vtl oi WN wtNf Wr~tr~
W' jl I4 is0
4,z)~ ~ '.'4"it% '-,A'~u
<w0 '4 ::O i it ~ 4..% n -~4~?rr~~fa~o 'r, 1c, ---- '
.. r.i.o~4''.il 0 V# O V IOfW4~~V~V 4.5
1WV -1 - s 3 f 4[.~~. 0:r .- W4' M-M olm.. Cr a- 4p;''p qw0'q --
4;4'4'N'.l .,fi#* iC04-r-rSSt.4 O~f''in? -~
FAd.
I.Ia.
macA6 .40 .0* 1 se ný~ .31 5.
'A q...U C. ~i J .' N3i'j.' ' ~ O -.n... o:'rl n ~ 4j. i/. ~ .14'i. $, i ~~ti4t tIli

8/12/2019 USN TPS Fixed Wing Performance Theory and Flight Test Technique
http://slidepdf.com/reader/full/usn-tps-fixed-wing-performance-theory-and-flight-test-technique 229/245
a~Au
C-1Oi .. ... .... .. .- 4 0 P,)
S..... I
ala wI
, I
I w 0 Aj.;.&2Nlgw 4
p ~~ ~ ~ qIn (p04 fl 'et
.- -. 3 t . ....... .0Di a'..g 0•or° . n-
I -As
N,
3)'t) , 'P'V C 4
13 aQ a
46 '.-y6.-c~-.r4 . C 0 -3C4-.4.C..a
41
.g

8/12/2019 USN TPS Fixed Wing Performance Theory and Flight Test Technique
http://slidepdf.com/reader/full/usn-tps-fixed-wing-performance-theory-and-flight-test-technique 230/245
-'ý O-r-~& r -.
a* 0N--
" m .0 ac l0. 0ý 0. 0- 0 0
r",r ol a a-ýa07"
I 14* -I.
c-fl~~~~~~ -c-P Mo-1V afc~tci SICa#h... ew- &n40-Atr~tii~LvIVtt r
it v,-~C C G@ cN ~ Sv½ VV
'.. ~ ~ ~ ~ ~ ~ ~ ~ ~ ~ 1-c -77-----I-~~~ci.rr~ m eele e
-7 T ;
~~~~~~~, wsfi w0 eirc-e o -N N# .iti w a
Cr ttoitos~r Litotiflh S~ otA~O 0 003 a41
4,IjN -. a.V
niN-~ee I'.~i~r i!NJ O C0
1
.t itf-c .@. tols' ys-4 i-
-cw jriN-CCr 9ii -oascOt. -
APPEN.ý ,q p~w'w~I' i~- %NjNN'N.r~
V t . .tw -'tW S S 4

8/12/2019 USN TPS Fixed Wing Performance Theory and Flight Test Technique
http://slidepdf.com/reader/full/usn-tps-fixed-wing-performance-theory-and-flight-test-technique 231/245
~~~~~~- - - -'~w~~i-rr-- ,--n
40Amu "1,s -0 ,Q
21,
If a a Taf a. 11f poU1
.
lpw nP'
0ýi 44 ~ 0' 0 '? -. 4'4 - ~ #0v
-100~ , m~ W~ s N o 41e t at s4 ~ 0n .-- e
-j *. . 0 - " w- = w0 (r 40Vt 'o 7.1- , ;: -4-i -,2~0ai~ ~ s ~ :
4D'1ý 0- A
-r 9. p979 Z;:i. ,, -
:tn4
t~a~j.t. 01,7~i~tt~F
Z_,'A O..,.,I"~ V i a a 05 S
b , ,C 0 t .t - . 0 C.. O * S 1
-sas 0040 44050-41on,SSS-,.4 -a-, 0Aoes-.Oa X

8/12/2019 USN TPS Fixed Wing Performance Theory and Flight Test Technique
http://slidepdf.com/reader/full/usn-tps-fixed-wing-performance-theory-and-flight-test-technique 232/245
40
"%3oN.C oSe'.t .st.
Al *' 1~ ',-' -.- ~-'-~SOS ~ 46*in
-~ 4-.&.* N dIJN "IN ' J~l N N ' 47 3 4N N I5 . I
de . N !
I3~~r.. rA . - '--.- ,- " .0. .4 a.8q4
as-.. .--.r~..>,RN 00
* ~~ ~ ~ ~ ~ ~ ~ o..~N.I o N ' SN
aai
Al 11 of.

8/12/2019 USN TPS Fixed Wing Performance Theory and Flight Test Technique
http://slidepdf.com/reader/full/usn-tps-fixed-wing-performance-theory-and-flight-test-technique 233/245
- -w, - '~~~- '- -- - - -, - F .r -~r-r, - - - - -,. ,' -
0 0 L
S2- -- -
e4IA mpI . . on- f
S, I Ii
40 ~ 0-4@ N@ -A
4I - , -,0'W V'nNsa - P 4
A to
0' l 0 0,' 5?5 . ...5 I 0 ,. i ,. i . . . ..o ! ] "
4)0IV 'l As vi
401....'is .N ,,,=-. <,-1 ',,o.. . a m ofatoI . .. ... . ..
-U- I6-10-7- *-!V'W1
-- .,, : *I<i4• :* I I1r..r.r..' -'pr.tl .- 1.-- SN .• f f o f- ......N
.0"i, - .- , BL-
'u -1
~TJ S1fs~s~ss ,~515A 555~51 55AY

8/12/2019 USN TPS Fixed Wing Performance Theory and Flight Test Technique
http://slidepdf.com/reader/full/usn-tps-fixed-wing-performance-theory-and-flight-test-technique 234/245
A- h A g Z
4F4
~~~.C'. go.,00 0 . @ 00
%4N.~r.N N' . .9 .41 N
n" ZE4 00 0'C,4..~44 %- 43 '
4O -4) o4.. ... ýO 0,, .. 'A 0' ý 10 N
-OIN ~ "444 In4 in4 inw.,W,,
IP.~; I;"N4'W 1.4. N' Z ! -5 fNI . 0 . : "1:
14C aoa C D..0 j 4Q e & .U 'V!00CC 10a 0 000
z, D. C.NYj .444'N-.1 (.1I11 ,1.)1, ika 4iNN.. 4'.- {-.--i-
k I C' I
CI0V4 7 )1 C))'4 040-4-. a- 1) In ý014'C- .3 (4- .4
.4''4 1.4 .4'.% 4'4.4 .4'
i4
44*4.~ 444~ 14 44 4%.4 .'~44h' 44 4 .4 .. ., '%u% 4 144' ~..,IAi' -44-~~~~~ ~~.tIN4'.v. :I.. 2-'444-..'z'~' ;i: t-'.-~~..' t
* ~~~ ~ ~ ~ ~ ~ ~ ~ ~ ~ ~ ~ , .o44. .ot4 ot ' 4 "' 4 4* ' '4.4jo' o4't "o
h44 '4 .4 41 .1 064 "44I44.'1 C_ .~t 4n . 444. . 4 . 4 '.' 44% 4 * 1
4104 'Il 17 iI,4 14 4 4 4
4
p .
.0~ ~~~~~~~~~~~~~~~40 4'44 0 44 '44.'. . '4ý.4 4 -~4 4 ' ~41,' EN7 x'00 4 ,~4 4 4 44 ' ~ '.,'4 4.

8/12/2019 USN TPS Fixed Wing Performance Theory and Flight Test Technique
http://slidepdf.com/reader/full/usn-tps-fixed-wing-performance-theory-and-flight-test-technique 235/245
nT -A -~ - -- I
~I N. -~ -a m~ .~,4 *
4A A51 Na . 'o'~ 'o
;4f4 rxr-~~~1 1, c-" 4
sa 41 a
*ý a ~:
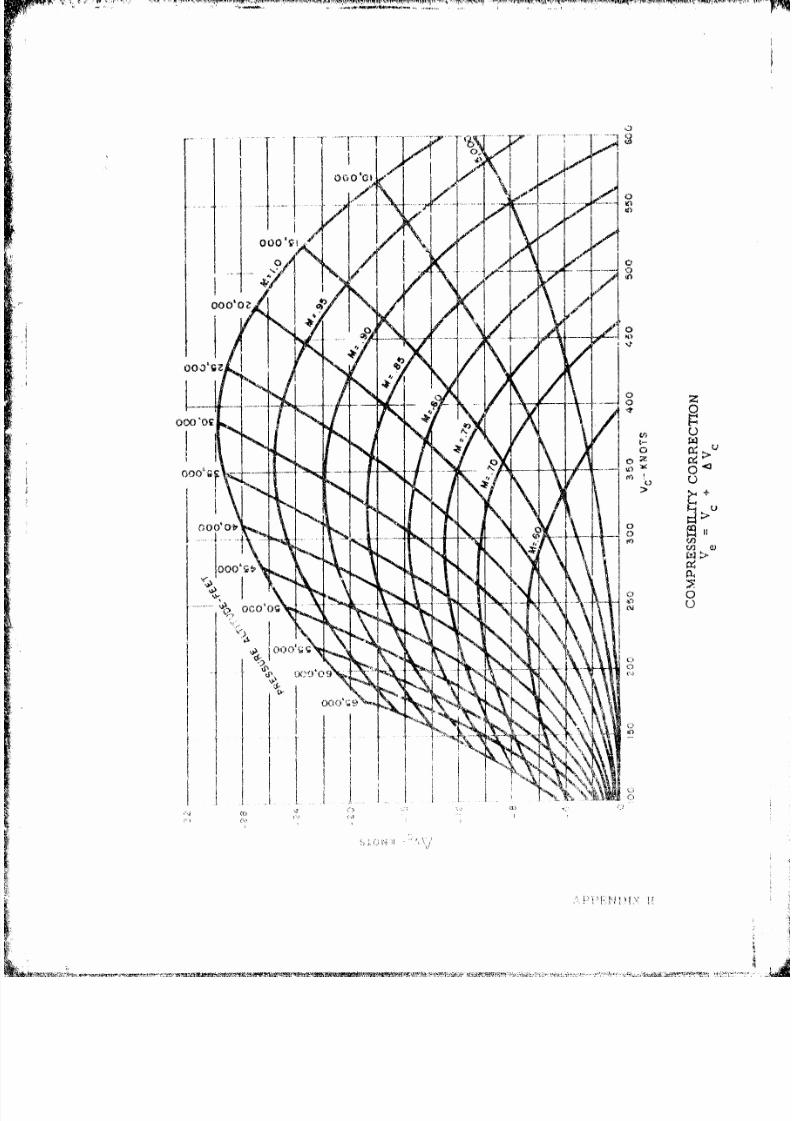
8/12/2019 USN TPS Fixed Wing Performance Theory and Flight Test Technique
http://slidepdf.com/reader/full/usn-tps-fixed-wing-performance-theory-and-flight-test-technique 236/245
00,
Iý/ 0
000,0?
C~Q~ ~ - -.
003~l,m 4
0O~oO 1
)0 o
oo o.,

8/12/2019 USN TPS Fixed Wing Performance Theory and Flight Test Technique
http://slidepdf.com/reader/full/usn-tps-fixed-wing-performance-theory-and-flight-test-technique 237/245
AIRSPEED -.-eaL'rrUDE MACH NUMBER
Pfl(3SUR( AL.TTIUE), THOtiSANc'6OiEV
77 7 1 toF0
Wt.0 7,777~~L--
-77 7"4i- ,
:2, - a
Alrig).--- -.-
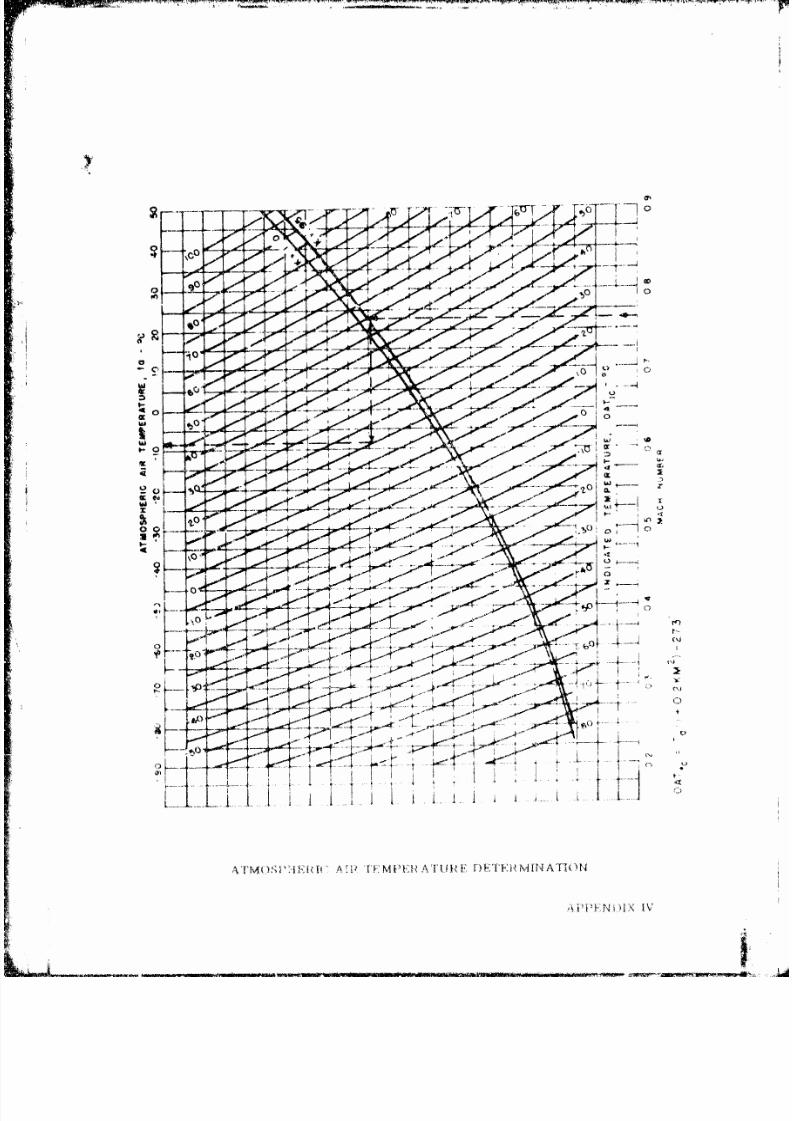
8/12/2019 USN TPS Fixed Wing Performance Theory and Flight Test Technique
http://slidepdf.com/reader/full/usn-tps-fixed-wing-performance-theory-and-flight-test-technique 238/245
-101
TOI
44 -- t- -'0 ¼-
bit
-- 4-- §--- t )
600
tý P . JI IV.

8/12/2019 USN TPS Fixed Wing Performance Theory and Flight Test Technique
http://slidepdf.com/reader/full/usn-tps-fixed-wing-performance-theory-and-flight-test-technique 239/245
TEPRTRECNESINCA-J (O Vs0C
TEMPERATURE CONVERSION CHART (OF V6 0C)
410
it +0~
too 77LATT~i i
.z0 TT
60 II 1*
4l .4A-0UL I~RT
it :':OI I~~~~ [
40'04
'I FE~l R
so -77Iii~
-0__-. ~ ~

8/12/2019 USN TPS Fixed Wing Performance Theory and Flight Test Technique
http://slidepdf.com/reader/full/usn-tps-fixed-wing-performance-theory-and-flight-test-technique 240/245
0 0 0 00
oC) C) C) 0 00to ID (D0 ' 0 0,
00
0N
(C)
ctI-
00
r--J
kc))
wL _
N' ~ ii
n F4

8/12/2019 USN TPS Fixed Wing Performance Theory and Flight Test Technique
http://slidepdf.com/reader/full/usn-tps-fixed-wing-performance-theory-and-flight-test-technique 241/245
0)C-) C11 t )LO t C 1(00 t - D LO c LIJ)\ 0 1' 1
C.) j) Ch 1 %) .D U I'~CT ) t4' C) a) 1-- r-1 L\I)C.- vt " 4 _4
-0 -4- 4- -1- -N'4.Ot0~N ) C)N-- 0C )C CC'.074X ~t C.) 1:)
CA 1- f(1)C(N C14 " c14r\ C4NI C4 -4 c ~ ( (14)I)- N~~ ~ C14N
-4 r- at~(J~ OQ).I r t - fC~)7 M 0 00Ir) MV) L
(No C) aot) f-, ýo \0 Lr)Tt t-1)NJN .C) o) C0 ~ u '- t IDV)Ir n " -j-4 C-)
1-4)O 4C~.<ý A I -A " ) C(n 0 0 C-OI)'- C)t'C)NC,-0C)
(N c(J (NI ( (NJ (NJ (14 (N4 (N N N N ( N (Nj r(`1 471- C\3 (NJ (NI (NJý I C(.4 "N CNJ
m) aC)Y\t r-v, . n q ) (NJ C. )C00c Z n L)CNn' nC)NlC-- - --# -) -1COC f Lt' r-4 - (DC- C)0C)cO0. Df Df("4 F(D (Nýr0
CNI (N I N N NI " CI INJ "> (Nj rl (NJ CNJ " (NI4 CNI (N (NJ "N (Nr NI(J4N N (NJ
C) - 0c)r-3 O\'ýc' a) (14 LOC 00 , 7 0)NCG4[-tN 00N~~ t-T \0 )'f M
(D 4OU r-(IJ-44 (7 JC CJN J'(JC.C (NIC'J(NI(NJ(NI CINJCI01(
(4--4 . -4 -~ -I () CD (D C) QC C) 0C)0 CD
CI ('j4 C,(4I CA J4ICICJ (44(, ("1>f-(N(14 .CNIC11 71 1CIC4(CIC.
D oo) CO t-- "DLn it)'A -)i) rt4 r--41 C) ) 0Y- r \o ') Ctt~) (4J~-4 (N
.- 4J,44 4 - ( ( (4 41l4 (' (( (4 4(A((((4(4404 C ( D 0 C
C` 4A I C', 4j ("A 1\1 ('11 4`4 r111 CIA 1744 (- I " il I 4~ CA4 rC
0T-rh fr 0f4 rl44. c--(')J-l) 4~ C 4~ I-D '.G fl1 *4.j-- <D t"J Ll
m 0 401-4, W .1(Z(4M4.4(4444(4444(44 4( ((44V4 44( (\I (4D
-- 1 -4 - -A -1 -.' 4 -3 C)47,(: (_.1 4) 0 (7 44) 4Ž4D 0 Cn C
CA4 (-A (-A. (' 44--,Arir C "A(4.. 4(14CA ( ) <1 C -ICA C
(X4 1--- 0 .f .f .t 4 -:. 0ýo - \D - O " )t)C) - C
44 4 -4 4. -4 - 1 - ' t--)~ 4.(D .4. C) -(0 C 4 D C- ,)- Z
c I I j CAI UI f-A CA ('4 (A A CAC, I 4fCA CI-
1~~~~~~ ~~ ~ 0444 )It11t) (" (41 l r
or?(D r.) n Cý - I 0 - 17 10 (7 r'4 * r. .1-
LA - I \ý r t 1 ,, - y )() r Z 0 I) - )1)r

8/12/2019 USN TPS Fixed Wing Performance Theory and Flight Test Technique
http://slidepdf.com/reader/full/usn-tps-fixed-wing-performance-theory-and-flight-test-technique 242/245
-Y r". If)00 -1,:* - '0 C - -y' w
CT 0N C) (N L) or) .-A 4cs . t 0)Cl LI -C-i m c o 'c-C 0 J toý CI) C-i jt ) ('A
m Cr, 0) a, \) (31 L) mt (7) 01 c-) IT m ry. c3r) C00x 0 C< DO 00 of 00 L-i
cC' tF)~\ itf) AtfN ( se-i 5J) C O N D U4CC'Co>0cmo GL)ChOOL0)C W) O~~)0X)r 00a Of)
(:jJ 4:)-in$ ifjyA)-~I Q)0 )J0 N0CC0(KmCLC r-CIAýt Lfh1--
T'- McLAOccOtND LD V) ,~1 tf (N5r imiC(A C i- r-- \.q aLtfLO tl4)
A c- '.Ofl) I-- tC-JO\XCt '.OS tltl' ¶tA 1/t) 0,'flV- C)OrCNJ
o M-rtr-C, --- t-Oz'IlV-DNCY) (rcy-J00lX-r-if ID L NO--NO
0 00 -MC Qa)Cm C)J ) m 3CACYJC00) 003a)Q00 )CAD OG)AJ00CIOcc
-CT) OtoMU)0 ---- t-C\V C CI"ifl V)-tI- c AOM CL0A(NLI\ LO U) it t-) i-
C) 0)I )OCXJ) rctVýa) 0) C71 cCtCMMY) CT)c CCCEV)0,) X)cO0 or On0050%CO
-A -
0~~~ ,AL)h(14 -r--on- CL-ý1--0-:D-~Ac a-inxi-
440
( C ('AAJC rti I rirlt'. --- (7) , 00~ £)D tA) In 10 '-cf.l)I-t y C i 0)~,C
* o i-etr-Crf- iflu)-tO §TIAi--A i-- I-) W O-\1DlC7
if i M ocar, t- 0 int0-L-AO CA CI AZA00 ait )lcflD-I--t lit) rA
LO C a "OC-CLý0 :l Y 7 (XC))C5)GtAAQQ~XiaJ ()A COW'iX)aC)
o n cico \ [r)JJ T~O~I rl-tr-)- j. r i r r1, if: WLS,-A1--- 4
'C 04 $ 0 - C7,L)(T ( ¾7T, iL, nLN ,L 1 c~i- rCL L,r Y) A$L) )r, CA (A 1)
Cl) >1 i~~- ,i ii iii -P- i f- ---A -- i -- -- ---A ii -
AL i- 3 ' ,u - -i Li.i L

8/12/2019 USN TPS Fixed Wing Performance Theory and Flight Test Technique
http://slidepdf.com/reader/full/usn-tps-fixed-wing-performance-theory-and-flight-test-technique 243/245
-oC ~ -t -- 0 onar'r-0 -k 00 m C1 M -4 1-n V) --- - -0 -A -n- r- L
0*4 . .1qm W ,V10 4- W r k - 00 c,1 lf. rU)
,-4 4 -.4 .4 .-4 .-4 r-4 C9(J(J N f
m-4oC) -k o fC a O3fl.417 0 ) 4n-4 W)tt q0)rUlQ-4C-4
00 v. t.
rI4 \tJ Tt~ftlf tnNVQA - 00C1 )(,N )~ 0Ln 400LJ)- tKnt r,
-4'raf'n n'Ot- V)0("U) Lfl'OOaT.-Z tlf a,-t0~~,.. ...4T-0 r, C4 L) C r4 r4 rI- Z 4) J N (NJl to) (N h
-4 .- 4t-4 OVNV)4t C'J0 -0 0COC, N'- "A T oNr- M -t (nlIO)f Ch -4-4- 4 - A - 4C. r
0 at-4 ( (LC"4(Otfl V Oar-q*J% C~C) wtNo MO( r-I
N ~~4.4 .. . .4 (J NJ (NJ (N H
(N V)-4CJtf H)Itfl) )flN. 0 0)C r' NatM-4 CD'0,-4-4-4 ,-r'r-r-N . . .M~
Ch (:> 0 CoN i M(%JNJd \Jh0 0 00tC)U)n-4 M t' C* I-.
00n\jC 0CT'O Ot") Lfl- CO l~)'t -4 rC1 00 ('4JLf 4fl)In \400 t)
a. W) 00tn 0 C (1J14. r.4CJ fl, Vl.'-4Ch \O0 fIflln
1 0m 0--1- -'4 "'4 "Ni (N u DJH
_n tIh0<D t4) -T4Lfn Oc CHNn t NJ Hrn tON Ml A00 U00w0C
cr no00oH)cnI \0"C,-1O 0-tfD ML,)lf0 r'N t )CJM\O ýtflN n
.- r-4( W)etflnLf\O .- 7t)CM 0 -4C, fl 1N--00Z c' - Vt C~a)
-4 'A. -4 -4
-4 -.4 -.4 (NJ (,A r>4 (> C H
(ntCf) f- 0 tf ln CMO4-4 tflmcfl\D--
to 1-flM ý, 0 t-\ 0C1 0C' CnNý~ I---~r ADe~f \N'O" X
1, (14C' 9 ýIL/M 90 0 ot2) 0 -1 C A4 t (7jtO:OOCl~~.,-,- flTr -,,-4-c 0L)r-4,-4N ; (NJCJINIt-fl
-4I -14 .
t. h- u1N 4 f t"J4r- 0a%7' 5) U)-t~lfcr rC7,
9 Cri CJ CL
L4 ca A4+-nc
APPSNTiXX VWi

8/12/2019 USN TPS Fixed Wing Performance Theory and Flight Test Technique
http://slidepdf.com/reader/full/usn-tps-fixed-wing-performance-theory-and-flight-test-technique 244/245
00 0 3 - -ji t*0 CAw _.1.. w .r Y .. r- w . .y .o ,o Lo r- u
C9.. . . . .- .
tri ~ ~~ ~ ~ ~ ~ ~ ~ ~ ~ - -) -erMt--00M4. r : 00 ý, C '
OC0C.-lfl 004fl~fntflc'4V) Lf~-N L co- cG
00 . . . .
tn 0 c -4t)Ln 0 uk 0 \D M rnr-- -'0 -4 L -4Dif (
inOaiý .)-t4 LfýrýtLOD fLfC \.'C A0Lf lO 'tOO00c'.C) OfC)(
. . . ..
W)r,lV ftlTlc' 0ttilfD''CN Nf) O ' OOOin--in -r40
r1ý0crr'c.4VK t Ic ) Ui nN cýrr- r4O r- 00 00 0) ') \CDCDC74C
(MnN Lfl<DcLr-4ttN 4 z "Z rtL C-t r cC4OO C) 01 ýc'V 00 (
01 U rftltlct. ttw, fltf00 rO-OItn f NIrltC) C \ C00-C
n - C14 A.\ ei1 01, x 4.OtC ,ftfl. OC IDM lf~l - t- flT CA V)
jACJ.0l.- !-&i (7! 0 ) (,-- )fl (-',0(0(42) co -tO ) "'JI
C7)('It Ch-r 4 c,4 ,:? --- t'ro J t)(U)421¶ . .1 t'(
Le . . .. . . . .
U)o cIt-f ()I CIoTi) UICCJ X4'0 t-()f 2.QQ- tf .l ctflcc.0
( iI) (t.(I W)' LQt''4oo II' 424¼0r,0 i t)r4 00
4') (4 ) -t "-t 't '1f M ) is \0 .o o f, I, r- (X) co m m h C
(5 r r D (- -t t')) Ln' 1,D (Z3C's -\ Wt ,) ' 7D k ;,n I
r' CD (14 '2-' 2,),I 00 t)rt2,D a D t C 1
tn 11 rl) CT1 ýT Ln Lr) - 00 >)( 0)C 1F lZ
V1), - f ,,t -l') I
14<
A~~t 4)EX71

8/12/2019 USN TPS Fixed Wing Performance Theory and Flight Test Technique
http://slidepdf.com/reader/full/usn-tps-fixed-wing-performance-theory-and-flight-test-technique 245/245
-. 4n "4 LA C>. 4 n -4(N(JN "JN (C4'
t-n t M Ln o7r- 00O 00 0) C) 0 ~C14 ) NL/ T