usp technology review: speedy breedy usp technology review: speedy breedy this report is one of an...
TRANSCRIPT
i
USP Technology Review: Speedy Breedy
This report is one of an ongoing series of reports evaluating the capabilities of various screening
technologies, performed under USP’s established Technology Review program (see Introduction for
details).

ii
Disclaimer
Certain commercial equipment, instruments, vendors, or materials may be identified in this
report to specify adequately the experimental procedure. Such identification does not imply
approval, endorsement, or certification by USP of a particular brand or product, nor does it imply
that the equipment, instrument, vendor, or material is necessarily the best available for the
purpose or that any other brand or product was judged to be unsatisfactory or inadequate. All
product names, logos, and brands are property of their respective owners.
iii
Executive Summary
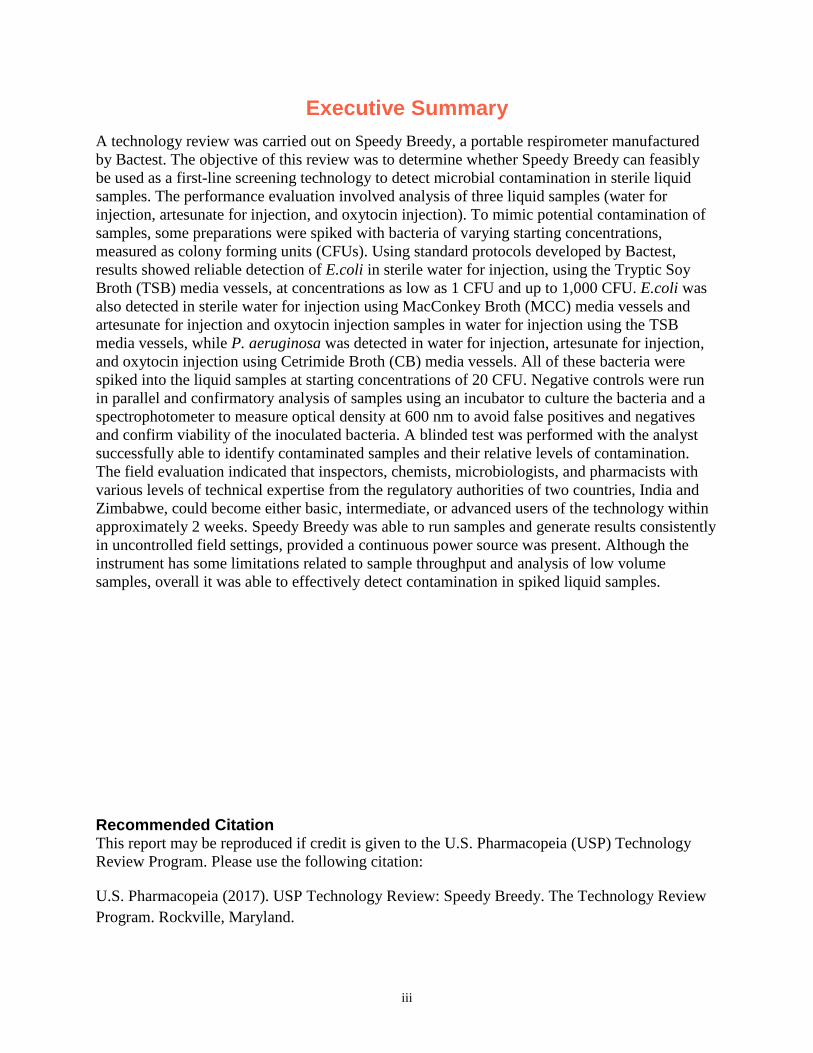
A technology review was carried out on Speedy Breedy, a portable respirometer manufactured
by Bactest. The objective of this review was to determine whether Speedy Breedy can feasibly
be used as a first-line screening technology to detect microbial contamination in sterile liquid
samples. The performance evaluation involved analysis of three liquid samples (water for
injection, artesunate for injection, and oxytocin injection). To mimic potential contamination of
samples, some preparations were spiked with bacteria of varying starting concentrations,
measured as colony forming units (CFUs). Using standard protocols developed by Bactest,
results showed reliable detection of E.coli in sterile water for injection, using the Tryptic Soy
Broth (TSB) media vessels, at concentrations as low as 1 CFU and up to 1,000 CFU. E.coli was
also detected in sterile water for injection using MacConkey Broth (MCC) media vessels and
artesunate for injection and oxytocin injection samples in water for injection using the TSB
media vessels, while P. aeruginosa was detected in water for injection, artesunate for injection,
and oxytocin injection using Cetrimide Broth (CB) media vessels. All of these bacteria were
spiked into the liquid samples at starting concentrations of 20 CFU. Negative controls were run
in parallel and confirmatory analysis of samples using an incubator to culture the bacteria and a
spectrophotometer to measure optical density at 600 nm to avoid false positives and negatives
and confirm viability of the inoculated bacteria. A blinded test was performed with the analyst
successfully able to identify contaminated samples and their relative levels of contamination.
The field evaluation indicated that inspectors, chemists, microbiologists, and pharmacists with
various levels of technical expertise from the regulatory authorities of two countries, India and
Zimbabwe, could become either basic, intermediate, or advanced users of the technology within
approximately 2 weeks. Speedy Breedy was able to run samples and generate results consistently
in uncontrolled field settings, provided a continuous power source was present. Although the
instrument has some limitations related to sample throughput and analysis of low volume
samples, overall it was able to effectively detect contamination in spiked liquid samples.
Recommended Citation This report may be reproduced if credit is given to the U.S. Pharmacopeia (USP) Technology
Review Program. Please use the following citation:
U.S. Pharmacopeia (2017). USP Technology Review: Speedy Breedy. The Technology Review
Program. Rockville, Maryland.
iv
Acknowledgements
The authors would like to acknowledge those mentioned below for their guidance, contribution,
support and feedback in the development of this report:
The USP Review of Surveillance and Screening Technologies for the Quality Assurance
of Medicines Expert Panel
The Drug Control Administration Telangana (India) and specifically:
o Ch. Karthik Siva Chaitanya
o Dr. B. Kishor Kumar
o Jahnavi Baswani
o Dr. K Prabkahar
The Medicines Control Authority of Zimbabwe
v
Table of Contents
Disclaimer ....................................................................................................................................... ii
Executive Summary ....................................................................................................................... iii
Acknowledgements ........................................................................................................................ iv
1. Introduction ................................................................................................................................ 1
2. Methodology .............................................................................................................................. 2
2.1. General Information ............................................................................................................. 2
2.2. Performance Evaluation ....................................................................................................... 2
Speedy Breedy Procedure ....................................................................................................... 2
Confirmatory Analysis ............................................................................................................ 3
Methodology Limitations........................................................................................................ 3
3. Results ........................................................................................................................................ 4
3.1. General Information ............................................................................................................. 4
Data ......................................................................................................................................... 4
Access, Handling, Maintenance, and Repair .......................................................................... 4
Durability ................................................................................................................................ 4
Use .......................................................................................................................................... 4
3.2. Performance Evaluation – Application III: Identification of Contaminants or Impurities .. 5
Analysis Conditions ................................................................................................................ 5
Reproducibility and Reliability ............................................................................................... 6
Sensitivity and Specificity ...................................................................................................... 8
Limit of Detection ................................................................................................................... 9
3.3. Field Evaluation ................................................................................................................. 10
Training Requirements.......................................................................................................... 10
Field Utility ........................................................................................................................... 11
4. Review and Conclusions .......................................................................................................... 13
4.1. Performance Evaluation ..................................................................................................... 13
4.2. Field Evaluation ................................................................................................................. 14
References ..................................................................................................................................... 16
Annex 1. Equipment, Consumables, Samples and Supplies Used during Performance Evaluation
17
Annex 2. TR Field Evaluation Training Survey ........................................................................... 18
Page 1 of 21 Pages
1. Introduction
Assuring the quality of medicines along all points of the supply chain is vital for promoting
positive health outcomes for patients around the world [1]. The importance of medicine quality
screening technologies in this endeavor is becoming increasingly recognized [2]. USP has
launched the Technology Review program, an initiative guided by a technical expert panel
established through the organization’s collaborative and volunteer-driven governance and
working towards four objectives:
1. Develop standards and guidelines for evaluating medicine quality screening technologies
2. Generate and disseminate tailored information on the capabilities of these technologies
through a two-step review process; a lab-based technical performance evaluation and a
collaborative field-based utility evaluation.
3. Build the knowledge of key stakeholders to appropriately procure and sustainably utilize
screening technologies for the purposes of combating substandard and falsified medicines
4. Foster the development and enhancement of new and emerging screening technologies.
This report contributes directly to objectives two, three and four and is the first in what will
become an ongoing series evaluating the capabilities of various promising screening
technologies.
Most of the screening technologies currently in use by regulators, manufacturers and other
stakeholders focus on identification of active pharmaceutical ingredients, excipients and other
raw materials. Little attention has been paid to the issue of microbial contamination or sterility of
liquid samples, a particularly germane problem in low and middle income countries (LMICs)
where the security and integrity of the medical product supply chain is difficult to maintain. In
addition, the currently available methods and instrument require dedicated clean laboratory space
and trained staff to perform the required assessment. To date, there has been little emphasis on
developing methods and instrumentation to perform tests in the field However, a portable
respirometer called Speedy Breedy may present a solution to this concern. Speedy Breedy is a
portable respirometer that claims to detect microbial contamination in liquid samples through
pressure change measurements over time, which represents microbial respiration [3]. The
program, with input from the expert panel and other stakeholders, therefore decided to review
Speedy Breedy.
Page 2 of 21 Pages
2. Methodology
2.1. General Information
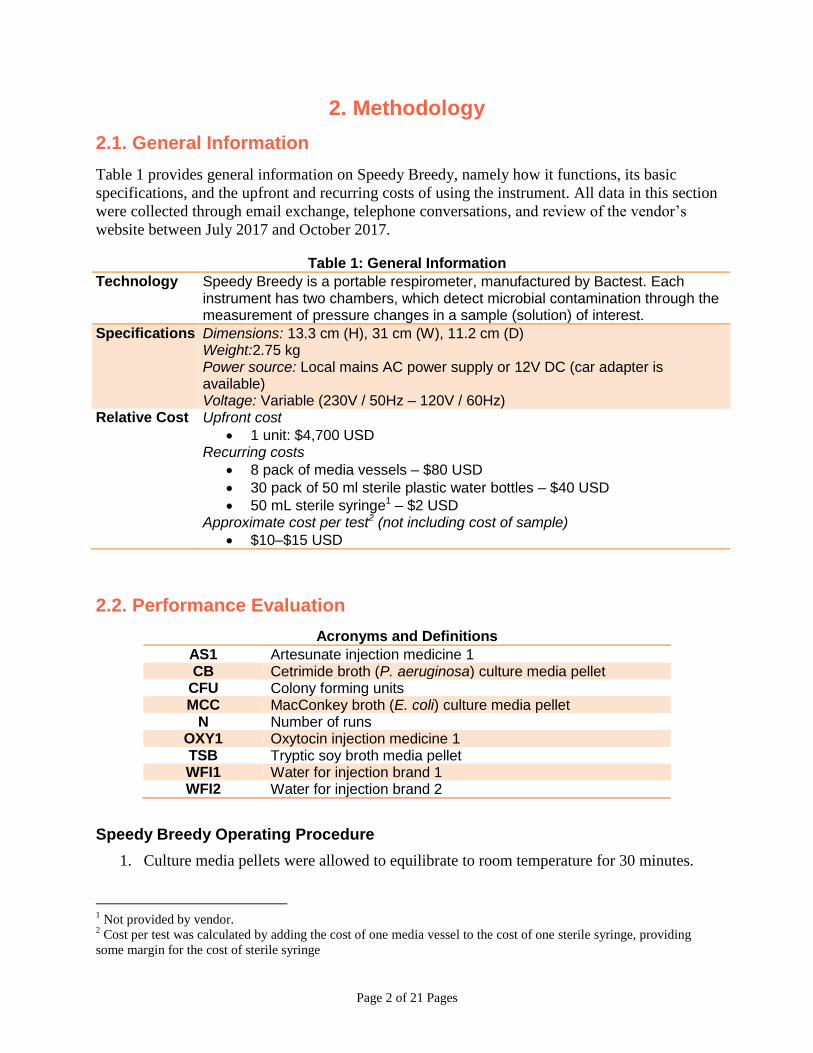
Table 1 provides general information on Speedy Breedy, namely how it functions, its basic
specifications, and the upfront and recurring costs of using the instrument. All data in this section
were collected through email exchange, telephone conversations, and review of the vendor’s
website between July 2017 and October 2017.
Table 1: General Information
Technology Speedy Breedy is a portable respirometer, manufactured by Bactest. Each instrument has two chambers, which detect microbial contamination through the measurement of pressure changes in a sample (solution) of interest.
Specifications Dimensions: 13.3 cm (H), 31 cm (W), 11.2 cm (D) Weight:2.75 kg Power source: Local mains AC power supply or 12V DC (car adapter is available) Voltage: Variable (230V / 50Hz – 120V / 60Hz)
Relative Cost Upfront cost
1 unit: $4,700 USD Recurring costs
8 pack of media vessels – $80 USD
30 pack of 50 ml sterile plastic water bottles – $40 USD
50 mL sterile syringe1 – $2 USD Approximate cost per test2 (not including cost of sample)
$10–$15 USD
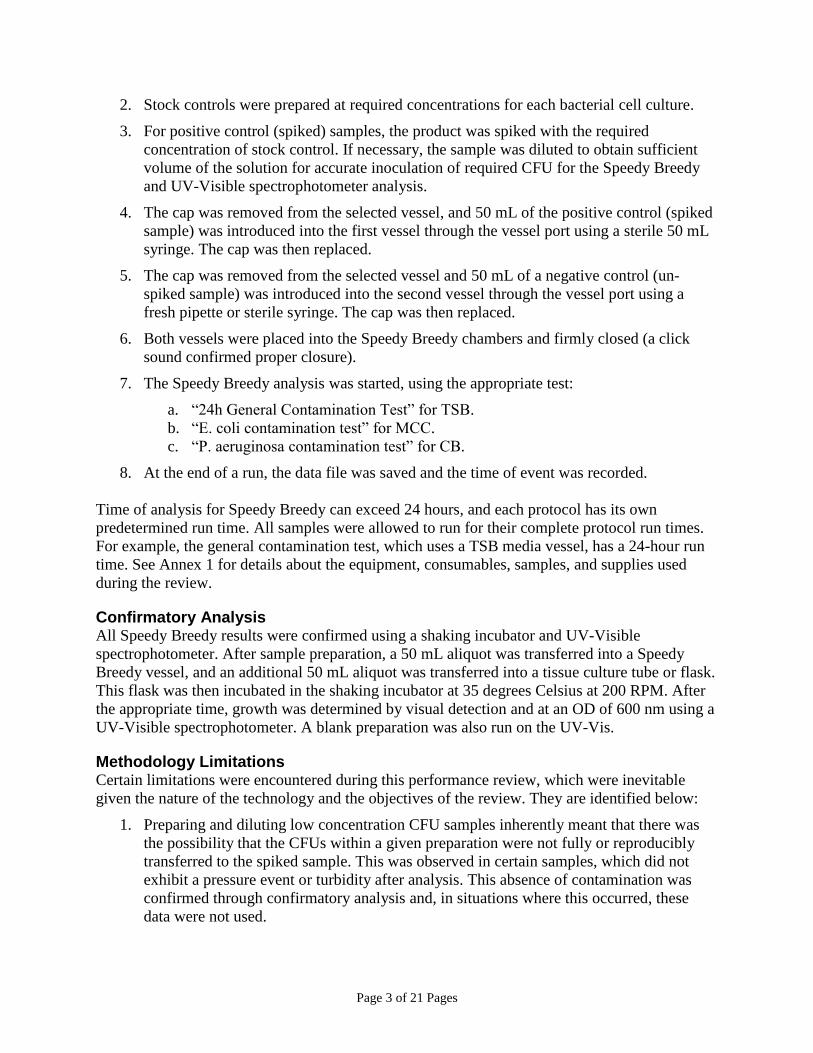
2.2. Performance Evaluation
Acronyms and Definitions
AS1 Artesunate injection medicine 1 CB Cetrimide broth (P. aeruginosa) culture media pellet
CFU Colony forming units MCC MacConkey broth (E. coli) culture media pellet
N Number of runs OXY1 Oxytocin injection medicine 1 TSB Tryptic soy broth media pellet WFI1 Water for injection brand 1 WFI2 Water for injection brand 2
Speedy Breedy Operating Procedure
1. Culture media pellets were allowed to equilibrate to room temperature for 30 minutes.
1 Not provided by vendor.
2 Cost per test was calculated by adding the cost of one media vessel to the cost of one sterile syringe, providing
some margin for the cost of sterile syringe
Page 3 of 21 Pages
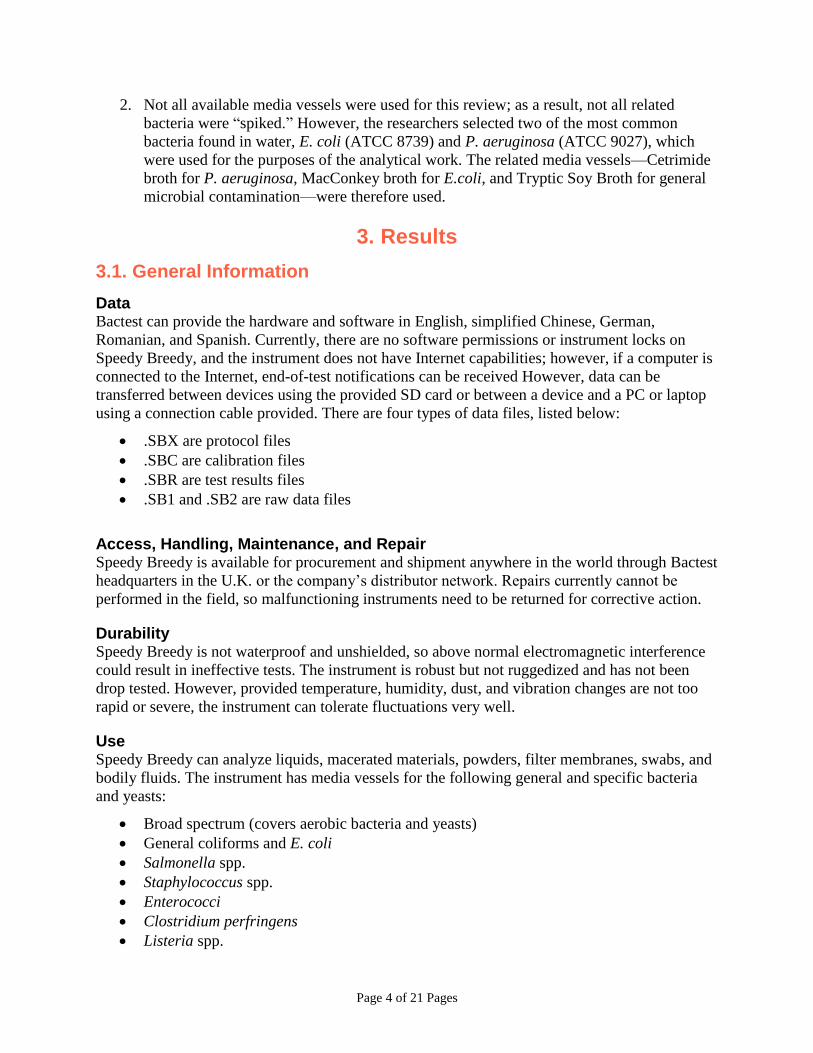
2. Stock controls were prepared at required concentrations for each bacterial cell culture.
3. For positive control (spiked) samples, the product was spiked with the required
concentration of stock control. If necessary, the sample was diluted to obtain sufficient
volume of the solution for accurate inoculation of required CFU for the Speedy Breedy
and UV-Visible spectrophotometer analysis.
4. The cap was removed from the selected vessel, and 50 mL of the positive control (spiked
sample) was introduced into the first vessel through the vessel port using a sterile 50 mL
syringe. The cap was then replaced.
5. The cap was removed from the selected vessel and 50 mL of a negative control (un-
spiked sample) was introduced into the second vessel through the vessel port using a
fresh pipette or sterile syringe. The cap was then replaced.
6. Both vessels were placed into the Speedy Breedy chambers and firmly closed (a click
sound confirmed proper closure).
7. The Speedy Breedy analysis was started, using the appropriate test:
a. “24h General Contamination Test” for TSB.
b. “E. coli contamination test” for MCC.
c. “P. aeruginosa contamination test” for CB.
8. At the end of a run, the data file was saved and the time of event was recorded.
Time of analysis for Speedy Breedy can exceed 24 hours, and each protocol has its own
predetermined run time. All samples were allowed to run for their complete protocol run times.
For example, the general contamination test, which uses a TSB media vessel, has a 24-hour run
time. See Annex 1 for details about the equipment, consumables, samples, and supplies used
during the review.
Confirmatory Analysis All Speedy Breedy results were confirmed using a shaking incubator and UV-Visible
spectrophotometer. After sample preparation, a 50 mL aliquot was transferred into a Speedy
Breedy vessel, and an additional 50 mL aliquot was transferred into a tissue culture tube or flask.
This flask was then incubated in the shaking incubator at 35 degrees Celsius at 200 RPM. After
the appropriate time, growth was determined by visual detection and at an OD of 600 nm using a
UV-Visible spectrophotometer. A blank preparation was also run on the UV-Vis.
Methodology Limitations Certain limitations were encountered during this performance review, which were inevitable
given the nature of the technology and the objectives of the review. They are identified below:
1. Preparing and diluting low concentration CFU samples inherently meant that there was
the possibility that the CFUs within a given preparation were not fully or reproducibly
transferred to the spiked sample. This was observed in certain samples, which did not
exhibit a pressure event or turbidity after analysis. This absence of contamination was
confirmed through confirmatory analysis and, in situations where this occurred, these
data were not used.
Page 4 of 21 Pages
2. Not all available media vessels were used for this review; as a result, not all related
bacteria were “spiked.” However, the researchers selected two of the most common
bacteria found in water, E. coli (ATCC 8739) and P. aeruginosa (ATCC 9027), which
were used for the purposes of the analytical work. The related media vessels—Cetrimide
broth for P. aeruginosa, MacConkey broth for E.coli, and Tryptic Soy Broth for general
microbial contamination—were therefore used.
3. Results
3.1. General Information
Data Bactest can provide the hardware and software in English, simplified Chinese, German,
Romanian, and Spanish. Currently, there are no software permissions or instrument locks on
Speedy Breedy, and the instrument does not have Internet capabilities; however, if a computer is
connected to the Internet, end-of-test notifications can be received However, data can be
transferred between devices using the provided SD card or between a device and a PC or laptop
using a connection cable provided. There are four types of data files, listed below:
.SBX are protocol files
.SBC are calibration files
.SBR are test results files
.SB1 and .SB2 are raw data files
Access, Handling, Maintenance, and Repair Speedy Breedy is available for procurement and shipment anywhere in the world through Bactest
headquarters in the U.K. or the company’s distributor network. Repairs currently cannot be
performed in the field, so malfunctioning instruments need to be returned for corrective action.
Durability Speedy Breedy is not waterproof and unshielded, so above normal electromagnetic interference
could result in ineffective tests. The instrument is robust but not ruggedized and has not been
drop tested. However, provided temperature, humidity, dust, and vibration changes are not too
rapid or severe, the instrument can tolerate fluctuations very well.
Use Speedy Breedy can analyze liquids, macerated materials, powders, filter membranes, swabs, and
bodily fluids. The instrument has media vessels for the following general and specific bacteria
and yeasts:
Broad spectrum (covers aerobic bacteria and yeasts)
General coliforms and E. coli
Salmonella spp.
Staphylococcus spp.
Enterococci
Clostridium perfringens
Listeria spp.
Page 5 of 21 Pages
Pseudomonas aeruginosa
Campylobacter spp.
Toxigenic Vibrio cholera
Lactic Acid bacteria
General and wild yeasts
The performance evaluation did not include evaluation of Speedy Breedy’s ability to detect
anaerobic growth. However, detection of anaerobic growth can be made through the
measurement of a pressure differential, irrespective of whether growth is under aerobic or
anaerobic conditions. Broad spectrum vessels are recommended to be used, which can be made
to be anaerobic. Further details, as well as informational guides, videos, and the latest software,
firmware, protocols, and calibration curves can be found on Bactest’s website:
http://www.speedybreedy.com.
3.2. Performance Evaluation – Application III: Identification of Contaminants or Impurities
All data below were collected between May 2017 and July 2017. Application III is per the USP
Stimuli to the Revision Process: Evaluation of Screening Technologies for Assessing Medicine
Quality [4].
Speedy Breedy is a portable, precision respirometer, which detects and monitors microbial
activity. Detection is observed through pressure transients relating to gaseous exchanges within a
50 mL closed culture vessel as a result of microbial respiration. The instrument uses a motor and
stir bar to mix sample solutions, which creates culture conditions that stimulate growth of
microbes. This growth facilitates the conversion of gaseous exchange into pressure variances in
the headspace of the culture vessel, which are subsequently measured and recorded and can be
visualized on a computer using the instrument software. If the variance exceeds the noise
threshold defined by a given protocol linked to a particular media pellet measured in pressure
change over time (typically more than 0.1 mbar per minute for at least 7 minutes), it is
recognized as a pressure event, which signifies contamination.
Analysis Conditions Table 2 summarizes the various products that were used as samples and analyzed and highlights
the number of runs that were performed under each condition, the media pellet that was used,
and whether or not an event was observed for those samples that were spiked.
Negative controls were prepared in parallel with all conditions, and no negative control samples
had pressure events.
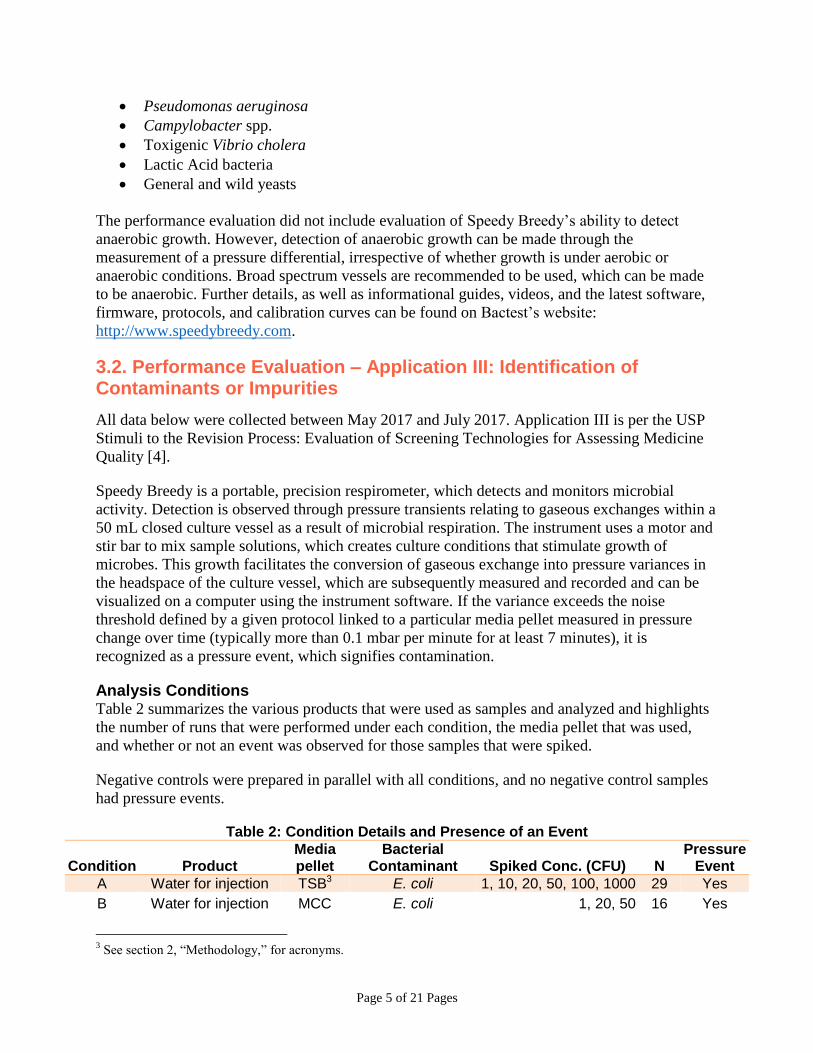
Table 2: Condition Details and Presence of an Event
Condition Product Media pellet
Bacterial Contaminant Spiked Conc. (CFU) N
Pressure Event
A Water for injection TSB3 E. coli 1, 10, 20, 50, 100, 1000 29 Yes
B Water for injection MCC E. coli 1, 20, 50 16 Yes
3 See section 2, “Methodology,” for acronyms.
Page 6 of 21 Pages
C Water for injection CB P. aeruginosa 1, 20, 50 3 Yes
D Oxytocin injection CB P. aeruginosa 20 5 Yes
E Oxytocin injection TSB E. coli 20 1 Yes
F Artesunate injection TSB E.coli 20 1 Yes
G Artesunate injection CB P. aeruginosa 20 1 Yes
Reproducibility and Reliability Table 3 provides statistical data of the samples that were run under condition A.
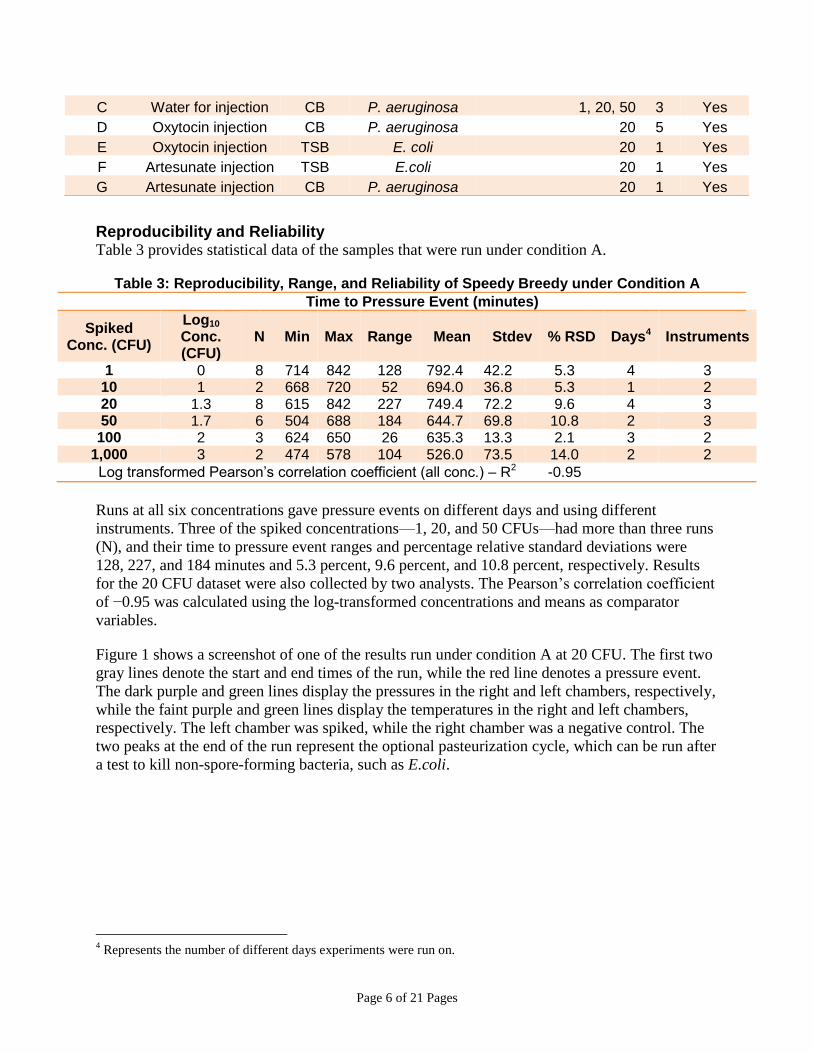
Table 3: Reproducibility, Range, and Reliability of Speedy Breedy under Condition A
Time to Pressure Event (minutes)
Spiked Conc. (CFU)
Log10 Conc. (CFU)
N Min Max Range Mean Stdev % RSD Days4 Instruments
1 0 8 714 842 128 792.4 42.2 5.3 4 3 10 1 2 668 720 52 694.0 36.8 5.3 1 2 20 1.3 8 615 842 227 749.4 72.2 9.6 4 3 50 1.7 6 504 688 184 644.7 69.8 10.8 2 3 100 2 3 624 650 26 635.3 13.3 2.1 3 2
1,000 3 2 474 578 104 526.0 73.5 14.0 2 2
Log transformed Pearson’s correlation coefficient (all conc.) – R2 -0.95
Runs at all six concentrations gave pressure events on different days and using different
instruments. Three of the spiked concentrations—1, 20, and 50 CFUs—had more than three runs
(N), and their time to pressure event ranges and percentage relative standard deviations were
128, 227, and 184 minutes and 5.3 percent, 9.6 percent, and 10.8 percent, respectively. Results
for the 20 CFU dataset were also collected by two analysts. The Pearson’s correlation coefficient
of −0.95 was calculated using the log-transformed concentrations and means as comparator
variables.
Figure 1 shows a screenshot of one of the results run under condition A at 20 CFU. The first two
gray lines denote the start and end times of the run, while the red line denotes a pressure event.
The dark purple and green lines display the pressures in the right and left chambers, respectively,
while the faint purple and green lines display the temperatures in the right and left chambers,
respectively. The left chamber was spiked, while the right chamber was a negative control. The
two peaks at the end of the run represent the optional pasteurization cycle, which can be run after
a test to kill non-spore-forming bacteria, such as E.coli.
4 Represents the number of different days experiments were run on.
Page 7 of 21 Pages
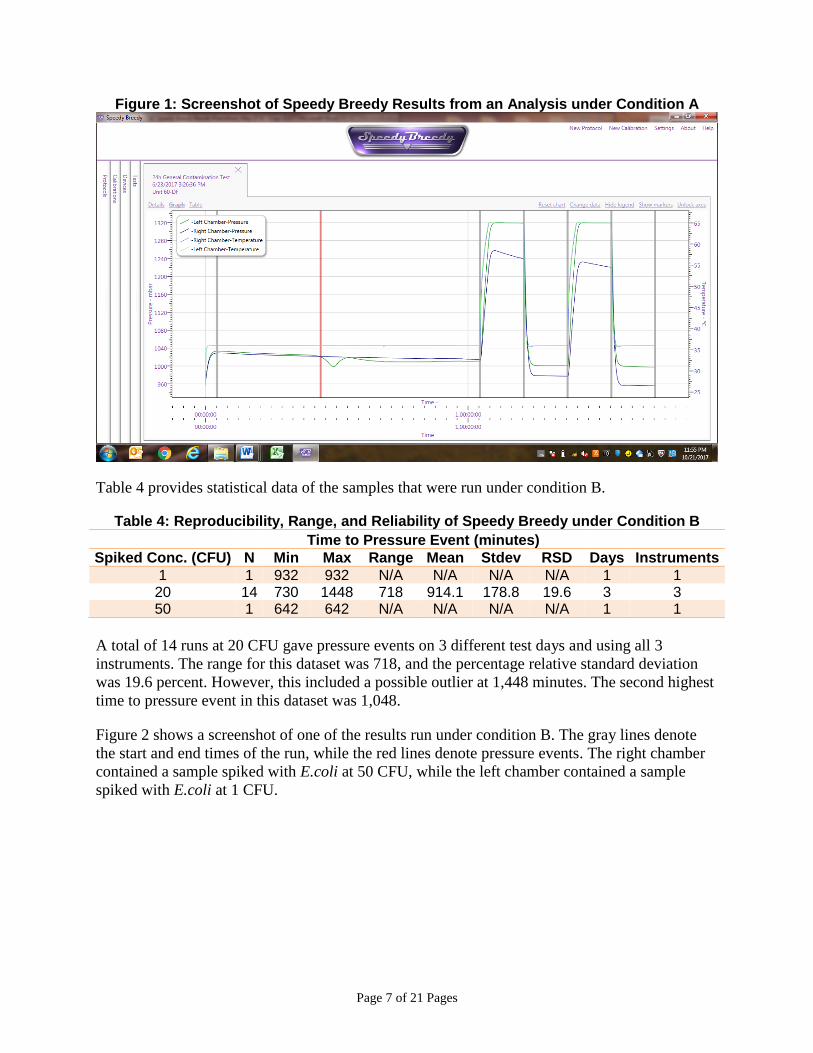
Figure 1: Screenshot of Speedy Breedy Results from an Analysis under Condition A
Table 4 provides statistical data of the samples that were run under condition B.
Table 4: Reproducibility, Range, and Reliability of Speedy Breedy under Condition B
Time to Pressure Event (minutes)
Spiked Conc. (CFU) N Min Max Range Mean Stdev RSD Days Instruments
1 1 932 932 N/A N/A N/A N/A 1 1 20 14 730 1448 718 914.1 178.8 19.6 3 3 50 1 642 642 N/A N/A N/A N/A 1 1
A total of 14 runs at 20 CFU gave pressure events on 3 different test days and using all 3
instruments. The range for this dataset was 718, and the percentage relative standard deviation
was 19.6 percent. However, this included a possible outlier at 1,448 minutes. The second highest
time to pressure event in this dataset was 1,048.
Figure 2 shows a screenshot of one of the results run under condition B. The gray lines denote
the start and end times of the run, while the red lines denote pressure events. The right chamber
contained a sample spiked with E.coli at 50 CFU, while the left chamber contained a sample
spiked with E.coli at 1 CFU.
Page 8 of 21 Pages
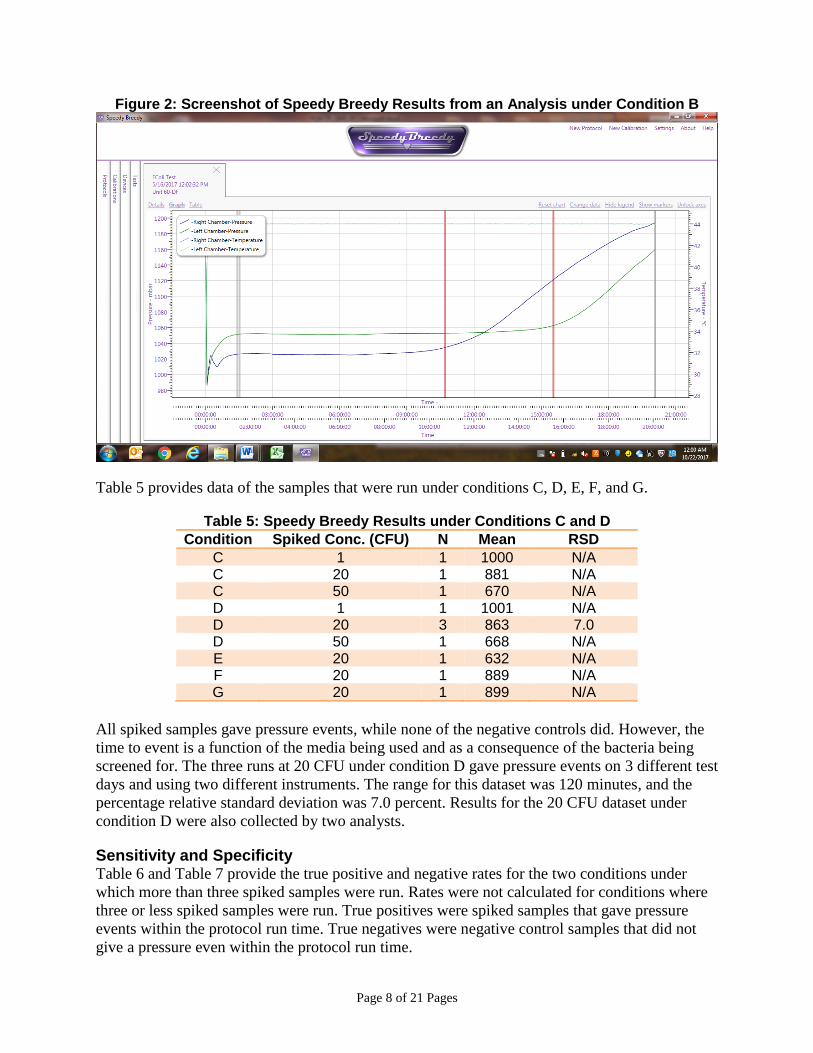
Figure 2: Screenshot of Speedy Breedy Results from an Analysis under Condition B
Table 5 provides data of the samples that were run under conditions C, D, E, F, and G.
Table 5: Speedy Breedy Results under Conditions C and D
Condition Spiked Conc. (CFU) N Mean RSD
C 1 1 1000 N/A C 20 1 881 N/A C 50 1 670 N/A D 1 1 1001 N/A D 20 3 863 7.0 D 50 1 668 N/A E 20 1 632 N/A F 20 1 889 N/A G 20 1 899 N/A
All spiked samples gave pressure events, while none of the negative controls did. However, the
time to event is a function of the media being used and as a consequence of the bacteria being
screened for. The three runs at 20 CFU under condition D gave pressure events on 3 different test
days and using two different instruments. The range for this dataset was 120 minutes, and the
percentage relative standard deviation was 7.0 percent. Results for the 20 CFU dataset under
condition D were also collected by two analysts.
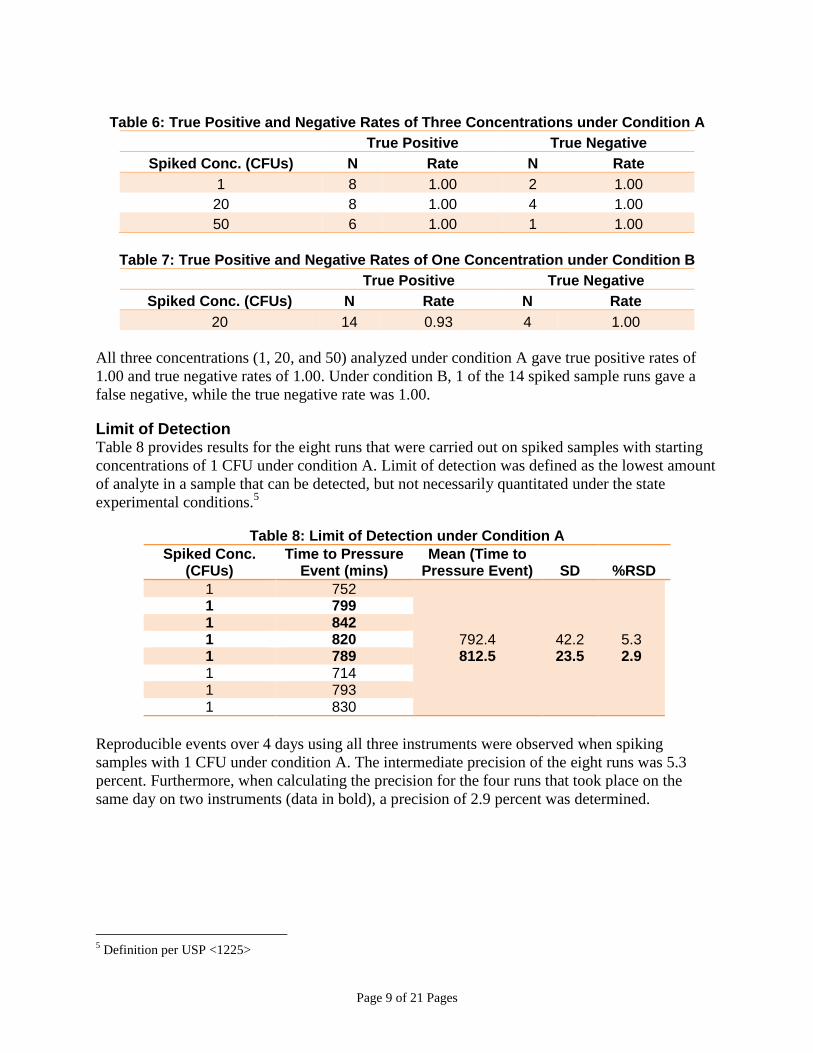
Sensitivity and Specificity Table 6 and Table 7 provide the true positive and negative rates for the two conditions under
which more than three spiked samples were run. Rates were not calculated for conditions where
three or less spiked samples were run. True positives were spiked samples that gave pressure
events within the protocol run time. True negatives were negative control samples that did not
give a pressure even within the protocol run time.
Page 9 of 21 Pages
Table 6: True Positive and Negative Rates of Three Concentrations under Condition A
True Positive True Negative
Spiked Conc. (CFUs) N Rate N Rate
1 8 1.00 2 1.00
20 8 1.00 4 1.00
50 6 1.00 1 1.00
Table 7: True Positive and Negative Rates of One Concentration under Condition B
True Positive True Negative
Spiked Conc. (CFUs) N Rate N Rate
20 14 0.93 4 1.00
All three concentrations (1, 20, and 50) analyzed under condition A gave true positive rates of
1.00 and true negative rates of 1.00. Under condition B, 1 of the 14 spiked sample runs gave a
false negative, while the true negative rate was 1.00.
Limit of Detection Table 8 provides results for the eight runs that were carried out on spiked samples with starting
concentrations of 1 CFU under condition A. Limit of detection was defined as the lowest amount
of analyte in a sample that can be detected, but not necessarily quantitated under the state
experimental conditions.5
Table 8: Limit of Detection under Condition A
Spiked Conc. (CFUs)
Time to Pressure Event (mins)
Mean (Time to Pressure Event) SD %RSD
1 752
792.4 812.5
42.2 23.5
5.3 2.9
1 799 1 842 1 820 1 789 1 714 1 793 1 830
Reproducible events over 4 days using all three instruments were observed when spiking
samples with 1 CFU under condition A. The intermediate precision of the eight runs was 5.3
percent. Furthermore, when calculating the precision for the four runs that took place on the
same day on two instruments (data in bold), a precision of 2.9 percent was determined.
5 Definition per USP <1225>
Page 10 of 21 Pages
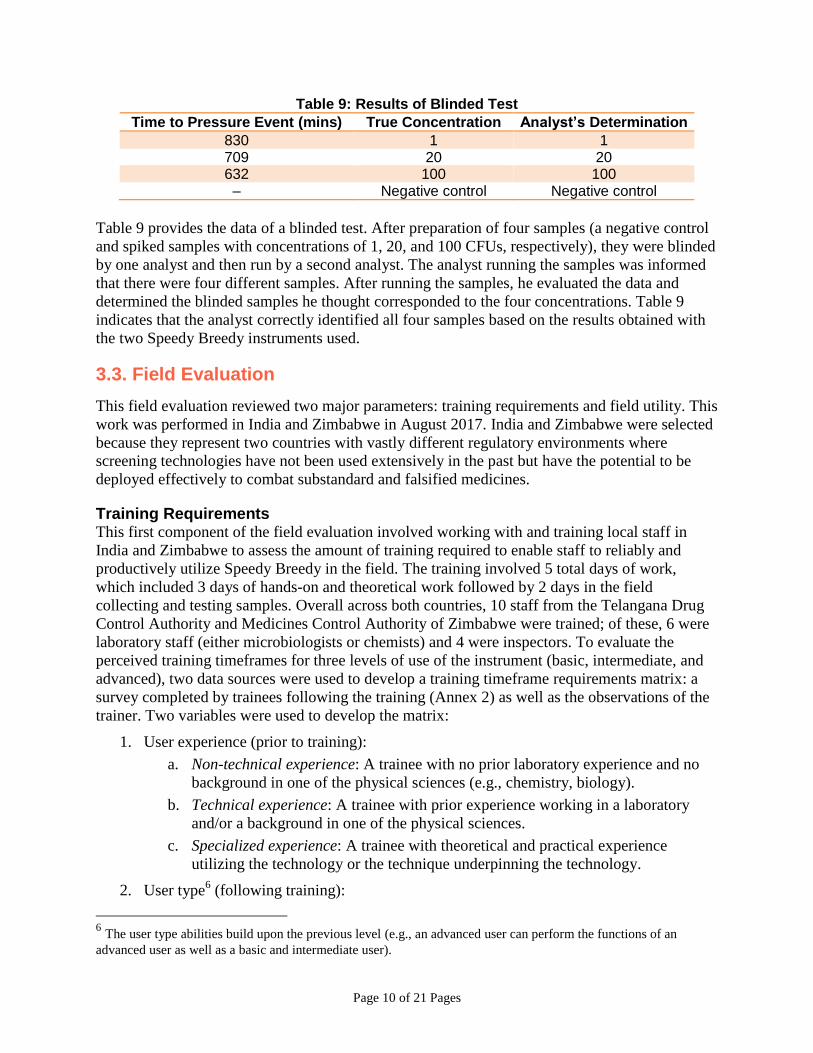
Table 9: Results of Blinded Test
Time to Pressure Event (mins) True Concentration Analyst’s Determination
830 1 1 709 20 20 632 100 100 – Negative control Negative control
Table 9 provides the data of a blinded test. After preparation of four samples (a negative control
and spiked samples with concentrations of 1, 20, and 100 CFUs, respectively), they were blinded
by one analyst and then run by a second analyst. The analyst running the samples was informed
that there were four different samples. After running the samples, he evaluated the data and
determined the blinded samples he thought corresponded to the four concentrations. Table 9
indicates that the analyst correctly identified all four samples based on the results obtained with
the two Speedy Breedy instruments used.
3.3. Field Evaluation
This field evaluation reviewed two major parameters: training requirements and field utility. This
work was performed in India and Zimbabwe in August 2017. India and Zimbabwe were selected
because they represent two countries with vastly different regulatory environments where
screening technologies have not been used extensively in the past but have the potential to be
deployed effectively to combat substandard and falsified medicines.
Training Requirements This first component of the field evaluation involved working with and training local staff in
India and Zimbabwe to assess the amount of training required to enable staff to reliably and
productively utilize Speedy Breedy in the field. The training involved 5 total days of work,
which included 3 days of hands-on and theoretical work followed by 2 days in the field
collecting and testing samples. Overall across both countries, 10 staff from the Telangana Drug
Control Authority and Medicines Control Authority of Zimbabwe were trained; of these, 6 were
laboratory staff (either microbiologists or chemists) and 4 were inspectors. To evaluate the
perceived training timeframes for three levels of use of the instrument (basic, intermediate, and
advanced), two data sources were used to develop a training timeframe requirements matrix: a
survey completed by trainees following the training (Annex 2) as well as the observations of the
trainer. Two variables were used to develop the matrix:
1. User experience (prior to training):
a. Non-technical experience: A trainee with no prior laboratory experience and no
background in one of the physical sciences (e.g., chemistry, biology).
b. Technical experience: A trainee with prior experience working in a laboratory
and/or a background in one of the physical sciences.
c. Specialized experience: A trainee with theoretical and practical experience
utilizing the technology or the technique underpinning the technology.
2. User type6 (following training):
6 The user type abilities build upon the previous level (e.g., an advanced user can perform the functions of an
advanced user as well as a basic and intermediate user).
Page 11 of 21 Pages
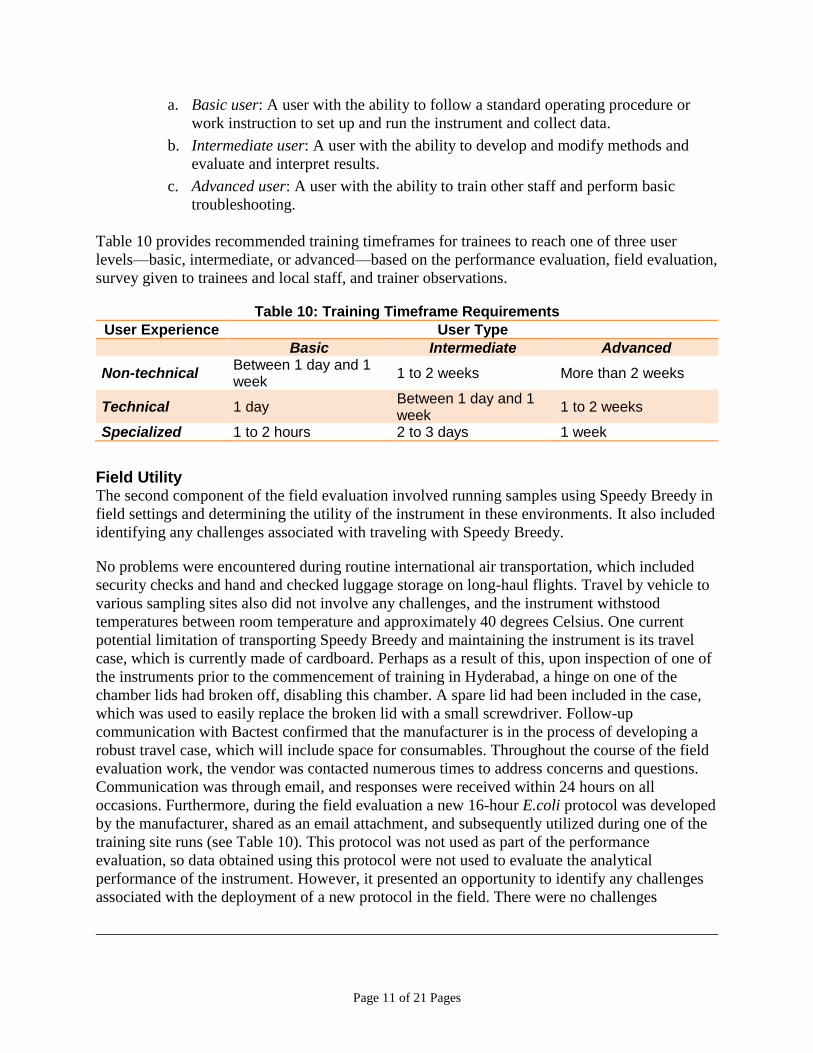
a. Basic user: A user with the ability to follow a standard operating procedure or
work instruction to set up and run the instrument and collect data.
b. Intermediate user: A user with the ability to develop and modify methods and
evaluate and interpret results.
c. Advanced user: A user with the ability to train other staff and perform basic
troubleshooting.
Table 10 provides recommended training timeframes for trainees to reach one of three user
levels—basic, intermediate, or advanced—based on the performance evaluation, field evaluation,
survey given to trainees and local staff, and trainer observations.
Table 10: Training Timeframe Requirements
User Experience User Type
Basic Intermediate Advanced
Non-technical Between 1 day and 1 week
1 to 2 weeks More than 2 weeks
Technical 1 day Between 1 day and 1 week
1 to 2 weeks
Specialized 1 to 2 hours 2 to 3 days 1 week
Field Utility The second component of the field evaluation involved running samples using Speedy Breedy in
field settings and determining the utility of the instrument in these environments. It also included
identifying any challenges associated with traveling with Speedy Breedy.
No problems were encountered during routine international air transportation, which included
security checks and hand and checked luggage storage on long-haul flights. Travel by vehicle to
various sampling sites also did not involve any challenges, and the instrument withstood
temperatures between room temperature and approximately 40 degrees Celsius. One current
potential limitation of transporting Speedy Breedy and maintaining the instrument is its travel
case, which is currently made of cardboard. Perhaps as a result of this, upon inspection of one of
the instruments prior to the commencement of training in Hyderabad, a hinge on one of the
chamber lids had broken off, disabling this chamber. A spare lid had been included in the case,
which was used to easily replace the broken lid with a small screwdriver. Follow-up
communication with Bactest confirmed that the manufacturer is in the process of developing a
robust travel case, which will include space for consumables. Throughout the course of the field
evaluation work, the vendor was contacted numerous times to address concerns and questions.
Communication was through email, and responses were received within 24 hours on all
occasions. Furthermore, during the field evaluation a new 16-hour E.coli protocol was developed
by the manufacturer, shared as an email attachment, and subsequently utilized during one of the
training site runs (see Table 10). This protocol was not used as part of the performance
evaluation, so data obtained using this protocol were not used to evaluate the analytical
performance of the instrument. However, it presented an opportunity to identify any challenges
associated with the deployment of a new protocol in the field. There were no challenges
Page 12 of 21 Pages
encountered either in uploading the new protocol remotely or subsequently utilizing it for sample
analysis.
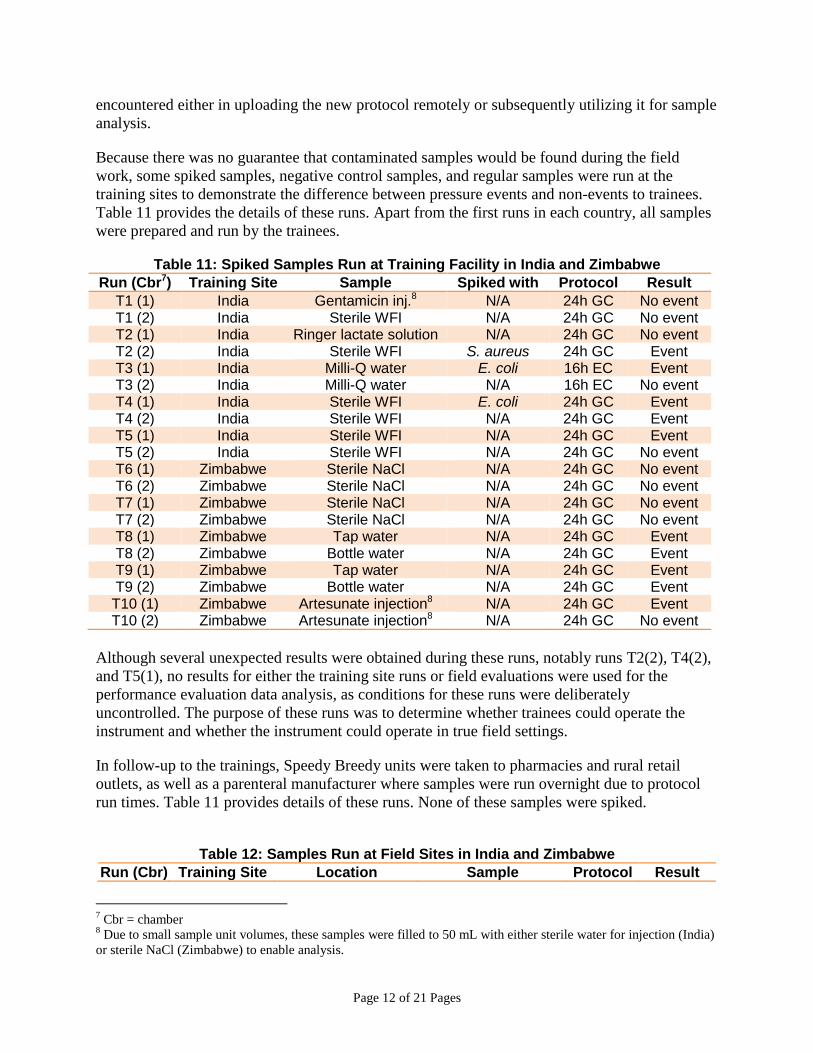
Because there was no guarantee that contaminated samples would be found during the field
work, some spiked samples, negative control samples, and regular samples were run at the
training sites to demonstrate the difference between pressure events and non-events to trainees.
Table 11 provides the details of these runs. Apart from the first runs in each country, all samples
were prepared and run by the trainees.
Table 11: Spiked Samples Run at Training Facility in India and Zimbabwe
Run (Cbr7) Training Site Sample Spiked with Protocol Result
T1 (1) India Gentamicin inj.8 N/A 24h GC No event T1 (2) India Sterile WFI N/A 24h GC No event T2 (1) India Ringer lactate solution N/A 24h GC No event T2 (2) India Sterile WFI S. aureus 24h GC Event T3 (1) India Milli-Q water E. coli 16h EC Event T3 (2) India Milli-Q water N/A 16h EC No event T4 (1) India Sterile WFI E. coli 24h GC Event T4 (2) India Sterile WFI N/A 24h GC Event T5 (1) India Sterile WFI N/A 24h GC Event T5 (2) India Sterile WFI N/A 24h GC No event T6 (1) Zimbabwe Sterile NaCl N/A 24h GC No event T6 (2) Zimbabwe Sterile NaCl N/A 24h GC No event T7 (1) Zimbabwe Sterile NaCl N/A 24h GC No event T7 (2) Zimbabwe Sterile NaCl N/A 24h GC No event T8 (1) Zimbabwe Tap water N/A 24h GC Event T8 (2) Zimbabwe Bottle water N/A 24h GC Event T9 (1) Zimbabwe Tap water N/A 24h GC Event T9 (2) Zimbabwe Bottle water N/A 24h GC Event T10 (1) Zimbabwe Artesunate injection8 N/A 24h GC Event T10 (2) Zimbabwe Artesunate injection8 N/A 24h GC No event
Although several unexpected results were obtained during these runs, notably runs T2(2), T4(2),
and T5(1), no results for either the training site runs or field evaluations were used for the
performance evaluation data analysis, as conditions for these runs were deliberately
uncontrolled. The purpose of these runs was to determine whether trainees could operate the
instrument and whether the instrument could operate in true field settings.
In follow-up to the trainings, Speedy Breedy units were taken to pharmacies and rural retail
outlets, as well as a parenteral manufacturer where samples were run overnight due to protocol
run times. Table 11 provides details of these runs. None of these samples were spiked.
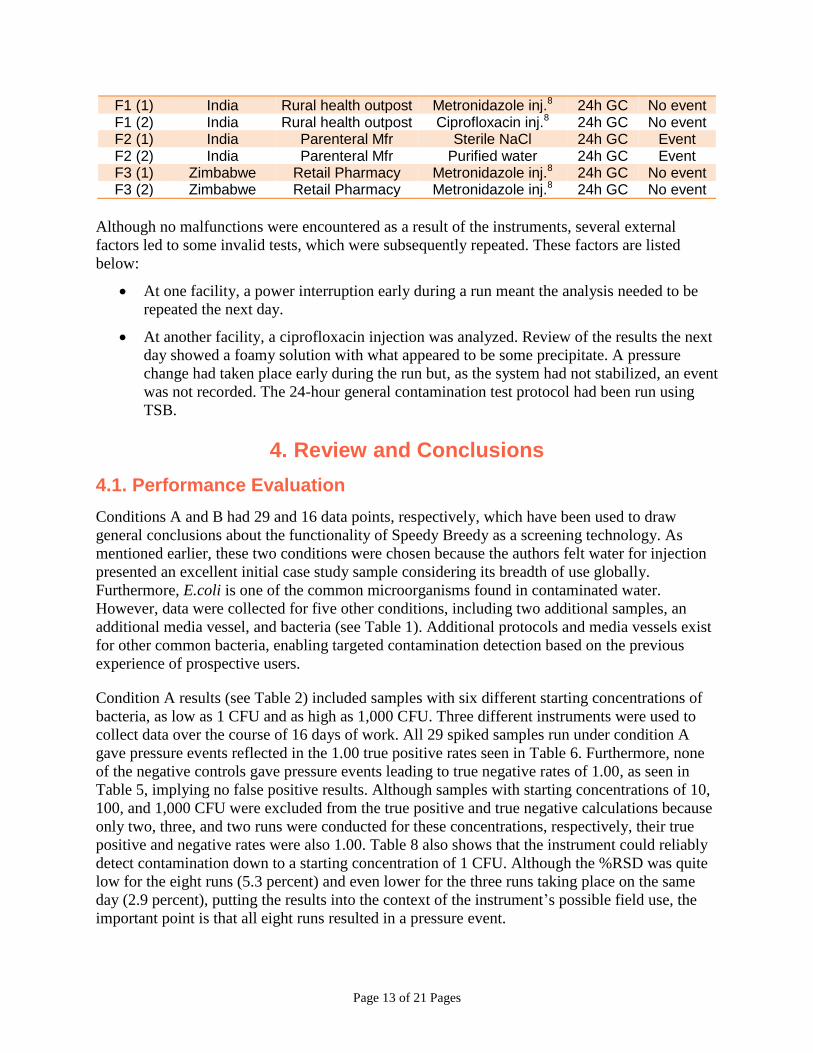
Table 12: Samples Run at Field Sites in India and Zimbabwe
Run (Cbr) Training Site Location Sample Protocol Result
7 Cbr = chamber
8 Due to small sample unit volumes, these samples were filled to 50 mL with either sterile water for injection (India)
or sterile NaCl (Zimbabwe) to enable analysis.
Page 13 of 21 Pages
F1 (1) India Rural health outpost Metronidazole inj.8 24h GC No event F1 (2) India Rural health outpost Ciprofloxacin inj.8 24h GC No event F2 (1) India Parenteral Mfr Sterile NaCl 24h GC Event F2 (2) India Parenteral Mfr Purified water 24h GC Event F3 (1) Zimbabwe Retail Pharmacy Metronidazole inj.8 24h GC No event F3 (2) Zimbabwe Retail Pharmacy Metronidazole inj.8 24h GC No event
Although no malfunctions were encountered as a result of the instruments, several external
factors led to some invalid tests, which were subsequently repeated. These factors are listed
below:
At one facility, a power interruption early during a run meant the analysis needed to be
repeated the next day.
At another facility, a ciprofloxacin injection was analyzed. Review of the results the next
day showed a foamy solution with what appeared to be some precipitate. A pressure
change had taken place early during the run but, as the system had not stabilized, an event
was not recorded. The 24-hour general contamination test protocol had been run using
TSB.
4. Review and Conclusions
4.1. Performance Evaluation
Conditions A and B had 29 and 16 data points, respectively, which have been used to draw
general conclusions about the functionality of Speedy Breedy as a screening technology. As
mentioned earlier, these two conditions were chosen because the authors felt water for injection
presented an excellent initial case study sample considering its breadth of use globally.
Furthermore, E.coli is one of the common microorganisms found in contaminated water.
However, data were collected for five other conditions, including two additional samples, an
additional media vessel, and bacteria (see Table 1). Additional protocols and media vessels exist
for other common bacteria, enabling targeted contamination detection based on the previous
experience of prospective users.
Condition A results (see Table 2) included samples with six different starting concentrations of
bacteria, as low as 1 CFU and as high as 1,000 CFU. Three different instruments were used to
collect data over the course of 16 days of work. All 29 spiked samples run under condition A
gave pressure events reflected in the 1.00 true positive rates seen in Table 6. Furthermore, none
of the negative controls gave pressure events leading to true negative rates of 1.00, as seen in
Table 5, implying no false positive results. Although samples with starting concentrations of 10,
100, and 1,000 CFU were excluded from the true positive and true negative calculations because
only two, three, and two runs were conducted for these concentrations, respectively, their true
positive and negative rates were also 1.00. Table 8 also shows that the instrument could reliably
detect contamination down to a starting concentration of 1 CFU. Although the %RSD was quite
low for the eight runs (5.3 percent) and even lower for the three runs taking place on the same
day (2.9 percent), putting the results into the context of the instrument’s possible field use, the
important point is that all eight runs resulted in a pressure event.
Page 14 of 21 Pages
Condition B results (see Table 4) included samples with three different starting concentrations of
bacteria; 1, 20, and 50 CFU. Only one run was conducted for starting concentrations of 1 and 50
CFU. However, three different instruments were used to collect data over the course of 3 days of
work at the starting concentration of 20 CFU. Under condition B, 13 of the 14 runs gave pressure
events, reflecting a true positive rate of 0.93. None of the negative controls gave pressure events.
This analysis indicates that Speedy Breedy seems to reliably and reproducibly detect various
level of E.coli contamination in water for injection using the MCC and TSB media vessels.
A review of the quantitative capabilities of the instrument was not performed, as any detectable
contamination in a sterile product means it is no longer sterile. However, the Pearson’s
correlation coefficient (R2) was calculated using the data collected under condition A (see Table
3) and gave an R2 of −0.95. These data indicate that there is a linear inverse relationship between
the log-transformed amount of contamination and the time to detection. These data, coupled with
the low %RSDs seen for those samples run at least six times under condition A, provide some
basis for the possibility that semi-quantitative protocols could be developed in situations where
knowledge of the concentration of contamination is needed.
Of the four remaining conditions, under which data were collected, only the 20 CFU starting
concentration for condition D had more than one result. However, each of the spiked samples for
conditions C, E, F, and G, including those of condition D, gave a pressure event, and no pressure
event was observed for any of the negative controls; this indicates that at least two additional
sample matrices do not seem to inhibit the ability of Speedy Breedy to detect contamination.
Lastly, to mimic what a user would encounter in the field, one analyst was given four blinded
samples to analyze (see Table 9); three of these were contaminated (at starting concentrations of
1, 20, and 50 CFU), and one was not. Using the results, the analyst was able not only to identify
the three contaminated samples but also to correctly identify their relative concentrations based
on their times to detection.
4.2. Field Evaluation
Based on feedback from trainees and the ongoing observations of the trainer, the training
required to become a basic, intermediate or advanced user of the instrument was manageable.
More specifically, a variety of staff with both technical and non-technical backgrounds can
become either basic, intermediate or advanced users within approximately 2 weeks of training.
The software was easy to download onto a PC and intuitive to use. Additional work by Bactest
could assess the feasibility of developing a smartphone application to enhance the field utility of
the instrument. Furthermore, as advanced users continue to refine their deployment of Speedy
Breedy, and in environments where the supply chain is a particular challenge, users can develop
their own media using empty aerobic or anaerobic vessels. Protocols include the option of a
pasteurization cycle, which increases the heat of the vessels to 65 degrees Celsius for several
hours post-run, ostensibly killing any non-spore-forming bacteria within a sample, aiding in the
disposal of the media. Particularly in field settings where biological waste containers may not be
available, this is a very useful feature. It is important to note, however, that the pasteurization
cycle does not kill spore-forming bacteria or extreme thermophiles. Vessels must still be
disposed of according to local regulations.
Page 15 of 21 Pages
Although Bactest has 43 distributors globally, currently there are only 2 in low- or low-middle-
income countries. This could present problems particularly in countries where shipping and
import delays are common. However, media vessels and an instrument were shipped from
Bactest headquarters to Zimbabwe in preparation for the field evaluation and arrived within a
week of the order being confirmed. Furthermore, the technical support provided by Bactest
during the field evaluation was prompt and efficient.
Some challenges were encountered during the field evaluation. The existing carry case is made
of cardboard and not particularly sturdy, which could limit the lifespan of the instrument if it is
being used in challenging environments. Moving forward, a pelican case would help preserve the
integrity of the instrument and may perhaps have prevented one of the chamber lids from
breaking. Additionally, at this stage, media vessels do not have a mark identifying where 50 mL
of solution is. This would be particularly useful in situations where graduated syringes are not
available or samples are transferred directly into vessels. Related to this, vessels are currently
only available in 50 mL volumes. For small volume samples, this presents both an opportunity
and a challenge. It provides the potential for pooling samples, for example combining 10 5-mL
injectable samples to increase throughput in each chamber. If an event is detected, then the
samples can be broken into smaller sample sets to ultimately identify the contaminated product.
However, decreasing the number of samples being run decreases the total volume in a vessel for
a run, which currently needs to be 50 mL. Researching the possibility of developing smaller
volume vessels would allow users to customize their systems. For example, hospital pharmacies
working predominantly with 1-L sterile saline bags would have no problem using the current 50-
mL vessels. However, inspectors working in rural areas, where the samples in a health outlet are
limited and generally small, volume injectables could use smaller volume vessels rather than
risking a false positive by filling the sample to volume with bottled water.
Although unavoidable, the run time of protocols does limit the effectiveness of the instrument in
true field settings where reliable power may not exist even though analysis times are
significantly shorter than current confirmatory sterility testing procedures. This was reiterated by
several trainees, one of whom suggested “a rechargeable battery or solar power source” as a
solution. The current configuration of only two chambers also limits the sample throughput of
the instrument. However, sample pooling is one possible solution to mitigate this limitation, and
increasing the number of chambers would commensurately increase the footprint of the
instrument, which currently is small, light, and easy to transport.
Page 16 of 21 Pages
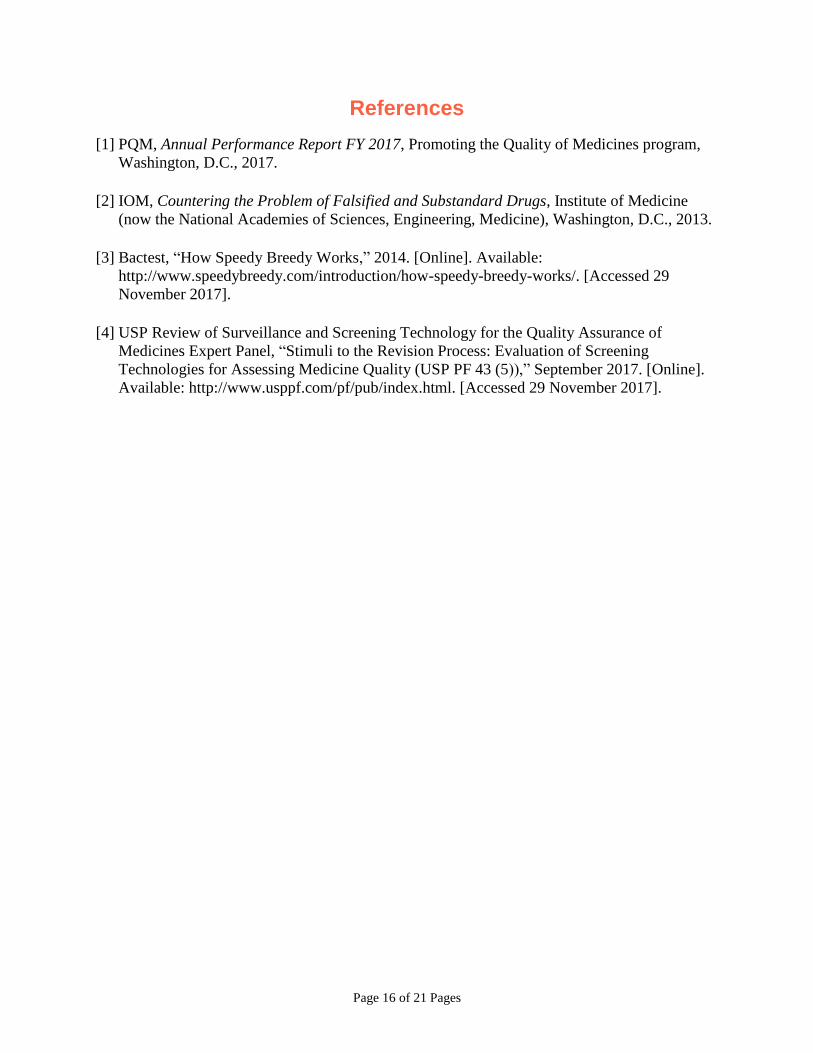
References
[1] PQM, Annual Performance Report FY 2017, Promoting the Quality of Medicines program,
Washington, D.C., 2017.
[2] IOM, Countering the Problem of Falsified and Substandard Drugs, Institute of Medicine
(now the National Academies of Sciences, Engineering, Medicine), Washington, D.C., 2013.
[3] Bactest, “How Speedy Breedy Works,” 2014. [Online]. Available:
http://www.speedybreedy.com/introduction/how-speedy-breedy-works/. [Accessed 29
November 2017].
[4] USP Review of Surveillance and Screening Technology for the Quality Assurance of
Medicines Expert Panel, “Stimuli to the Revision Process: Evaluation of Screening
Technologies for Assessing Medicine Quality (USP PF 43 (5)),” September 2017. [Online].
Available: http://www.usppf.com/pf/pub/index.html. [Accessed 29 November 2017].
Page 17 of 21 Pages
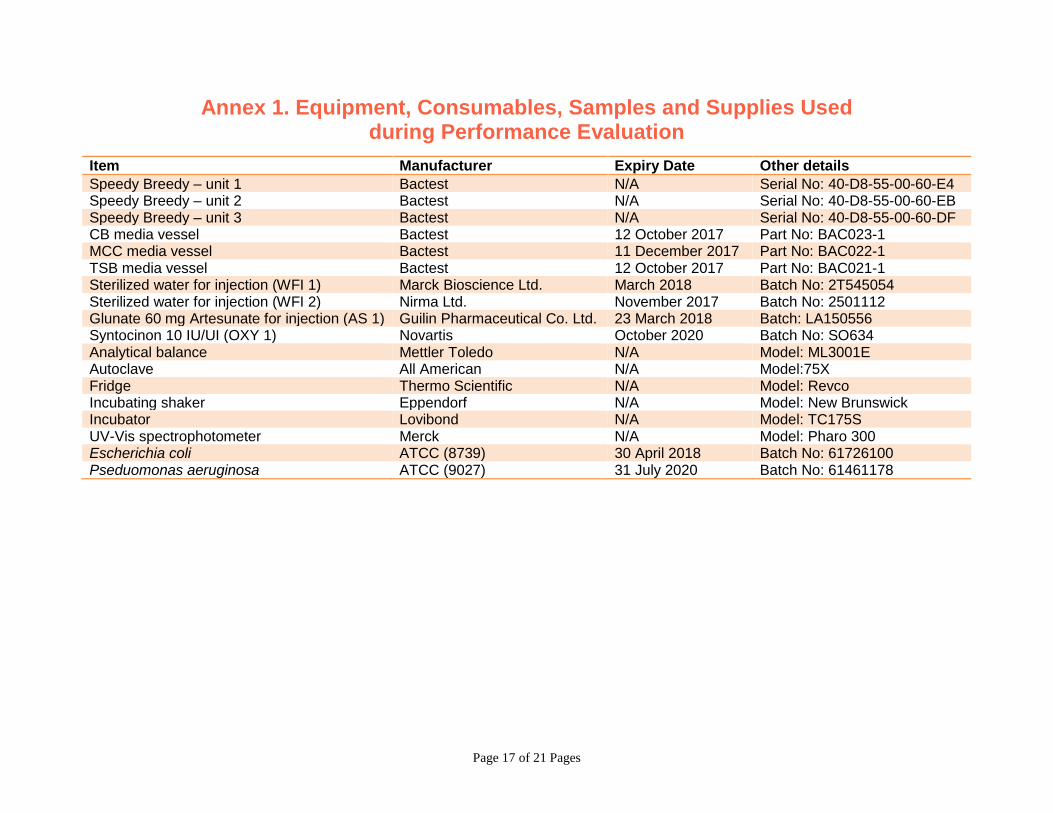
Annex 1. Equipment, Consumables, Samples and Supplies Used during Performance Evaluation
Item Manufacturer Expiry Date Other details
Speedy Breedy – unit 1 Bactest N/A Serial No: 40-D8-55-00-60-E4 Speedy Breedy – unit 2 Bactest N/A Serial No: 40-D8-55-00-60-EB Speedy Breedy – unit 3 Bactest N/A Serial No: 40-D8-55-00-60-DF CB media vessel Bactest 12 October 2017 Part No: BAC023-1 MCC media vessel Bactest 11 December 2017 Part No: BAC022-1 TSB media vessel Bactest 12 October 2017 Part No: BAC021-1 Sterilized water for injection (WFI 1) Marck Bioscience Ltd. March 2018 Batch No: 2T545054 Sterilized water for injection (WFI 2) Nirma Ltd. November 2017 Batch No: 2501112 Glunate 60 mg Artesunate for injection (AS 1) Guilin Pharmaceutical Co. Ltd. 23 March 2018 Batch: LA150556 Syntocinon 10 IU/UI (OXY 1) Novartis October 2020 Batch No: SO634 Analytical balance Mettler Toledo N/A Model: ML3001E Autoclave All American N/A Model:75X Fridge Thermo Scientific N/A Model: Revco Incubating shaker Eppendorf N/A Model: New Brunswick Incubator Lovibond N/A Model: TC175S UV-Vis spectrophotometer Merck N/A Model: Pharo 300 Escherichia coli ATCC (8739) 30 April 2018 Batch No: 61726100 Pseduomonas aeruginosa ATCC (9027) 31 July 2020 Batch No: 61461178
Page 18 of 21 Pages
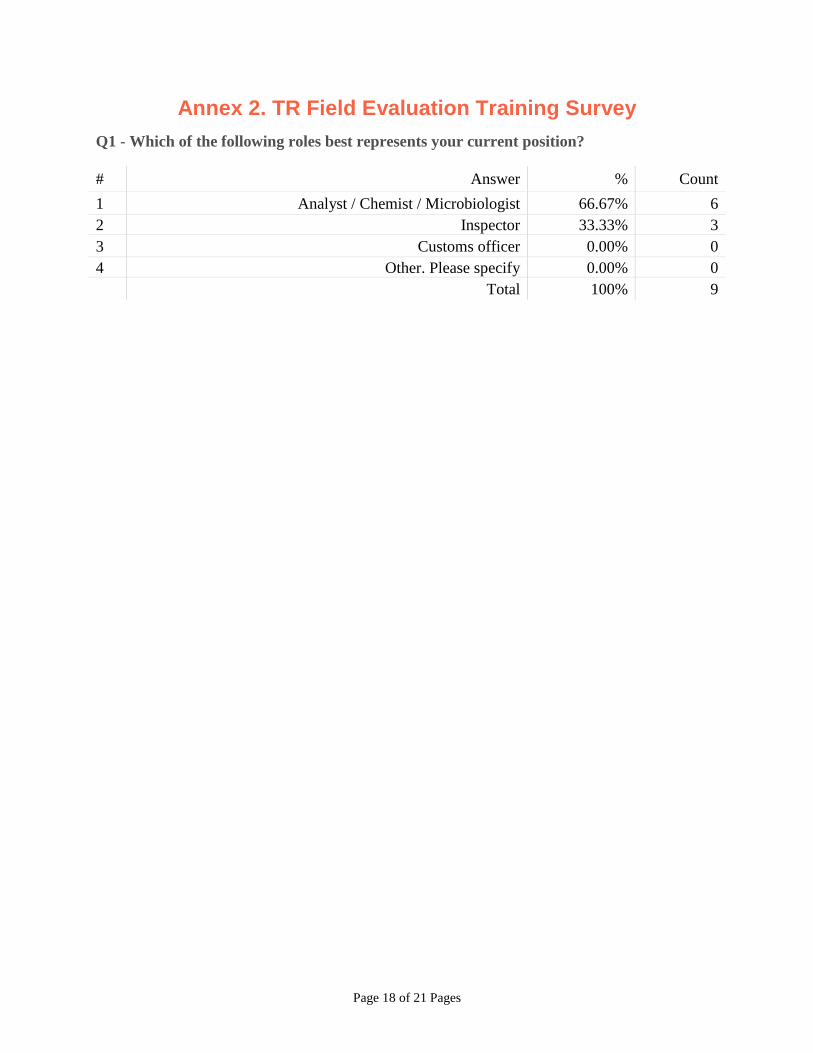
Annex 2. TR Field Evaluation Training Survey
Q1 - Which of the following roles best represents your current position?
# Answer % Count
1 Analyst / Chemist / Microbiologist 66.67% 6
2 Inspector 33.33% 3
3 Customs officer 0.00% 0
4 Other. Please specify 0.00% 0
Total 100% 9
Page 19 of 21 Pages
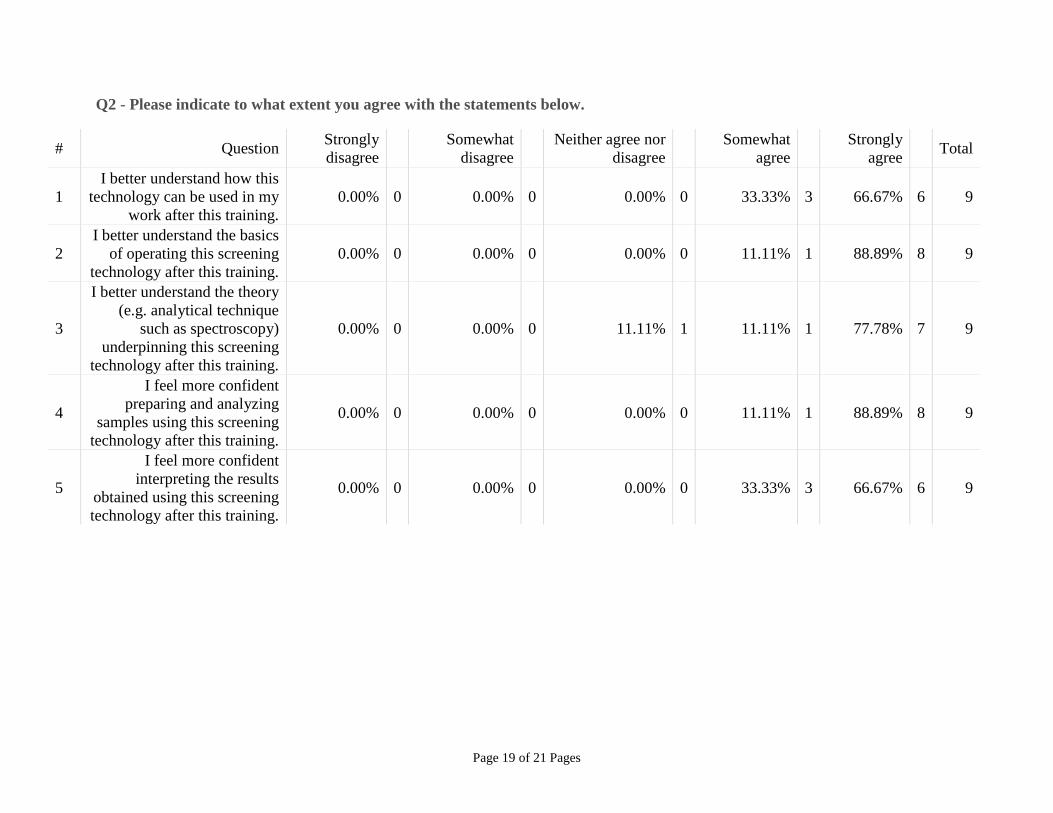
Q2 - Please indicate to what extent you agree with the statements below.
# Question Strongly
disagree
Somewhat
disagree
Neither agree nor
disagree
Somewhat
agree
Strongly
agree Total
1
I better understand how this
technology can be used in my
work after this training.
0.00% 0 0.00% 0 0.00% 0 33.33% 3 66.67% 6 9
2
I better understand the basics
of operating this screening
technology after this training.
0.00% 0 0.00% 0 0.00% 0 11.11% 1 88.89% 8 9
3
I better understand the theory
(e.g. analytical technique
such as spectroscopy)
underpinning this screening
technology after this training.
0.00% 0 0.00% 0 11.11% 1 11.11% 1 77.78% 7 9
4
I feel more confident
preparing and analyzing
samples using this screening
technology after this training.
0.00% 0 0.00% 0 0.00% 0 11.11% 1 88.89% 8 9
5
I feel more confident
interpreting the results
obtained using this screening
technology after this training.
0.00% 0 0.00% 0 0.00% 0 33.33% 3 66.67% 6 9
Page 20 of 21 Pages
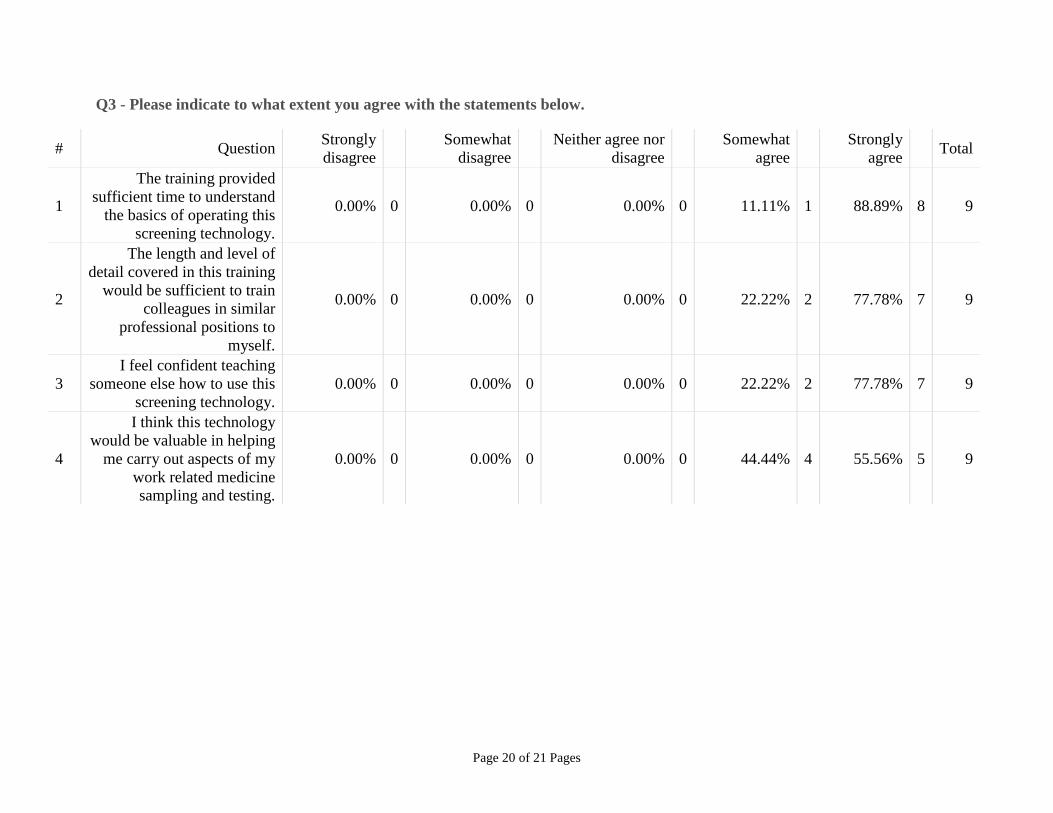
Q3 - Please indicate to what extent you agree with the statements below.
# Question Strongly
disagree
Somewhat
disagree
Neither agree nor
disagree
Somewhat
agree
Strongly
agree Total
1
The training provided
sufficient time to understand
the basics of operating this
screening technology.
0.00% 0 0.00% 0 0.00% 0 11.11% 1 88.89% 8 9
2
The length and level of
detail covered in this training
would be sufficient to train
colleagues in similar
professional positions to
myself.
0.00% 0 0.00% 0 0.00% 0 22.22% 2 77.78% 7 9
3
I feel confident teaching
someone else how to use this
screening technology.
0.00% 0 0.00% 0 0.00% 0 22.22% 2 77.78% 7 9
4
I think this technology
would be valuable in helping
me carry out aspects of my
work related medicine
sampling and testing.
0.00% 0 0.00% 0 0.00% 0 44.44% 4 55.56% 5 9
Page 21 of 21 Pages
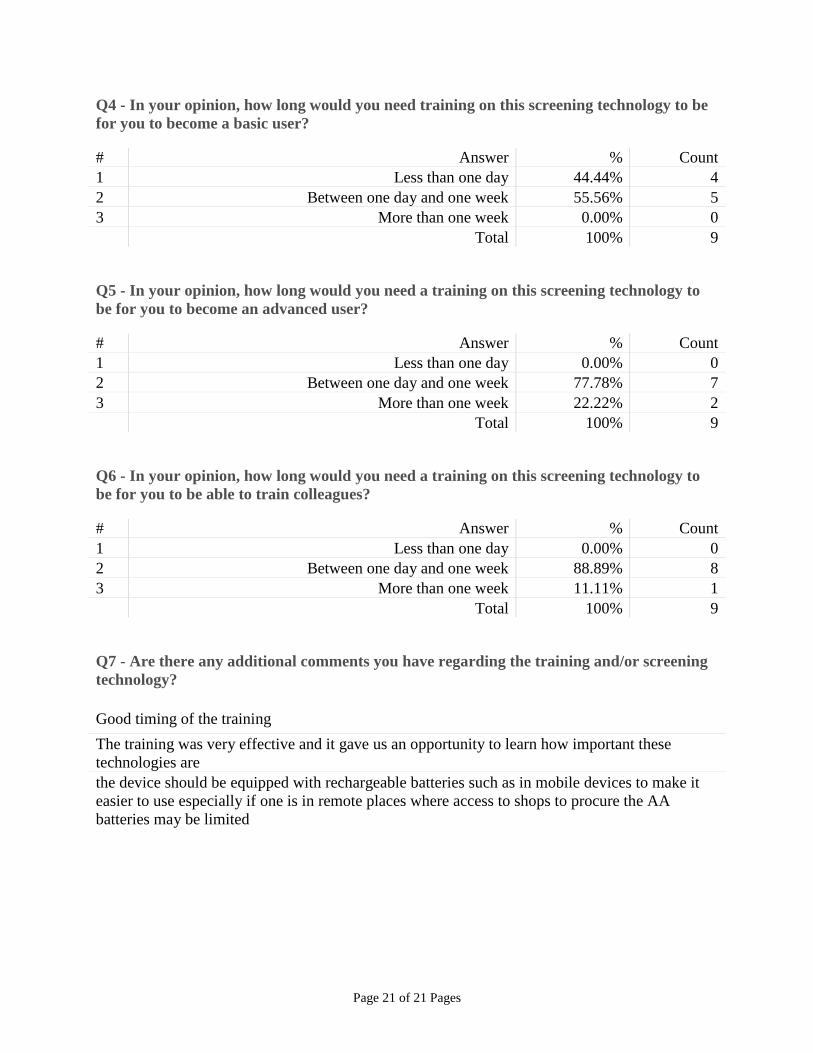
Q4 - In your opinion, how long would you need training on this screening technology to be
for you to become a basic user?
# Answer % Count
1 Less than one day 44.44% 4
2 Between one day and one week 55.56% 5
3 More than one week 0.00% 0
Total 100% 9
Q5 - In your opinion, how long would you need a training on this screening technology to
be for you to become an advanced user?
# Answer % Count
1 Less than one day 0.00% 0
2 Between one day and one week 77.78% 7
3 More than one week 22.22% 2
Total 100% 9
Q6 - In your opinion, how long would you need a training on this screening technology to
be for you to be able to train colleagues?
# Answer % Count
1 Less than one day 0.00% 0
2 Between one day and one week 88.89% 8
3 More than one week 11.11% 1
Total 100% 9
Q7 - Are there any additional comments you have regarding the training and/or screening
technology?
Good timing of the training
The training was very effective and it gave us an opportunity to learn how important these
technologies are
the device should be equipped with rechargeable batteries such as in mobile devices to make it
easier to use especially if one is in remote places where access to shops to procure the AA
batteries may be limited