ussip marine report - amazon web...
TRANSCRIPT
MARINE | WEATHER HINDCAST REPORT
PREPARED FOR
US SAILING INVESTIGATIVE PANEL
VESSEL : “Aegean” INCIDENT LOCATION : APPROX 32.45N 117.30W INCIDENT TIME : APPROX 1:30AM Apr. 28 2012
PREPARED BY SAM WILSON
M.S. METEOROLOGY SCIENTIST
SURFLINE.COM | BUOYWEATHER.COM
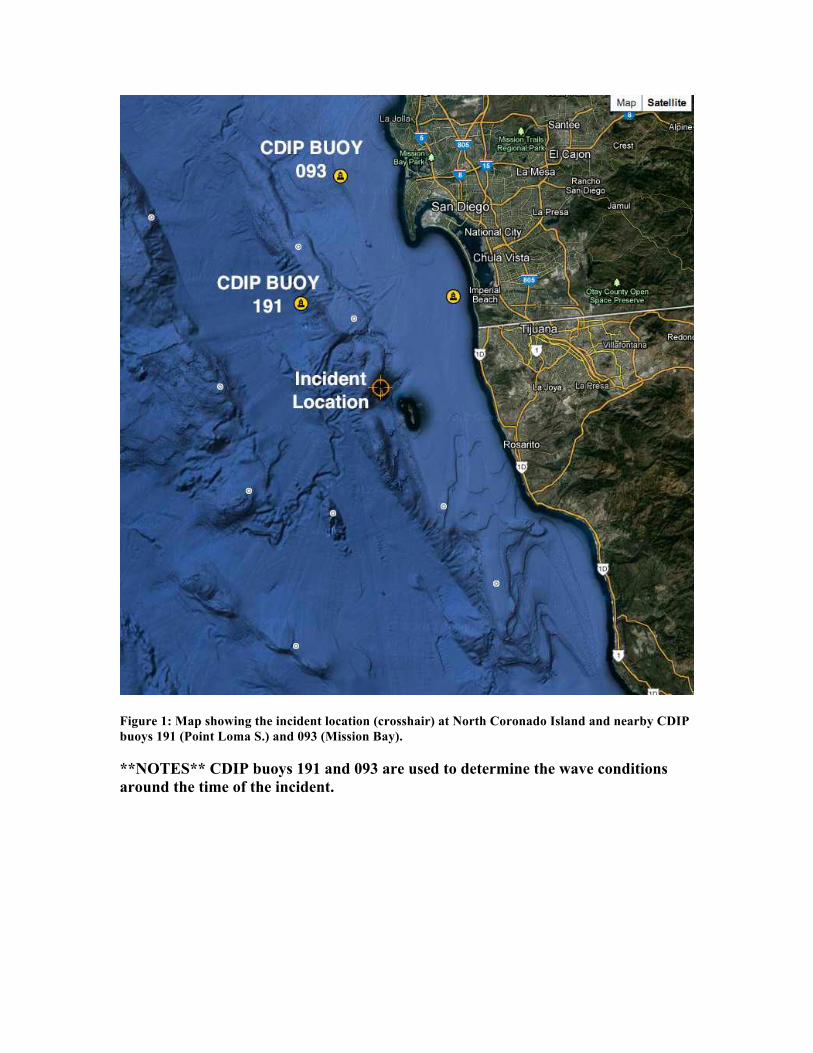
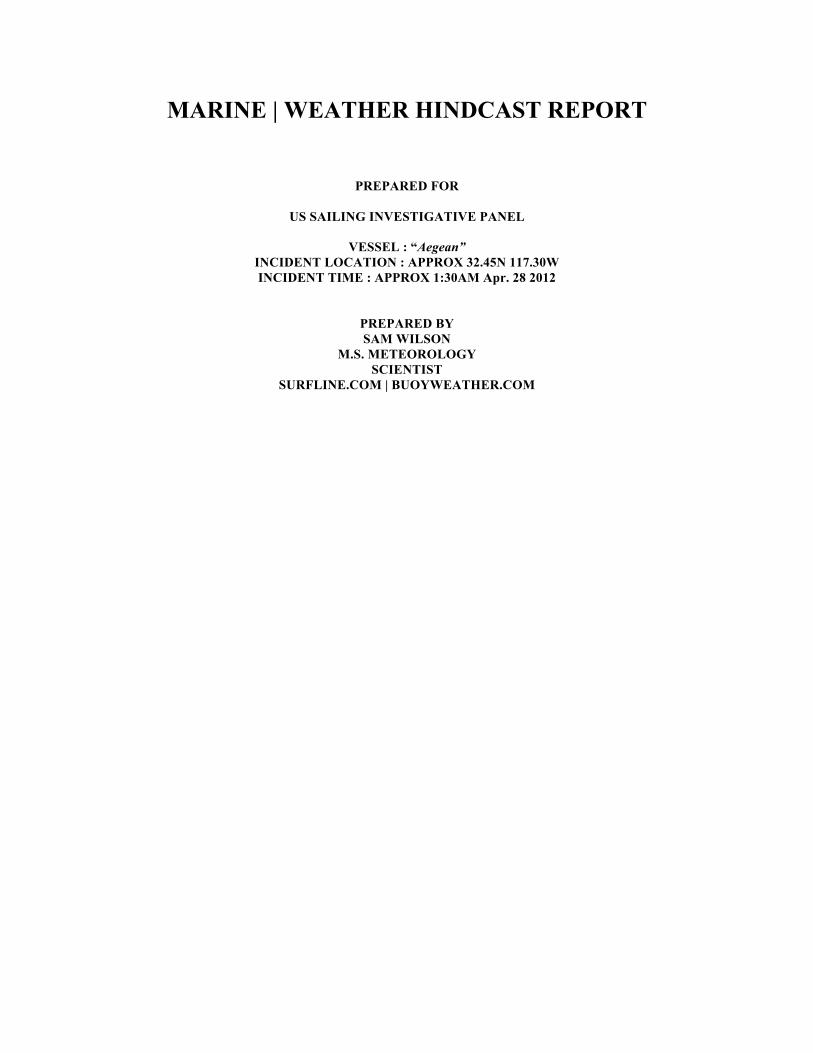
Figure 1: Map showing the incident location (crosshair) at North Coronado Island and nearby CDIP buoys 191 (Point Loma S.) and 093 (Mission Bay). **NOTES** CDIP buoys 191 and 093 are used to determine the wave conditions around the time of the incident.

a)
b)

c)
Figure 2: Mean Sea Level Pressure and Wind Speed charts derived from the Global Forecast System (GFS) weather model showing the general weather pattern in place surrounding the time of the incident. Maps valid at a) 12Z 27 Apr 2012 (5AM Local Pacific Time on the 27th), b) 00Z 28 Apr 2012 (5PM Local Pacific Time on the 27th), and c) 12Z 28 Apr 2012 (5AM Local Pacific Time on the 28th). **NOTES** For reference, the incident occurred at approx. 8:30Z 28 Apr 2012 (1:30AM Local Pacific Time on the 28th). Charts above display wind speed in knots. ANALYSIS: Broad scale high pressure was in place over the NE Pacific offshore of California with a very weak trough of low pressure along the coast and inland of Southern California. Moderate winds (25-30 kt) from the NW/NNW were in place offshore and North of Pt. Conception. A lighter pressure pattern was in place in the Southern California bight with light winds (~ 5kt) from the NNW/NW near the location of the incident.
a)
b)

c)
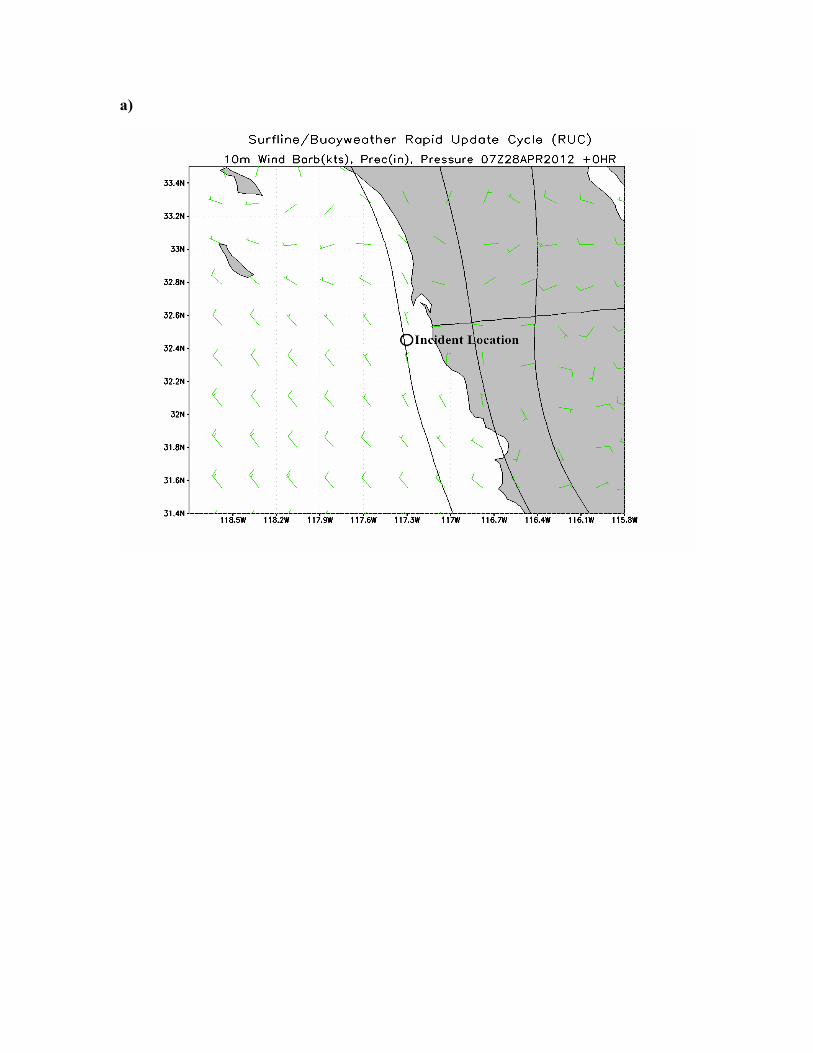
Figure 3: Mean Sea Level Pressure and Wind Speed charts derived from the Rapid Update Cycle (RUC) hourly weather model showing the local winds in place surrounding the time of the incident. Maps valid at a) 07Z 28 Apr 2012 (Midnight Local Pacific Time on the 27th), b) 08Z 28 Apr 2012 (1AM Local Pacific Time on the 28th), and c) 09Z 28 Apr 2012 (2AM Local Pacific Time on the 28th). **NOTES** For reference, the incident occurred at approx. 8:30Z 28 Apr 2012 (1:30AM Local Pacific Time on the 28th). Charts above display wind speed in knots. ANALYSIS: Very light winds (~5 kt or less) coming from the NNW/NW were in place around the time and place of the incident. Local weather stations along the coast at nearby Imperial Beach, Ca. indicated calm winds around the time of the event (not shown).

Figure 4: Quantitative Precipitation Forecast issued by the Hydrometeorological Prediction Center prior to the incident at ~22Z Apr 27 2012 (3PM Local Pacific Time on the 27th). Precipitation forecast (shaded colors) is valid from 00Z Apr 28 2012 (5PM Local Pacific Time on the 27th) to 00Z Apr 29 2012 (5PM Local Pacific Time on the 28th) ANALYSIS: No precipitation was forecast for the time and location of the incident.

Figure 5: National radar image image from the Hydrometeorological Prediction Center approx. 30 minutes after the incident occured (09Z 28 Apr 2012). ANALYSIS: No precipitation indicated on the radar around the location and time of the incident.

Figure 6: Visibility chart issued by the Ocean Prediction Center valid 10Z 28 Apr 2012 (3AM Local Pacific time on the 28th). ANALYSIS: No contours are plotted around the location of the incident, indicating visibility was greater than 5 miles. Local weather stations along the coast at nearby Imperial Beach, Ca. indicated a visibility of 10 miles (not shown).
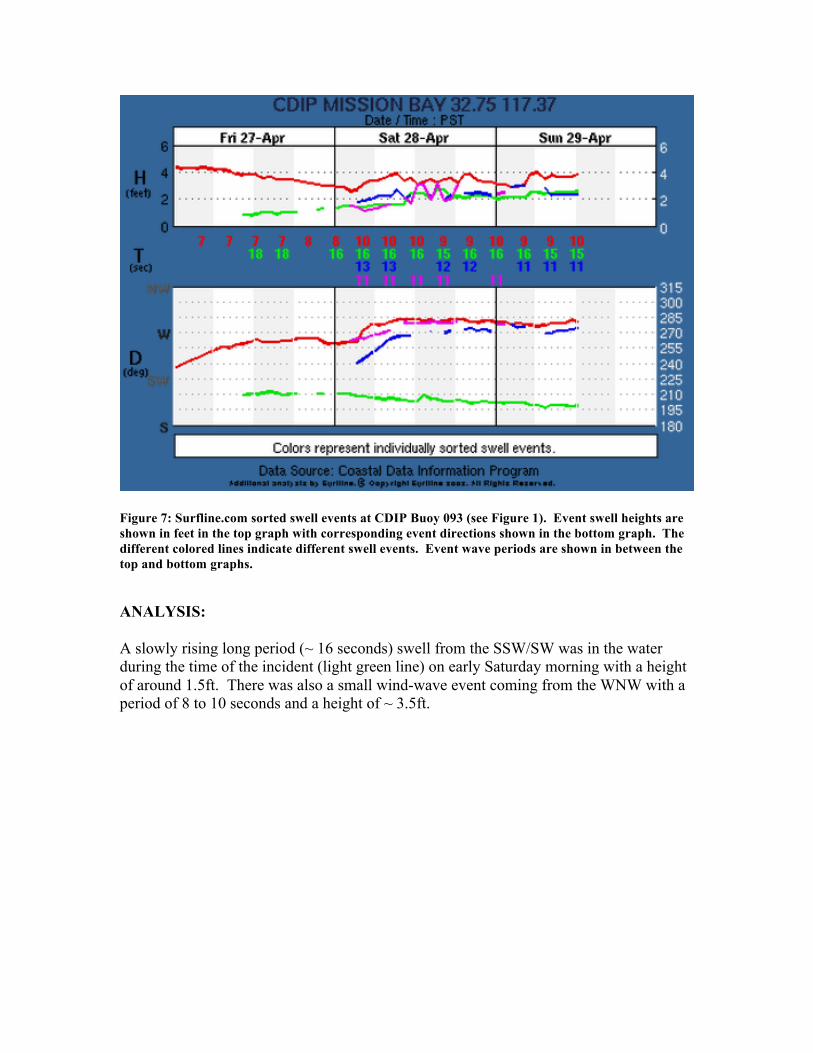
Figure 7: Surfline.com sorted swell events at CDIP Buoy 093 (see Figure 1). Event swell heights are shown in feet in the top graph with corresponding event directions shown in the bottom graph. The different colored lines indicate different swell events. Event wave periods are shown in between the top and bottom graphs. ANALYSIS: A slowly rising long period (~ 16 seconds) swell from the SSW/SW was in the water during the time of the incident (light green line) on early Saturday morning with a height of around 1.5ft. There was also a small wind-wave event coming from the WNW with a period of 8 to 10 seconds and a height of ~ 3.5ft.

a)
b)

c)

d)

e)
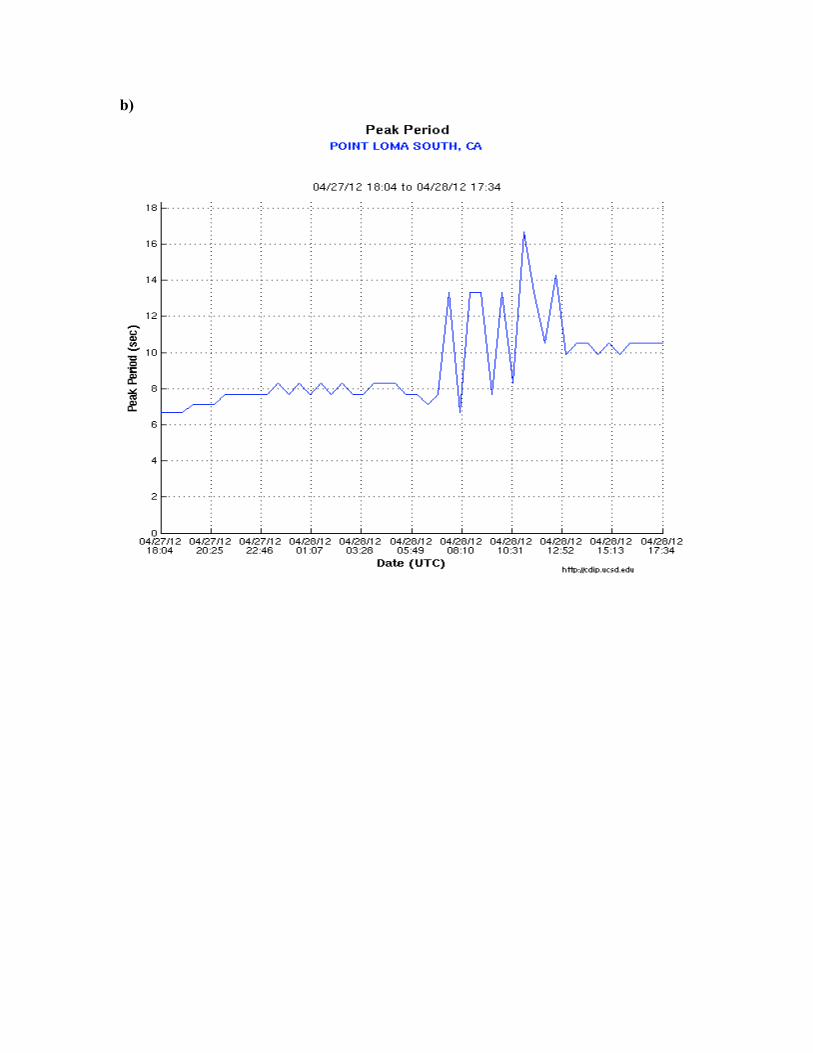
Figure 8: CDIP Buoy 191 (see Figure 1) graphs for a) Significant Wave Height (in meters), b) Peak Period (in seconds), c) Peak Direction, d) Significant Wave Height (in centimeters) of separated Sea (periods < 10 seconds) and Swell (periods greater than 10 seconds), and e) Sea Surface Temperature (in Celcius). **NOTES** For reference, the incident occurred at approx. 8:30Z 28 Apr 2012 (1:30AM Local Pacific Time on the 28th). Refer to the x-axis in Figure 8. ANALYSIS:
a) A significant wave height of ~1.4 meters (~ 4.6 feet) was recorded by CDIP Buoy 191 at the time of the incident.
b) Peak period plot indicating the new long period SSW/SW swell becoming dominant around the time of the incident.
c) Peak direction plot indicating the new long period SSW/SW swell becoming dominant around the time of the incident.
d) Separated sea/swell plot showing the slowly rising long period swell (red dots) and fairly steady WNW wind waves (blue dots)
e) Sea surface temperatures recorded by CDIP Buoy 191 indicating temps ~16.5 degrees C (~ 62 degrees F).
a)

b)
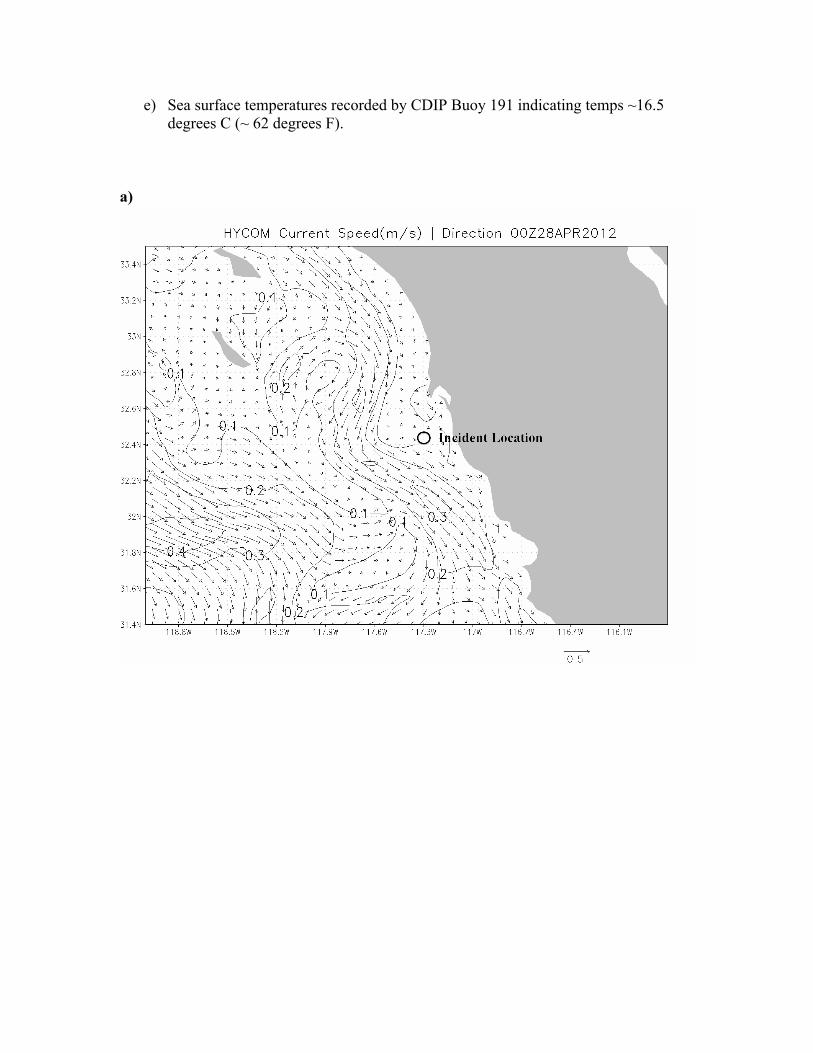
Figure 9: Sea Surface Currents in meters per second derived from the HYCOM Ocean Model valid at a) 00Z 28 Apr 2012 (5PM Local Pacific Time on the 27th) and b) 00Z 29 Apr 2012 (5PM Local Pacific Time on the 28th). ANALYSIS: Generally light sea surface currents (~ 0.1 m/s or less) were present at the location of the incident. Stronger currents (~ 0.2 to 0.3 m/s) coming from the N/NW were present nearby to the west of the incident location.