utas blacklow - primary school performance 2015
TRANSCRIPT

Evaluating Tasmanian
Education Performance
TASMANIAN SCHOOL OF BUSINESS AND ECONOMICS (TSBE)
Dr Paul Blacklow
Solutions to Big Problems
Economics and Finance
Flagship Seminar 2015
2
Overview
1. NAPLAN statistics for Grade 5 from 2014
2. Determinants of education performance
3. Using ICSEA to explain NAPLAN statistics
4. Models of education performance
5. How to compare education performance?
1. Best available method for parents, layperson, etc.
2. Best available method to those with access to data, econometric, statistical and mathematical modelling skills.

3
1. NAPLAN statistics for
Grade 5 from 2014
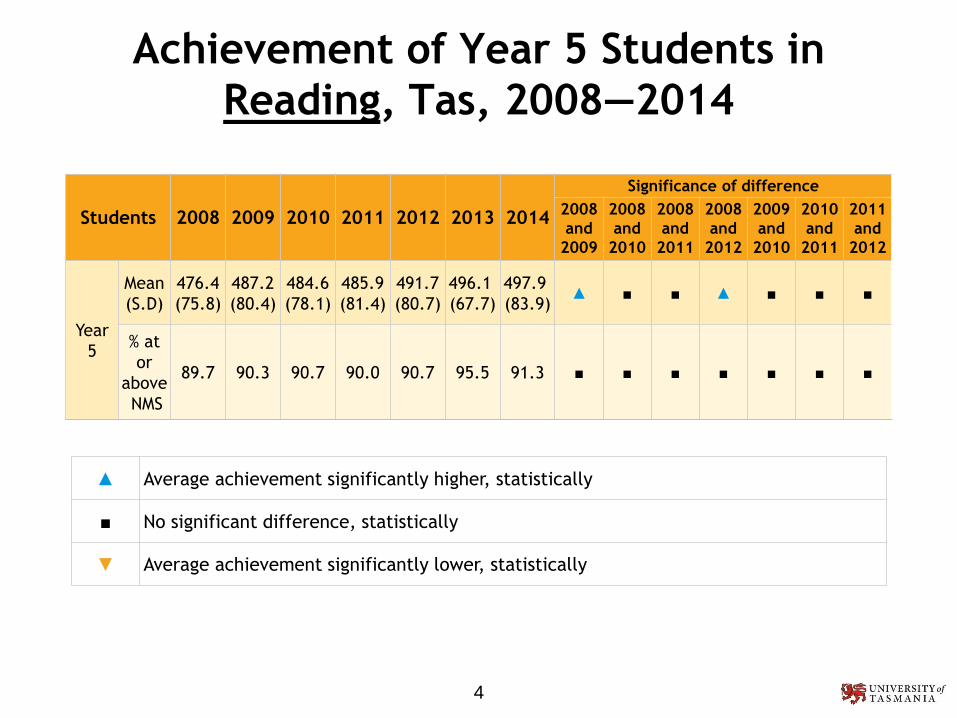
Achievement of Year 5 Students in
Reading, Tas, 2008—2014
4
Students 2008 2009 2010 2011 2012 2013 2014
Significance of difference
2008
and
2009
2008
and
2010
2008
and
2011
2008
and
2012
2009
and
2010
2010
and
2011
2011
and
2012
Year
5
Mean
(S.D)
476.4
(75.8)
487.2
(80.4)
484.6
(78.1)
485.9
(81.4)
491.7
(80.7)
496.1
(67.7)
497.9
(83.9)▲ ■ ■ ▲ ■ ■ ■
% at
or
above
NMS
89.7 90.3 90.7 90.0 90.7 95.5 91.3 ■ ■ ■ ■ ■ ■ ■
▲ Average achievement significantly higher, statistically
■ No significant difference, statistically
▼ Average achievement significantly lower, statistically

Achievement of Year 5 Students in
Spelling, Tasmania, 2008—2014
5
▲ Average achievement significantly higher, statistically
■ No significant difference, statistically
▼ Average achievement significantly lower, statistically
Students 2008 2009 2010 2011 2012 2013 2014
Significance of difference
2008
and
2009
2008
and
2010
2008
and
2011
2008
and
2012
2009
and
2010
2010
and
2011
2011
and
2012
Year
5
Mean
(S.D.)
471.7
(70.8)
476.5
(73.9)
477.3
(71.8)
470.7
(73.4)
480.8
(72.6)
477.0
(73.1)
485.2
(77.8)■ ■ ■ ▲ ■ ■ ▲
% at
or
above
NMS
89.8 90.6 90.3 88.5 91.6 89.8 89.9 ■ ■ ■ ■ ■ ■ ▲

Achievement of Year 5 Students in
Numeracy, Tasmania, 2008—2014
6
Students 2008 2009 2010 2011 2012 2013 2014
Significance of difference
2008
and
2009
2008
and
2010
2008
and
2011
2008
and
2012
2009
and
2010
2010
and
2011
2011
and
2012
Year
5
Mean
(S.D)
464.6
(62.9)
472.8
(63.2)
479.4
(67.2)
478.2
(65.2)
480.4
(69.0)
471.0
(66.0)
477.3
(66.2)■ ▲ ▲ ▲ ■ ■ ■
% at or
above
NMS
92.1 93.2 93.2 93.9 92.6 92.4 92.6 ■ ■ ■ ■ ■ ■ ■
▲ Average achievement significantly higher, statistically
■ No significant difference, statistically
▼ Average achievement significantly lower, statistically
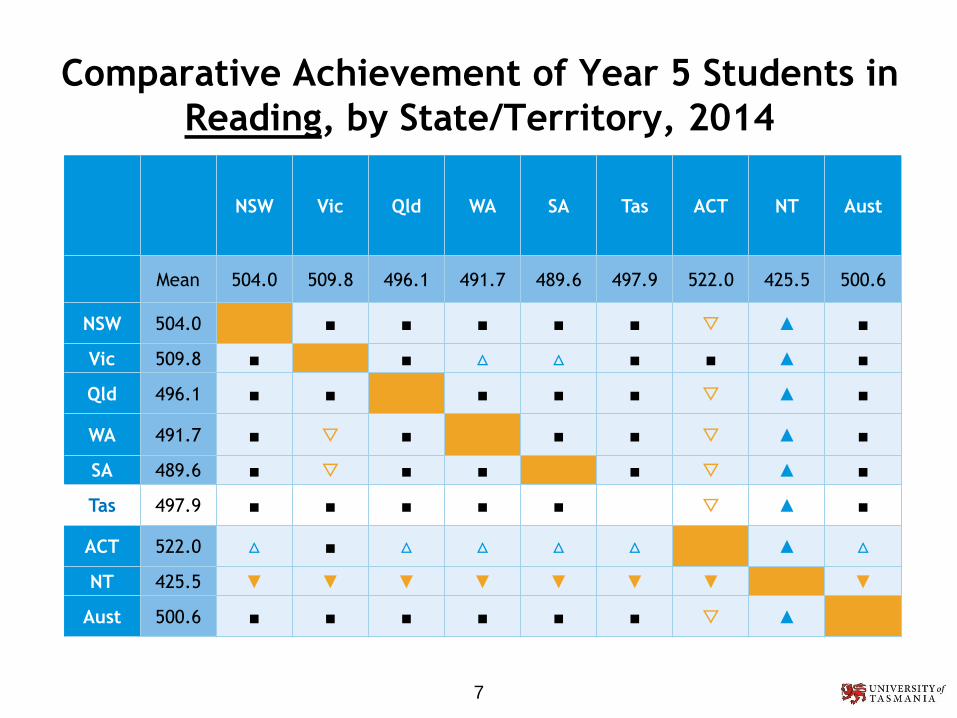
Comparative Achievement of Year 5 Students in
Reading, by State/Territory, 2014
7
NSW Vic Qld WA SA Tas ACT NT Aust
Mean 504.0 509.8 496.1 491.7 489.6 497.9 522.0 425.5 500.6
NSW 504.0 ■ ■ ■ ■ ■ ▽ ▲ ■
Vic 509.8 ■ ■ △ △ ■ ■ ▲ ■
Qld 496.1 ■ ■ ■ ■ ■ ▽ ▲ ■
WA 491.7 ■ ▽ ■ ■ ■ ▽ ▲ ■
SA 489.6 ■ ▽ ■ ■ ■ ▽ ▲ ■
Tas 497.9 ■ ■ ■ ■ ■ ▽ ▲ ■
ACT 522.0 △ ■ △ △ △ △ ▲ △
NT 425.5 ▼ ▼ ▼ ▼ ▼ ▼ ▼ ▼
Aust 500.6 ■ ■ ■ ■ ■ ■ ▽ ▲

Comparative Achievement of Year 5 Students in
Spelling, by State/Territory, 2014
8
NSW Vic Qld WA SA Tas ACT NT Aust
Mean 507.6 500.9 489.5 492.2 488.4 485.2 502.0 421.8 497.6
NSW 507.6 ■ △ △ △ △ ■ ▲ ■
Vic 500.9 ■ ■ ■ ■ △ ■ ▲ ■
Qld 489.5 ▽ ■ ■ ■ ■ ■ ▲ ■
WA 492.2 ▽ ■ ■ ■ ■ ■ ▲ ■
SA 488.4 ▽ ■ ■ ■ ■ ■ ▲ ■
Tas 485.2 ▽ ▽ ■ ■ ■ ▽ ▲ ■
ACT 502.0 ■ ■ ■ ■ ■ △ ▲ ■
NT 421.8 ▼ ▼ ▼ ▼ ▼ ▼ ▼ ▼
Aust 497.6 ■ ■ ■ ■ ■ ■ ■ ▲
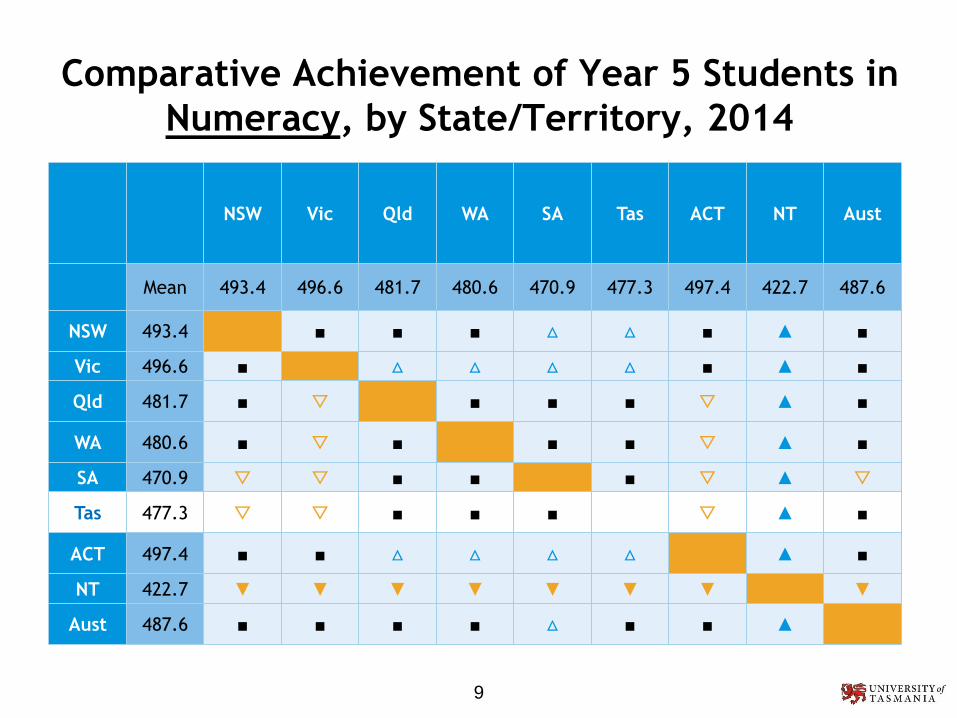
Comparative Achievement of Year 5 Students in
Numeracy, by State/Territory, 2014
9
NSW Vic Qld WA SA Tas ACT NT Aust
Mean 493.4 496.6 481.7 480.6 470.9 477.3 497.4 422.7 487.6
NSW 493.4 ■ ■ ■ △ △ ■ ▲ ■
Vic 496.6 ■ △ △ △ △ ■ ▲ ■
Qld 481.7 ■ ▽ ■ ■ ■ ▽ ▲ ■
WA 480.6 ■ ▽ ■ ■ ■ ▽ ▲ ■
SA 470.9 ▽ ▽ ■ ■ ■ ▽ ▲ ▽
Tas 477.3 ▽ ▽ ■ ■ ■ ▽ ▲ ■
ACT 497.4 ■ ■ △ △ △ △ ▲ ■
NT 422.7 ▼ ▼ ▼ ▼ ▼ ▼ ▼ ▼
Aust 487.6 ■ ■ ■ ■ △ ■ ■ ▲

Achievement of Year 5 Students in Reading, by
Geo-location, by State/Territory, 2014
10
Geo-location
State/ Territory Metropolitan Provincial Remote Very Remote
NSW 508.9 488.7 459.6 456.9
VIC 512.7 500.5 495.6 -
QLD 501.6 486.6 467.7 422.7
WA 500.7 478.3 458.5 406.5
SA 494.4 479.8 483.8 397.0
TAS 514.4 492.6 491.5 -
ACT 522.1 - - -
NT - 479.5 447.5 317.1
Aust 506.7 489.3 463.4 383.2

Achievement of Year 5 Students in Numeracy,
by Geo-location, by State/Territory, 2014
11
Geo-location
State/ Territory Metropolitan Provincial Remote Very Remote
NSW 499.5 474.3 451.8 438.5
VIC 500.3 484.4 481.8 -
QLD 487.2 472.1 455.2 415.2
WA 489.2 467.1 449.2 406.1
SA 475.2 461.5 466.2 399.5
TAS 480.1 475.0 478.1 -
ACT 497.5 - - -
NT - 463.1 432.0 345.0
Aust 494.1 474.4 451.4 389.7
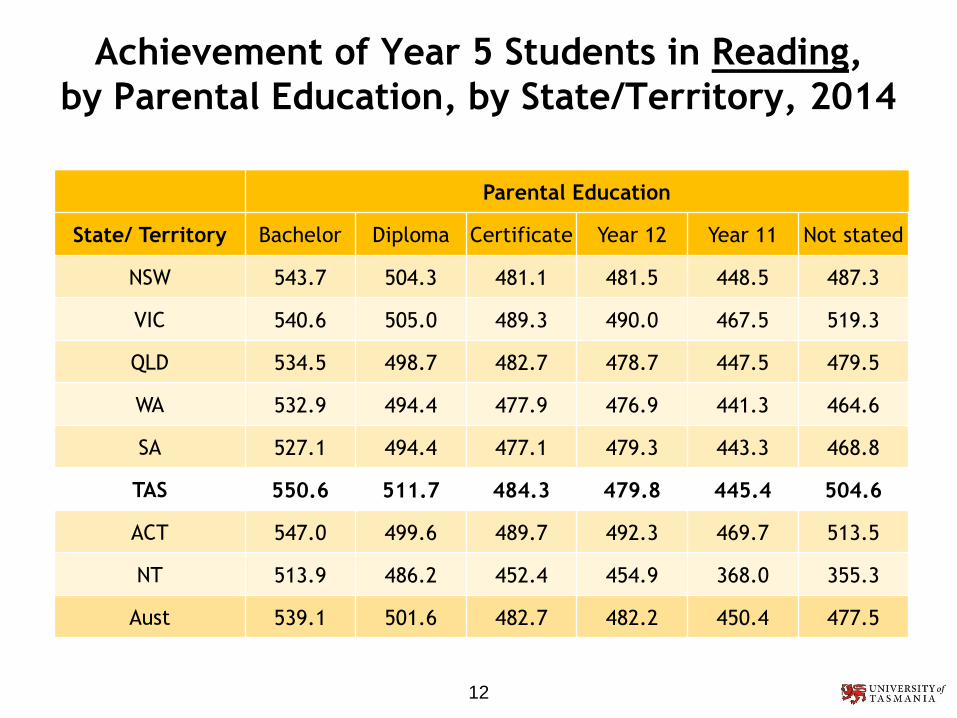
Achievement of Year 5 Students in Reading,
by Parental Education, by State/Territory, 2014
12
Parental Education
State/ Territory Bachelor Diploma Certificate Year 12 Year 11 Not stated
NSW 543.7 504.3 481.1 481.5 448.5 487.3
VIC 540.6 505.0 489.3 490.0 467.5 519.3
QLD 534.5 498.7 482.7 478.7 447.5 479.5
WA 532.9 494.4 477.9 476.9 441.3 464.6
SA 527.1 494.4 477.1 479.3 443.3 468.8
TAS 550.6 511.7 484.3 479.8 445.4 504.6
ACT 547.0 499.6 489.7 492.3 469.7 513.5
NT 513.9 486.2 452.4 454.9 368.0 355.3
Aust 539.1 501.6 482.7 482.2 450.4 477.5
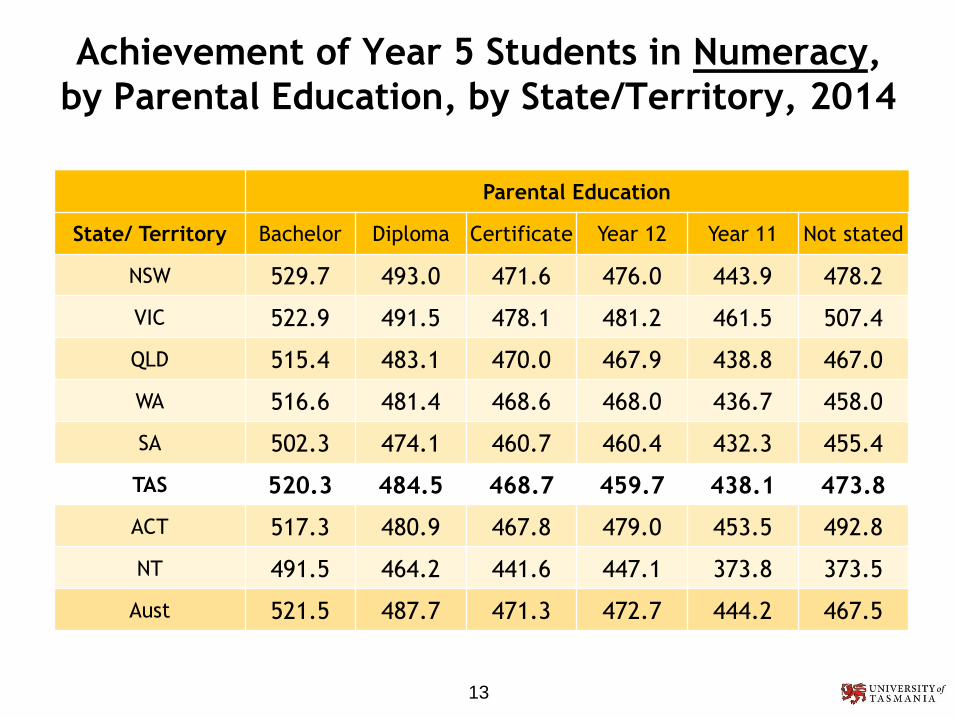
13
Parental Education
State/ Territory Bachelor Diploma Certificate Year 12 Year 11 Not stated
NSW 529.7 493.0 471.6 476.0 443.9 478.2
VIC 522.9 491.5 478.1 481.2 461.5 507.4
QLD 515.4 483.1 470.0 467.9 438.8 467.0
WA 516.6 481.4 468.6 468.0 436.7 458.0
SA 502.3 474.1 460.7 460.4 432.3 455.4
TAS 520.3 484.5 468.7 459.7 438.1 473.8
ACT 517.3 480.9 467.8 479.0 453.5 492.8
NT 491.5 464.2 441.6 447.1 373.8 373.5
Aust 521.5 487.7 471.3 472.7 444.2 467.5
Achievement of Year 5 Students in Numeracy,
by Parental Education, by State/Territory, 2014

Achievement of Year 5 Students in
Reading, by Parental Occupation, by
State/Territory, 2014
14
Parental Occupation
State/
TerritoryGroup 1 Group 2 Group 3 Group 4
Not in paid
workNot stated
NSW 544.3 517.0 491.1 471.1 455.5 476.4
VIC 545.0 519.4 498.9 482.0 470.1 520.4
QLD 534.1 509.1 487.4 466.6 449.2 475.6
WA 531.3 504.9 482.6 463.3 447.2 468.0
SA 528.3 503.0 484.8 466.2 454.3 462.1
TAS 546.3 514.5 490.2 468.4 442.0 490.5
ACT 548.1 521.8 492.4 479.7 484.2 504.0
NT 505.0 481.8 464.2 408.0 370.1 345.3
Aust 539.7 513.8 490.8 471.6 457.2 473.2
Group 1: Senior management and qualified professionals
Group 2: Other business managers and associate professionals
Group 3: Tradespeople, clerks, skilled office, sales and service staff
Group 4: Machine operators, hospitality staff, assistants, labourers
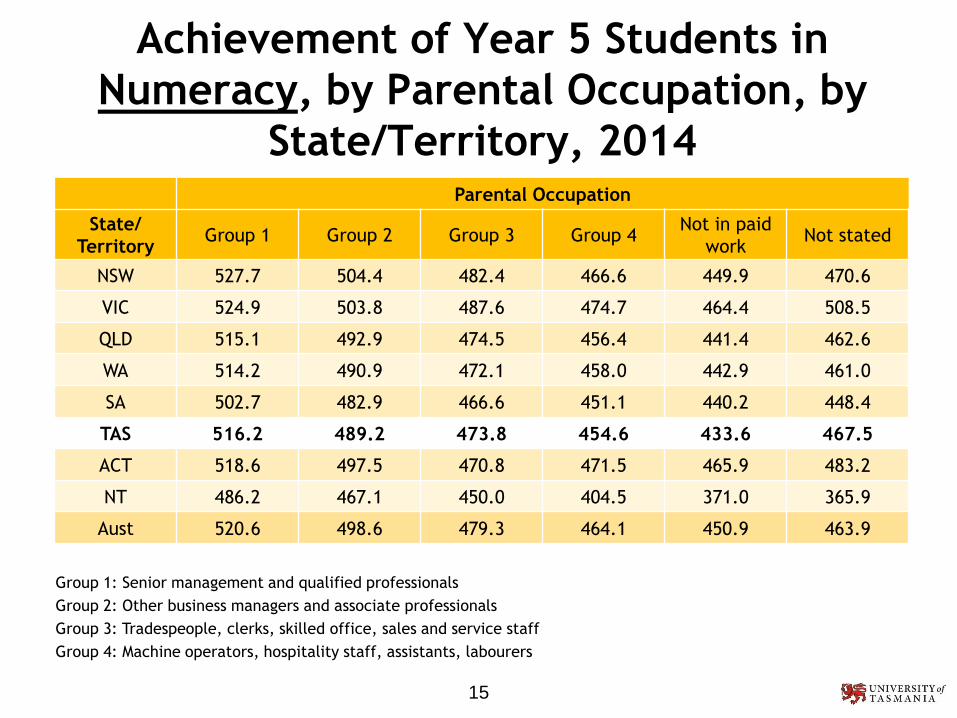
Achievement of Year 5 Students in
Numeracy, by Parental Occupation, by
State/Territory, 2014
15
Parental Occupation
State/
TerritoryGroup 1 Group 2 Group 3 Group 4
Not in paid
workNot stated
NSW 527.7 504.4 482.4 466.6 449.9 470.6
VIC 524.9 503.8 487.6 474.7 464.4 508.5
QLD 515.1 492.9 474.5 456.4 441.4 462.6
WA 514.2 490.9 472.1 458.0 442.9 461.0
SA 502.7 482.9 466.6 451.1 440.2 448.4
TAS 516.2 489.2 473.8 454.6 433.6 467.5
ACT 518.6 497.5 470.8 471.5 465.9 483.2
NT 486.2 467.1 450.0 404.5 371.0 365.9
Aust 520.6 498.6 479.3 464.1 450.9 463.9
Group 1: Senior management and qualified professionals
Group 2: Other business managers and associate professionals
Group 3: Tradespeople, clerks, skilled office, sales and service staff
Group 4: Machine operators, hospitality staff, assistants, labourers
All these comparisons are wrong!
Why?
• Because the determinants of test scores
are not held constant.
• All the factors that help determine
performance need to be held constant to
make valid comparisons.
• The factors that help determine
performance vary across states, geo-
location, parental occupation and time.
16

Invalid Comparisons of Education
Performance• Comparisons of education performance
are invalid
– over time if the determinants change over
time.
– across states if the determinants vary across
state.
– across schools if the determinants vary
across schools.
– across students if the determinants vary
across students.
17

Evaluating Education Performance
• To accurately evaluate student, school or
even teacher performance:
• All the above determinants need to be
taken into account simultaneously.
• How can we do that!
18

Evaluating Education Performance
We could use
• The Index of Community Socio-
Educational Advantage
• How can we do that!
19
2. Determinants of Education
Performance
20

Determinants of Education Performance
• Student’s Background
• Peer Effects
• School Resources
• Teacher Quality & Effectiveness
21

Student’s Characteristics
Student’s Background
• Gender
• ABTSI (Aboriginal or Torres Strait Islander)
• LBOTE (Language Background Other Than English)
• Disability
• Absences
• All previous education
22

Peer Effects
• Average Student Characteristics from
– Class
– School
– Area in which the student lives
• Average Student Performance from
– Class
– School
– Area in which the student lives
23

School Resources
• Student-Ratio Ratio
• Class Size
• Support Staff
• IT resources
• Library resources
• Other resources
• parents & friends
• $$$
24

Teacher Quality & Effectiveness
Teacher’s
• Age ?
• Gender ?
• Experience ?
• Training ?
• Qualifications ?
• Job Satisfaction ?
• Pay and work
conditions? 25
Many studies have
found that there is
no observable
variable that
identifies good or
bad teachers.
3. A quick examination of the effect of
Socio-economic on Tasmanian Numeracy
Scores using ICSEA
26

ICSEA
“The Index of Community Socio-Educational Advantage
(ICSEA) was created by the Australian Curriculum,
Assessment and Reporting Authority (ACARA) to enable
meaningful comparisons of National Assessment Program –
Literacy and Numeracy (NAPLAN) test achievement by
students in schools across Australia.”
“Key factors in students’ family backgrounds (parents’
occupation, school education and non-school education)
…. In addition … school-level factors (a school’s
geographical location and the proportion of Indigenous
students a school caters for)”
http://www.myschool.edu.au/AboutUs/Glossary/glossaryLink27

ICSEA
For Australia ICSEA values are calculated on a
scale which has a median of 1000 and a standard
deviation of 100. ICSEA values typically range
from approximately 500 to about 1300.www.acara.edu.au/verve/_resources/Guide_to_understanding_2013_ICSEA_values.pdf
For Tasmanian public primary schools the ICSEA
range from 823 to 1179 with a median of 961.5, a
an average of 972.6 and standard of 69.6.
28
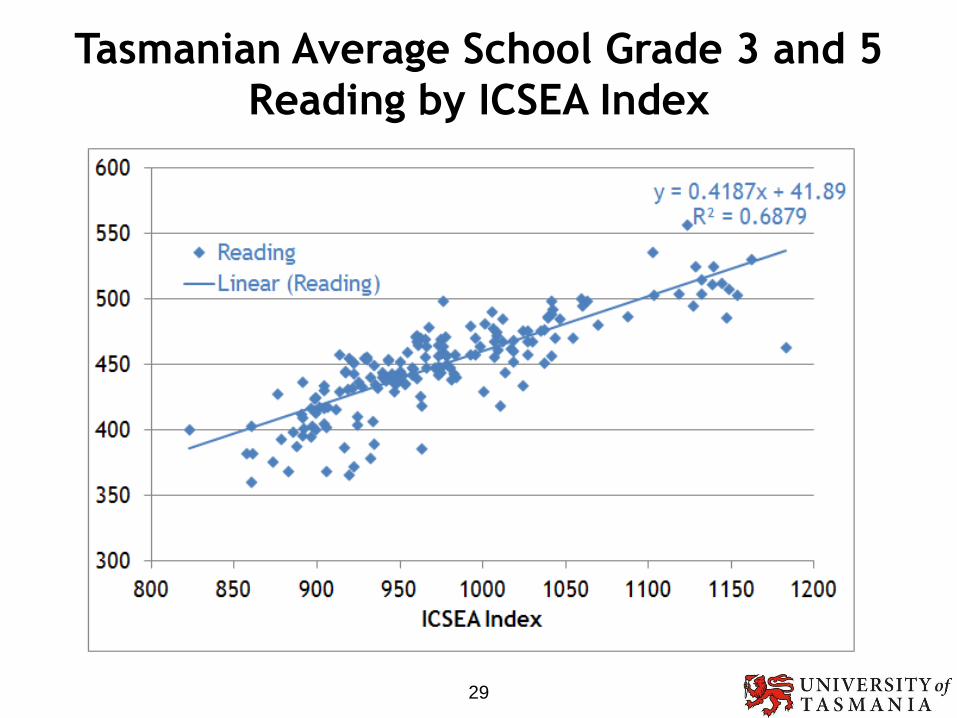
Tasmanian Average School Grade 3 and 5
Reading by ICSEA Index
29

Tasmanian Average School Grade 3 and 5
Numeracy by ICSEA Index
30
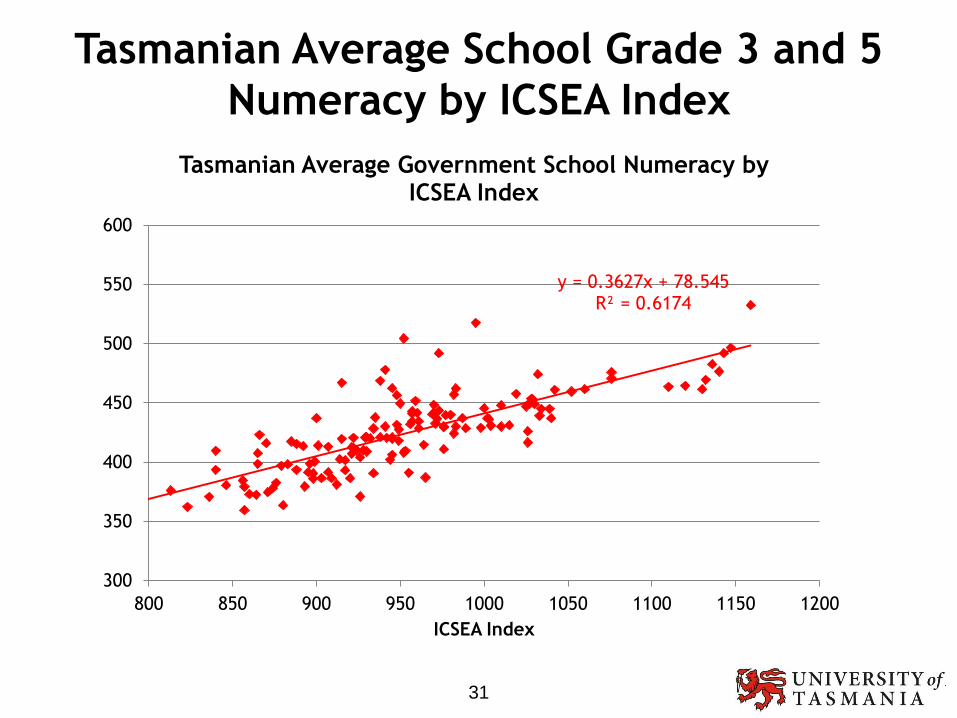
Tasmanian Average School Grade 3 and 5
Numeracy by ICSEA Index
31
y = 0.3627x + 78.545R² = 0.6174
300
350
400
450
500
550
600
800 850 900 950 1000 1050 1100 1150 1200
ICSEA Index
Tasmanian Average Government School Numeracy by ICSEA Index

ICSEA
32
4. Models of Student Performance
33
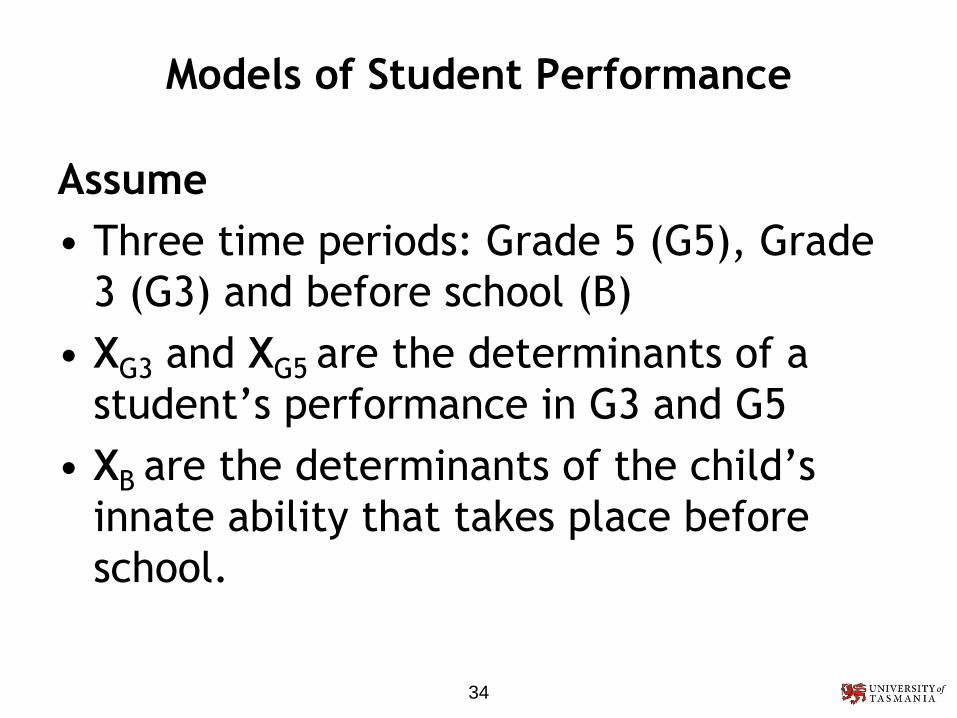
Models of Student Performance
Assume
• Three time periods: Grade 5 (G5), Grade
3 (G3) and before school (B)
• XG3 and XG5 are the determinants of a
student’s performance in G3 and G5
• XB are the determinants of the child’s
innate ability that takes place before
school.
34

Models of Student Performance
Assume
• YG3 and YG5 are measures of student
performance in G3 and G5, respectively.
• YB is a measure (usually unobservable) of
the child’s innate ability that develops
before school.
35

Models of Student Performance
Assume
• βB, βG3 and βG5 are the effects of those
determinants of performance before
school and in G3 and G5, respectively.
• eB, eG3 and eG5 are the unobservable
effects in G3 and G5, respectively that
when averaged over students have no
effect.
36
BG5 G3e = e = e = 0

Models of Student Performance
Simplest Model
Also assume β = βB = βG3 = βG5 and Yt = f(Xt)
YG5 = β XG5 + eG5
YG3 = β XG3 + eG3
YB = β XB + eB
37
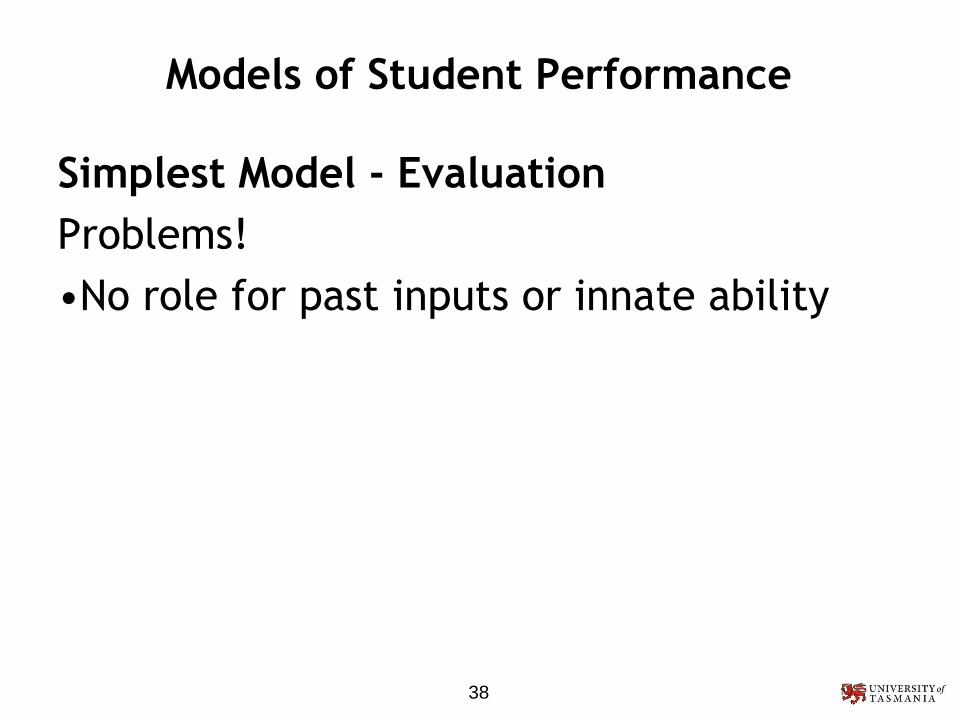
Models of Student Performance
Simplest Model - Evaluation
Problems!
•No role for past inputs or innate ability
38

Models of Student Performance
Simple Innate Ability Model
Now assume Yt = f(Xt,YB)
YG5 = β XG5 + YB + eG5
YG3 = β XG3 + YB + eG3
YG5 — YG3 = β XG5 — β XG3 + eG5 — eG3
ΔYG5 = β ΔXG5 + ΔeG5
39
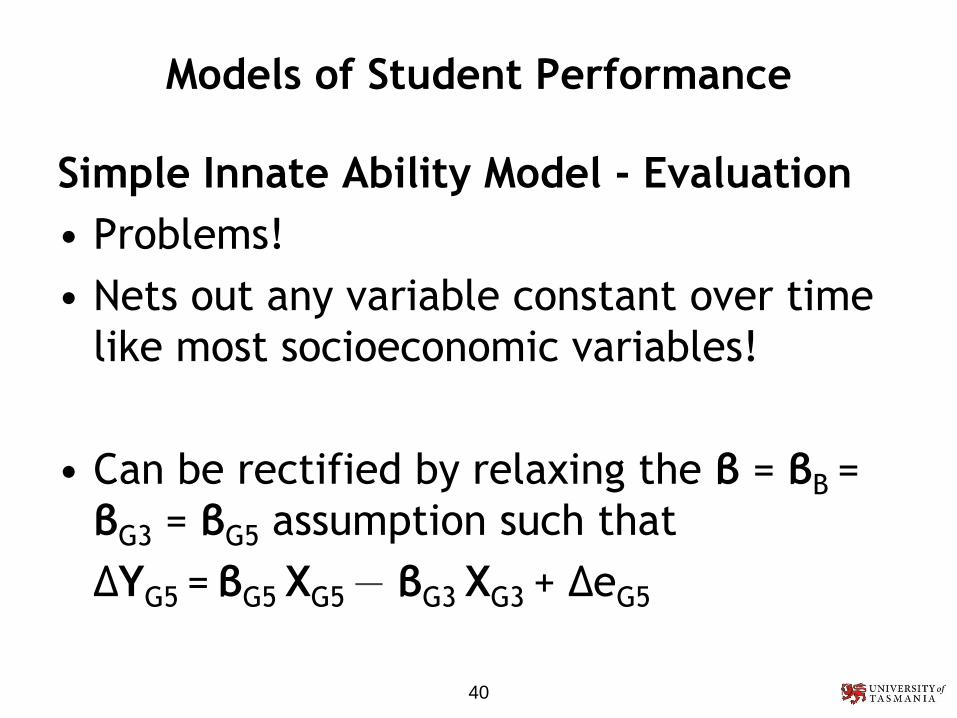
Models of Student Performance
Simple Innate Ability Model - Evaluation
• Problems!
• Nets out any variable constant over time
like most socioeconomic variables!
• Can be rectified by relaxing the β = βB =
βG3 = βG5 assumption such that
ΔYG5 = βG5 XG5 — βG3 XG3 + ΔeG5
40

Models of Student Performance
Past Inputs Model
Now assume Yt = f(Xt, Xt-1,…, X1, X0)
YG5 = βG5 XG5 + βG3 XG3 + βB XB +eG5 + eG3 + eB
YG3 = βG3 XG3 + βB XB + eG3 + eB
ΔYG5 = βG5 XG5 + eG5
or YG5 = βG5 XG5 + YG3 + eG5
41

Models of Student Performance
Past Inputs Model - Evaluation
• Allows for past effects or innate ability
that are often unobservable.
• A bit restrictive as the marginal effect of
G3 performance on G5 is equal to one.
• Including a lagged dependent variable
(YG3) violates standard regression
assumptions and it must be replaced with
an estimate. That is, 2SLS or IV
estimation is required.42

Models of Student Performance
Past Inputs Model with Decay
Now assume
Yt = f(Xt, δXt-1, δ2Xt-2, …, δt-1X1, δ
tX0)
YG5 = βG5 XG5+δβG3XG3+δ2βBXB +eG5+δeG3+δ2eB
YG3 = βG3XG3+δβBXB +eG3+δeB
YG5 = βG5 XG5 + δYG3 + eG5
or ΔYG5 = βG5 XG5 + (δ-1)YG3 + eG543

Models of Student Performance
Past Inputs Model with Decay -Evaluation
•Allows for past effects or innate ability
that are often unobservable.
•The marginal effect of G3 performance on
G5 is not restricted.
• 2SLS or IV estimation is required.
44
Models of Student Performance
A note on unobservable factors
• There may be unobservable factors such
as innate ability, student personality,
teacher enthusiasm that we may never
have data for.
• This is only causes a problems if the
missing variables is correlated with any of
the variables that are included as it
biases the estimate of their impact.
45
Models of Student Performance
What does the modelling teach us?
• The models above demonstrate that
cohort gain is an improvement on
comparing levels - it may remove the
influence of innate ability and past inputs.
• But it is still effected by the current value
of the determinants of performance and
possibly past inputs.
46
Models of Student Performance
What does the modelling teach us?
• So even comparisons using Cohort Gain are
not valid unless the determinants of
Cohort Gain are held constant or
accounted for.
47

5. How to Compare and Evaluate
48
Method for Parents – Cohort Gain
• Cohort Gain is available by state over
time at http://www.nap.edu.au.
• The “gain” is the increase in a students
test score from one test to the next.
• The “cohort gain” is the average gain of
the students for a school or
state/territory.
49

Reading Cohort G3 to G5 by State
50
NSW Vic Qld WA SA Tas ACT NT Aust
Mean
scale Year 3 2010421.7
(81.6)
430.6
(77.8)
393.0
(79.0)
398.7
(86.1)
401.6
(79.2)
414.0
(87.8)
439.1
(83.4)
328.7
(121.1)
414.3
(83.3)
Mean
scale Year 5 2012499.8
(77.1)
504.1
(70.6)
480.3
(75.5)
482.6
(78.6)
483.9
(73.7)
491.7
(80.7)
519.0
(75.5)
404.8
(131.7)
493.6
(77.6)
Average Gain
(with 95% Confidence
Interval)
78.1
± 8.3
73.5
± 8.2
87.3
± 8.5
83.9
± 9.0
82.3
± 9.1
77.7
± 11.0
79.9
± 12.4
76.1
± 30.4
79.3
± 8.0
NSW Vic Qld WA SA Tas ACT NT Aust
Means
cale Year 3 2012426.0
(86.5)
432.0
(82.0)
408.5
(87.4)
407.6
(90.7)
408.9
(85.0)
419.1
(94.0)
443.8
(88.1)
332.2
(126.6)
419.6
(87.9)
Mean
scale Year 5 2014504.0
(77.8)
509.8
(73.1)
496.1
(76.6)
491.7
(80.5)
489.6
(75.6)
497.9
(83.9)
522.0
(76.9)
425.5
(112.8)
500.6
(78.0)
Average Gain
(with 95% Confidence
Interval)
78.0
± 7.0
77.8
± 6.9
87.6
± 7.2
84.1
± 7.8
80.7
± 8.0
78.8
± 11.5
78.2
± 10.5
93.3
± 27.2
81.0
± 6.5
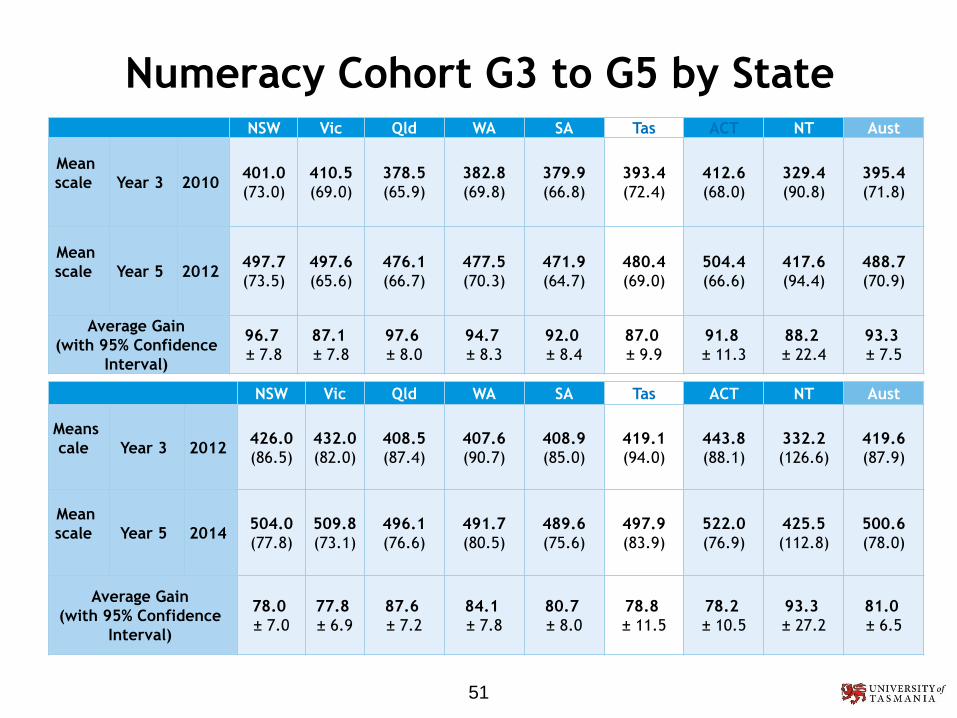
Numeracy Cohort G3 to G5 by State
51
NSW Vic Qld WA SA Tas ACT NT Aust
Mean
scale Year 3 2010401.0
(73.0)
410.5
(69.0)
378.5
(65.9)
382.8
(69.8)
379.9
(66.8)
393.4
(72.4)
412.6
(68.0)
329.4
(90.8)
395.4
(71.8)
Mean
scale Year 5 2012497.7
(73.5)
497.6
(65.6)
476.1
(66.7)
477.5
(70.3)
471.9
(64.7)
480.4
(69.0)
504.4
(66.6)
417.6
(94.4)
488.7
(70.9)
Average Gain
(with 95% Confidence
Interval)
96.7
± 7.8
87.1
± 7.8
97.6
± 8.0
94.7
± 8.3
92.0
± 8.4
87.0
± 9.9
91.8
± 11.3
88.2
± 22.4
93.3
± 7.5
NSW Vic Qld WA SA Tas ACT NT Aust
Means
cale Year 3 2012426.0
(86.5)
432.0
(82.0)
408.5
(87.4)
407.6
(90.7)
408.9
(85.0)
419.1
(94.0)
443.8
(88.1)
332.2
(126.6)
419.6
(87.9)
Mean
scale Year 5 2014504.0
(77.8)
509.8
(73.1)
496.1
(76.6)
491.7
(80.5)
489.6
(75.6)
497.9
(83.9)
522.0
(76.9)
425.5
(112.8)
500.6
(78.0)
Average Gain
(with 95% Confidence
Interval)
78.0
± 7.0
77.8
± 6.9
87.6
± 7.2
84.1
± 7.8
80.7
± 8.0
78.8
± 11.5
78.2
± 10.5
93.3
± 27.2
81.0
± 6.5
Method for Parents – Cohort Gain
• However this does not consider that
determinants of cohort gain also vary
across state.
• The models tell us we also need to
consider
– all past educational inputs
– school resources, student background, peers
and teachers
52

Method for Parents – Cohort Gain
• Cohort Gain is also available by school at
http://www.myschool.edu.au
• It offers a school’s average and median
cohort gain compared against
– All schools
– Schools with statistically similar schools
– Schools with similar starting values
53

Method for Parents – Cohort Gain
• Comparing with similar starting values
– we are comparing schools for which students
have had a similar history of education
inputs.
– this with hold the past determinants of
performance constant when making
comparisons.
54

Method for Parents – Cohort Gain
• Comparing with similar schools
– we are comparing schools that have a similar
level of school resources, socioeconomic
background of students and peers and
possibly teacher quality.
– this with hold the current determinants of
performance constant when making
comparisons.
55

Reading Goulburn St Primary G3-5 2011-2013
56

Numeracy Goulburn St Primary G3-5 2011-2013
57

Reading Albuera St Primary G3-5 2011-2013
58

Numeracy Albuera St Primary G3-5 2010-12
59

How to Compare and Evaluate
• Ideally we want to simultaneously
account for all (observable) determinants
of education performance at a state,
school or student level?
• How do we do that?
• Good data and econometrics!
60
How to Compare and Evaluate
• Good Data
– Need data on all observable determinants.
• Econometrics!
– Estimates the relationship between a
dependent variable and each explanatory
variable, holding all other explanatory
variables constant.
61

How to Compare and Evaluate
62
• Using some data from obtained
Tasmanian Department of Education,
Educational Performance Services by an
UTAS PhD student from 2003-2005.
• Constrained by what was initially
collected and coded.
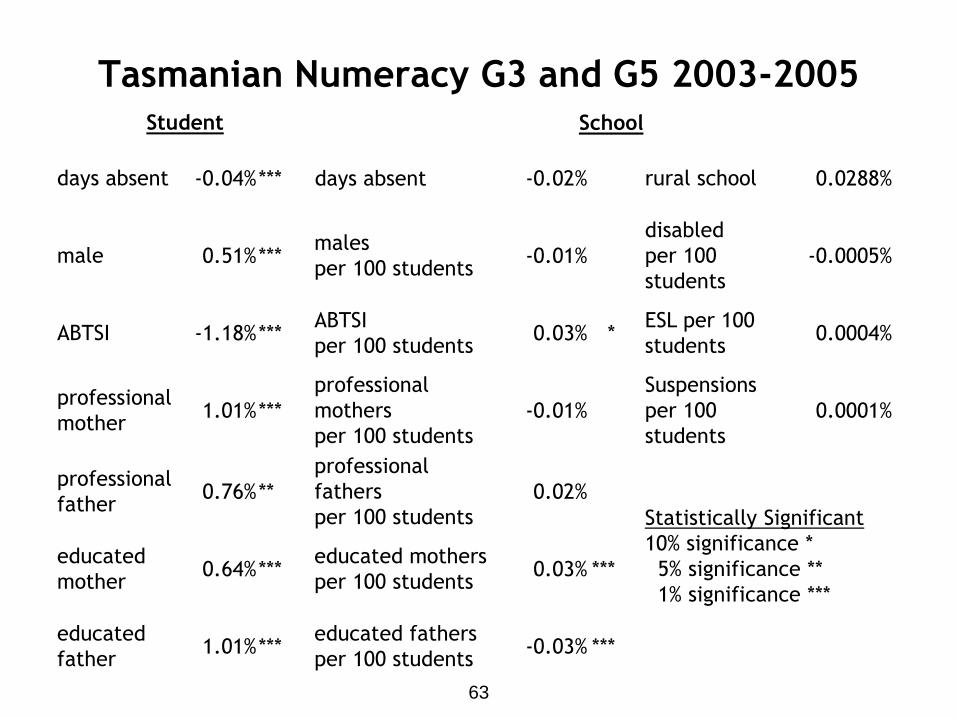
Tasmanian Numeracy G3 and G5 2003-2005
63
Student School
days absent -0.04%*** days absent -0.02% rural school 0.0288%
male 0.51%***males
per 100 students-0.01%
disabled
per 100
students
-0.0005%
ABTSI -1.18%***ABTSI
per 100 students0.03% *
ESL per 100
students0.0004%
professional
mother1.01%***
professional
mothers
per 100 students
-0.01%
Suspensions
per 100
students
0.0001%
professional
father0.76%**
professional
fathers
per 100 students
0.02%
Statistically Significant
10% significance *
5% significance **
1% significance ***
educated
mother0.64%***
educated mothers
per 100 students0.03% ***
educated
father1.01%***
educated fathers
per 100 students-0.03% ***
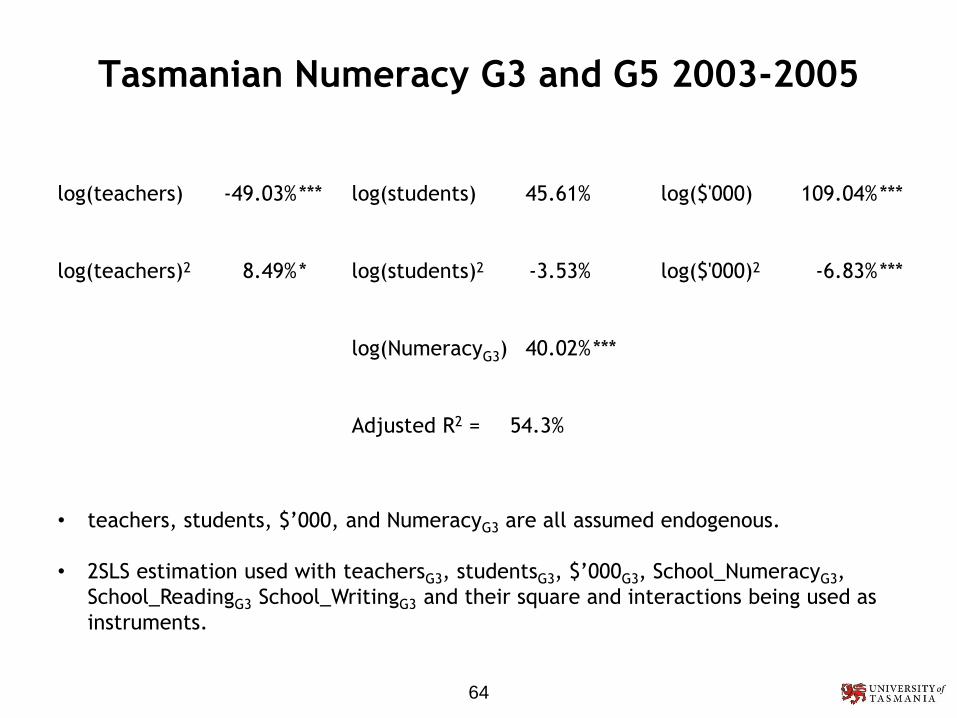
Tasmanian Numeracy G3 and G5 2003-2005
64
log(teachers) -49.03%*** log(students) 45.61% log($'000) 109.04%***
log(teachers)2 8.49%* log(students)2 -3.53% log($'000)2 -6.83%***
log(NumeracyG3) 40.02%***
Adjusted R2 = 54.3%
• teachers, students, $’000, and NumeracyG3 are all assumed endogenous.
• 2SLS estimation used with teachersG3, studentsG3, $’000G3, School_NumeracyG3,
School_ReadingG3 School_WritingG3 and their square and interactions being used as
instruments.
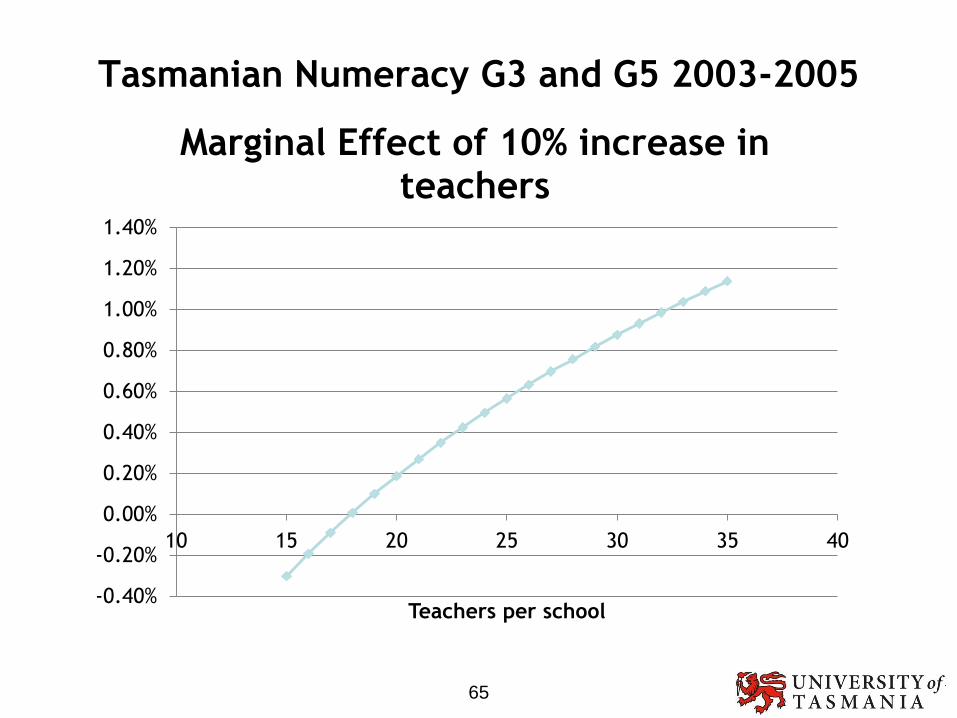
Tasmanian Numeracy G3 and G5 2003-2005
65
-0.40%
-0.20%
0.00%
0.20%
0.40%
0.60%
0.80%
1.00%
1.20%
1.40%
10 15 20 25 30 35 40
Teachers per school
Marginal Effect of 10% increase in teachers
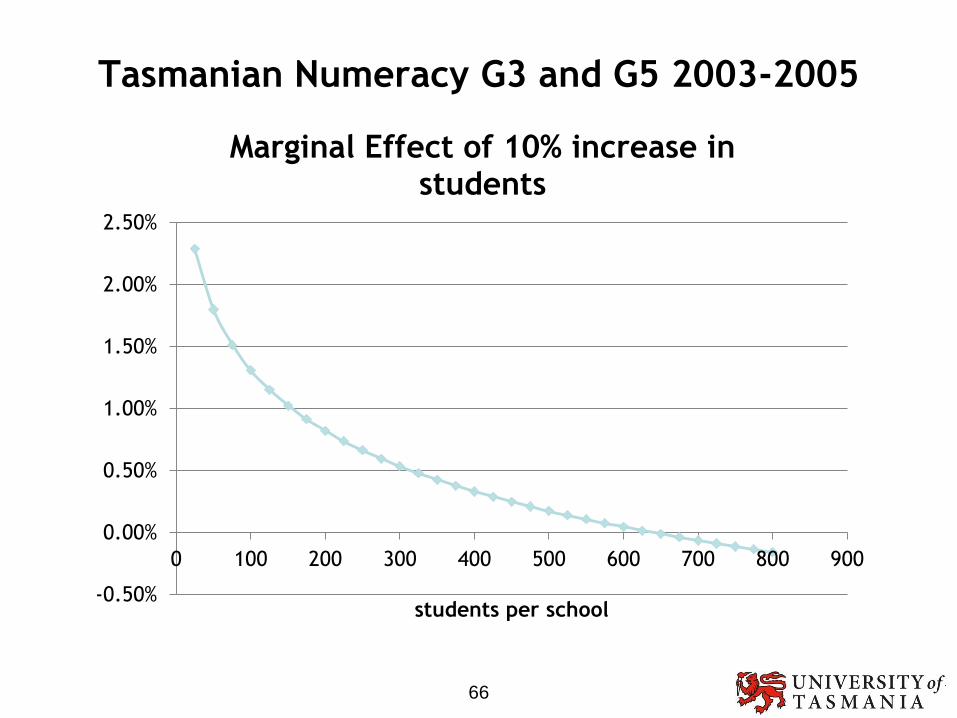
Tasmanian Numeracy G3 and G5 2003-2005
66
-0.50%
0.00%
0.50%
1.00%
1.50%
2.00%
2.50%
0 100 200 300 400 500 600 700 800 900
students per school
Marginal Effect of 10% increase in students
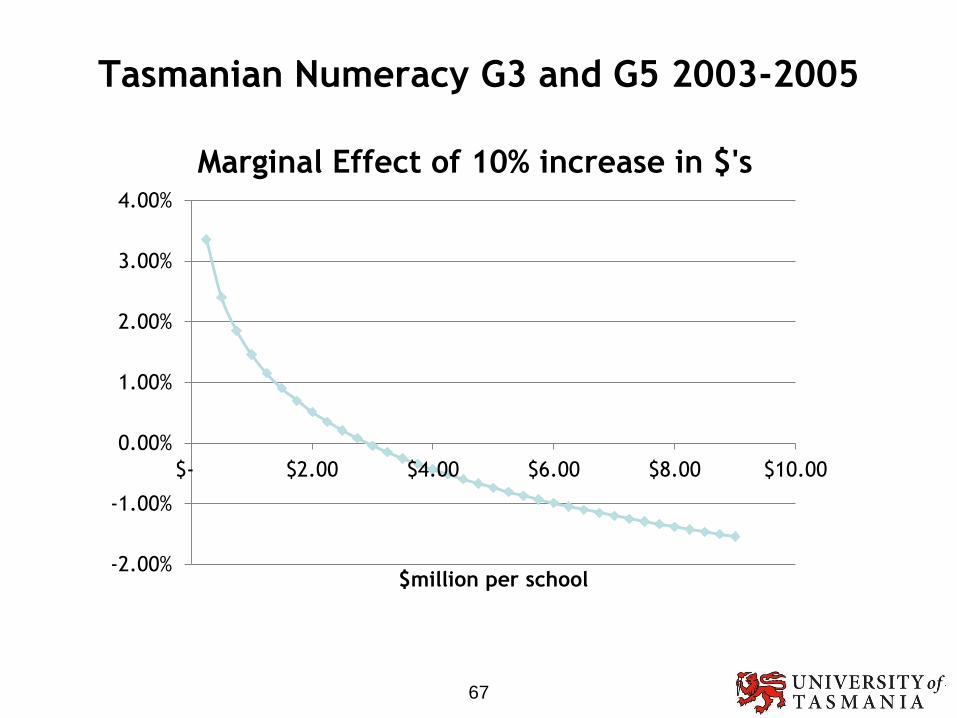
Tasmanian Numeracy G3 and G5 2003-2005
67
-2.00%
-1.00%
0.00%
1.00%
2.00%
3.00%
4.00%
$- $2.00 $4.00 $6.00 $8.00 $10.00
$million per school
Marginal Effect of 10% increase in $'s
More Data
• Need to collect new data with
– More information about parent’s occupation
and education.
– More accurate school resource variables.
– Over a longer time period.
– Include high schools
– Include Australian data to allow interstate
comparisons.
– Allow for more interaction terms between
resources and student background.
68
Summary
• You can’t make comparisons of student
scores or even cohort gain across states
or schools unless the determinants are
held constant.
• Comparing Cohort Gain for schools with
statistically similar schools or schools
with similar starting values is OK.
• The best evaluation can be performed
with extensive data and good
econometric/statistical technique.
69
The End
• Questions?
• Thankyou
70