utca - university transportation center for alabamautca.eng.ua.edu/files/2011/08/04111fnl.pdf ·...
TRANSCRIPT

i
Web-Enabled Bridge Sufficiency Calculator
By
Alisha Malloy, Ph. D., David P. Hale, Ph.D., and
Shane Sharpe, Ph.D. Area of Management Information Systems
Aging Infrastructure Systems Center of Excellence The University of Alabama
Tuscaloosa, Alabama
Prepared by
UTCA University Transportation Center for Alabama
The University of Alabama, The University of Alabama in Birmingham, and The University of Alabama at Huntsville
UTCA Report 04111 November 17, 2005

ii
Technical Report Documentation Page 1. Report No
2. Government Accession No. 3. Recipient Catalog No.
5. Report Date November 17, 2005
4. Title and Subtitle Web-Enabled Bridge Sufficiency Calculator 6. Performing Organization Code
7. Authors Drs. David Hale, Alisha Malloy, and Shane Sharpe
8. Performing Organization Report No. UTCA Report 04111
10. Work Unit No.
9. Performing Org. Name and Address Aging Infrastructure Systems Center of Excellence The University of Alabama Box 870226 Tuscaloosa, Alabama 35487-00226
11. Contract or Grant No.
13. Type of Report and Period Covered Final Report: October 1, 2004 – December 31, 2004.
12. Sponsoring Agency Name and Address University Transportation Center for Alabama Department of Civil, Construction & Environmental Engineering P O Box 870205 Tuscaloosa, AL 35487
14. Sponsoring Agency Code
15. Supplementary Notes 16. Abstract This project conceptualized, developed detailed requirements, constructed and deployed a bridge condition calculator based on Federal Highway Administration (FHWA) sufficiency calculations. The calculator provides bridge inspectors two levels of support: 1. The tool allows bridge inspectors to effectively enter and edit bridge condition data. The tool also emulates the
FHWA certified algorithm and provides real-time bridge rating. By providing instantaneous rating calculations bridge engineers and inspectors are enabled to: a) Perform on-site “what-if” analyses to examine the influence of individual variables and their relationships
to the overall sufficiency rating. b) Explain and communicate why a specific bridge may or may not be eligible for federal funds due by
accessing historic information and codified FHWA funding guidelines. 2. The tool provides an explanation for components of the algorithms to aid bridge engineers and inspectors in
comprehending the ratings they assign to components.
Specifically the web-enabled sufficiency calculator includes: 1. 34 bridge characteristic variables, 2. Algorithms for calculating S1, S2, S3, and S4, 3. Rules defining functional obsolescence and structural deficiencies, 4. Knowledge of maintenance or rehabilitation activities using federal funds, and 5. Drill-down capabilities to better understand the interaction between rating variables. The underlying form of this calculator can be used beyond the sufficiency rating. The pattern embedded in the tool can be reused with additional asset management programs in which a rating must be calculated, where an inspector’s subjective judgment on component conditions sum to a composite metric for preventive maintenance, asset rehabilitation, or asset replacement. In addition, this tool provides the pattern for on-site access to historic data, field input and verification of new data. 17. Key Words Asset management Information systems Bridge management Sufficiency (statistic) Decision support Mobile computing
18. Distribution Statement
19. Security Class (of report) Unclassified
20. Security Class. (Of page) 21. No of Pages
22. Price
iii
Table of Contents Technical Report Documentation Page .......................................................................................... ii Contents ......................................................................................................................................... iii Lists of Tables and Figures ............................................................................................................ iv Executive Summary ........................................................................................................................ v 1.0 Background............................................................................................................................... 1 2.0 Project Value............................................................................................................................. 2 3.0 Development Process................................................................................................................ 3 4.0 Value Derived from the Web Sufficiency Calculator............................................................... 5 4.1 Sufficiency Summary Screen Features ............................................................................... 5 5.0 Conclusion ................................................................................................................................ 7 6.0 References ................................................................................................................................ 8 7.0 Appendix A - Breakdown of the Web Sufficiency Calculator ............................................... 11
7.1 Entering Values ................................................................................................................ 11 8.1 Analysis Tools.................................................................................................................. 12
8.0 Appendix B – Project Management........................................................................................ 17
iv
List of Figures Title Page 4-1 Sufficiency Rating and Bridge Status...................................................................................... 4 4-2 Drill-Down Buttons ................................................................................................................. 5 4-3 Appraisal Values...................................................................................................................... 6 7-1 Initial Input Screen .................................................................................................................. 9 7-2 Entering Values ..................................................................................................................... 10 7-3 S1: Structural Adequacy and Safety...................................................................................... 11 7-4 S2: Serviceability and Functional Obsolesence..................................................................... 12 7-5 S2 J: Rating Reductions......................................................................................................... 13 7-5.2 S2 G: Width of Roadway Insufficiency ............................................................................. 14 7-5.3 S2 H: Width of Roadway Insufficiency ............................................................................. 14 7-5.4 S2 I: Vertical Clearance Insufficiency................................................................................ 15 7-6 S3: Essentiality for Public Use .............................................................................................. 15 7-7 S4: Speical Reductions .......................................................................................................... 16
v
Executive Summary This project conceptualized, developed detailed requirements, constructed and deployed a bridge condition calculator based on Federal Highway Administration (FHWA) sufficiency calculations. The calculator provides bridge inspectors two levels of support:
1. The tool allows bridge inspectors to effectively enter and edit bridge condition data. The tool also emulates the FHWA certified algorithm and provides real-time bridge rating. By providing instantaneous rating calculations bridge engineers and inspectors are enabled to: • Perform on-site “what-if” analyses to examine the influence of individual variables
and their relationships to the overall sufficiency rating. • Explain and communicate why a specific bridge may or may not be eligible for
federal funds due by accessing historic information and codified FHWA funding guidelines.
2. The tool provides an explanation for components of the algorithms to aid bridge engineers and inspectors in comprehending the ratings they assign to components.
Specifically the web-enabled sufficiency calculator includes:
1. 34 bridge characteristic variables, 2. Algorithms for calculating Structural Adequacy and Safety (S1), Serviceability and
Functional Obsolescence (S2), Essentiality for Public Use (S3), and Special Reductions (S4),
3. Rules defining functional obsolescence and structural deficiencies, 4. Knowledge of maintenance or rehabilitation activities using federal funds, and 5. Drill-down capabilities to better understand the interaction between rating variables.
The underlying form of this calculator can be used beyond the sufficiency rating. The pattern embedded in the tool can be reused with additional asset management programs in which a rating must be calculated, where an inspector’s subjective judgment on component conditions sum to a composite metric for preventive maintenance, asset rehabilitation, or asset replacement. In addition, this tool provides the pattern for on-site access to historic data, field input and verification of new data.

1
1.0 Background Effective bridge maintenance management is dependent upon the availability of reliable information regarding structural and functional elements (that is, bridge component conditions) anytime, anywhere. At the start of the project, this data was available but not in a convenient mode the Alabama Department of Transportation (ALDOT) bridge inspectors and managers. This project conceptualized, designed, constructed and deployed such an asset management system that put bridge information at the fingertips of state and county bridge engineers and inspectors by developing a new web-enabled tool for accessing existing bridge information parameters, inputting new bridge data, calculating in real-time a bridge sufficiency rating, and providing detailed explanations of how intermediate computations impact the overall rating. The computation of a bridge sufficiency rating ultimately determines the eligibility for federal funding. The final rating has to come from the Alabama Bridge Information Management System (ABIMS) to qualify for official submission to the Federal Highway Administration (FHWA). The determination of a bridge’s sufficiency rating not only requires knowledge of the physical and functional characteristics of a bridge, but also requires a detailed understanding of the how the FHWA computer systems have interpreted the federal bridge inspection guidelines. Before a web-enabled bridge sufficiency calculator was available, calculation cycle time was an issue. Bridge inspectors had to write bridge information on paper and then input that information into a terminal at their office which provided connectivity to ABIMS. ABIMS would then process that information in batch mode overnight, and bridges’ sufficiency ratings were returned to the inspector until the next day.
2
2.0 Project Value The project explicitly addresses the University Transportation Center for Alabama (UTCA) Annual Research and Training Plan with respect to:
• County Issues - as bridge information from any “owner” may be input and calculated. The intermediate rating explanation also aids inspectors in speaking with county commissioners.
• Bridge System Projects by investigating management of funding for bridge replacement • Developing a management system for rapid bridge rating
The project puts bridge information at the fingertips of bridge engineers and inspectors by providing a new, web-enabled tool for bridge data input, bridge sufficiency rating calculation, and access to existing bridge information parameters. It raises the quality of bridge element data, communicates the reasons for funding eligibility decisions, and reduces processing time. The project applies research results directly to the ALDOT bridge management system and funding allocation systems and has the potential to be extended to bridge management practices in other states’ departments of transportation. In summary, the web-enabled bridge sufficiency calculator accomplishes the following objectives:
• Readily provides bridge information to county/city engineers and county bridge inspectors,
• Provides a “what-if” analysis tool to examine the influence of individual variables and their relationship to the overall sufficiency rating, thus increasing inspector understanding of the bridge rating calculation,
• Provides reliable information regarding the structural and functional sufficiency of Alabama bridges, which is essential for effective bridge maintenance management,
• Provides knowledge of the physical and functional characteristics of a bridge and the federal interpretations of bridge inspection guidelines, both necessary to determine a bridge’s sufficiency rating, and
• Reduces the total cycle time required to enter the final sufficiency rating details into Alabama Bridge Inventory Management System.
3
3.0 Development Process To gain an understanding of the bridge sufficiency calculation process, the principle investigators undertook an initial project to prototype a stand-alone bridge sufficiency calculator. The goals of the prototype were to:
• Demonstrate the capability to automate sufficiency calculations, • Develop explicit workflow requirements for drill-down capabilities, and • Better understand the interaction among rating parameters, data validation rules, and
interface design specifications. The initial requirements and resulting stand-alone bridge sufficiency calculator were derived from the Alabama’s Bridge Inspection Manual (2002), and interaction with ALDOT Maintenance Bureau engineers. The resulting calculator was presented for evaluation at the fall 2003 ALDOT Bridge Maintenance Workshops held in Auburn, Guntersville, Foley, and Tuscaloosa. The prototype was presented at the First Annual UTCA Research Results workshop in November, 2003. Though the response from ALDOT and county bridge maintenance engineers was overwhelmingly positive, additional requirements were elicited at the meetings. Specifically, bridge engineers evaluated the accuracy of the calculations and ratings. In addition, feedback from state and county bridge engineers indicated that the tool must:
• Reduce data entry mistakes and training time, • Provide real time feedback of bridge funding eligibility, and • Provide access to data throughout the state.
To reduce clerical mistakes and training time, the tool a graphical user interface (GUI) was added, enabling intuitive naming conventions for bridge parameters, algorithms, and error messages. Input error checking, validation, and consistency checking helps were also provided. To provide real-time feedback, the calculator accesses existing ABIMS bridge condition data and transmits field data to ABIMS. Analyses and explanations of weighting factors and sufficiency rating subcomponents are readily available. Sensitivity is included for the sufficiency rating to variations in subcomponent values. To provide secure statewide access, the tool uses a three-tier software architecture and the existing ALDOT secure intranet. The tool supplements the existing IBM 3270 “green screen system” housed at the ALDOT central office complex in Montgomery. The web-enabled sufficiency calculator augments the current system, which has limited access and obscure coding schemes. The process to develop the three-tier architecture included:
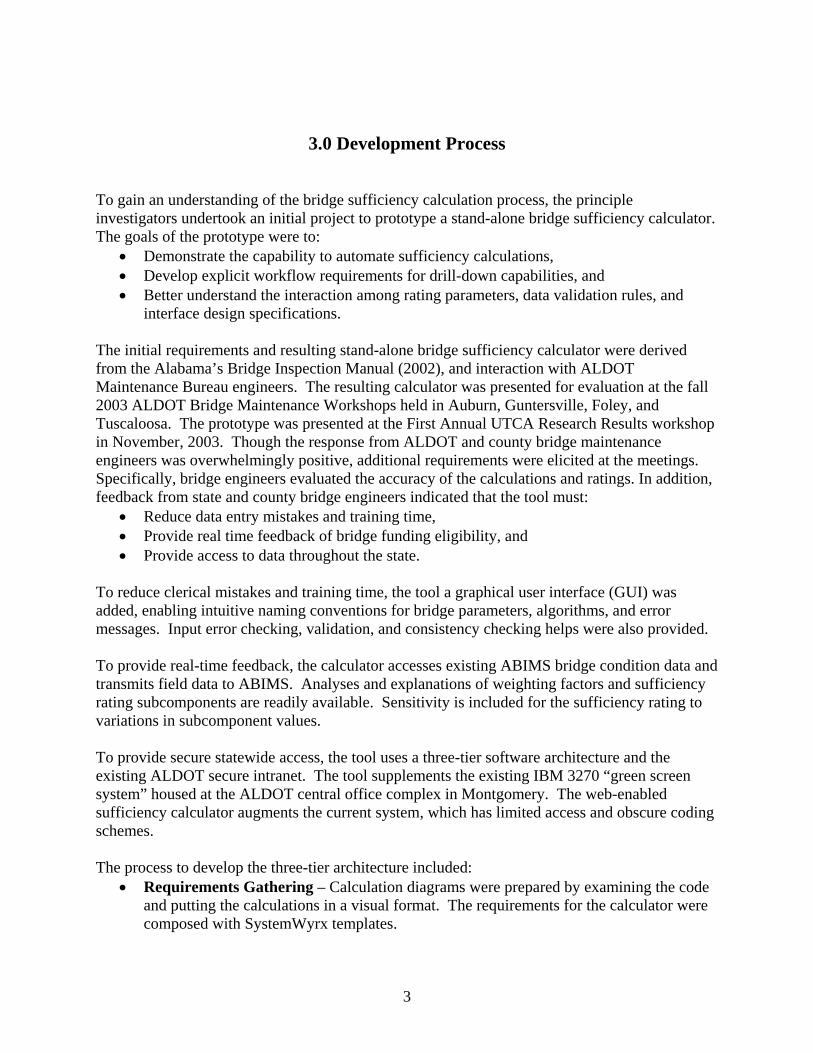
• Requirements Gathering – Calculation diagrams were prepared by examining the code and putting the calculations in a visual format. The requirements for the calculator were composed with SystemWyrx templates.

4
• Business Rule (class) design – The next step was recoding the stand-alone calculator class structure for .NET compliance and providing the business rules for the three-tier architecture.
• User-Interface (UI) design – The design provided an ASP.NET presentation interface
that can be deployed over the intranet. The interface is deliberately devoid of business rules and other functionality, which has been placed in the class tier of the three-tier architecture.
• Data Access design – Access was provided to the Oracle database tables, which are
synchronized with the data files stored in ABIMS. Modifications to the database tables can be made without modifications to either the UI or Class structure. This places the tool in compliance with three-tier architecture.
• Verify and Validate – Accuracy and precision of all calculations were verified by
comparing responses from the stand-alone, mainframe, and web-enabled sufficiency calculator.
A working web-enabled calculator was provided to ALDOT personnel for on-the-job evaluation during the fall of 2004 and spring 2005. In late spring 2005, final modifications for hosting by ALDOT were completed and delivered.
5
4.0 Value Derived from the Web Sufficiency Calculator
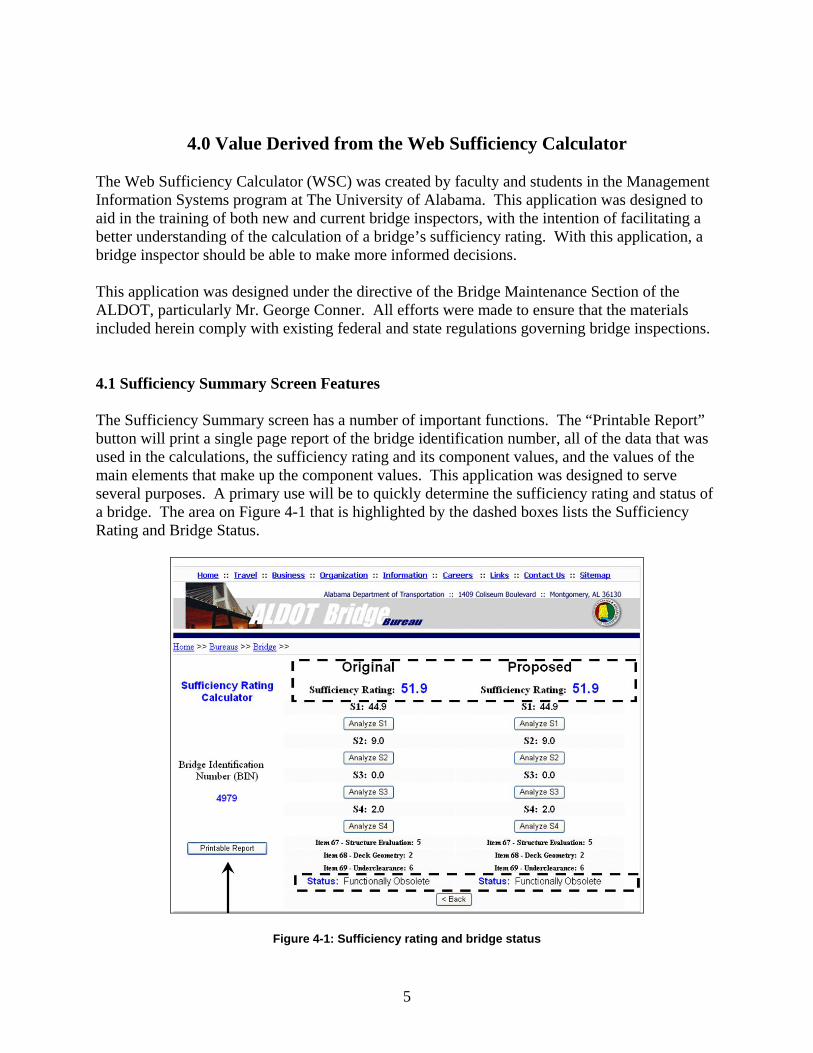
The Web Sufficiency Calculator (WSC) was created by faculty and students in the Management Information Systems program at The University of Alabama. This application was designed to aid in the training of both new and current bridge inspectors, with the intention of facilitating a better understanding of the calculation of a bridge’s sufficiency rating. With this application, a bridge inspector should be able to make more informed decisions. This application was designed under the directive of the Bridge Maintenance Section of the ALDOT, particularly Mr. George Conner. All efforts were made to ensure that the materials included herein comply with existing federal and state regulations governing bridge inspections. 4.1 Sufficiency Summary Screen Features The Sufficiency Summary screen has a number of important functions. The “Printable Report” button will print a single page report of the bridge identification number, all of the data that was used in the calculations, the sufficiency rating and its component values, and the values of the main elements that make up the component values. This application was designed to serve several purposes. A primary use will be to quickly determine the sufficiency rating and status of a bridge. The area on Figure 4-1 that is highlighted by the dashed boxes lists the Sufficiency Rating and Bridge Status.
Figure 4-1: Sufficiency rating and bridge status
6
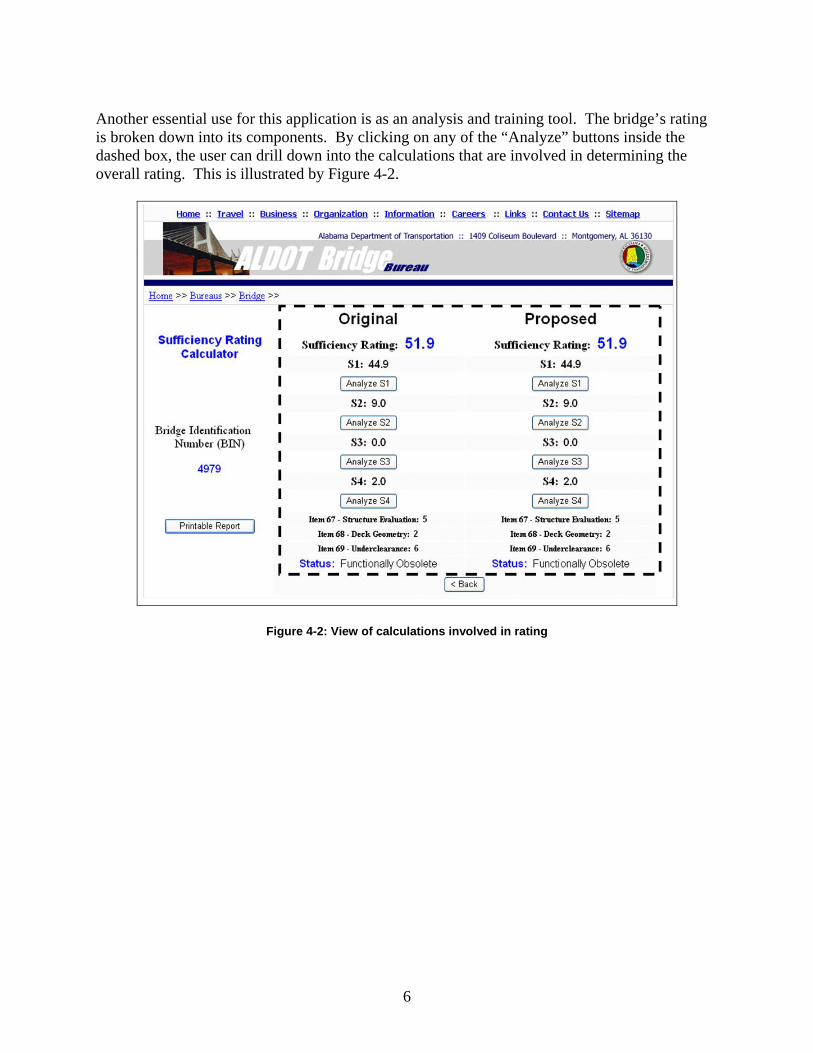
Another essential use for this application is as an analysis and training tool. The bridge’s rating is broken down into its components. By clicking on any of the “Analyze” buttons inside the dashed box, the user can drill down into the calculations that are involved in determining the overall rating. This is illustrated by Figure 4-2.
Figure 4-2: View of calculations involved in rating
7
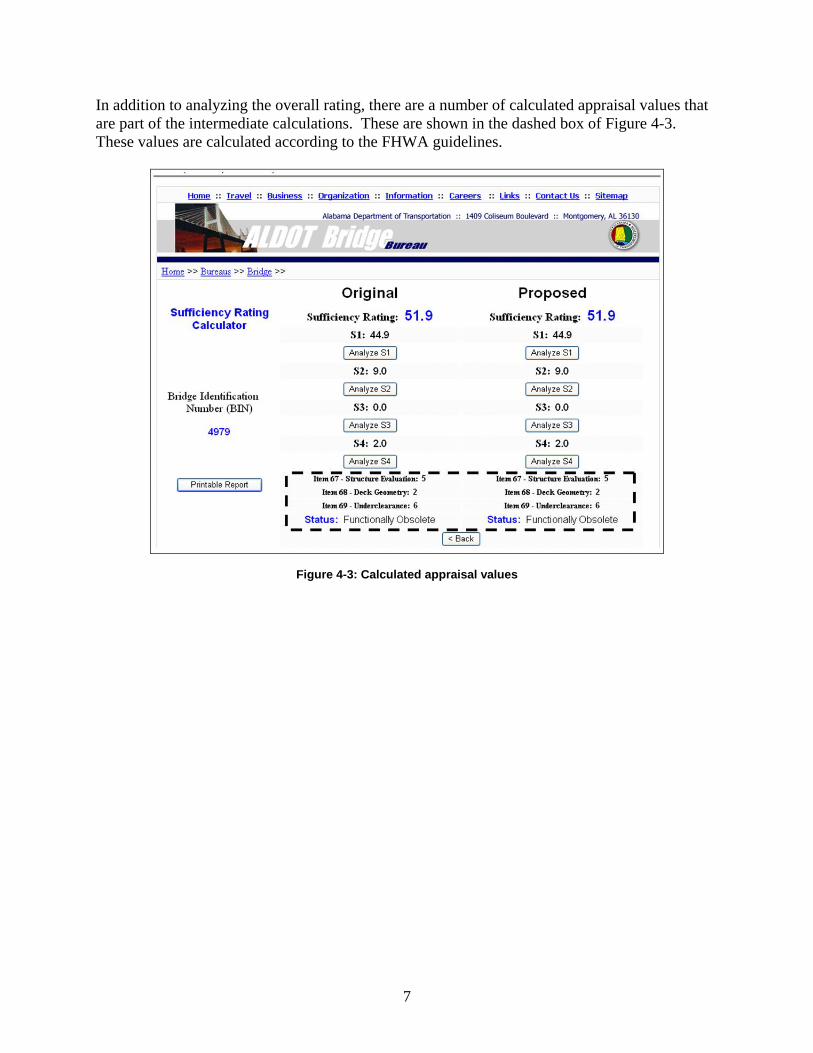
In addition to analyzing the overall rating, there are a number of calculated appraisal values that are part of the intermediate calculations. These are shown in the dashed box of Figure 4-3. These values are calculated according to the FHWA guidelines.
Figure 4-3: Calculated appraisal values

8
5.0 Conclusion
The tool developed in this project provides immediate feedback throughout the bridge condition data acquisition process. It complies with applicable FHWA guidelines and was developed in collaboration with ALDOT by the Aging Infrastructure Systems Center of Excellence at The University of Alabama. Input for the look and feel of the tool was derived from county bridge engineers and inspectors, state bridge engineers and inspectors, and members of ALDOT’s Maintenance Bureau. The tool has been reviewed by FHWA staff and deployed by ALDOT. Beyond providing a pattern for on-site access to historic data, field input and verification of new data, this tool provides its users with the ability to determine bridge funding eligibility. It provides instantaneous rating calculations, so bridge engineers and inspectors are enabled to:
1. Perform on-site “what-if” analysis, examining the influence of individual variables and their relationship to the overall sufficiency rating..
2. Explain and communicate why a specific bridge may or may not be eligible for federal funds, as a result of access to historic information and codified FHWA funding guidelines.
Specifically the web-enabled sufficiency calculator includes:
1. 34 bridge characteristic variables, 2. Algorithms for calculating Structural Adequacy and Safety (S1), Servicability and
Functional Obsolescence (S2), Essentialiality for Public Use (S3), and Special Reductions (S4),
3. Rules defining functional obsolescence and structural deficiencies, 4. Knowledge of maintenance or rehabilitation activities using federal funds, and 5. Drill-down capabilities to enable inspectors to better understand the interaction between
rating variables.
The tool provides access to bridge condition and eligibilty information to state/county/city engineers and inspectors through a web interface. Through immediate feedback, the tool has the potential to raise the quality of bridge element condition data, communicate the reasons for funding eligibility decisions, and reduce processing time. To reduce clerical mistakes and training, the tool’s graphical user interface enables a more intuitive naming convention for bridge parameters, algorithms, and error messages than the existing legacy batch ABIMS implementation. In addition to on-line help, the tool provides input error checking, validation, and consistency checking. The tool provides real-time feedback by accessing existing ABIMS bridge condition data and transmitting field data back to ABIMS. This benefits the inspector by providing readily available analysis and explanations of weighting factors and sufficiency rating subcomponents. Sensitivity of the sufficiency rating to variations in subcomponent values is also included.

9
The project applies research results directly to ALDOT’s bridge management system and funding allocation systems, and has the potential to be extended to bridge management practices in other states’ departments of transportation. Likewise, the process and decision patterns embedded in the tool can be a model for other management asset tools in which an inspector’s subjective judgement on an asset’s component conditions are used to create a calculated composite metric that is used to judge the course of preventive maintenance, asset rehabilition, or replacement.
10
6.0 References
Bridge Inspection Manual, Maintenance Bureau, Alabama Department of Transportation,
Montgomery, Alabama Guidelines for Operation, Alabama Department of Transportation, Montgomery,
Alabama National Bridge Inspection Standards, Chapter 23, Code of Federal Regulations, Part
650, Subpart C Recording and Coding Guide for the Structural Inventory and Appraisal of the Nation’s
Bridges

11
Appendix A Breakdown of the Web Sufficiency Calculator
Figure 7-1: Initial input screen 7.1 Entering Values Once a bridge identification number (BIN) has been entered the previous-inspection values are retrieved and used to populate both the original and proposed fields. The user can change the proposed values for the selected bridge. In all, there are 34 items that are used in the calculations. They are organized on the two input screens in the same order that they appear in the ABIMS application. The values can be selected from either the drop-down boxes or by entering the numbers into the text fields. The values that are available in the drop-down boxes are the only valid values for an item as listed in the federal and state codes that define that item; this feature avoids the entry of invalid values. Figures 7-1 and 7-2 illustrate the initial input screen and typical data entry.
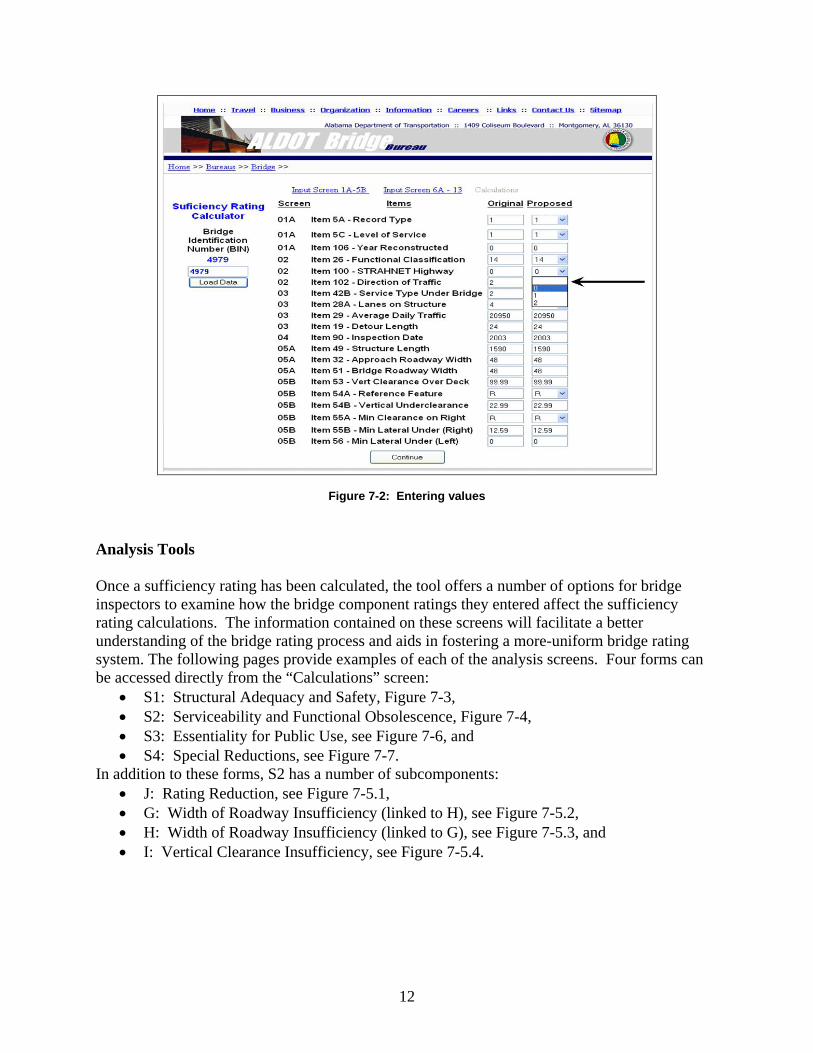
12
Figure 7-2: Entering values Analysis Tools Once a sufficiency rating has been calculated, the tool offers a number of options for bridge inspectors to examine how the bridge component ratings they entered affect the sufficiency rating calculations. The information contained on these screens will facilitate a better understanding of the bridge rating process and aids in fostering a more-uniform bridge rating system. The following pages provide examples of each of the analysis screens. Four forms can be accessed directly from the “Calculations” screen:
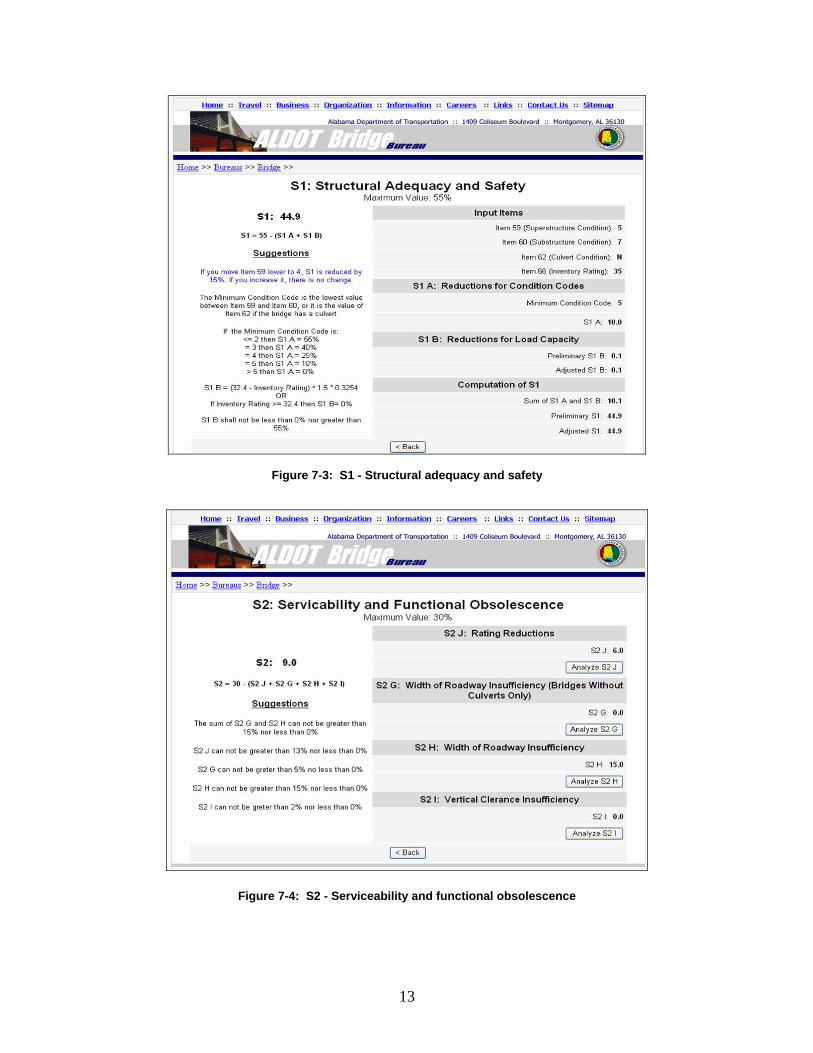
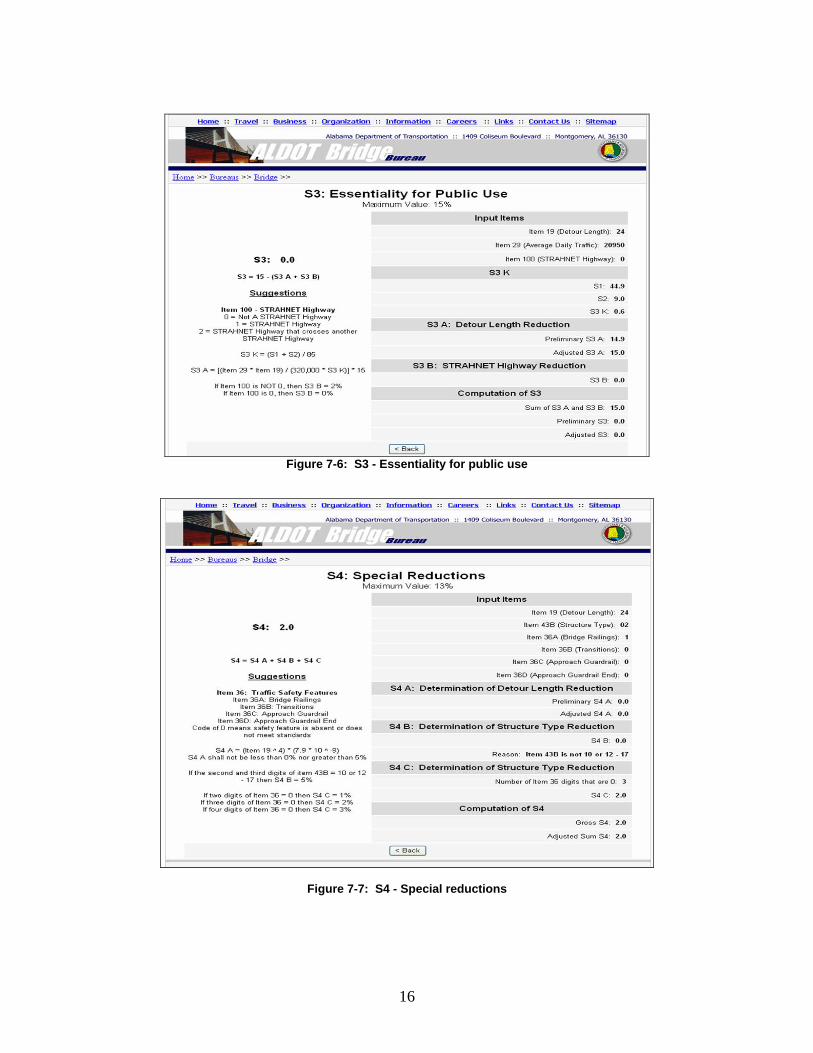
• S1: Structural Adequacy and Safety, Figure 7-3, • S2: Serviceability and Functional Obsolescence, Figure 7-4, • S3: Essentiality for Public Use, see Figure 7-6, and • S4: Special Reductions, see Figure 7-7.
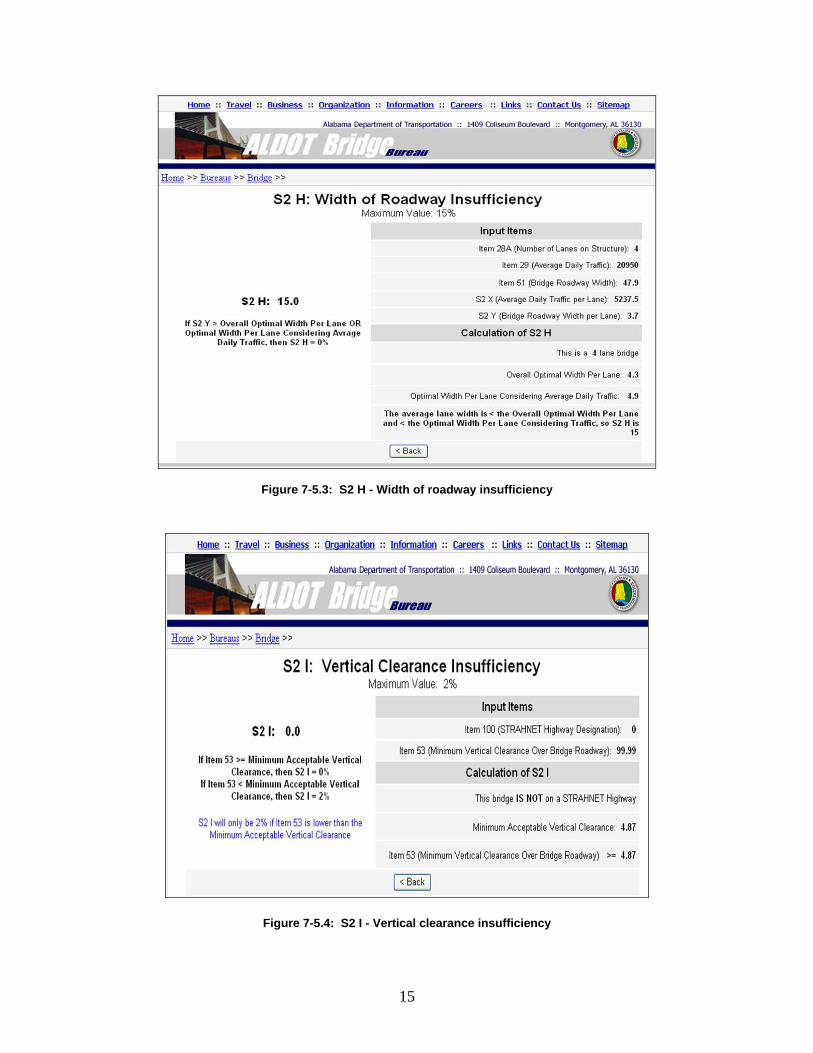
In addition to these forms, S2 has a number of subcomponents: • J: Rating Reduction, see Figure 7-5.1, • G: Width of Roadway Insufficiency (linked to H), see Figure 7-5.2, • H: Width of Roadway Insufficiency (linked to G), see Figure 7-5.3, and • I: Vertical Clearance Insufficiency, see Figure 7-5.4.
13
Figure 7-3: S1 - Structural adequacy and safety
Figure 7-4: S2 - Serviceability and functional obsolescence

14
Figure 7-5.1: S2 J - Rating reductions
Figure 7-5.2: S2 G - Width of roadway insufficiency
15
Figure 7-5.3: S2 H - Width of roadway insufficiency
Figure 7-5.4: S2 I - Vertical clearance insufficiency
16
Figure 7-6: S3 - Essentiality for public use
Figure 7-7: S4 - Special reductions
17
Appendix B Project Management
Alisha D. Malloy (Mobile Computing Lead) joined The University of Alabama in the fall of 2002 as an Assistant Professor of MIS. She received her Ph.D. in Computer Information Systems from Georgia State University, her M.S. in Engineering Management from Old Dominion University, and her B.S. in Engineering from the U. S. Naval Academy. Dr. Malloy’s research focuses on mobile computing and the integration of infrastructure design into the systems development process. This work is an extension of her experience as a telecommunications design consultant for Sprint. Her work on wireless dependability, quality of service, and mobile commerce has been published in the ACM Journal on Mobile Networks and Applications (MONET); Encyclopedia of Information Systems; Computers; and several national and international research conferences. Dr. Malloy leads the UA-MIS program’s diversity recruiting and retention initiative, aimed at maintaining and improving the program’s reputation for inclusion. Through her leadership, current and potential students from all backgrounds, ethnicities, and experiences are welcomed and nurtured. She is an active graduate of, and an ongoing contributor to, the KPMG Ph.D. Project, aimed at improving minority access to and success in doctoral business programs. David P. Hale (Architect) is the Director of the MIS Programs at The University of Alabama and the William White McDonald Family Distinguished Faculty Fellow. Dr. Hale also serves as the Director of the Aging Infrastructure Systems Center of Excellence, and the Enterprise Integration Lab. He received his Ph.D. in MIS from the UW-Milwaukee. Dr. Hale's research has resulted in over 50 scholarly and IS professional publications in journals and conference proceedings. Dr. Hale's research has been funded by the National Science Foundation, U.S. Department of Transportation, U.S. Department of Commerce, Accenture, Alabama Departments of Human Resources and Transportation, Computer Sciences Corporation, the KPMG Peat Marwick Research Foundation, Procter and Gamble, Sterling Software, Texas Instruments, and UTCA. In addition to the organizations listed above, he has consulted for Acuity, AT&T, Tenneco, EDS, Exxon-Mobil, FedEx, Georgia Pacific, The Home Depot, Russell Athletics, and Rohm and Haas. His current research concentrates on refining and extending engineered systems development concepts, asset management systems, and he continues to consult in the areas of software application architecture, enterprise integration, process workflow, and software quality assurance. Dr. Hale was honored by the University in 2001 by being named the University’s Blackmon-Moody Outstanding Professor of the Year, and in 2002 his faculty colleagues in the Culverhouse College of Business presented him with the Thomas Moore Endowed Undergraduate Teaching Award.

18
Shane Sharpe (Construction/Quality Control Lead) is Director of the Computer-Based Honors Program at The University of Alabama and the Derrell Thomas Endowed Teaching Excellence Faculty Fellow in MIS. He received his Ph.D. in Management Information Systems from Texas Tech University. Dr. Sharpe’s research focuses on improving business application development methods through discovering and building best practices. His related works on component-based software development methods, software maintenance, and IT support for enterprise integration have been published in journals such as the International Journal of Human-Computer Studies, Journal of Systems Management, Journal of Computer Information Systems, Journal of Software Maintenance, Journal of Cost Accounting, and Information Systems Audit and Control Journal. His research efforts have been funded by the National Science Foundation and by regional, national, and global organizations including the Alabama Departments of Human Resources and Transportation, The Home Depot, Energen, Georgia Pacific, Procter and Gamble, and Russell Corporation.
Dr. Sharpe has been recognized by the University of Alabama community for his significant and sustained contribution to its research, teaching, and outreach missions. He received the University’s highest awards for his commitment to teaching: the Mayer Award and the National Alumni Association Award. Students This project actively involved over 50 students. One full-time (20 hours per week) graduate student worked on the project during the winter and spring of 2004, and two full-time (20 hours per week) undergraduate students during the fall of 2004 and the spring of 2005. In addition, two graduate students worked on the project 30 hours per week for twelve months. The students defined the categories of users and reporting requirements for each user category, identified data sources and structure, designed prototype screens and reports, performed detailed analysis of workflow navigation between screens and reports, developed a working prototype, and created training materials for ALDOT staff.