utility of different exposure metrics used in
TRANSCRIPT

Halûk Özkaynak
US EPA, Office of Research and Development National Exposure Research Laboratory, RTP, NC
Presented at the
NYSERDA EMEP 2011 Conference Albany, NY
November 15, 2011
Utility of Different Exposure Metrics
used in Epidemiological Studies of Air Pollution
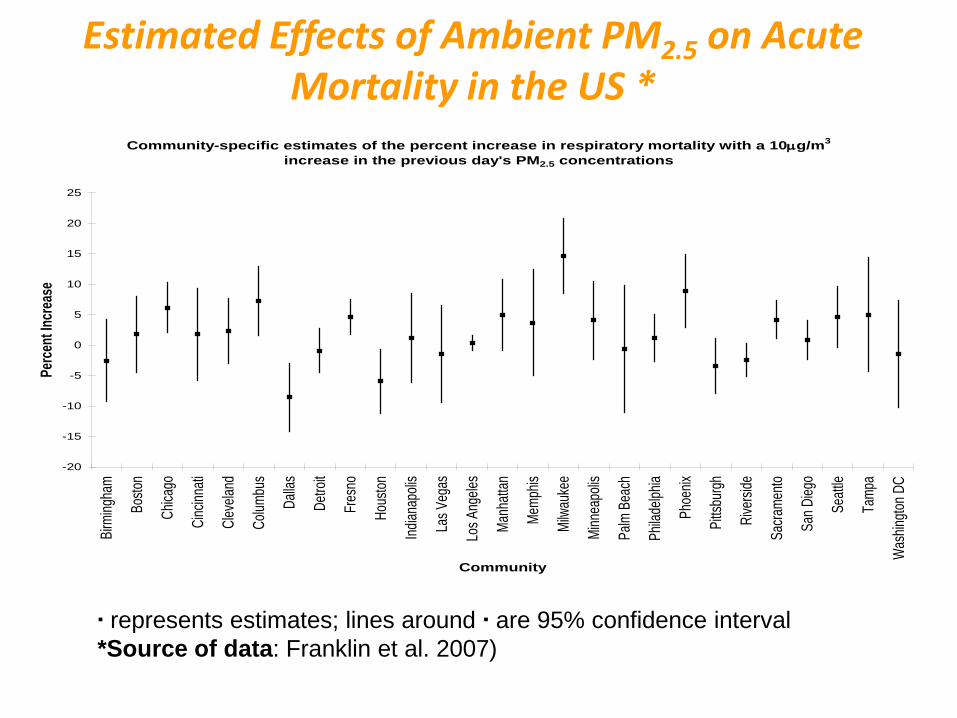
Estimated Effects of Ambient PM2.5 on Acute Mortality in the US *
Community-specific estimates of the percent increase in respiratory mortality with a 10µg/m3
increase in the previous day's PM2.5 concentrations
-20
-15
-10
-5
0
5
10
15
20
25
Birmi
ngha
m
Bosto
n
Chica
go
Cinc
innati
Clev
eland
Colum
bus
Dalla
s
Detro
it
Fres
no
Hous
ton
Indian
apoli
s
Las V
egas
Los A
ngele
s
Manh
attan
Memp
his
Milw
auke
e
Minn
eapo
lis
Palm
Bea
ch
Phila
delph
ia
Phoe
nix
Pittsb
urgh
Rive
rside
Sacra
mento
San D
iego
Seatt
le
Tamp
a
Was
hingto
n DC
Community
Perc
ent In
crea
se
▪ represents estimates; lines around ▪ are 95% confidence interval *Source of data: Franklin et al. 2007)
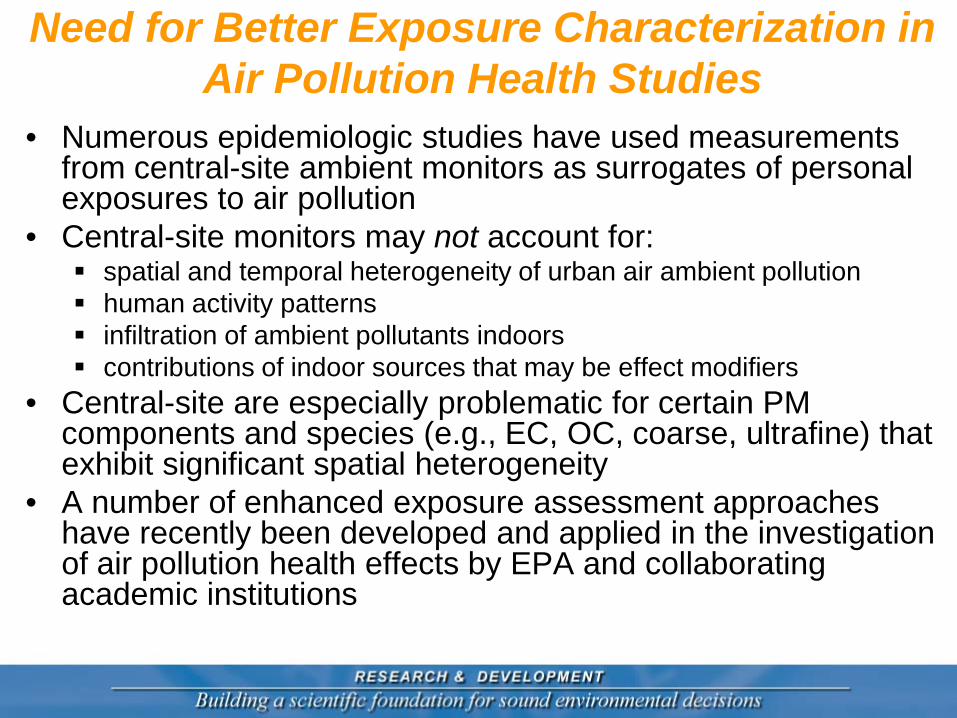
Need for Better Exposure Characterization in Air Pollution Health Studies
• Numerous epidemiologic studies have used measurements from central-site ambient monitors as surrogates of personal exposures to air pollution
• Central-site monitors may not account for: spatial and temporal heterogeneity of urban air ambient pollution human activity patterns infiltration of ambient pollutants indoors contributions of indoor sources that may be effect modifiers
• Central-site are especially problematic for certain PM components and species (e.g., EC, OC, coarse, ultrafine) that exhibit significant spatial heterogeneity
• A number of enhanced exposure assessment approaches have recently been developed and applied in the investigation of air pollution health effects by EPA and collaborating academic institutions

Health data analysis Epidemiological statistical models:
log(E(Ykt)) = α + β exposure metrickt + ∑kγkareakt+ …other covariates
Tiers of Exposure Metrics
Personal Behavior/Time Activity Microenvironmental Characteristics
Ambient Monitoring Data: Central Site or Interpolated
Land-Use Regression or Intake Fraction Models
Air Quality Modeling (CMAQ, AERMOD, hybrid)
Exposure Modeling (SHEDS, APEX)
Statistical/Hybrid Modeling (Data blending)
Monitoring Data
Monitoring Data
Monitoring Data
Emissions Data
Emissions Data
Emissions Data
Meteorological Data
Meteorological Data
Land-Use/Topography
Land-Use/Topography
Land-Use/Satellite
Monitoring Data Emissions Data
Meteorological Data Land-Use/Topography
Input data Complexity Reliability vs.
Uncertainty
Exposure Metrics Considered by Health Studies

Stochastic Human Exposure and Dose Simulation (SHEDS) Model for Air Pollutants

Comparison of Effects per IQR Unit Change in Ozone Concentration vs. Exposure on Respiratory Hospital Admissions in NYC (Jones et al. 2011)
1.005
1.0221.0171.020
1.008
1.0411.029 1.033
1.0241.002
0.95
1.00
1.05
1.10
0 1 2 3 4 0 1 2 3 4
HR
for
Adm
issi
on (9
5% C
I)
Lag days
Ozone concentration (Daily 8hr max)
IQR: 25.3
Exposure (mean of daily 8 hr max)
IQR: 6.03
Conditional logistic regression model adjusted for categorical mean UAT.
0.60
0.70
0.80
0.90
1.00
1.10
1.20
1.30
1.40
1.50
1.60
Odd
s R
atio
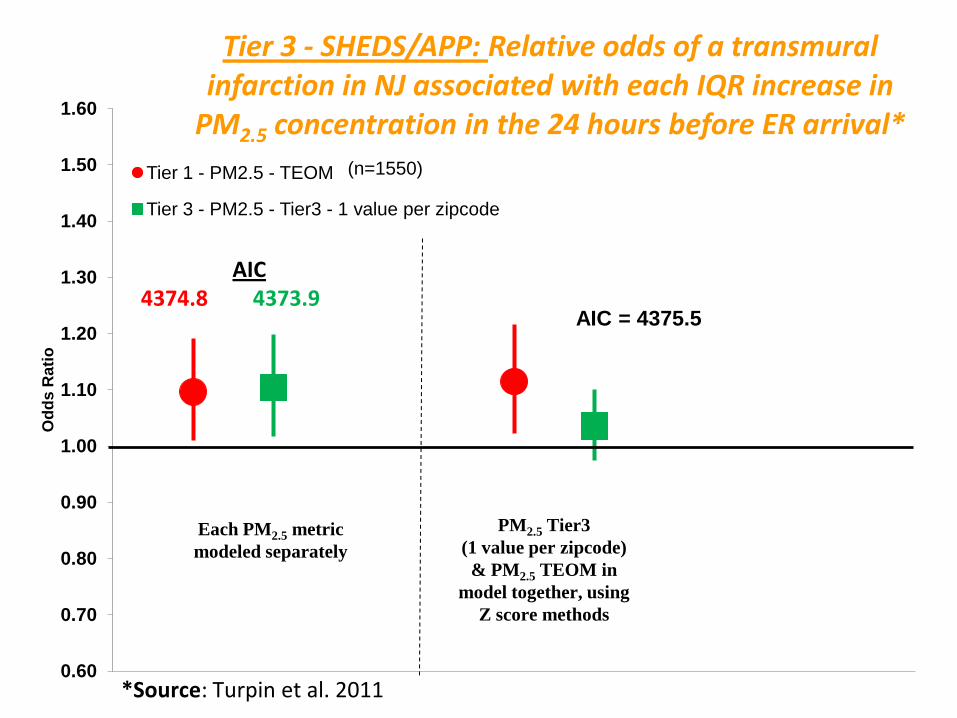
Tier 3 - SHEDS/APP: Relative odds of a transmural
infarction in NJ associated with each IQR increase in PM2.5 concentration in the 24 hours before ER arrival*
Tier 1 - PM2.5 - TEOM
Tier 3 - PM2.5 - Tier3 - 1 value per zipcode
Each PM2.5 metric modeled separately
PM2.5 Tier3 (1 value per zipcode)
& PM2.5 TEOM in model together, using
Z score methods
(n=1550)
AIC 4374.8 4373.9
AIC = 4375.5
*Source: Turpin et al. 2011
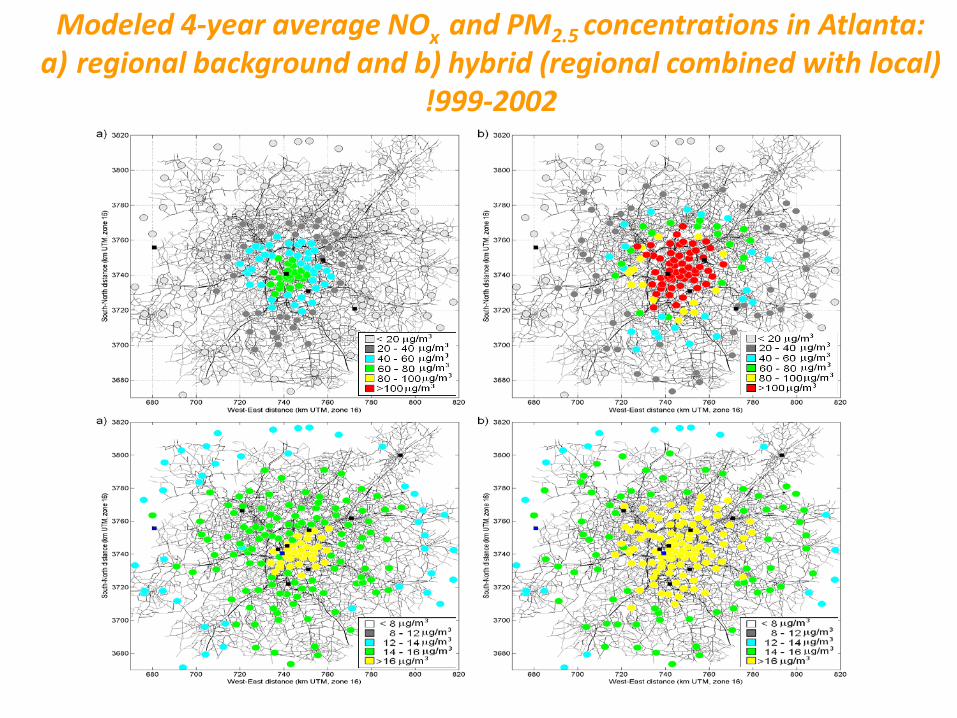
Modeled 4-year average NOx and PM2.5 concentrations in Atlanta: a) regional background and b) hybrid (regional combined with local)
!999-2002

Results of the epidemiologic analysis of emergency department data in Atlanta for a) respiratory diseases and b) cardiovascular diseases (Özkaynak et al. 2011)

0.96
0.97
0.98
0.99
1.00
1.01
1.02
1.03
1.04
CS24 BG24 AERMOD HYBRID APEXP50 APEXP95
Asthma/Wheeze Asthma/Wheeze Asthma/Wheeze Asthma/Wheeze Asthma/Wheeze Asthma/Wheeze
Rela
tive
Risk
(95%
CI)
per I
QR
incr
ease
in P
ollu
tant
Met
ric
CS24 BG24 AERMOD HYBRID APEXP50 APEXP95
Asthma/Wheeze Asthma/Wheeze Asthma/Wheeze Asthma/Wheeze Asthma/Wheeze Asthma/Wheeze
CS BG AM HyB APEX APEX CS BG AM HyB APEX APEX p50 p95 p50 p95
Associations between 24h NOx/CO and Asthma ED Visits In Atlanta (Sarnat et al. 2011)
NOx CO

Overall Summary of Findings • Observed RRs differ by metric, pollutant and study design
- Measurement error is present in every metric - Effects of error on risk estimates vary by type of exposure error (Goldman et al 2011) - For time-series studies ambient concentrations may serve as an appropriate exposure surrogate
-For cohort studies or mixed spatio-temporal study designs (as shown in the Atlanta analysis) the use of more refined exposure surrogates than the conventionally used ambient monitoring data may boost study power, reduce exposure prediction errors and strengthen the estimated associations between air pollution and health data
• CO, NOx Asthma ED Associations Varied by Metric Choice
• Model-based estimate higher and significant compared to central site estimate • Consistent with a priori expectations for spatially-heterogeneous pollutants
- Suggests that accounting for spatiotemporal distribution of pollutants may be important for timeseries studies
- May indicate reduced measurement error for these pollutants
• Ozone, PM2.5 Magnitudes of Association with Daily Mortality, MI, Respiratory Hospitalization s and Emergency Department Visits Fairly Robust to Metric
• Interpretation of findings similar regardless of exposure assignment approach • For homogenous pollutants, spatiotemporal models may add little to explaining
variability • Slightly lower RRs for the modeled O3 personal estimates compared to ambient • Possible that potential for exposure model misspecification may re-introduce error in
the epidemiological analysis results using modeled exposures

Research Needs Type of an epidemiologic study design influences spatio-temporal resolution needs of exposure data or its surrogates used for health effects research (one size does not fit all in terms of optimally assigning exposures). Key information gaps: 1) When do more refined estimates of exposure provide more information than the central-site monitor, by: 1) Type of study (e.g. case-crossover vs. cohort); 2) Acute vs. chronic exposures/effects, 3) Spatial vs. temporal variability of pollutant of interest It is important to better understand the sources and factors influencing uncertainties in ambient pollution epidemiology analyses as well as compounding of errors as exposure metrics are refined. Key information gaps: 2) What is the best way to apply distributional exposure estimates? 3) How much infiltration, activity patterns, local source emissions and pollution composition account for the predicted variability in the exposure and effect estimates? 4) How to incorporate multipollutant considerations in modeling exposures and epidemiological analyses, since appropriate selection of exposure surrogates become more complicated due to pollutant-specific relationships with their exposure surrogates and the underlying covariance structure among the ambient pollutant concentrations (i.e.., exposure misclassification concerns vs. statistical collinearity issues)?

Acknowledgements • Vlad Isakov(EPA) • Lisa Baxter (EPA) • Val Garcia (EPA) • Janet Burke (EPA) • ST Rao (EPA) • Barbara Turpin (Rutgers) • David Rich (University of Rochester) • Jeremy and Stefanie Sarnat (Emory) • Jim Mulholland (Georgia Tech) • Rena Jones, Shao Lin (NYSDOH) • Chris Frey, Montse Fuentes (NCSU)