utilization of euryale ferox salisbury seed shell for
TRANSCRIPT
RSC Advances
PAPER
Ope
n A
cces
s A
rtic
le. P
ublis
hed
on 2
6 M
ay 2
017.
Dow
nloa
ded
on 4
/2/2
022
10:0
3:09
AM
. T
his
artic
le is
lice
nsed
und
er a
Cre
ativ
e C
omm
ons
Attr
ibut
ion-
Non
Com
mer
cial
3.0
Unp
orte
d L
icen
ce.
View Article OnlineView Journal | View Issue
Utilization of Eur
aEnvironmental Chemistry Laboratory, Re
Section, Life Science Division, Institute
Technology, Guwahati, Assam, India. E-m
3612273062; Tel: +91 3612912075 ext. 118bDepartment of Environmental Science, GaucDepartment of Chemistry, Gauhati UniversidDepartment of Chemistry, Morigaon Colleg
† Electronic supplementary informa10.1039/c7ra03014b
Cite this: RSC Adv., 2017, 7, 27248
Received 13th March 2017Accepted 11th May 2017
DOI: 10.1039/c7ra03014b
rsc.li/rsc-advances
27248 | RSC Adv., 2017, 7, 27248–2725
yale ferox Salisbury seed shell forremoval of basic fuchsin dye from water:equilibrium and kinetics investigation†
S. Kalita,a M. Pathak,a G. Devi,a H. P. Sarma,b K. G. Bhattacharyya, c A. Sarmad
and A. Devi *a
Euryale ferox Salisbury (E. ferox) is an environmentally and economically important wetland macrophyte.
This paper investigates the adsorption of a carcinogenic dye, basic fuchsin in the aqueous phase onto
the hard shell of Euryale ferox seeds so as to establish the thrown away residue as a novel, efficient, bio-
friendly and economically low-cost alternative adsorbent against other expensive adsorbents.
Characterization of the bioadsorbent was carried out by TGA, SEM, FTIR and Zetasizer analyses. Zeta
potential analysis showed good stability of the biomaterial around neutral pH. The operating variables
such as adsorbent amount, adsorbate concentration, contact time, pH and temperature were optimized
in a batch system. The maximum biosorption capacity of E. ferox was found to be 19.48 mg g�1 which
could remove as much as 97.4% of the dye from an aqueous solution of concentration 40 mg L�1 at 298
K. Isothermal and kinetic data fitted best to Freundlich and pseudo second order models respectively.
The thermodynamic study revealed the exothermic and spontaneous nature of the adsorption process.
1 Introduction
Dyes have always been an integral part of human civilization,whether for dyeing cloth, leather, and hair or as a coloring agentfor food. In the last few decades with the surge in humanpopulation and economic development, there has beena tremendous development of the synthetic dye industries formeeting the demand for higher supply and better quality of dye.This expansion has resulted in a simultaneous increase in theliquid effluent generated from the synthetic dye manufacturingand user industries. It is estimated that annually more than 1.5� 108 m3 of colored effluents is discharged as waste water.1
The discharged wastewater enters the local water bodiesand disturbs the aquatic ecosystem by inuencing the physi-cochemical parameters of water which are known forcontributing to the maintenance of the ecosystem, essentialfor the dwelling aquatic organisms. Since most of the dyes aresuspected to be carcinogenic and mutagenic in nature, they
source Management and Environment
of Advanced Study in Science and
ail: [email protected]; Fax: +91
hati University, Guwahati, Assam, India
ty, Guwahati, Assam, India
e, Morigaon 782105, Assam, India
tion (ESI) available. See DOI:
9
have the potential to bring toxicity in human beings, shspecies and microorganisms.2,3
Basic fuchsin (MF: C20H20CIN3, MW: 337.85) a cationic dyeconsisting of the salts (hydrochloride or acetate) of rosanilineand pararosaniline with triaminotriphenylmethane as itschemical structural body is widely used as a coloring agent fortextile and leather industries. It is also used as a biologicalstain for nucleus, tissues, and muscles and as a tracking dyefor certain proteins.4,5 On direct contact with skin or wheningested or inhaled the dye may cause severe health hazardslike irritation to skin or respiratory or gastrointestinal tract.5
The suspected carcinogenic, mutagenic and target organeffects of this dye on humans gives the reason to developa competent and efficient material or a method for tacklingand efficiently removing this pollutant. Several conventionaltechniques such microbiological or enzymatic decomposition,oxidation, coagulation, occulation, chemical degradation,electroplating, membrane ltration, etc.6,7 have been devel-oped and used till now. But among these available techniques,the biosorption technology has emerged as a more attractiveand greener alternative to the typical treatment tacticsemployed for decolourization of effluents due to its modestdesign, smooth operation and most importantly its potentialcost-effectiveness. For removal of basic fuchsin, only a fewadsorbents have been developed till now namely peat-resinparticle,8 Aspergillus niger dead biomass,9 bottom ash anddeoiled soya,5 KMnO4-modied activated carbon from Typhaorientalis,10 mussel shell11 etc. The present study aims to utilizea novel waste material capable of removing dye material as
This journal is © The Royal Society of Chemistry 2017
Paper RSC Advances
Ope
n A
cces
s A
rtic
le. P
ublis
hed
on 2
6 M
ay 2
017.
Dow
nloa
ded
on 4
/2/2
022
10:0
3:09
AM
. T
his
artic
le is
lice
nsed
und
er a
Cre
ativ
e C
omm
ons
Attr
ibut
ion-
Non
Com
mer
cial
3.0
Unp
orte
d L
icen
ce.
View Article Online
a model experiment so as to boost the emerging eld ofbioremediation through the adsorption strategy. The preparedmaterial is the seed coat of Euryale ferox Salisbury (Nym-phaeaceae family), locally famous as “Makhana”. It was re-ported that E. ferox known for its nutritional and medicinalproperties is well distributed in the tropical and subtropicalregions of Southeast and East Asia.12 In India, it is found in theshallow water bodies of North Bihar and lower Assam regionsof India.12 E. ferox seed cover was chosen as a dye removalbioadsorbent because it is an easily available and unused bio-refuse of the edible part of the plant. Even though otherbiomaterials have been used for removal of basic fuchsin, thismacrophytic bio-waste has remained unexplored as a sourcefor remediating wetland water bodies polluted with coloredeffluents. Relevant kinetic and adsorption isotherm modelswere employed for a better understanding of this uniqueadsorbent performance. As the material is sufficiently found tobe ourishing in the wetland, there is a greater chance of usingthis adsorbent for remediating a wetland polluted withanthropogenic activities.
The concentrations of dyes and pigments in industrialeffluents are not well documented and the concentrations varydepending on the nature of the industry, the amount of dyesused, the efficiency of the effluent treatment procedures, etc.The present experiments can be considered as a kind of modelin which a comparatively wide range of dye concentrations wasused with a view to having results of general utility. Theadsorbent amounts were similarly selected to achieve optimumadsorption and removal of the dyes.
2 Experimental2.1 Collection and preparation of the adsorbent andadsorbate
Fresh fruits of E. ferox were collected from the wetland DeeporBeel (a Ramsar site) of Assam, India. The separated seeds fromthe harvested fruits were washed and shade dried. The seedcoat to be utilized as an adsorbent was then removed from thedried seeds and was again washed, air-dried and ground intoa powdered form. It was further sieved in between the fractionrange of 75–200 mm and was repeatedly washed with Milliporewater to obtain color and turbidity-free washings. The washedseed powder fractions were rst dried at room temperature for48 hours and then oven dried at 50 �C temperature toa constant weight. It was then made moisture free in a desic-cator until its further use. The basic fuchsin dye taken for theexperiment purpose was of analytical grade purchased fromSigma-Aldrich. A stock solution of 500 ppm was prepared bydissolving weighed amount of powdered dye in distilled water.A calibration curve was obtained by measuring the opticaldensity of different known dye concentrations at 542 nm usinga UV-Vis spectrophotometer (Shimadzu 1601, Japan).13
Chemdraw Ultra 8.0 soware was used for the construction ofthe chemical structure of the dye. The chemical structure ofthe dye is as follows:
This journal is © The Royal Society of Chemistry 2017
2.2 Characterization of the adsorbent biomaterial
Gravimetric analysis for the determination of moisture content,organic matter and organic carbon of the biomaterial was donein a muffle furnace following the AOAC 2000 protocol14 andwere calculated using the following equations:
% Ash content ¼ ash weight
dry weight100
% Organic matter ¼ dry weight� ash weight
dry weight100
% Organic carbon ¼ organic matter%
1:724
The biomass was treated prior to the determination of itslignocellulosic components following the TAPPI method.15,16
The treated biomass is considered to comprise of cellulose,hemicellulose, lignin and extractives. Thermal gravimetricanalysis (TGA) was carried out using Perkin Elmer TGA 4000 ata heating rate of 10 �C per minute with N2 ow rate of 20 mLmin�1. CHNS analyser (EuroEA3000 Elemental Analyser) andAtomic Absorption Spectrophotometer (Shimadzu AA 7000) wasused for ultimate and element analysis respectively. The surfacetopography of the biomaterial was analyzed by using FieldEmission Scanning Electron Microscope i.e. FE-SEM (Zeiss, S-Sigma, Germany). The Fourier Transform Infrared Spectro-photometer (NICOLET 6700, USA) was used to record thespectra in transmission mode within the range of 4000–500cm�1 to investigate about the functional groups of the adsor-bent by employing the KBr pellet method. The surface charge ofthe adsorbent solution was determined by recording zetapotential measurements of the solution using the MalvernZetasizer Nano series, Nano-ZS90. Same instrumental analyseswere performed for evaluating the potential changes occurredin the biomaterial aer the adsorption of the subject dye.
2.3 Bioadsorption procedure
The adsorption experiments were carried out in a series of thebatch to evaluate the percentage removal and adsorptioncapacity of the material. The parameter variation experiments
RSC Adv., 2017, 7, 27248–27259 | 27249
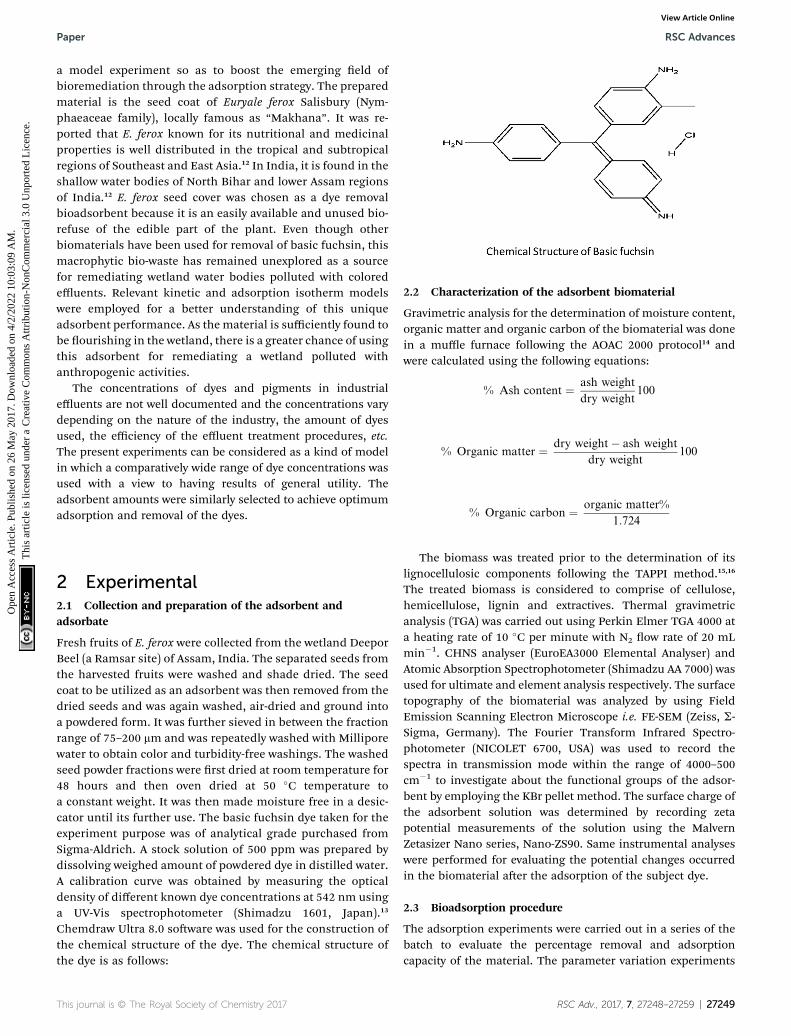
Fig. 1 TGA-DTG graph of E. ferox.
RSC Advances Paper
Ope
n A
cces
s A
rtic
le. P
ublis
hed
on 2
6 M
ay 2
017.
Dow
nloa
ded
on 4
/2/2
022
10:0
3:09
AM
. T
his
artic
le is
lice
nsed
und
er a
Cre
ativ
e C
omm
ons
Attr
ibut
ion-
Non
Com
mer
cial
3.0
Unp
orte
d L
icen
ce.
View Article Online
were operated in 100mL Erlenmeyer asks with a 50mL test dyesolution placed in a thermostatic shaker at 120 rpm for agita-tion. The effect of the adsorbent amount, adsorbate strength,contact time and temperature were inspected by varying eachparameter value at the natural pH of the working solution. ThepH of the BF aqueous solution did not change much withdilution and was found to be between 6.0–6.5. Therefore, theeffect of the pH variation on the adsorption of test solution ofvarying concentration was studied aer the optimization ofother parameters. The pH was adjusted using 0.1 N NaOH and0.1 N HCl solutions. The equilibrium reached a concentrationof BF solution was centrifuged and then analysed at 542 nm.Compared to inorganic heavy materials, the biosorbent settlesdown slowly, but complete settlement could be achievedwithout much difficulty. The obtained results were used tocalculate the equilibrium adsorption capacity qe (mg g�1) andthe percentage removal by applying the following equations:
qe ¼ {(Co � Ce)V}/M (1)
Dye removal (%) ¼ {Co � Ce/Co} � 100 (2)
where Co and Ce (mg L�1) represents the initial and the equi-librium concentration of the dye solution respectively, V (L) isthe volume of the dye solution, and M (g) is the mass of thesorbent added.
In the present study, the adsorption data were subjected todifferent isotherm and kinetic models for examining andunderstanding the mechanistic steps and surface chemistryinvolved in the adsorption process. The thermodynamicbehaviour was also extensively studied. The details of themodels and equations used are given in the appendix. All theexperiments were performed in triplicates and the standarderror (SE) values are mentioned in the gures and tables.
Table 1 Composition of E. ferox (mean � SE)
Proximatecontent (in %)
Ultimatecontent (%)
Moisture content 7 � 0.03 Carbon 43.82 � 0.31Ash content 5 � 0.41 Hydrogen 4.1 � 0.01Volatile matter 69 � 0.01 Nitrogen 0.81 � 0.01Fixed carbon 19 � 0.02 Sulphur 0.06 � 0.07
Oxygen 51.21 � 0.49
3 Results and discussion3.1 Characterization of E. ferox
3.1.1 Compositional analysis of the adsorbent. The gravi-metric analysis following the AOAC 2000 protocol14 revealed theinorganic content (ash content), organic matter and organiccarbon of E. ferox pericarp as 0.4, 99.6 and 55.77% respectively.The obtained TGA graph (Fig. 1) elucidates the thermal behav-iour and thermal stability of the bioadsorbent by plotting theincrease or decrease in the weight percentage of the biomaterialagainst the gradual increase in temperature (from roomtemperature to 1000 �C). The TGA graph shows an initial 7%weight loss below 100 �C and no loss of weight up to 250 �C. Theinitial weight loss corresponds to the loss of moisture present inthe bioadsorbent.17 A major decomposition of 52% between 250and 330 �C as seen in the graph can be attributed to the thermaldecompositions of hemicelluloses, cellulose, lignin andpectin.18 Another decomposition at 330 �C to 500 �C corre-sponds to residual lignin, cellulose, pectin and hemicellulosesin the adsorption study of methylene blue by Citrullus lanatusrind.19 Around 5% remnants aer 500 �C accounts for the ashcontent of the biomaterial. The absence of noteworthy changes
27250 | RSC Adv., 2017, 7, 27248–27259
above 600 �C indicates the optimum carbonization temperatureto be around 600 �C. From the DTG curve, the primarydecomposition temperatures for the E. ferox were found to be67, 295, 325 and 500 �C respectively.
The TGA result regarding the presence of different ligno-cellulosic constituents was conrmed by gravimetric analysis.The cellulose, hemicellulose lignin and extractives amount wasdetermined in percentage as 14.4%, 38.9%, 42.5% and 4.2%.The presence of high lignin content in the shell is responsiblefor the protection of interior portion of the seed. On an averagenutshells tend to contain more lignin content than the otherlignocellulosic constituents.20 The amount of lignin found inthis work is the higher when compared to cellulose and hemi-cellulose in coconut shell (46%) as reported by Cagnon et al.21
respectively. Apart from investigating the thermal behaviour ofthe adsorbent, the TGA technique could also be used for prox-imate analysis of the material. The results of proximate analysisand ultimate analysis are given in Table 1. The differences in theash content analysis using simple gravimetric analysis (0.4%) inamuffle furnace and by TGA (5%) arose because of the loss in yash and other volatile matter during the open heating of thesample in the muffle furnace.
The proximate and ultimate analysis result were in accor-dance to the reported literature by Kumar and Jena.22 Thedetermined values of trace elements like potassium, magne-sium, zinc, copper, manganese, sodium, calcium and phos-phorus are given in Table 2. According to Ekpete and Horsfall,23
This journal is © The Royal Society of Chemistry 2017

Table 2 Elemental composition of E. ferox (mean � SE)
Elemental analysis (in mg kg�1)
Potassium 299.43 � 4.21Calcium 461.20 � 3.21Magnesium 87.425 � 1.03Sodium 278.62 � 2.03Zinc 47.55 � 0.10Manganese 14.857 � 0.02Copper 6.9 � 0.08Phosphorus 652 � 0.08
Paper RSC Advances
Ope
n A
cces
s A
rtic
le. P
ublis
hed
on 2
6 M
ay 2
017.
Dow
nloa
ded
on 4
/2/2
022
10:0
3:09
AM
. T
his
artic
le is
lice
nsed
und
er a
Cre
ativ
e C
omm
ons
Attr
ibut
ion-
Non
Com
mer
cial
3.0
Unp
orte
d L
icen
ce.
View Article Online
the low ash content and low moisture is an indicative that theraw material can be used as a bioadsorbent. Therefore, E. feroxis an excellent rawmaterial to be put into use as a bioadsorbent.
3.1.2 Surface topographical study. Morphological changesare always easier to compare and elucidate the differencesbetween a treated and untreated samples. Therefore, we usedphase contrast microscope and scanning electron microscopeto examine the changes before and aer the dye adsorptionprocess. The adsorption of the dye can be clearly distinguishedfrom the control and test microscopic images of E. ferox in theESI (Fig. 1Sa and b†). The scanning electron micrographs of the
Fig. 2 FTIR spectra of pure dye ( ), E. ferox before ( ) and after ( ) dye a
This journal is © The Royal Society of Chemistry 2017
biomaterial before and aer adsorption of the dye was obtainedat 95k� and 10k� magnications respectively (Fig. 1Sc and e†)The observations of the natural biomaterial before adsorptionmade it evident that the powdered form of E. ferox has anamorphous plane containing cavity structures which could havethe ability to adhere dye particles on its exposed surface area.The void-free smoother topography of the biomaterial aer theadsorption process implies the adherence of polygonal dyeparticles to the surface.24 Such topographical changes onbiomaterial surface aer adsorption of dye have also been re-ported in earlier adsorption studies.24,25 The Energy DispersiveX-ray (EDX) image (Fig. 1Sd and f†) further supports theoccurrence of dye adsorption on the adsorbent surface since theCl element peak of the dye compound appears along with theother constituent peaks such as Na, K, Mg, Ca, C, O aer theadsorption.
3.1.3 FTIR study of bioadsorption. FTIR spectroscopy wascarried out for identifying the functional groups involved inthe adsorption process by investigating the vibrational prop-erties of the material before and aer adsorption of the dye.The FTIR spectra of the pure dye and biomaterial before andaer adsorption are shown in Fig. 2. The FTIR spectra beforeadsorption shows a broad absorption band around 3372.61
dsorption.
RSC Adv., 2017, 7, 27248–27259 | 27251

RSC Advances Paper
Ope
n A
cces
s A
rtic
le. P
ublis
hed
on 2
6 M
ay 2
017.
Dow
nloa
ded
on 4
/2/2
022
10:0
3:09
AM
. T
his
artic
le is
lice
nsed
und
er a
Cre
ativ
e C
omm
ons
Attr
ibut
ion-
Non
Com
mer
cial
3.0
Unp
orte
d L
icen
ce.
View Article Online
cm�1 which corresponds to the –OH group of alcoholiccompounds of E. ferox.3 However, this band shied from3372.61 to 3332.08 cm�1 along with the decrease in thepercentage transmittance of the peak aer the adsorption ofthe dye. Simultaneously it was observed that the doublet dueto primary amine (–NH2) and secondary amine (pNH)appearing at 3309.0 and 3159.3 cm�1 as observed in the FTIRspectra of the dye, which were likely to have been masked bythe OH band.
This might be an indication that E. ferox and BF interactionstake place through these functional groups. The symmetric andasymmetric vibrational modes of methyl (–CH3) and methylene(pCH2) groups showed a small shi from 2939.5 to 2935.5 cm�1
aer adsorption of the dye which might suggest participation ofthese groups also in taking up the dye molecules.26 The bands at1448.2 and 1371.3 cm�1 in the spectra of the biomaterial can beattributed to C–O stretching of carboxylic or carbonate groupand the bending vibrations of C–H or OH groups respectively.25
Aer adsorption of the dye, a shi was recorded in these wavenumbers from 1448.2 to 1454.5 cm�1 and 1371.3 to 1366.7 cm�1
conrming the involvement of those functional groups inbinding the dye to E. ferox surface. The FTIR results suggest thatthe binding of the BF dye to the bioadsorbent surface may haveoccurred mainly due to interactions between OH groups of E.ferox and NH/NH2 groups of the dye. The presence of hydroxyland carboxyl groups in the FT-IR spectra, further, establishesthe anionic nature of the bioadsorbent. Therefore, these groupsare likely to serve as the binding sites for the cationic dye.3
Similar results were previously observed for adsorption of dyeson cupuassu shell.27
Fig. 3 Surface charge analysis of E. ferox.
27252 | RSC Adv., 2017, 7, 27248–27259
3.1.4 Surface charge study. Zeta potential measurementswere carried out to measure the biomaterial stability for the pHrange of 1–10 (Fig. 3). The surface charge of E. ferox varied from+0.115 to �29.400 mV with its isoelectric point lying nearby atpH 1.5. The biomaterial can be considered as negativelycharged almost throughout the entire pH-range with muchmore negative charges in the pH range of 6.0–8.0. This complieswith the observed stability of the biomaterial indicating that itwill not aggregate over time and almost the entire surface willbe available for adsorption of cations.25
3.2 Effects of various parameters on adsorption
3.2.1 Effects of pH. The pH of the working solution isknown for its effect on the efficiency of the adsorption processsince the charges of adsorbent materials and adsorbate mole-cules might be changed by solution pH affecting the functionalgroups on the active sites of the adsorbent and the structure ofthe adsorbate molecules.19 It was found that the dye is sensitiveto higher pH because the color intensity of the solution changedwhen subjected to pH > 6.0. A similar observation was made forthe methylene blue dye when subjected to a higher alkalinecondition.3,28 Therefore, the inuence of pH on the adsorptionof BF by E. ferox was studied at pH 2.0, 4.0 and 6.0 at a constanttemperature (308 K), dye concentration (40 mg L�1) andadsorbent amount (2.0 g L�1). An increase in the dye removalefficiency was recorded from 48.67% to 96.73% for the pHvariation with a maximum uptake of the dye at pH 6.0. Thesurge in the cationic dye adsorption when subjected to higherpH can be attributed to the increasingly negative adsorbentsurface. At very low pH, the surface negative charge is not much
This journal is © The Royal Society of Chemistry 2017

Fig. 4 General isotherm plots of experimental and calculated modelpoints.
Fig. 5 Isotherm models for BF adsorption on E. ferox: (a) Langmuir;conditions: initial BF concentration ¼ 40 mg L�1, temperature ¼ 308 K,
This journal is © The Royal Society of Chemistry 2017
Paper RSC Advances
Ope
n A
cces
s A
rtic
le. P
ublis
hed
on 2
6 M
ay 2
017.
Dow
nloa
ded
on 4
/2/2
022
10:0
3:09
AM
. T
his
artic
le is
lice
nsed
und
er a
Cre
ativ
e C
omm
ons
Attr
ibut
ion-
Non
Com
mer
cial
3.0
Unp
orte
d L
icen
ce.
View Article Online
as observed from zeta potential measurements and therefore,the material does not have a strong affinity for the cationic dyeions. This results in a lower adsorption rate.25
3.2.2 Effects of adsorbent dosage and dye concentration.The effects of varying adsorbent dosages (0.2 to 2.0 g L�1) anddifferent dye concentration (10 to 40 mg L�1) were investigatedon dye percentage removal at 308 K temperature. The resultsshowed that the adsorption was less for elevated dye concen-tration and more for elevated adsorbent loadings. Theincreased dye percentage removal from 60.25 to 95.5% with anincrease in E. ferox amount (0.2 to 2.0 g L�1) for a xed dyeconcentration (40 mg L�1) could be attributed to the increase inthe number of adsorption sites and the available sorptionsurface for decolourization.25 Contrastingly, the increase in BFconcentration for a xed adsorbent amount (2 g L�1) resulteda decline in the dye percentage removal from 92.79 to 87.50% asthe increasing number of BF molecules had to compete fora constant number of available active adsorption sites on thebiosorbent surface.19,25
(b) Freundlich; (c) Temkin; (d) Dubinin–Radushkevich (experimentalpH ¼ 6) (mean � standard error).
RSC Adv., 2017, 7, 27248–27259 | 27253
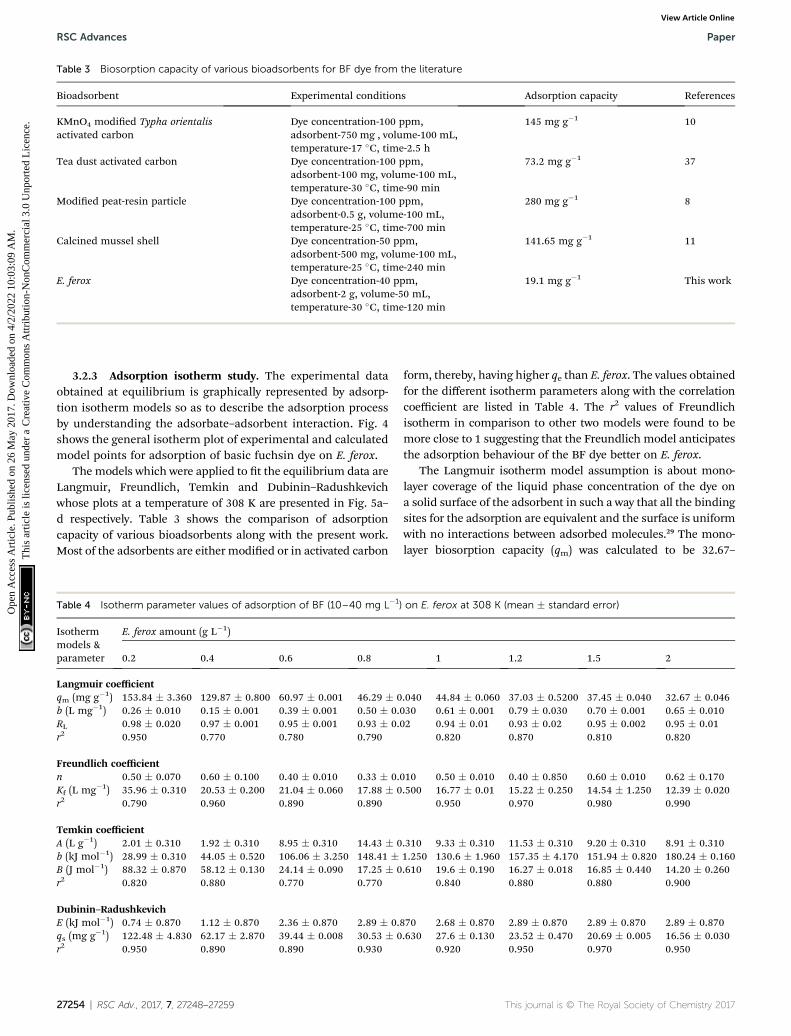
Table 3 Biosorption capacity of various bioadsorbents for BF dye from the literature
Bioadsorbent Experimental conditions Adsorption capacity References
KMnO4 modied Typha orientalisactivated carbon
Dye concentration-100 ppm,adsorbent-750 mg , volume-100 mL,temperature-17 �C, time-2.5 h
145 mg g�1 10
Tea dust activated carbon Dye concentration-100 ppm,adsorbent-100 mg, volume-100 mL,temperature-30 �C, time-90 min
73.2 mg g�1 37
Modied peat-resin particle Dye concentration-100 ppm,adsorbent-0.5 g, volume-100 mL,temperature-25 �C, time-700 min
280 mg g�1 8
Calcined mussel shell Dye concentration-50 ppm,adsorbent-500 mg, volume-100 mL,temperature-25 �C, time-240 min
141.65 mg g�1 11
E. ferox Dye concentration-40 ppm,adsorbent-2 g, volume-50 mL,temperature-30 �C, time-120 min
19.1 mg g�1 This work
RSC Advances Paper
Ope
n A
cces
s A
rtic
le. P
ublis
hed
on 2
6 M
ay 2
017.
Dow
nloa
ded
on 4
/2/2
022
10:0
3:09
AM
. T
his
artic
le is
lice
nsed
und
er a
Cre
ativ
e C
omm
ons
Attr
ibut
ion-
Non
Com
mer
cial
3.0
Unp
orte
d L
icen
ce.
View Article Online
3.2.3 Adsorption isotherm study. The experimental dataobtained at equilibrium is graphically represented by adsorp-tion isotherm models so as to describe the adsorption processby understanding the adsorbate–adsorbent interaction. Fig. 4shows the general isotherm plot of experimental and calculatedmodel points for adsorption of basic fuchsin dye on E. ferox.
The models which were applied to t the equilibrium data areLangmuir, Freundlich, Temkin and Dubinin–Radushkevichwhose plots at a temperature of 308 K are presented in Fig. 5a–d respectively. Table 3 shows the comparison of adsorptioncapacity of various bioadsorbents along with the present work.Most of the adsorbents are either modied or in activated carbon
Table 4 Isotherm parameter values of adsorption of BF (10–40 mg L�1
Isothermmodels ¶meter
E. ferox amount (g L�1)
0.2 0.4 0.6 0.8
Langmuir coefficientqm (mg g�1) 153.84 � 3.360 129.87 � 0.800 60.97 � 0.001 46.29 � 0b (L mg�1) 0.26 � 0.010 0.15 � 0.001 0.39 � 0.001 0.50 � 0.RL 0.98 � 0.020 0.97 � 0.001 0.95 � 0.001 0.93 � 0.r2 0.950 0.770 0.780 0.790
Freundlich coefficientn 0.50 � 0.070 0.60 � 0.100 0.40 � 0.010 0.33 � 0.Kf (L mg�1) 35.96 � 0.310 20.53 � 0.200 21.04 � 0.060 17.88 � 0r2 0.790 0.960 0.890 0.890
Temkin coefficientA (L g�1) 2.01 � 0.310 1.92 � 0.310 8.95 � 0.310 14.43 � 0b (kJ mol�1) 28.99 � 0.310 44.05 � 0.520 106.06 � 3.250 148.41 �B (J mol�1) 88.32 � 0.870 58.12 � 0.130 24.14 � 0.090 17.25 � 0r2 0.820 0.880 0.770 0.770
Dubinin–RadushkevichE (kJ mol�1) 0.74 � 0.870 1.12 � 0.870 2.36 � 0.870 2.89 � 0.qs (mg g�1) 122.48 � 4.830 62.17 � 2.870 39.44 � 0.008 30.53 � 0r2 0.950 0.890 0.890 0.930
27254 | RSC Adv., 2017, 7, 27248–27259
form, thereby, having higher qe than E. ferox. The values obtainedfor the different isotherm parameters along with the correlationcoefficient are listed in Table 4. The r2 values of Freundlichisotherm in comparison to other two models were found to bemore close to 1 suggesting that the Freundlich model anticipatesthe adsorption behaviour of the BF dye better on E. ferox.
The Langmuir isotherm model assumption is about mono-layer coverage of the liquid phase concentration of the dye ona solid surface of the adsorbent in such a way that all the bindingsites for the adsorption are equivalent and the surface is uniformwith no interactions between adsorbed molecules.29 The mono-layer biosorption capacity (qm) was calculated to be 32.67–
) on E. ferox at 308 K (mean � standard error)
1 1.2 1.5 2
.040 44.84 � 0.060 37.03 � 0.5200 37.45 � 0.040 32.67 � 0.046030 0.61 � 0.001 0.79 � 0.030 0.70 � 0.001 0.65 � 0.01002 0.94 � 0.01 0.93 � 0.02 0.95 � 0.002 0.95 � 0.01
0.820 0.870 0.810 0.820
010 0.50 � 0.010 0.40 � 0.850 0.60 � 0.010 0.62 � 0.170.500 16.77 � 0.01 15.22 � 0.250 14.54 � 1.250 12.39 � 0.020
0.950 0.970 0.980 0.990
.310 9.33 � 0.310 11.53 � 0.310 9.20 � 0.310 8.91 � 0.3101.250 130.6 � 1.960 157.35 � 4.170 151.94 � 0.820 180.24 � 0.160.610 19.6 � 0.190 16.27 � 0.018 16.85 � 0.440 14.20 � 0.260
0.840 0.880 0.880 0.900
870 2.68 � 0.870 2.89 � 0.870 2.89 � 0.870 2.89 � 0.870.630 27.6 � 0.130 23.52 � 0.470 20.69 � 0.005 16.56 � 0.030
0.920 0.950 0.970 0.950
This journal is © The Royal Society of Chemistry 2017
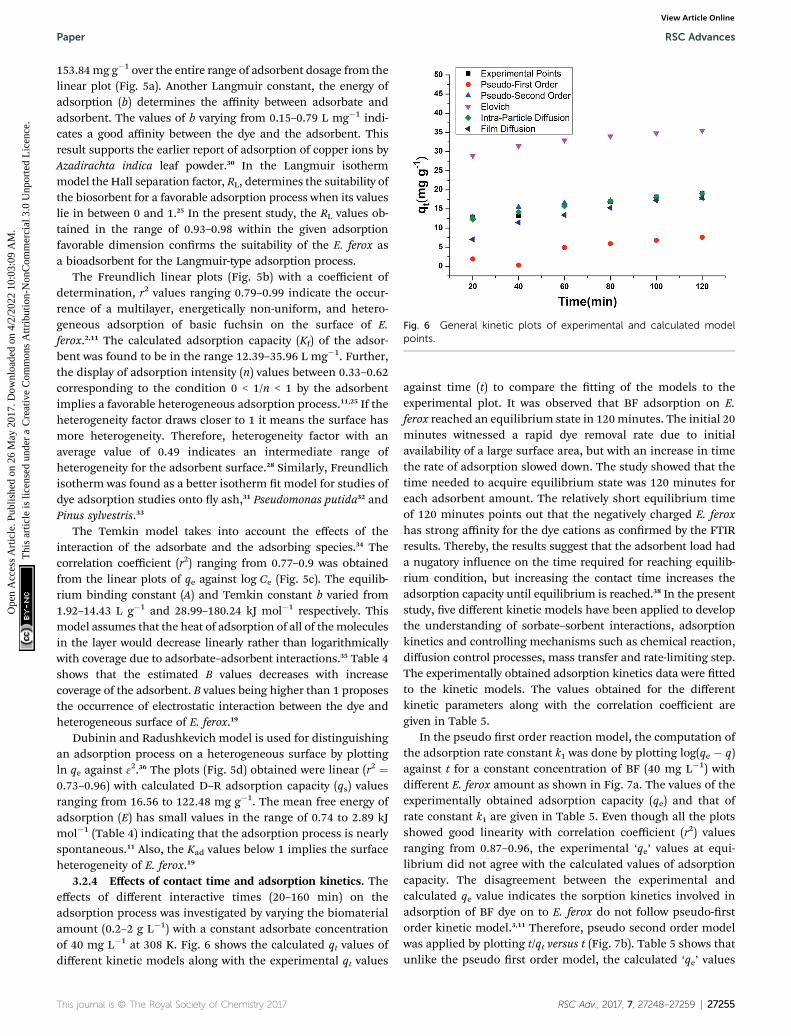
Fig. 6 General kinetic plots of experimental and calculated modelpoints.
Paper RSC Advances
Ope
n A
cces
s A
rtic
le. P
ublis
hed
on 2
6 M
ay 2
017.
Dow
nloa
ded
on 4
/2/2
022
10:0
3:09
AM
. T
his
artic
le is
lice
nsed
und
er a
Cre
ativ
e C
omm
ons
Attr
ibut
ion-
Non
Com
mer
cial
3.0
Unp
orte
d L
icen
ce.
View Article Online
153.84mg g�1 over the entire range of adsorbent dosage from thelinear plot (Fig. 5a). Another Langmuir constant, the energy ofadsorption (b) determines the affinity between adsorbate andadsorbent. The values of b varying from 0.15–0.79 L mg�1 indi-cates a good affinity between the dye and the adsorbent. Thisresult supports the earlier report of adsorption of copper ions byAzadirachta indica leaf powder.30 In the Langmuir isothermmodel the Hall separation factor, RL, determines the suitability ofthe biosorbent for a favorable adsorption process when its valueslie in between 0 and 1.25 In the present study, the RL values ob-tained in the range of 0.93–0.98 within the given adsorptionfavorable dimension conrms the suitability of the E. ferox asa bioadsorbent for the Langmuir-type adsorption process.
The Freundlich linear plots (Fig. 5b) with a coefficient ofdetermination, r2 values ranging 0.79–0.99 indicate the occur-rence of a multilayer, energetically non-uniform, and hetero-geneous adsorption of basic fuchsin on the surface of E.ferox.2,11 The calculated adsorption capacity (Kf) of the adsor-bent was found to be in the range 12.39–35.96 L mg�1. Further,the display of adsorption intensity (n) values between 0.33–0.62corresponding to the condition 0 < 1/n < 1 by the adsorbentimplies a favorable heterogeneous adsorption process.11,25 If theheterogeneity factor draws closer to 1 it means the surface hasmore heterogeneity. Therefore, heterogeneity factor with anaverage value of 0.49 indicates an intermediate range ofheterogeneity for the adsorbent surface.28 Similarly, Freundlichisotherm was found as a better isotherm t model for studies ofdye adsorption studies onto y ash,31 Pseudomonas putida32 andPinus sylvestris.33
The Temkin model takes into account the effects of theinteraction of the adsorbate and the adsorbing species.34 Thecorrelation coefficient (r2) ranging from 0.77–0.9 was obtainedfrom the linear plots of qe against log Ce (Fig. 5c). The equilib-rium binding constant (A) and Temkin constant b varied from1.92–14.43 L g�1 and 28.99–180.24 kJ mol�1 respectively. Thismodel assumes that the heat of adsorption of all of themoleculesin the layer would decrease linearly rather than logarithmicallywith coverage due to adsorbate–adsorbent interactions.35 Table 4shows that the estimated B values decreases with increasecoverage of the adsorbent. B values being higher than 1 proposesthe occurrence of electrostatic interaction between the dye andheterogeneous surface of E. ferox.19
Dubinin and Radushkevich model is used for distinguishingan adsorption process on a heterogeneous surface by plottingln qe against 3
2.36 The plots (Fig. 5d) obtained were linear (r2 ¼0.73–0.96) with calculated D–R adsorption capacity (qs) valuesranging from 16.56 to 122.48 mg g�1. The mean free energy ofadsorption (E) has small values in the range of 0.74 to 2.89 kJmol�1 (Table 4) indicating that the adsorption process is nearlyspontaneous.11 Also, the Kad values below 1 implies the surfaceheterogeneity of E. ferox.19
3.2.4 Effects of contact time and adsorption kinetics. Theeffects of different interactive times (20–160 min) on theadsorption process was investigated by varying the biomaterialamount (0.2–2 g L�1) with a constant adsorbate concentrationof 40 mg L�1 at 308 K. Fig. 6 shows the calculated qt values ofdifferent kinetic models along with the experimental qt values
This journal is © The Royal Society of Chemistry 2017
against time (t) to compare the tting of the models to theexperimental plot. It was observed that BF adsorption on E.ferox reached an equilibrium state in 120minutes. The initial 20minutes witnessed a rapid dye removal rate due to initialavailability of a large surface area, but with an increase in timethe rate of adsorption slowed down. The study showed that thetime needed to acquire equilibrium state was 120 minutes foreach adsorbent amount. The relatively short equilibrium timeof 120 minutes points out that the negatively charged E. feroxhas strong affinity for the dye cations as conrmed by the FTIRresults. Thereby, the results suggest that the adsorbent load hada nugatory inuence on the time required for reaching equilib-rium condition, but increasing the contact time increases theadsorption capacity until equilibrium is reached.38 In the presentstudy, ve different kinetic models have been applied to developthe understanding of sorbate–sorbent interactions, adsorptionkinetics and controlling mechanisms such as chemical reaction,diffusion control processes, mass transfer and rate-limiting step.The experimentally obtained adsorption kinetics data were ttedto the kinetic models. The values obtained for the differentkinetic parameters along with the correlation coefficient aregiven in Table 5.
In the pseudo rst order reaction model, the computation ofthe adsorption rate constant k1 was done by plotting log(qe � q)against t for a constant concentration of BF (40 mg L�1) withdifferent E. ferox amount as shown in Fig. 7a. The values of theexperimentally obtained adsorption capacity (qe) and that ofrate constant k1 are given in Table 5. Even though all the plotsshowed good linearity with correlation coefficient (r2) valuesranging from 0.87–0.96, the experimental ‘qe’ values at equi-librium did not agree with the calculated values of adsorptioncapacity. The disagreement between the experimental andcalculated qe value indicates the sorption kinetics involved inadsorption of BF dye on to E. ferox do not follow pseudo-rstorder kinetic model.3,11 Therefore, pseudo second order modelwas applied by plotting t/qt versus t (Fig. 7b). Table 5 shows thatunlike the pseudo rst order model, the calculated ‘qe’ values
RSC Adv., 2017, 7, 27248–27259 | 27255

RSC Advances Paper
Ope
n A
cces
s A
rtic
le. P
ublis
hed
on 2
6 M
ay 2
017.
Dow
nloa
ded
on 4
/2/2
022
10:0
3:09
AM
. T
his
artic
le is
lice
nsed
und
er a
Cre
ativ
e C
omm
ons
Attr
ibut
ion-
Non
Com
mer
cial
3.0
Unp
orte
d L
icen
ce.
View Article Online
from the pseudo second order model were similar to theexperimental values. The r2 values (0.86–0.97) were closer tounity showing the predominance of this model in the adsorp-tion process. The result indicates that the adsorption of dye onE. ferox surface follows the pseudo second order kinetic modelwith chemisorption adsorption mechanism.11,39
The plots qt versus ln t (Fig. 7c) were plotted to verify theapplicability of the Elovich equation to kinetic sorption study ofE. ferox. This model is utilized for studying the chemisorptionprocesses on a heterogeneous surface.35 Therefore, the linearplots with correlation coefficients varying from 0.8–0.92 suggestthat this model can be used to describe chemisorptionadsorption of BF dye on the heterogeneous surface of E. ferox.The desorption constant (b) varied from 3.67–29.37 g mg�1. Theinitial adsorption rate (a) was found to elevate from 0.012–0.356 mg g�1 min�1 on increasing the E. ferox amount (0.2–2 gL�1). The increase in initial adsorption rate due to increase inadsorbent amount can be attributed to the availability of largersurface area for adsorption.28
Investigation of the diffusion process and to verify theinuence of mass transfer resistance on the binding of basicfuchsin to E. ferox, the intraparticle diffusion model wasapplied. The intra-particle diffusion constant kp (mg g�1
min�0.5) was obtained from the linear plots of qt (mg g�1) versussquare root of time. The values of kp varied from 1.03–8.38 mgg�1 min�1/2. The plots failed to pass through the origin (Fig. 7d)
Table 5 Kinetic parameter values of adsorption of BF on E. ferox at 308
Kineticmodels ¶meter
E. ferox amount (g L�1)
0.2 0.4 0.6 0.8
Pseudo-rst order kineticqe (mg g�1) 78.6 � 0.21 53.41 � 0.8 35.63 � 0.07 36.57 � 0k1 (min�1) 0.014 � 0.31 0.009 � 0.001 0.01 � 0.001 0.019 � 0r2 0.950 0.960 0.940 0.910
Pseudo-second order kineticqe (mg g�1) 123.45 � 0.009 77.51 � 0.010 53.19 � 0.640 43.29 � 0k2 (g
�1 mg�1
min�1)0.0005 � 0.001 0.0005 � 0.001 0.0008 � 0.000 0.0011 �
r2 0.93 0.860 0.880 0.890
Elovicha (mg g�1
min�1)0.012 � 0.001 0.014 � 0.004 0.017 � 0.001 0.021 � 0
b (g mg�1) 29.37 � 0.090 21.28 � 0.010 13.77 � 0.030 11.25 � 0r2 0.890 0.810 0.800 0.850
Intra-particle diffusion modelIntercept 23.46 � 0.440 3.27 � 0.010 4.69 � 0.005 3.95 � 0.0kp (mg g�1
min�0.5)8.38 � 0.250 6.14 � 1.010 3.99 � 0.010 3.24 � 0.1
r2 0.950 0.890 0.890 0.930
Film diffusion modelIntercept �0.34 � 0.010 �0.32 � 0.010 �0.33 � 0.001 �0.07 � 0kfd (min�1) 0.01 � 0.001 0.01 � 0.010 0.1 � 0.010 0.02 � 0.0r2 0.960 0.980 0.950 0.860
27256 | RSC Adv., 2017, 7, 27248–27259
and had signicant intercept values (Table 5) implying that themodel would not solely limit the overall adsorption kinetics andintraparticle diffusionmight have little role to play in the overallkinetics.
The liquid lm diffusion model was used in this study toinvestigate the role of the transport of dye cations from theliquid phase up to the solid phase boundary of E. ferox. Theliquid lm diffusion constant, kfd, was in the range of 0.01–0.03 min�1 (Table 5). The linear plots of �ln(1 � F) vs. t(Fig. 7e) had very small intercepts and since the interceptvalues were related to the thickness of the boundary layer, itwas likely that the dye cations had to pass through a compar-atively thin surface layer of the liquid phase before beingadsorbed on the biosorbent surface.28,40 It would imply that thekinetics of the sorption process could have been inuencedappreciably by diffusion of the dye cations across the liquidlm on the particle surfaces.41
3.2.5 Effect of temperature and thermodynamic study. Theeffects of temperature on the adsorption capacity of E. ferox andpercentage removal of dye were studied by varying the temper-ature from 298 to 313 K. A decrease in the adsorption capacityand dye percentage removal was recorded for an increase in thetemperature. This trend was observed for all the adsorbateconcentration variation (10–40 mg L�1) for a bioadsorbentamount of 2.0 mg g�1. The adsorbent at an optimized temper-ature of 298 K exhibited a maximum adsorption of 97.40% with
K (dye ¼ 40 mg L�1) (mean � standard error)
1 1.2 1.5 2
.13 36.08 � 0.5 33.87 � 0.87 16.71 � 0.27 11.35 � 0.007
.04 0.021 � 0.001 0.03 � 0.003 0.02 � 0.001 0.021 � 0.0010.870 0.940 0.950 0.950
.290 37.87 � 0.170 32.25 � 0.310 26.04 � 0.110 19.68 � 0.3000.001 0.0012 � 0.000 0.0019 � 0.010 0.0003 � 0.003 0.005 � 0.001
0.890 0.940 0.960 0.970
.002 0.036 � 0.001 0.046 � 0.001 0.111 � 0.009 0.356 � 0.090
.080 10.04 � 0.040 7.79 � 0.009 5.61 � 0.050 3.67 � 0.0100.840 0.890 0.920 0.900
10 2.8 � 0.002 6.06 � 0.010 7.49 � 0.100 7.6 � 0.12070 2.89 � 0.310 2.21 � 0.250 1.58 � 0.100 1.03 � 0.001
0.920 0.950 0.970 0.950
.004 0.009 � 0.090 0.2 � 0.010 �0.308 � 0.060 �0.43 � 0.01001 0.02 � 0.010 0.03 � 0.010 0.02 � 0.010 0.02 � 0.001
0.800 0.790 0.940 0.920
This journal is © The Royal Society of Chemistry 2017
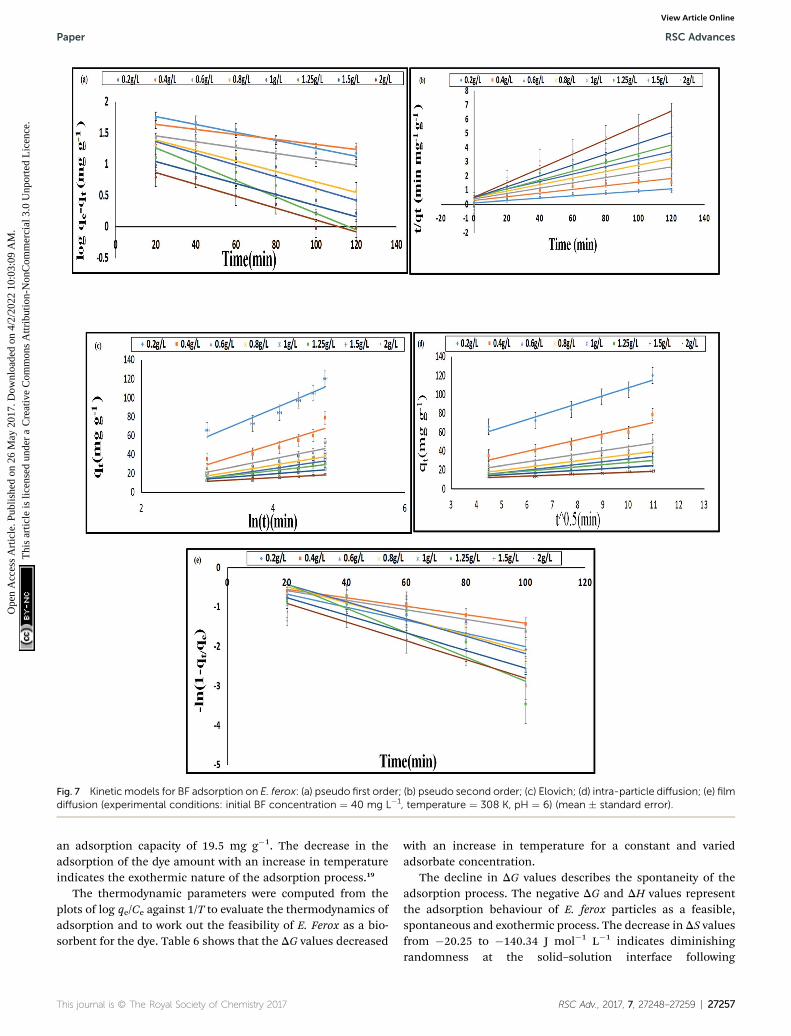
Fig. 7 Kinetic models for BF adsorption on E. ferox: (a) pseudo first order; (b) pseudo second order; (c) Elovich; (d) intra-particle diffusion; (e) filmdiffusion (experimental conditions: initial BF concentration ¼ 40 mg L�1, temperature ¼ 308 K, pH ¼ 6) (mean � standard error).
Paper RSC Advances
Ope
n A
cces
s A
rtic
le. P
ublis
hed
on 2
6 M
ay 2
017.
Dow
nloa
ded
on 4
/2/2
022
10:0
3:09
AM
. T
his
artic
le is
lice
nsed
und
er a
Cre
ativ
e C
omm
ons
Attr
ibut
ion-
Non
Com
mer
cial
3.0
Unp
orte
d L
icen
ce.
View Article Online
an adsorption capacity of 19.5 mg g�1. The decrease in theadsorption of the dye amount with an increase in temperatureindicates the exothermic nature of the adsorption process.19
The thermodynamic parameters were computed from theplots of log qe/Ce against 1/T to evaluate the thermodynamics ofadsorption and to work out the feasibility of E. Ferox as a bio-sorbent for the dye. Table 6 shows that the DG values decreased
This journal is © The Royal Society of Chemistry 2017
with an increase in temperature for a constant and variedadsorbate concentration.
The decline in DG values describes the spontaneity of theadsorption process. The negative DG and DH values representthe adsorption behaviour of E. ferox particles as a feasible,spontaneous and exothermic process. The decrease in DS valuesfrom �20.25 to �140.34 J mol�1 L�1 indicates diminishingrandomness at the solid–solution interface following
RSC Adv., 2017, 7, 27248–27259 | 27257
Table 6 Thermodynamic parameters for adsorption of BF on E. feroxfor different concentrations of BF at 298 K to 313 K, amount of E. ferox(2.0 g L�1)
BF(mg L�1)
�DH(kJ mol�1)
�DS(J mol�1 L�1)
�DG (kJ mol�1)
298 K 303 K 308 K 313 K
10 �14.39 �20.25 �8.36 �8 �7.9 �7.2620 �48.57 �136.11 �8.26 �7.32 �7.2 �6.7630 �49.73 �140.34 �8.15 �6.64 �6.5 �6.2640 �37.08 �100.08 �8.05 �5.96 �5.8 �5.76Mean �37.44 �99.19 �8.2 �6.98 �6.85 �6.51
RSC Advances Paper
Ope
n A
cces
s A
rtic
le. P
ublis
hed
on 2
6 M
ay 2
017.
Dow
nloa
ded
on 4
/2/2
022
10:0
3:09
AM
. T
his
artic
le is
lice
nsed
und
er a
Cre
ativ
e C
omm
ons
Attr
ibut
ion-
Non
Com
mer
cial
3.0
Unp
orte
d L
icen
ce.
View Article Online
adsorption of the dye. Earlier studies on thermodynamic natureof dye adsorption state that under favourable conditions, bothphysisorption and chemisorption processes may occur simul-taneously or alternately.42 Hence, DH values ranging from�14.398 to �49.73 kJ mol�1 K�1 suggests the probability ofoccurrence of both physisorption and chemisorption processestogether in the adsorption of BF dye cations on E. ferox.3 Similarresults have been reported when phenol adsorption on acti-vated carbon was studied by Humpola et al.43
4 Conclusion
The results have shown that E. ferox residue biomass could be veryeffective in the removal of cationic dyes like basic fuchsin fromaqueous medium. The material was stable in a wide range of pHand the zeta potential measurements indicated that the materialdevelops a negative charge at pH > 1.0 and therefore is suitable foradsorptive removal of cations from water. In the present work, asbasic fuchsin is unstable above pH 6.0, the experiments were donebelow this pH and the results are very promising.
The interactions between the biomaterial and the dyecations have been shown to involve –OH groups of the materialand NH/NH2 groups of the dye with likely participation of pCOgroups of the E. ferox. The process has been found to beexothermic and spontaneous accompanied by considerabledecrease in enthalpy, entropy and Gibbs energy of the process.Of the different kinetic models used, it is found that the inter-actions conform to a pseudo-second order model indicatingthat the dye cations may be held to the biomaterial surfacethrough more than one site. The adsorption data tted bothFreundlich and Langmuir isotherms suggesting chemisorptionof the dye cations on E. ferox followed by physisorption on theadsorbed layer.
Abbreviations
E. ferox
27258 | RSC Adv., 20
Euryale ferox
qe Adsorption capacity Co Initial concentration Ce Final concentration V Volume of solution M Mass of the adsorbent qm Monolayer adsorption capacity17, 7, 27248–27259
b
Langmuir constant RL Hall constant n Heterogeneity factor B Temkin constant qs D–R monolayer adsorption capacity 3 Polanyi potential k1 First order constant k2 Second order constant a Initial adsorption rate b Desorption constant kp Intraparticle diffusion rate constant kfd Liquid lm diffusion constant DH Enthalpy T Absolute temperature R Gas constant DS Entropy DG Gibbs energyAcknowledgements
The authors are grateful to the Department of Science andTechnology, Govt. of India and the Director of the Institute ofAdvanced Study in Science and Technology (IASST), Guwahatifor nancial support to execute this work. The authors are alsoobliged to thank the Physical Sciences Division and the CentralInstrumentation facility of IASST for the help in differentinstrumentation work.
References
1 A. W. M. Ip, J. P. Barford and G. McKay, Chem. Eng. J., 2010,157, 434–442.
2 A. M. Aljeboree, A. N. Alshiri and A. F. Alkaim, Arabian J.Chem., 2014, DOI: 10.1016/j.arabjc.2014.01.020.
3 Y. Feng, F. Yang, Y. Wang, L. Ma, Y. Wu, P. G. Kerr andL. Yang, Bioresour. Technol., 2011, 102, 10280–10285.
4 Y. Tao, W. Z. Jian, J. Kui and L. Q. Jun, Chem. Res. Chin. Univ.,2006, 22, 292–296.
5 V. K. Gupta, A. Mittal, V. Gajbe and J. Mittal, J. ColloidInterface Sci., 2008, 319, 30–39.
6 E. Bayram and E. Ayranci, Environ. Sci. Technol., 2010, 44,6331–6336.
7 G. Crini, Bioresour. Technol., 2006, 97, 1061–1085.8 Q. Sun and L. Yang, Water Res., 2003, 37, 1535–1544.9 B. D. Bhole, B. Ganguly, A. Madhuram, D. Deshpande andJ. Joshi, Curr. Sci., 2004, 86, 1641.
10 Q. Shi, J. Zhang, C. Zhang, W. Nie, B. Zhang and H. Zhang, J.Colloid Interface Sci., 2010, 343, 188–193.
11 M. E. Haddad, J. Taibah Univ. Sci., 2015, DOI: 10.1016/j.jtusci.2015.08.007.
12 A. K. Verma, B. K. Banerji, D. Chakrabarty and S. K. Datta,Curr. Sci., 2010, 99, 795–800.
13 R. J. Lan, J. T. Li and B. H. Chen, Int. J. Photoenergy, 2013,2013, 1–7.
14 Official methods of analysis of AOAC International, ed. W.Horwitz, Association of Analytical Communities,Gaithersburg, MD, USA, 17th edn, 1st revision, 2002.
This journal is © The Royal Society of Chemistry 2017
Paper RSC Advances
Ope
n A
cces
s A
rtic
le. P
ublis
hed
on 2
6 M
ay 2
017.
Dow
nloa
ded
on 4
/2/2
022
10:0
3:09
AM
. T
his
artic
le is
lice
nsed
und
er a
Cre
ativ
e C
omm
ons
Attr
ibut
ion-
Non
Com
mer
cial
3.0
Unp
orte
d L
icen
ce.
View Article Online
15 A. O. Ayeni, F. K. Hymore, S. N. Mudliar, S. C. Deshmukh,D. B. Satpute, J. A. Omoleye and R. A. Pandey, Fuel, 2012,DOI: 10.1016/j.fuel.2012.12.078.
16 Technical Association of the Pulp and Paper Industry:Sampling and Preparing Wood for Analysis TechnicalAssociation of the Pulp and Paper Industry, TAPPIStandard T222 om-02, 2002.
17 F. F. Avelar, M. L. Bianchi, M. Gonçalves and E. G. da Mota,Bioresour. Technol., 2010, 10, 4639–4645.
18 R. Garcia, C. Pizarro, A. G. Lavin and J. L. Bueno, Bioresour.Technol., 2013, 139, 1–4.
19 O. Uner, U. Gecgel and Y. Bayrak, Water, Air, Soil Pollut.,2016, 227, 1–15.
20 N. Kohan, G. Machado, C. Jing, A. Nagardeolekar andB. M. Bujanovic, Energies, 2015, 8, 9640–9654.
21 B. Cagnon, X. Py, A. Guillot, F. Stoeckli and G. Chambat,Bioresour. Technol., 2009, 100, 292–298.
22 A. Kumar and H. M. Jena, Results Phys., 2016, 6, 651–658.23 O. A. Ekpete and M. Horsfall, Res. J. Chem. Sci., 2011, 1, 10–
17.24 R. Malik, D. S. Ramteke and S. R. Wate, Indian J. Chem.
Technol., 2006, 13, 319–328.25 S. T. Akar, Y. Y. Balk, O. Tuna and T. Akar, Carbohydr. Polym.,
2013, 94, 400–408.26 O. S. Bello, K. A. Adegoke and O. O. Akinyunni, Appl. Water
Sci., 2015, DOI: 10.1007/s13201-015-0345-4.27 N. F. Cardoso, E. C. Lima, I. S. Pinto, C. V. Amavisca,
B. Royer, R. B. Pinto, W. S. Alencar and S. F. P. Pereira, J.Environ. Manage., 2011, 92, 1237.
28 S. Baruah, A. Devi, K. G. Bhattacharyya and A. Sarma, Int. J.Environ. Sci. Technol., 2016, DOI: 10.1007/s13762-016-1150-9.
This journal is © The Royal Society of Chemistry 2017
29 S. V. Gokhale, K. K. Jyoti and S. S. Lele, Bioresour. Technol.,2008, 99, 3600–3608.
30 K. G. Bhattacharyya, A. Sarma and J. Sarma, Adsorpt. Sci.Technol., 2010, 8.
31 J. X. Lin, S. L. Zhan, M. H. Fang, X. Q. Qian and H. Yang, J.Environ. Manage., 2008, 87, 193–200.
32 A. Arunarani, P. Chandran, B. V. Ranganathan,N. S. Vasanthi and S. S. Khan, Colloids Surf., B, 2013, 102,379–384.
33 O. Aksakal and H. Ucun, J. Hazard. Mater., 2010, 181, 666–672.
34 M. J. Tempkin and V. Pyzhev, Acta Physicochim. URSS, 1940,12, 217–222.
35 C. Aharoni and M. Ungarish, J. Chem. Soc., 1977, 73, 456–464.
36 M. M. Dubinin and L. V. Radushkevich, Proceedings of theAcademy of Sciences (USSR), 1947, 55, 331–333.
37 K. M. Rani, P. N. Palanisamy, S. Gayathri and S. Tamilselv,International Journal of Innovative Research in Science,Engineering and Technology, 2015, 4, 6845–6853.
38 Y. Feng, H. Zhou, G. Liu, G. Qiao, J. Wang, H. Lu, L. Yang andY. Wu, Bioresour. Technol., 2012, 125, 138–144.
39 S. Lagergren, K. Sven. Vetenskapsakad. Handl., 1898, 24, 1–39.
40 Y. Yao, F. Xu, M. Chen, Z. Xu and Z. Zhu, Bioresour. Technol.,2010, 101, 3040–3046.
41 J. Sarma, A. Sarma and K. G. Bhattacharyya, Ind. Eng. Chem.Res., 2008, 47, 5433–5440.
42 A. Dabrowski, Adv. Colloid Interface Sci., 2001, 93, 135–224.43 P. Humpola, H. Odetti, A. Fertitta and J. Vicente, J. Chil.
Chem. Soc., 2013, 58, 1541–1544.
RSC Adv., 2017, 7, 27248–27259 | 27259