utilization of the modified tanahashi model for assessing
TRANSCRIPT

Utilization of the Modified Tanahashi Model for Assessing Universal Effective Health
Coverage: The Nigeria Bottleneck Instrument and its’ Implications for Planning
By
Ebehiwele Ebhohon
A Master’s Paper submitted to the faculty of
the University of North Carolina at Chapel Hill
in partial fulfillment of the requirements for
the degree of Master of Public Health in
the Public Health Leadership Program
Chapel Hill
Spring 2018
Approved by:
Date
Date

i
ABSTRACT
Background
The Sustainable Development Goal 3 (SDG-3) through evidence-based health coverage models;
aim to mitigate the existing health disparities among populations. The Tanahashi model
developed in 1978 and subsequently modified is one model that has been adapted to several
countries to identify gaps and barriers in health systems performance. This modified Tanahashi
model is referred to as the Bottleneck Analysis instrument for health systems delivery and
highlights six determinants of effective coverage. This include Essential Commodities, Human
Resources, Geographical Access, Initial Utilization, Continuous Coverage, and Quality. The first
three determinants constitute the supply-side determinants and the other three, the demand-side
determinants. The modified Tanahashi model was adapted to Nigeria context and is called the
Nigeria Bottleneck analysis instrument. This study sort out to assess the nature of the
relationships between these determinants that constitute this instrument, premised on the
modified Tanahashi model, its ability to perform accurate bottleneck analyses in Nigeria Primary
health care system and predict Universal Effective Health Coverage.
Methods
The study used cross-sectional data from 147 LGAs located in 11 states to examine the
relevance of the Bottleneck Analysis instrument in UEHC planning. The measures include
Commodity, Human Resources, Geographical Access, Utilization, Continuity and Quality and
are continuous variables. Three analytic approaches—Pearson’s correlation, Frequency count
and Ordinary Least Squares regression—were used to address the research questions. For select
tracer interventions: Routine immunization, Integrated Management of Childhood Illnesses,

ii
Antenatal care and Skilled Birth Attendance and Newborn Care intervention, were evaluated in
this study.
Results
Data consisted of Ninety-nine (68%) observations from Northern Nigeria and 47 (32%) from
Southern Nigeria. Analysis to determine the correlation between the determinants for the select
tracer interventions were predominantly not statistically significant on the supply-side. On the
Demand side, the results showed linear relationships between Utilization and Continuity (p <
.001) as with Continuity and Quality (p < .001). The Nigeria bottleneck analysis instrument
collectively explained 26-50% of the total variance in the effectiveness of Routine
Immunization, Integrated Management of Childhood Illnesses, Antenatal Care and Skilled Birth
Attendance and Newborn Care coverage. Another notable finding in this study was that there is
significant decrease in the quality of routine immunization coverage in the northern states in
comparison with southern states.
Conclusion
In this study, the Nigeria bottleneck analysis instrument was not a good predictor of quality
coverage for the select tracer interventions. Aside Utilization and Continuity, other determinants
that make up the instrument, did not significantly predict effective coverage. Furthermore, the
few diminished relationships observed in this study— a criteria to perform true bottleneck
analyses, impedes proper planning and monitoring of the nation’s progress to Universal Effective
Health Coverage. To ensure appropriateness of use, improved healthcare information systems for
better data quality and well-structured proxy-indicators are required. Likewise, the government
should provide the necessary resources to drive competency in data management and collection.

iii
ACKNOWLEDGEMENTS
My deepest thanks to my advisor, Professor Rohit Ramaswamy, for his invaluable guidance and
support in developing the content and direction for this research paper.
I am very much thankful to my Second Reader, Dr. Ejemai Eboreime for his keen interest,
support and enormous contribution to this paper.
I express my deep sense of gratitude and appreciation to the Ebhohon, Ansong and Malik family
for their unwavering support during my Master’s program.

iv
CONTENTS
ABSTRACT ..................................................................................................................................................................i
ACKNOWLEDGEMENTS ...................................................................................................................................... iii
ABBREVIATIONS .....................................................................................................................................................vi
CHAPTER 1 ................................................................................................................................................................. 1
Background ............................................................................................................................................... 1
Problem Statement ................................................................................................................................ 6
CHAPTER 2 ................................................................................................................................................................. 8
Study Setting and Design ............................................................................................................................ 8
Measures ............................................................................................................................................. 10
Analytical Approach .................................................................................................................................... 11
Ethical Approval ...................................................................................................................................... 12
CHAPTER 3 ............................................................................................................................................................... 14
Characteristics of the Sample ................................................................................................................... 14
Correlations between the Determinants in the NBNA Instrument ........................................................ 15
Diminishing Relationship between Demand Side Variables ..................................................................... 16
Multivariate Results ................................................................................................................................. 17
CHAPTER 4 ............................................................................................................................................................... 20
Recommendations for Leadership ........................................................................................................................... 23
Limitations .................................................................................................................................................... 24
Conclusion ................................................................................................................................................. 24
REFERENCES .......................................................................................................................................................... 26
APPENDICES ............................................................................................................................................................ 32
Table A: Adapted Coverage Indicators for Routine Immunization ........................................................... 32
Table B: Adapted Coverage Indicators for Integrated Management of Childhood Illnesses ................. 33
Table C: Adapted Coverage Indicators for Antenatal Care (ANC)......................................................... 34
Table D: Adapted Coverage Indicators for Skilled Birth Attendance & Neonatal Care................... 35
Table E: Correlation Matrices ............................................................................................................ 36
Table F: Ordinary Least Squares Models ..................................................................................... 37

v
LIST OF TABLES AND FIGURES
Tables
Table 1: Data Sources………………………………………………………………………….9
Table 2: Descriptive Statistics………………………………………………………………..15
Table 3: Results of Regression Models………………………………………………………19
Figures
Fig. 1. Tanahashi coverage diagram and coverage measurements.........................................2
Fig. 2. The modified Tanahashi model for health systems…………………………………...4
Fig. 3. Conceptualization of the assumed relationships between the supply
determinants.................................................................................................................................4
Fig. 4. Conceptualization of the diminished cascade between demand-side
determinants…………………………………………………………………………………….5
Fig. 5. Map of Northern and Southern regions of Nigeria……………………………………8

vi
ABBREVIATIONS
ACT Artemisinin Combination Therapy
ANC Antenatal Care
BCG Bacille Calmette-Guerin
DV Dependent Variable
DTP Diphtheria Pertussis Tetanus vaccine
HF Health Facility
HIV Human Immunodeficiency Virus
IDV Independent Variable
IPT Intermittent Preventive Therapy
IMCI Integrated Management for Childhood Illnesses
IRB Institutional Review Board
LGA Local Government Area
LMICs Low and Middle-Income Countries
MCV Measles Conjugate Vaccine
M & E Monitoring and Evaluation
NPHCDA National Primary Health Care Development Agency
NSHDP National Strategic Health Development Plan
OLS Ordinary Least Squares
OPV Oral Polio Vaccine
Penta Pentavalent Vaccine
PHC Primary Health Care
RI Routine Immunization

vii
SBANC Skilled Birth Attendance and Newborn Care
UN United Nations
UNICEF United Nations Children Fund
UHC Universal Health Coverage
UEHC Universal Effective Health Coverage
WHO World Health Organization

1
CHAPTER 1
Background
Disparities in health and care among and within countries is well known. The Tracking
Universal Health Coverage: 2017 Global Monitoring Report by the World Health Organization
(WHO) and the World Bank revealed that over 400 million people worldwide do not have access
to primary care (WHO & World-Bank, 2015). These disparities are partly due to limited access,
inequitable distribution of adequately trained health professionals, cost and poor service delivery
(Adedini, Odimegwu, Bamiwuye, Fadeyibi, & De Wet, 2014), and are particularly problematic
in Low and Middle-Income Countries (LMICs) (Leslie, Malata, Ndiaye, & Kruk, 2017).
Studies from High-Income Countries link primary health care and Universal Health Coverage
(UHC) to lowered health costs, heightening the importance of improved primary health care in
LMICs where progress towards UHC remains below expectations (Leslie et al., 2017; Macinko,
Starfield, & Erinosho, 2009). Given the benefits of primary health care and UHC, the United
Nations (UN) recommend that countries strengthen primary health care (PHC) systems to ensure
coverage for all at every stage of life (ECOSOC, 2017). UHC has four core tenets: strengthening
health systems, providing affordability of care, improving access to services, and building
capacity (Ng et al., 2014). However, a critique of most UHC initiatives is that they guarantee
extensive coverage, but not Universal Effective Health Coverage (UEHC) that encompasses both
nominal coverage and health intervention quality (Guerrero-Núñez, Valenzuela-Suazo, & Cid-
Henríquez, 2017; Ng et al., 2014). Therefore, there is a growing consensus that evaluation of
health systems delivery towards UEHC attainment would benefit from performance analyses
(Bitton et al., 2017; Chopra, Sharkey, Dalmiya, Anthony, & Binkin, 2012; Hayes, Parchman, &
Howard, 2011; Reeve, Humphreys, & Wakerman, 2015; Tanahashi, 1978; Wong et al., 2010).

2
The Tanahashi coverage model developed in 1978 is one model introduced to monitor and
evaluate health systems. The model, as depicted in Figure 1, consists of five distinct and
indispensable stages required in sequential order to predict quality coverage (a measure of the
proportion of people with health benefits).
Fig. 1. Tanahashi coverage diagram and coverage measurements. Source: From
(O’Connell & Sharkey, 2013).
The model highlights the need for availability of essential commodities and human resources
(availability coverage) as the first step for the attainment of Universal Effective Coverage,
followed by the development of strategies aimed at mitigating barriers to health intervention
accessibility (accessibility coverage). Once availability and accessibility coverage are in place,
Tanahashi proposed that other factors such as affordability, values, and beliefs be addressed, to
increase a population’s willingness to use an intervention (acceptability of coverage). Sequential
execution of processes intended to address each of these stages is expected to increase a
population’s initial and continued interaction with the service providers and essential
commodities (contact coverage) that will culminate in quality coverage (effectiveness coverage)

3
(Tanahashi, 1978). In Tanahashi’s view, the gap in health systems delivery, which he identified
as the difference between effectiveness coverage (the proportion of the target population that
interacts with all five stages) and nominal coverage (the proportion of the target population that
interacts with only the first three stages), needs to be filled (Kiwanuka Henriksson, Fredriksson,
Waiswa, Selling, & Swartling Peterson, 2017; O’Connell & Sharkey, 2013; Tanahashi, 1978).
Several decades later, O’Connell and Sharkey (2013) revealed some limitations to the use of the
Tanahashi model. They pointed out that all five stages (availability, accessibility, acceptability,
contact and effectiveness coverage) are evaluated based on public sector data thought to be
comprehensive, but in reality, there are challenges in obtaining comprehensive data on primary
care and services rendered by the private health sector, resulting in underestimation of coverage
indicators. The availability (essential commodities and human resources) and accessibility
coverage indicators are the most susceptible to data challenges compared to the stages
(acceptability, contact and effectiveness coverage), whose data are derived mainly from
household and popualation surveys. This critique led to a critical modification focused on
obtaining the appropriate proxy indicator measurements for monitoring and evaluation of each
process stage. Furthermore, availability coverage was split into two separate determinants—
availability of essential commodities and availability of human resources—to improve data
management by service providers (see Fig. 2). The resulting six-stage determinant model is
known as the modified Tanahashi model (three determinants each on the supply and demand
side) (O’Connell & Sharkey, 2013).

4
Fig. 2. The modified Tanahashi model for health systems. Source: From (O’Connell
& Sharkey, 2013)
Two assumptions underlie this modified version:
Assumption 1: Supply side determinants should show positive correlations but there is no
requirement for a cascade since each denominator on this side of the model might differ.
Fig. 3. Conceptualization of the assumed relationships between the supply determinants.
Geographical
access
Commodity
Human
resources

5
Assumption 2: On the demand side, linear realationships must be found that is, initial utilization
value should determine continuous utilization value that in turn should determine effective
coverage value. In addition, a diminished cascade between the demand-side determinants is a
criteria to perform true bottleneck analysis (see Fig. 3) (Kiwanuka Henriksson et al., 2017;
O’Connell & Sharkey, 2013).
Fig. 4. Conceptualization of the diminished cascade between demand-side determinants.
Because it is not feasible to access the quality of all interventions provided in a given setting,
O’Connell et al also introduced the concept of “tracer interventions.” These are a set of selected
interventions most relevant to a local context and generalizable to other health interventions in
the country (Boerma, AbouZahr, Evans, & Evans, 2014; O’Connell & Sharkey, 2013). During
the assessment of PHC system, the selected interventions are evaluated with the modified
Tanahashi model and data obtained help estimate a nation’s progress towards UEHC. The United
Nations Children Fund (UNICEF) and other stakeholders have now applied the modified
Tanahashi model to several LMICs, including Nigeria, to identify and address gaps in health

6
systems delivery (Baker et al., 2015; Kiwanuka Henriksson et al., 2017; Rupani, Gaonkar, &
Bhatt, 2016; Yawson et al., 2016).
Problem Statement
Following the adoption of a long-term National Strategic Health Development Plan (NSHDP) by
Nigeria Federal Ministry of Health to address the disparities in health and care in the nation, the
modified Tanahashi model was adapted to the Nigerian context and used to evaluate the nation’s
PHC system. The adapted tool—Nigeria Bottleneck analysis (NBNA) instrument—has been used
to identify strengths, gaps, and barriers in health systems delivery. Tracer interventions evaluated
by the NBNA instrument include Routine Immunization (RI), Integrated Management of
Childhood Illnesses-Malaria (IMCI), Antenatal care (ANC) and Skilled Birth Attendance and
Newborn Care (SBANC) (NPHCDA, 2009).
Thus far, the NBNA instrument demonstrates face validity as an effective tool for UEHC
planning based on similarities to the modified model, content review by experts, and scholarly
articles that cite availability, accessibility, and utilization of services as top contributors to
improved population outcomes (Adedini et al., 2014; Baker et al., 2015; Kiwanuka Henriksson et
al., 2017; Rupani et al., 2016). However, to test its effectiveness in the Nigeria context, it is
critically important to ascertain empirically the instrument’s ability to (a) predict UEHC, and (b)
exhibit the characteristics of the modified Tanahashi model. In other words, does the assumption
of a correlation between the supply-side determinants and linear relationship between the
demand-side determinants hold when applied to field data from Nigeria? The present study aims
to determine the applicability of the Nigeria BNA instrument in planning for UEHC to help
provide clarity on these unanswered questions. The objectives are:

7
1. To assess the nature of the relationships between the indicators in the NBNA
instrument and how it compares to the modified Tanahashi model.
2. To determine the ability of the NBNA instrument to perform accurate bottleneck
analysis in Nigeria PHCs.
3. To examine the extent to which the NBNA instrument predicts effective coverage for
the selected tracer interventions (RI, IMCI, ANC and SBANC).
Insights gained from this study will help validate the applicability of the NBNA instrument to
evaluate Nigeria’s progress towards UEHC and to make recommendations, if any, for improving
the instrument validity for better measurement outcomes.

8
CHAPTER 2
METHODS
Study Setting and Design
The study used cross-sectional PHC data collected using the Nigeria BNA instrument from Local
Government Areas (LGAs) located in the northern and southern regions (See Fig. 5).
Per the World Bank’s income classification, Nigeria is a Lower-Middle Income
Country. Located in Western Africa, Nigeria has an estimated population of 196
million. The Federal Republic, comprising 36 states and the Federal Capital
Territory (FCT, Abuja) is subdivided into 774 local government areas (Ishaku, Majid, Peters, &
Ali Haruna, 2011). According to WHO data, the life expectancy in Nigeria at birth for
male/female is estimated to be 53.4/55.6 years (WHO, 2015)
*red dots denote the eleven states included in the study
Fig. 5: Map of North and South regions of Nigeria
9
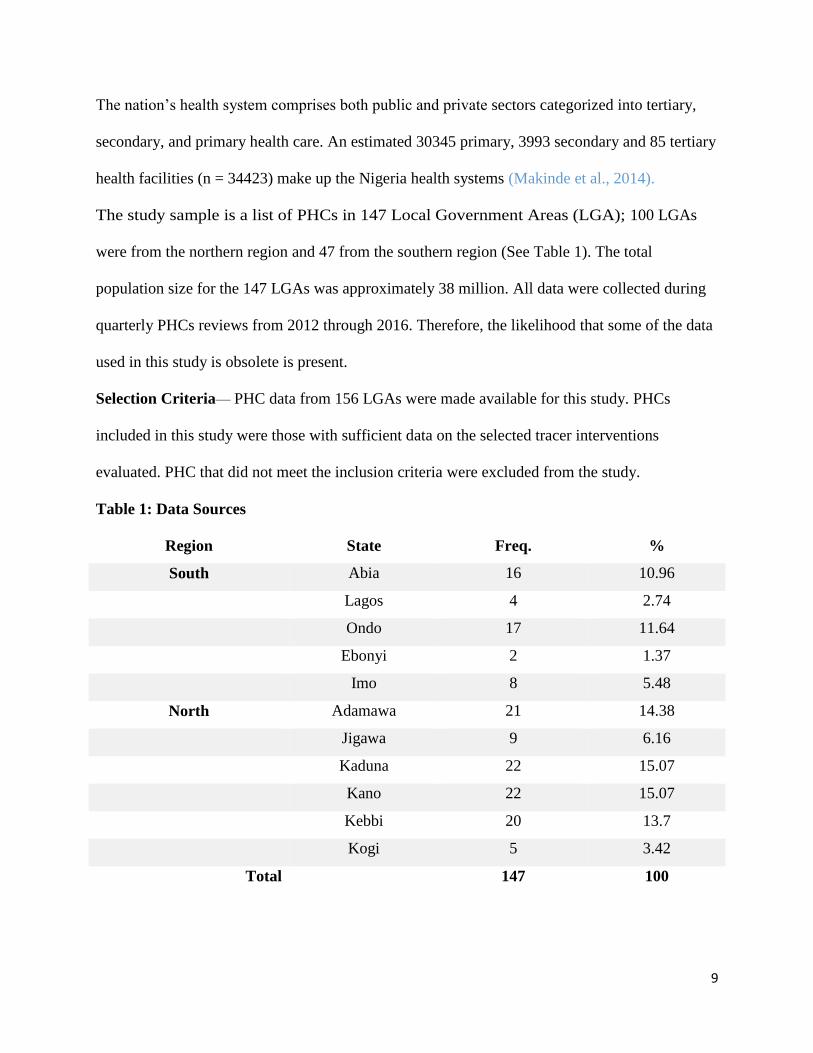
The nation’s health system comprises both public and private sectors categorized into tertiary,
secondary, and primary health care. An estimated 30345 primary, 3993 secondary and 85 tertiary
health facilities (n = 34423) make up the Nigeria health systems (Makinde et al., 2014).
The study sample is a list of PHCs in 147 Local Government Areas (LGA); 100 LGAs
were from the northern region and 47 from the southern region (See Table 1). The total
population size for the 147 LGAs was approximately 38 million. All data were collected during
quarterly PHCs reviews from 2012 through 2016. Therefore, the likelihood that some of the data
used in this study is obsolete is present.
Selection Criteria— PHC data from 156 LGAs were made available for this study. PHCs
included in this study were those with sufficient data on the selected tracer interventions
evaluated. PHC that did not meet the inclusion criteria were excluded from the study.
Table 1: Data Sources
Region State Freq. %
South Abia 16 10.96
Lagos 4 2.74
Ondo 17 11.64
Ebonyi 2 1.37
Imo 8 5.48
North Adamawa 21 14.38
Jigawa 9 6.16
Kaduna 22 15.07
Kano 22 15.07
Kebbi 20 13.7
Kogi 5 3.42
Total 147 100

10
Measures
The independent variables are Commodity, Human Resources, Geographical Access, Utilization
and Continuity while Quality was the dependent variable. Both are continuous variables and
defined as follows.
Independent Variables
1. Commodity: This corresponds to “Availability Coverage for essential health
commodities” outlined in the modified Tanahashi model. It is generated as the number of
health facilities (HFs) with health systems inputs divided by the number of facilities
providing the intervention and expressed in percent. Systems inputs assessed include Oral
Polio Vaccine or Pentavalent vaccine for RI; Artemisinin Combination Therapies (ACTs)
for IMCI, Iron-Folate Supplements for ANC and delivery kits for SBNAC interventions.
2. Human resources: This corresponds to “Availability Coverage for human resources”.
This is calculated as sum of service providers that received adequate training in
intervention (for example, maternal and newborn care) divided by sum of all service
providers in a given facility. It is expressed in percent. The human resources assessed
include trained vaccinators for RI, health providers for IMCI and Antenatal Care, as well
as staff trained in basic emergency obstetric care or SBNAC interventions.
3. Geographical access: This corresponds to “Accessibility Coverage”. It refers to physical
accessibility of HFs. It is generated as the number of people living within a 5 km radius
from HFs that offer basic delivery services divided by the population size of the LGA. It
is expressed in percent.
4. Utilization: This corresponds to “Contact Coverage, i.e., initial utilization” in the
modified model. This refers to first contact or use of service(s) or intervention(s). It is
11
calculated as the sum total of the target population that interact or use the service and/or
intervention for the first time divided by the target population living within the LGA. It is
expressed in percent.
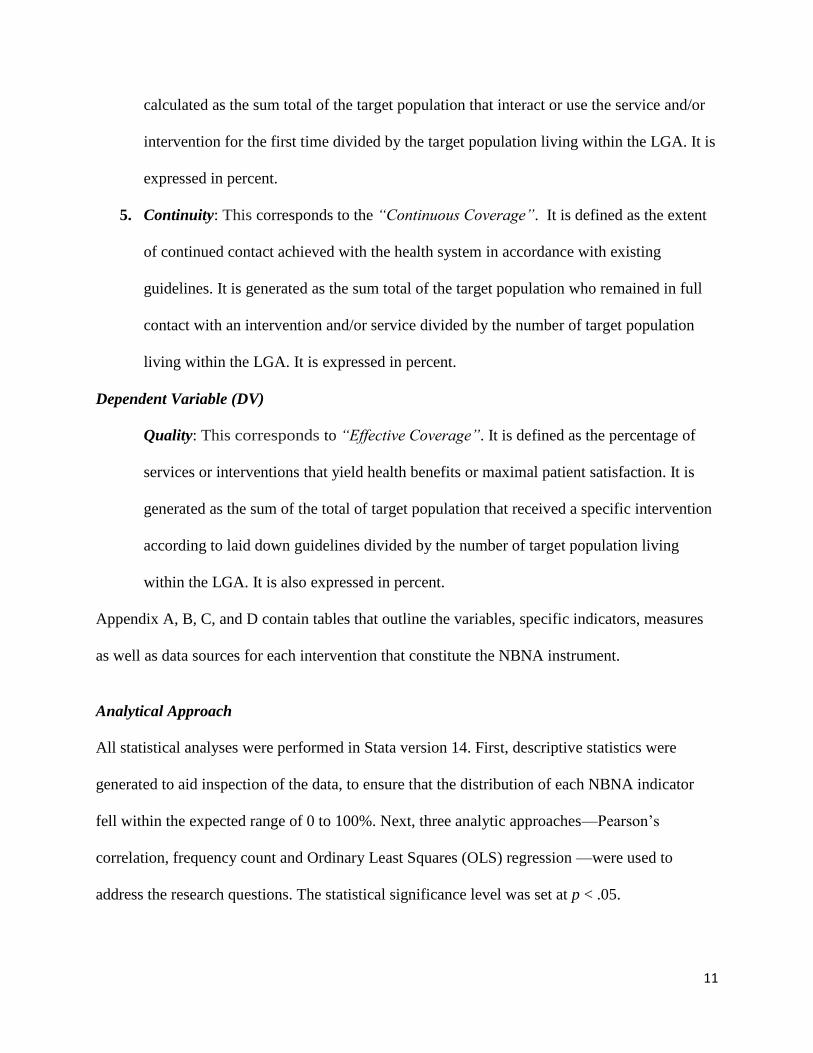
5. Continuity: This corresponds to the “Continuous Coverage”. It is defined as the extent
of continued contact achieved with the health system in accordance with existing
guidelines. It is generated as the sum total of the target population who remained in full
contact with an intervention and/or service divided by the number of target population
living within the LGA. It is expressed in percent.
Dependent Variable (DV)
Quality: This corresponds to “Effective Coverage”. It is defined as the percentage of
services or interventions that yield health benefits or maximal patient satisfaction. It is
generated as the sum of the total of target population that received a specific intervention
according to laid down guidelines divided by the number of target population living
within the LGA. It is also expressed in percent.
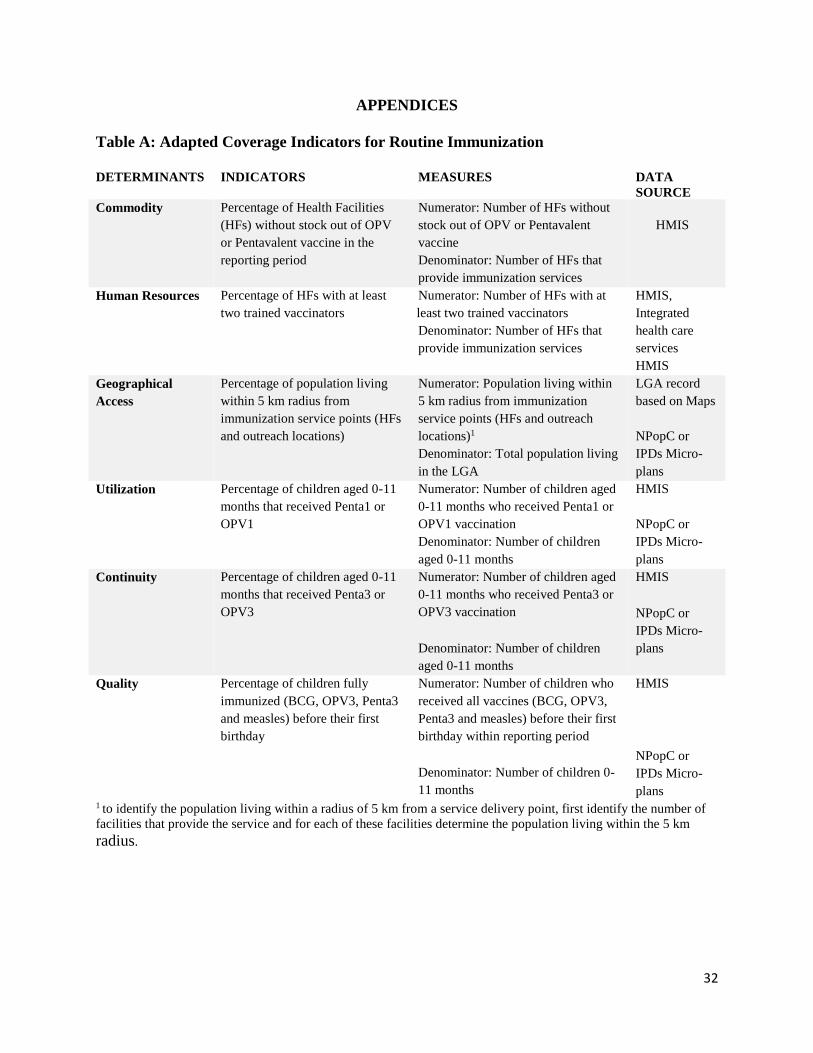
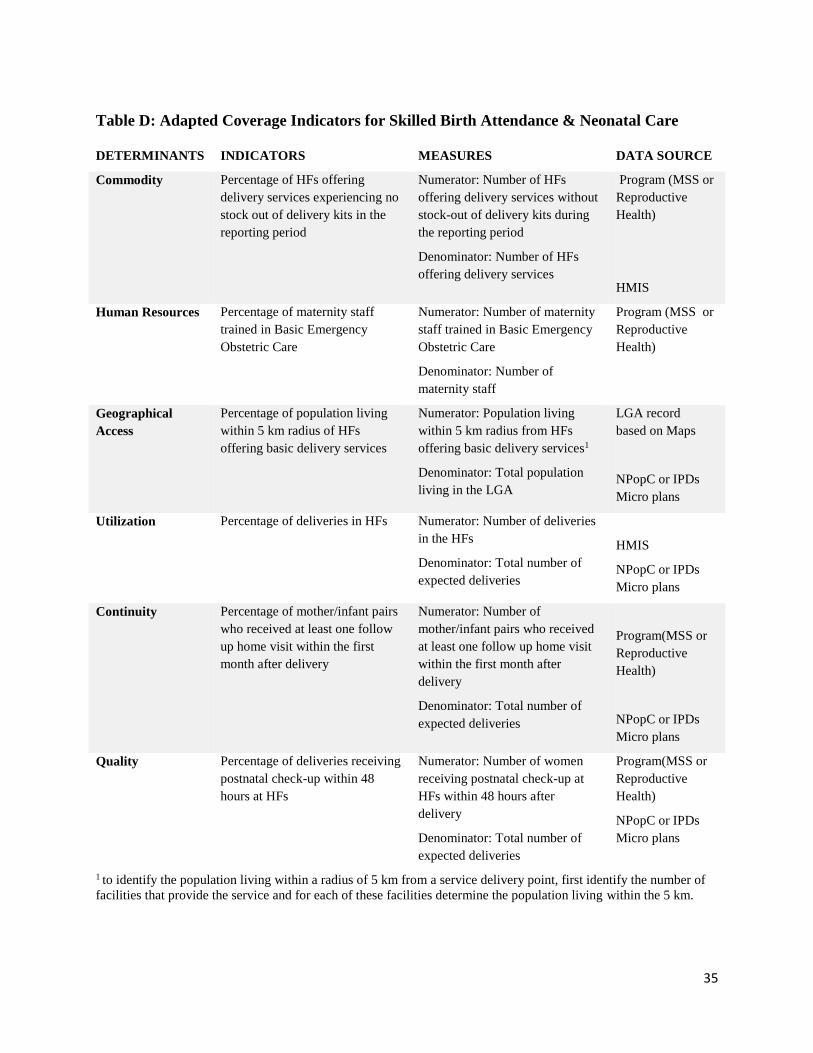
Appendix A, B, C, and D contain tables that outline the variables, specific indicators, measures
as well as data sources for each intervention that constitute the NBNA instrument.
Analytical Approach
All statistical analyses were performed in Stata version 14. First, descriptive statistics were
generated to aid inspection of the data, to ensure that the distribution of each NBNA indicator
fell within the expected range of 0 to 100%. Next, three analytic approaches—Pearson’s
correlation, frequency count and Ordinary Least Squares (OLS) regression —were used to
address the research questions. The statistical significance level was set at p < .05.

12
Pearson’s correlation was used to test the strength and direction of the relationships between the
six determinants that constitute the NBNA instrument (commodity, human resources,
geographical access, utilization and continuity and quality). For interpretation purposes, the
magnitude of the relationships were classified as either weak (r range: 0.0 to 0. 3), moderate (r
range: 0.3 to 0.6) or strong relationship (r range: 7 or greater) (Godwin, Pike, Bethune, Kirby, &
Pike, 2013).
Frequency count was used to determine the percentage of PHC facilities that met the criteria of a
diminishing relationship from Utilization to Quality as assumed by the Tanahashi model.
OLS regression was used to investigate the predictive influence of the independent variables on
the dependent variable that is effective coverage for the selected tracer interventions. Four OLS
models were run, one model for each of the four select tracer intervention. The regression
models also controlled for locality (northern vs southern region). Inclusion of a covariate for
locality was informed by the possibility that the comparatively high illiteracy and low female
empowerment in the north, compared to the south, influence utilization of PHCs. A variance
inflation factor (VIF) greater than 5 was used to assess the presence of collinearity (Hair, 2011).
The adjusted R2 was used to determine the percentage of variance in the dependent variable
across the four intervention that was collectively explained by the independent variables.
Missing values in each variables were dealt with through list-wise deletion.
Ethical Approval
Secondary data used was devoid of personal identifiers. Permission for the use of data was
received from Nigeria Primary Health Care Development Agency (NPHCDA). The study is
under broader research that received ethical approval from Nigeria’s National Health Research

13
Ethics Committee (NHREC/01/01/2007-13/08/2016). The Institutional Review Board (IRB) of
the University of North Carolina at Chapel Hill (IRB Number 18-0213) deemed the study
exempt.

14
CHAPTER 3
RESULTS
Characteristics of the Sample
Table 2 presents the descriptive statistics of the sample. The sample consisted of 147 PHC
observations, 100 from the north while 47 came from south. Missing values in the variables
ranged from 1.37% to 20.55%. The average population per LGA was 259,458 (149532.40).
There were variations in the availability of determinants and use of interventions across the
LGAs in this study. The average percent of health facilities (HFs) with systems inputs
(commodity) during the reporting period across all four interventions ranged from 57 (33.91) to
90 (19.99). The average percent of health workers with adequate training in specific health
intervention ranged from 13 (12.56) to 78 (23.93). The average percent of the population with
physical accessibility of HFs range from 36 (24.62) to 57 (25.71). The average percent of first
contacts or use of service and/or intervention ranged from 15 (16.46) to 59 (24.64). The average
percent of the target population that remained in contact with an intervention ranged from 06
(7.89) to 52 (24.72) while the average percent of the target population that received an
intervention according to specified guidelines ranged from 06 (7.21) to 46 (25.51).

15
Table 2: Descriptive Statistics
Variables RI IMCI ANC SBANC
Mean SD Mean SD Mean SD Mean SD
Commodities 90.07 19.99 57.18 33.91 79.91 25.02 61.09 34.58
Human resources 77.79 23.93 42.27 29.13 22.82 21.43 13.25 12.56
Geographical access 56.97 25.71 52.59 24.50 47.16 23.66 35.94 24.62
Utilization 59.03 24.64 19.60 24.98 36.91 26.40 14.46 16.46
Continuity 52.12 24.72 13.88 21.17 28.62 23.85 5.52 7.89
Quality 46 25.51 8.28 17.68 18.77 19.89 5.87 7.21
Population size per LGA 259457.90 (149532.40)
Sample Size (n) 147 (North = 100, South = 47)
SD = Standard Deviation
Correlations between the Determinants in the NBNA Instrument
The relationships between the determinants that constitute the NBNA instrument and how they
compare to the modified Tanahashi model were examined using Pearson’s Correlation. Results
for the four select tracer interventions are as follows (See Appendix E).
Routine immunization (RI): On the supply-side, no statistically significant correlations were
found among the variables. On the Demand side, findings revealed strong positive correlation
between RI Utilization and Continuity (r = 0.91, p <.001). Similarly, strong positive correlation
was observed between RI Continuity and Quality (r =0.73, p <. 001).
Integrated Management for Childhood Illnesses (IMCI): As for RI, no statistically significant
correlations were found on the supply side. On the demand side, findings revealed a strong

16
positive correlation between IMCI Utilization and Continuity (r = 0.77). A strong positive
correlation was also found between IMCI Continuity and Quality (r =0.75).
Antenatal Care (ANC): On the supply-side, the only statistically significant correlation was a
weak positive correlation was found between ANC Commodity and Human resources (r = 0.27,
p <.01). On the demand side, the results showed moderate positive correlation between ANC
Utilization and Continuity (r = 0.65) as well as ANC Continuity and Quality (r =0.64).
Skilled birth Attendance & Newborn Care (SBANC): On the supply-side, a weak positive
correlation was found between SBANC Commodity and Human resources (r = 0.3, p <.01. On
the Demand side, findings showed strong positive correlation between SBANC Utilization and
Continuity (r = 0.63). Similarly, findings revealed strong positive correlation between SBANC
Continuity and Quality (r =0.78).
Diminishing Relationship between Demand Side Variables
Because a prerequisite for the valid use of the modified Tanahashi model involve a diminished
cascade on the demand side, frequency count was carried out to determine the ability of the
Nigeria BNA instrument to perform accurate bottlenecks analysis at PHC reviews. From the
results, a diminished cascade was found on the demand side for a few PHCs. For RI — 47 (32
%), IMCI —38 (26 %), ANC —51 (35 %) and for SBANC— 22 (14 %).

17
Multivariate Results
Table 3 presents the results of all four best-fitting regression models. In the table, the
standardized coefficients (β) are presented with the standard errors (SE) and p-values.
Statistically significant associations are denoted with asterisks.
Routine Immunization (RI): Column 1 of Table 3 represents the relationships between the
predictors of effective RI coverage. The regression coefficient associated with Utilization was
statistically significant (β = 0.60, SE = 0.07, p <.001) and suggests that when all other variables
are held constant, a one unit rise in Utilization is associated with a 0.60% increase in RI Quality.
The coefficient associated with northern LGAs was statistically significant and suggests that
when other variables are held constant, the northern LGAs have an average RI Quality score that
is 15.64% less than the southern LGAs (β = -15.64, SE = 3.73, p <.001 ). The adjusted R-
Squared was 0.55.
Integrated Management for Childhood Illnesses (IMCI): The association between IMCI
Utilization and Quality was also statistically significant (β = 0.30, SE = 0.06, p <.001) and
suggest that as utilization of IMCI intervention increases, when all other variables are held
constant, a 1-unit rise in IMCI Utilization was associated with a 0.30% increase in RI Quality.
There was no difference between the northern and southern states. The adjusted R-Squared was
0.26.
Antenatal Care (ANC): Column 3 of Table 3 represents the relationships between the
determinants of the effectiveness of ANC coverage. The association between ANC Utilization
and Quality was also statistically significant (β = 0.46, SE = 0.07, p < .001) and suggests that
when all other variables are held constant, a 1-unit increase in ANC Utilization was associated

18
with a 0.46% increase in ANC Quality. There was no difference between the northern and
southern states. The adjusted R-Squared was 0.36.
Skilled birth Attendance & Newborn Care (SBANC): Column 4 of Table 3 represents the
relationships between the predictors of effective SBANC coverage. The association between
SBANC Utilization and Quality was statistically significant (β = 0.48, SE = 0.05, p < .001) and
suggests that when all other variables are held constant, a 1-unit increase in SBANC Utilization
is associated with a 0.48% increase in SBANC Quality. There was no difference between the
northern and southern states. The adjusted R-Squared was 0.36.

19
Table 3: Results of Regression Models
Categorical variable
RI
β
SE
IMCI
β
SE
ANC
β
SE
SBANC
β
SE
Commodity -0.16 0.07 0.05 0.01
0.08 0.04 0.07 0.02
Human Resources 0.04 0.05 0.13 0.06
0.06 0.05 0.08 0.05
Geographical Access 0.05 0.003 0 .01 -0.02
0.06 0.05 0.07 0.03
Utilization 0.60*** 0.30 *** 0.46*** 0.48***
0 .07 0.06 0.07 0.05
Northern LGAs -15.64 *** 2.07 -3.20 -3.36
3.73 2.68 3.58 1.71
Constant 29.48** -5.41 -2.08 1.62
9.85 4.45 6.62 2.13
Model Fit
F (df) 25.28 (5.00)*** 6.97(5.00)* 13.81 (5.00)*** 22.88 (5.00)***
Adjusted R-Squared 0.55 0.26 0.36 0.50
N 100 107 117 112
Notes * p < .05, ** p < .01, *** p < .001; RI- Routine Immunization; IMCI-Integrated
Management for Childhood Illnesses; ANC-Antenatal Care; SBANC- Skilled Birth Attendance
and Newborn Care

20
CHAPTER 4
DISCUSSION
The purpose of this study was to determine the relevance of the NBNA instrument for assessing
UEHC and its’ implications for future planning. This study identified four important findings
related to the research questions. First, the results offer support for the presence of linear
relationships between the demand-side determinants —Utilization, Continuity and Quality since
these were positively correlated for all the interventions. Conversely, the findings were not
consistent with the modified Tanahashi model’s expectation of positive correlations among the
supply determinants — Commodity, Human resources and Geographical access. Second, the
ability of the NBNA instrument to perform valid bottleneck analysis was limited in this study as
less than 40% of the PHCs data on the select tracer interventions evaluated by this study,
demonstrated a diminishing relationship from Utilization to Quality. Third, findings from the
study suggest that the NBNA instrument is not a good predictor of quality intervention for
UEHC planning in Nigeria. Notably, this study also revealed that routine immunization coverage
is of lesser quality in northern regions.
Correlation analyses of the determinants of effective coverage showed that the relationships on
the demand-side are consistent with Tanahashi as well as O’Connell et al (2013) assertions that
initial utilization is correlated with continuous coverage and this in turn, correlated with quality
coverage (O’Connell & Sharkey, 2013; Tanahashi, 1978). Furthermore, this finding supports
Kiwanuka Henriksson et al study that the quality of an intervention is highly dependent on the
availability of these determinants (Kiwanuka Henriksson et al., 2017). The findings are also
consistent with multiple studies that cite lack of initial utilization of health interventions or
services particularly in rural areas as barriers to effective coverage (Adedini et al., 2014; Douthit,

21
Kiv, Dwolatzky, & Biswas, 2015; Oyekale, 2017; Weinhold & Gurtner, 2014). However, on the
demand side, data from only a few PHCs data demonstrated the diminishing relationship
conceptualized by Tanahashi (1978) and O’Connell et al (2013). One probable cause might be
the proxy-indicators used in the collection of data. The IMCI Continuity and Quality as with
SBANC Continuity and Quality indicator measures utilized for PHC reviews are not sequential.
Therefore, a diminished cascade is not to be expected between Continuity and Quality for IMCI
and ANC interventions. On the hand, though RI and ANC Utilization to Quality indicator
measures offer uninterrupted measurements, a majority of the RI and ANC PHC data did not
reveal diminished cascades. One possibility is the poor data quality from the nation’s health
information systems. Another possible explanation is that the target population might begin
utilizing services in one PHC facility (initial utilization) and then decide to complete ‘the dose’
of the intervention (continous utilization) at another health facility that provides same service,
which could be private. This is compounded by poor data linkages between health facilities,
making it difficult to account for who begun and stayed in full contact with the intervention or
services according to laid down guidelines, particularly when the transition is between private
and public health facilities. Similarly, the demand-side determinants rely on population estimates
which are largely affected by migration in and out of the population. This finding offers support
for Hahn et al (2013) study that report that health information systems in resource-limited
settings like low- and middle-income countries are plague with poor data quality and lost to
follow-up (Hahn, Wanjala, & Marx, 2013).
On the supply- side, findings were not consistent with O’Connell et al’s (2013) assertion of the
existence of purely positive correlations though of vary magnitude between essential
commodities, human resources and physical accessibility. This might be in part due to the data

22
quality issues arising from lack of expertise and right tools to ensure proper data collection and
management. Although consistency of positive correlation is not a requirement for accurate
bottleneck analysis, understanding the relationship on the supply-side, and how they affect health
intervention or service utilization has policy and practical implications for UEHC planning.
Overall, the regression analyses showed that Commodity, Human resources and Physical
accessibility are not significant predictors of intervention Quality. In this study, only Utiliization
and Continuity were found to be significant predictors of effective coverage for RI, IMCI, and
ANC. These findings are not consistent withTanahashi (1978) and O’Connell et al (2013)
assertions and scholarly articles that cite availability coverage for essential commodities, human
resources, geographical accessibility, initial use, and continuous utilization as significant
contributors to the quality of any health intervention or service (Kiwanuka Henriksson et al.,
2017; Rupani et al., 2016).
Another noteworthy finding in this study is that the quality of routine immunization coverage in
the north is lower compared to the south. This reinforces findings from Eboreime, Bozzani, and
Abimbola (2015)’s research on disparities in routine immunization across the regions of Nigeria.
A possible explanation is the misconception that vaccines cause more harm than good (Jegede,
2007; Nasiru et al., 2012), cultural and religious practices that act as barriers to good-health
seeking behavior on vaccination in this region, and made worse by certain religious and
campaign groups that spread anti-vaccine messages (Oku et al., 2017; Ophori, Tula, Azih,
Okojie, & Ikpo, 2014). Similarly, the greater lack of female empowerment and cultural
constraint to make decisions on some issues of importance in northern Nigeria (Ibrahim &
Zalkuwi, 2014) lingers and threatens the health of the under-fives.

23
Recommendations for Leadership
Based on the findings from this study, I recommend the following actions to be undertaken by
those in public health leadership positions in the government:
Policy and regulations
Government should provide resources for capacity building in health information systems
to ensure standardization of the nation’s health metrics as regards data management and
analyses for decision-making.
The lesser quality of immunization coverage in Northern as compared to Southern
Nigeria calls for the enactment of policies aimed at incentivizing northern caregivers to
vaccinate their wards. Policies that make vaccination of the under-fives, a prerequisite for
enrollment into schools should be considered.
Health care delivery and practice
Public health leaders should collaborate with other stakeholders of health particularly
those involved in health statistics to ensure the proper linkage of data from the both
private and public health domains, required to provide quality data for informed decision
making and planning towards UEHC.
Stakeholders of health should collaborate with local partners and international partners to
improve M & E systems in the country.
Research and evaluation
Further studies with larger sample size are required to draw better conclusions of the true
relationship on the supply-side and to validate or invalidate if there is a significant
difference in the effectiveness coverage on SBANC and ANC interventions in the north

24
compared to the south. This is necessary to identify priority areas that need focusing on,
to facilitate UEHC progress.
Rigorous evaluation of the demand side proxy-indicators for SBANC and IMCI
intervention should be considered to provide more empirical clarity on the instrument
capability to perform true bottleneck analysis as well as improve the accurracy of the
instrument.
Limitations
There are limitations regarding internal and external validity in this study. The most notable is
the use of dataset that may not be representative of all LGAs in Nigeria thus limiting the extent
to which findings can be generalized to the different LGAs in the nation. Furthermore, because of
data integrity concerns and limited sample size, one must exercise caution when interpreting the
results of this study. Notwithstanding these limitations, this study yielded valuable findings by
offering insights on the applicability of the NBNA instrument to assess intervention quality and
predict UEHC for planning in Nigeria. This study could also contribute to the current body of
knowledge, to improve health systems performance in Nigeria.
Conclusion
This study drew on the modified Tanahashi model and data collected with the NBNA instrument
to assess its validity that is crucial to strengthening of primary health care and planning for
UEHC in Nigeria. The lack of diminishing relationships – a prerequisite for bottleneck analysis,
from majority of PHC data may impede proper UHEC planning to mitigate health disparities
between LGAs and regions (north & south) in the country. Likewise, the poor quality in routine
immunization coverage in the north as compared to the south identified in this study as with
existing scholarly articles, remain a significant barrier to the nation’s progress towards UEHC.

25
Stakeholders of health should prioritize proper linkages of public and private health sector data
for better measurement of outcomes. Future research efforts should explore the results of this
study with a sample size that is more representative of PHCs in Nigeria to yield further empirical
clarity on the applicability of the Nigeria bottleneck analysis instrument as a tool for bridging
health disparities within the country.

26
REFERENCES
Adedini, S. A., Odimegwu, C., Bamiwuye, O., Fadeyibi, O., & De Wet, N. (2014). Barriers to
accessing health care in Nigeria: implications for child survival. Glob Health Action, 7,
23499. doi:10.3402/gha.v7.23499
Baker, U., Okuga, M., Waiswa, P., Manzi, F., Peterson, S., & Hanson, C. (2015). Bottlenecks in
the implementation of essential screening tests in antenatal care: Syphilis, HIV, and
anemia testing in rural Tanzania and Uganda. International Journal of Gynecology &
Obstetrics, 130, S43-S50. doi:https://doi.org/10.1016/j.ijgo.2015.04.017
Bitton, A., Ratcliffe, H. L., Veillard, J. H., Kress, D. H., Barkley, S., Kimball, M., . . .
Hirschhorn, L. R. (2017). Primary Health Care as a Foundation for Strengthening Health
Systems in Low- and Middle-Income Countries. Journal of General Internal Medicine,
32(5), 566-571. doi:10.1007/s11606-016-3898-5
Boerma, T., AbouZahr, C., Evans, D., & Evans, T. (2014). Monitoring Intervention Coverage in
the Context of Universal Health Coverage. PLOS Medicine, 11(9), e1001728.
doi:10.1371/journal.pmed.1001728
Chopra, M., Sharkey, A., Dalmiya, N., Anthony, D., & Binkin, N. (2012). Strategies to improve
health coverage and narrow the equity gap in child survival, health, and nutrition. Lancet,
380(9850), 1331-1340. doi:10.1016/s0140-6736(12)61423-8
Douthit, N., Kiv, S., Dwolatzky, T., & Biswas, S. (2015). Exposing some important barriers to
health care access in the rural USA. Public Health, 129(6), 611-620.
doi:https://doi.org/10.1016/j.puhe.2015.04.001

27
Eboreime, E., Bozzani, F., & Abimbola, S. (2015). Access to Routine Immunization: A
Comparative Analysis of Supply-Side Disparities between Northern and Southern
Nigeria. PLoS One, 10(12).
ECOSOC, U. (2017). Report of the Secretary-General: Progress towards the Sustainable
Development Goals. Retrieved from
Godwin, M., Pike, A., Bethune, C., Kirby, A., & Pike, A. (2013). Concurrent and convergent
validity of the simple lifestyle indicator questionnaire. ISRN Family Med, 2013, 529645.
doi:10.5402/2013/529645
Guerrero-Núñez, S., Valenzuela-Suazo, S., & Cid-Henríquez, P. (2017). Effective Universal
Coverage of Diabetes Mellitus Type 2 in Chile. Revista Latino-Americana de
Enfermagem, 25, e2871. doi:10.1590/1518-8345.1630.2871
Hahn, D., Wanjala, P., & Marx, M. (2013). Where is information quality lost at clinical level? A
mixed-method study on information systems and data quality in three urban Kenyan
ANC clinics. Global Health Action, 6(1), 21424. doi:10.3402/gha.v6i0.21424
Hair, J. F., Ringle, C. M., & Sarstedt, M. . (2011). PLS-SEM: INDEED A SILVER BULLET.
Journal of marketing theory and practice, 19(2), 139-151.
Hayes, H., Parchman, M. L., & Howard, R. (2011). A logic model framework for evaluation and
planning in a primary care practice-based research network (PBRN). Journal of the
American Board of Family Medicine, 24(5), 576-582. doi:10.3122/jabfm.2011.05.110043

28
Ibrahim, A., & Zalkuwi, J. (2014). Women's Empowerment in North-Eastern Nigeria and
Factors Affecting It (Vol. 3).
Ishaku, H., Majid, M., Peters, & Ali Haruna, A. A. (2011). WATER SUPPLY DILEMMA IN
NIGERIAN RURAL COMMUNITIESS: LOOKING TOWARDS THE SKY FOR AN
ANSWER.
Jegede, A. S. (2007). What Led to the Nigerian Boycott of the Polio Vaccination Campaign?
PLOS Medicine, 4(3), e73. doi:10.1371/journal.pmed.0040073
Kiwanuka Henriksson, D., Fredriksson, M., Waiswa, P., Selling, K., & Swartling Peterson, S.
(2017). Bottleneck analysis at district level to illustrate gaps within the district health
system in Uganda. Global Health Action, 10(1), 1327256.
doi:10.1080/16549716.2017.1327256
Leslie, H. H., Malata, A., Ndiaye, Y., & Kruk, M. E. (2017). Effective coverage of primary care
services in eight high-mortality countries. BMJ Global Health, 2(3). doi:10.1136/bmjgh-
2017-000424
Macinko, J., Starfield, B., & Erinosho, T. (2009). The impact of primary healthcare on
population health in low- and middle-income countries. J Ambul Care Manage, 32(2),
150-171. doi:10.1097/JAC.0b013e3181994221
Makinde, O. A., Azeez, A., Bamidele, S., Oyemakinde, A., Oyediran, K. A., Adebayo, W., . . .
Mullen, S. (2014). Development of a Master Health Facility List in Nigeria. Online
Journal of Public Health Informatics, 6(2), e184. doi:10.5210/ojphi.v6i2.5287

29
Nasiru, S.-G., Aliyu, G. G., Gasasira, A., Aliyu, M. H., Zubair, M., Mandawari, S. U., . . . El-
Kamary, S. S. (2012). Breaking community barriers to polio vaccination in northern
Nigeria: the impact of a grass roots mobilization campaign (Majigi). Pathogens and
Global Health, 106(3), 166-171. doi:10.1179/2047773212Y.0000000018
Ng, M., Fullman, N., Dieleman, J. L., Flaxman, A. D., Murray, C. J. L., & Lim, S. S. (2014).
Effective Coverage: A Metric for Monitoring Universal Health Coverage. PLOS
Medicine, 11(9), e1001730. doi:10.1371/journal.pmed.1001730
NPHCDA. (2009). The National Strategic Health Development Plan Framework (2009-2015).
Retrieved from
https://www.uhc2030.org/fileadmin/uploads/ihp/Documents/Country_Pages/Nigeria/Nige
ria%20National%20Strategic%20Health%20Development%20Plan%20Framework%202
009-2015.pdf
O’Connell, T., & Sharkey, A. (2013). Reaching Universal Health Coverage through District
Health System Strengthening: Using a modified Tanahashi model sub-nationally to attain
equitable and effective coverage. New York: United Nations Children’s Fund (UNICEF),
New York, 2013 Retrieved from
https://www.unicef.org/health/files/DHSS_to_reach_UHC_121013.pdf.
Oku, A., Oyo-Ita, A., Glenton, C., Fretheim, A., Eteng, G., Ames, H., . . . Lewin, S. (2017).
Factors affecting the implementation of childhood vaccination communication strategies
in Nigeria: a qualitative study. BMC Public Health, 17(1), 200. doi:10.1186/s12889-017-
4020-6

30
Ophori, E. A., Tula, M. Y., Azih, A. V., Okojie, R., & Ikpo, P. E. (2014). Current trends of
immunization in Nigeria: prospect and challenges. Trop Med Health, 42(2), 67-75.
doi:10.2149/tmh.2013-13
Oyekale, A. S. (2017). Assessment of primary health care facilities’ service readiness in Nigeria.
BMC Health Services Research, 17(1), 172. doi:10.1186/s12913-017-2112-8
Reeve, C., Humphreys, J., & Wakerman, J. (2015). A comprehensive health service evaluation
and monitoring framework. Evaluation and Program Planning, 53, 91-98.
doi:https://doi.org/10.1016/j.evalprogplan.2015.08.006
Rupani, M. P., Gaonkar, N. T., & Bhatt, G. S. (2016). Bottleneck analysis and strategic planning
using Tanahashi model for childhood diarrhea management in Gujarat, Western India.
Eval Program Plann, 58, 82-87. doi:10.1016/j.evalprogplan.2016.05.017
Tanahashi, T. (1978). Health service coverage and its evaluation. Bull World Health Organ,
56(2), 295-303.
Weinhold, I., & Gurtner, S. (2014). Understanding shortages of sufficient health care in rural
areas. Health Policy, 118(2), 201-214.
doi:https://doi.org/10.1016/j.healthpol.2014.07.018
WHO. (2015). Countries: Nigeria. Retrieved from http://www.who.int/countries/nga/en/
WHO, & World-Bank. (2015). Tracking universal health coverage: First global monitoring
report. 98.

31
Wong, S. T., Yin, D., Bhattacharyya, O., Wang, B., Liu, L., & Chen, B. (2010). Developing a
performance measurement framework and indicators for community health service
facilities in urban China. BMC Fam Pract, 11, 91. doi:10.1186/1471-2296-11-91
Yawson, A. E., Awoonor-Williams, J. K., Sagoe-Moses, I., Aboagye, P. K., Yawson, A. O.,
Senaya, L. K., . . . Banskota, H. K. (2016). Bottleneck analysis approach to accelerate
newborn care services in two regions in Ghana: implications for national newborn care.
Public Health, 141, 245-254. doi:10.1016/j.puhe.2016.09.026
32
APPENDICES
Table A: Adapted Coverage Indicators for Routine Immunization
DETERMINANTS INDICATORS MEASURES DATA
SOURCE
Commodity Percentage of Health Facilities
(HFs) without stock out of OPV
or Pentavalent vaccine in the
reporting period
Numerator: Number of HFs without
stock out of OPV or Pentavalent
vaccine
Denominator: Number of HFs that
provide immunization services
HMIS
Human Resources Percentage of HFs with at least
two trained vaccinators
Numerator: Number of HFs with at
least two trained vaccinators
Denominator: Number of HFs that
provide immunization services
HMIS,
Integrated
health care
services
HMIS
Geographical
Access
Percentage of population living
within 5 km radius from
immunization service points (HFs
and outreach locations)
Numerator: Population living within
5 km radius from immunization
service points (HFs and outreach
locations)1
Denominator: Total population living
in the LGA
LGA record
based on Maps
NPopC or
IPDs Micro-
plans
Utilization Percentage of children aged 0-11
months that received Penta1 or
OPV1
Numerator: Number of children aged
0-11 months who received Penta1 or
OPV1 vaccination
Denominator: Number of children
aged 0-11 months
HMIS
NPopC or
IPDs Micro-
plans
Continuity Percentage of children aged 0-11
months that received Penta3 or
OPV3
Numerator: Number of children aged
0-11 months who received Penta3 or
OPV3 vaccination
Denominator: Number of children
aged 0-11 months
HMIS
NPopC or
IPDs Micro-
plans
Quality Percentage of children fully
immunized (BCG, OPV3, Penta3
and measles) before their first
birthday
Numerator: Number of children who
received all vaccines (BCG, OPV3,
Penta3 and measles) before their first
birthday within reporting period
Denominator: Number of children 0-
11 months
HMIS
NPopC or
IPDs Micro-
plans 1 to identify the population living within a radius of 5 km from a service delivery point, first identify the number of
facilities that provide the service and for each of these facilities determine the population living within the 5 km
radius.

33
Table B: Adapted Coverage Indicators for Integrated Management of Childhood Illnesses
DETERMINANTS INDICATORS MEASURES DATA
SOURCE
Commodity Percentage of HFs without stock
out of ACTs in the reporting
period
Numerator: Number of HFs without
stock out of ACTs in the reporting
period.
Denominator: Number of HFs that
provide IMCI services
HMIS
HMIS
Human Resources Percentage of health workers
trained in the management of
childhood illnesses
Numerator: Number of health workers
trained in the management of malaria
Denominator: Number of health
workers that provide IMCI services
Program
Integrated
Health Care
Services
HMIS
Geographical
Access
Percentage of population living
within 5 km radius of HFs
offering services for management
of childhood illnesses
Numerator: Population living within 5
km radius from HFs that provide
management of childhood illnesses1
Denominator: Total population living
in the LGA
LGA record
based on
Maps
NPopC or
IPDs Micro-
plans
Utilization Percentage of children under the
age of 5 years having fever and
using HF services for the
management of childhood
illnesses
Numerator: Number of children under
the age of 5 years having fever who
present at a HF that offers services for
the management of malaria
Denominator: Number of expected
cases of malaria among children under
the age of 5 years within the catchment
area
HMIS
To be
calculated
Continuity Percentage of children under the
age of 5 years having fever and
that were treated with ACT
Numerator: Number of children under
the age of 5 years having fever and
who were treated with ACT
Denominator: Number of expected
cases of malaria among children under
the age of 5 years within the catchment
area
HMIS
To be
calculated
Quality Percentage of children under the
age of 5 years having fever, that
were tested with RDT and treated
with ACT
Numerator: Number of children under
the age of 5 years who tested positive
to RDT and who were treated with
ACTs
Denominator: Number of expected
cases of malaria among children under
the age of 5 years within the catchment
area
Program
HMIS
To be
calculated
1to identify the population living within a radius of 5 km from a service delivery point, first identify the number of
facilities that provide the service and for each of these facilities determine the population living within the 5 km.

34
Table C: Adapted Coverage Indicators for Antenatal Care (ANC)
DETERMINANTS INDICATORS MEASURES DATA
SOURCE
Commodity Percentage of HF offering ANC
services without stock-out of Iron-
Folate Supplements in the
reporting period
Numerator: Number of HFs
providing ANC services without
stock out of Iron Folate in the
reporting period
Denominator: Number of HFs
providing ANC services
HMIS
HMIS
Human Resources Percentage of ANC service
providers who have been trained
in Focused Antenatal Care
Numerator: Number of ANC
service providers who have been
trained in Focused Ante-natal
Care
Denominator: Number of ANC
service providers
LGA record,
HMIS, Integrated
Health Care
Services
LGA Record
Geographical
Access
Percentage of population living
within 5 km radius of HFs
offering ANC
Numerator: Population living
within 5 km radius from HFs
offering ANC1
Denominator: Total population
living in the LGA
LGA record
based on Maps
NPopC or IPDs
Micro plans
Utilization Percentage of pregnant women
attending at least one ANC service
Numerator: Number of pregnant
women who attended ANC
services for the first time during
the reporting period
Denominator: Estimated number
of pregnant women in the
catchment area during the
reporting period
HMIS (2 infos
available: < 20 and
>20 weeks)
NPopC or IPDs
Microplans
Continuity Percentage of pregnant women
who attended 4 ANC visits
Numerator: Number of pregnant
women who completed the fourth
ANC visit during the reporting
period
Denominator: Estimated number
of pregnant women in the
catchment area during the
reporting period
HMIS
NPopC or IPDs
Microplans
Quality Percentage of pregnant women
who had 4 ANC in a timely
manner in accordance with
Focused ANC guidelines
Numerator: Number of pregnant
women who received IPT2 at
ANC clinic during the reporting
period
Denominator: Estimated number
of pregnant women in the
catchment area during the
reporting period
HMIS
NPopC or IPDs
Microplans
1 to identify the population living within a radius of 5 km from a service delivery point, first identify the number of
facilities that provide the service and for each of these facilities determine the population living within the 5 km.
35
Table D: Adapted Coverage Indicators for Skilled Birth Attendance & Neonatal Care
DETERMINANTS INDICATORS MEASURES DATA SOURCE
Commodity Percentage of HFs offering
delivery services experiencing no
stock out of delivery kits in the
reporting period
Numerator: Number of HFs
offering delivery services without
stock-out of delivery kits during
the reporting period
Denominator: Number of HFs
offering delivery services
Program (MSS or
Reproductive
Health)
HMIS
Human Resources Percentage of maternity staff
trained in Basic Emergency
Obstetric Care
Numerator: Number of maternity
staff trained in Basic Emergency
Obstetric Care
Denominator: Number of
maternity staff
Program (MSS or
Reproductive
Health)
Geographical
Access
Percentage of population living
within 5 km radius of HFs
offering basic delivery services
Numerator: Population living
within 5 km radius from HFs
offering basic delivery services1
Denominator: Total population
living in the LGA
LGA record
based on Maps
NPopC or IPDs
Micro plans
Utilization Percentage of deliveries in HFs Numerator: Number of deliveries
in the HFs
Denominator: Total number of
expected deliveries
HMIS
NPopC or IPDs
Micro plans
Continuity Percentage of mother/infant pairs
who received at least one follow
up home visit within the first
month after delivery
Numerator: Number of
mother/infant pairs who received
at least one follow up home visit
within the first month after
delivery
Denominator: Total number of
expected deliveries
Program(MSS or
Reproductive
Health)
NPopC or IPDs
Micro plans
Quality Percentage of deliveries receiving
postnatal check-up within 48
hours at HFs
Numerator: Number of women
receiving postnatal check-up at
HFs within 48 hours after
delivery
Denominator: Total number of
expected deliveries
Program(MSS or
Reproductive
Health)
NPopC or IPDs
Micro plans
1 to identify the population living within a radius of 5 km from a service delivery point, first identify the number of
facilities that provide the service and for each of these facilities determine the population living within the 5 km.

36
Table E: Correlation Matrices
Notes * p < .05, ** p < .01, *** p < .001
Intervention
(1)
Commodity
(2)
Human
Resources
(3)
Geographical
Access
(4)
Utilization
(5)
Continuity
(6)
Quality
RI
(2) 0.1372 1.0000
(3) -0.0857 -0.0514 1.0000
(4) 0.1431 0.0456 0.0375 1.0000
(5) 0.1801 0.0848 0.1649 0.9089*** 1.0000
(6) -0.0560 0.0602 0.0880 0.6748*** 0.7266*** 1.0000
IMCI
(2) 0.1502 1.0000
(3) -0.1142 -0.0881 1.0000
(4) 0.0280 0.1697 -0.0592 1.0000
(5) 0.2283* 0.1399 -0.0940 0.7666*** 1.0000
(6) 0.1715 0.1914* -0.0383 0.4676*** 0.7487*** 1.0000
ANC
(2) 0.2665** 1.0000
(3) 0.0758 -0.0438 1.0000
(4) 0.2132* 0.1823 0.2296* 1.0000
(5) 0.1811 0.2179* 0.0926 0.6501*** 1.0000
(6) 0.2027* 0.2829** 0.1431 0.5978*** 0.6398*** 1.0000
SBANC
(2) 0.3009** 1.0000
(3) -0.1723 0.1271 1.0000
(4) 0.1094 0.3153*** 0.1650 1.0000
(5) 0.0902 0.4434* 0.0934 0.6297*** 1.0000
(6) 0.0884 0.3078*** 0.1328 0.7046*** 0.7764*** 1.0000

37
Table F: Ordinary Least Squares Models
A. RI
Number of observations = 100
F (5, 94) = 25.28
R-squared = 0.5735
Adjusted R-squared = 0.5508
Root MSE = 17.16
Prob > F = 0.0000
Source | SS df MS
_________________________________________
Model | 37225.1943 5 7445.03886
Residual | 27680.1157 94 294.469316
__________________________________________
Total | 64905.31 99 655.609192
_________________________________________
______________________________________________________________________________
IMQ | Coefficient Std. Err. t P>|t| [95% Conf. Interval]
______________________________________________________________________________
RIC | -0.1585036 0.0794356 -2.00 0.049 -0.3162248 -0.0007824
RIH | 0.0403704 0.0642187 0.63 0.531 -0.0871374 0.1678782
RIG | 0.0541388 0.0606468 0.89 0.374 -0.0662768 0.1745544
RIU | 0.603572 .0733818 8.23 0.000 0.4578707 0.7492732
1. North | -15.63863 3.732956 -4.19 0.000 -23.0505 -8.226754
_cons | 29.47848 9.849336 2.99 0.004 9.922392 49.03457
______________________________________________________________________________
VIF estimate
__________________________________
Variable | VIF 1/VIF
__________________________________
RIC | 1.05 0.949674
RIH | 1.02 0.983381
RIG | 1.01 0.988204 RIU | 1.17 0.857408 1. North | 1.14 0.880487 ___________________________________
Mean VIF | 1.08

38
B. IMCI
Number of observations = 107
F (5, 101) = 6.97
Prob > F = 0.0000
R-squared = 0.2566
Adjusted R-squared = 0.2198
Root MSE = 12.775
Source | SS df MS
___________________________________________
Model | 5690.63137 5 1138.12627
Residual | 16483.2752 101 163.200744
___________________________________________
Total | 22173.9065 106 209.187798
___________________________________________
_____________________________________________________________________________
IMCIQ| Coefficient Std. Err. t P>|t| [95% Conf. Interval]
_____________________________________________________________________________
IMCIC | 0.068331 0.0376375 1.82 0.072 -0.0063318 0.1429937
IMCIH | 0.0446089 0.0448066 1.00 0.322 -0.0442753 0.133493
IMCIG | 0.0030047 0.0484277 0.06 0.951 -0.093063 0.0990723
IMCIU | 0.2971236 0.0573831 5.18 0.000 0.183291 0.4109562
1. North | 2.069711 2.67942 0.77 0.442 -3.245538 7.38496
_cons | -5.407194 4.448918 -1.22 0.227 -14.23265 3.418263
_____________________________________________________________________________
VIF estimate
____________________________________
Variable | VIF 1/VIF
__________________________________
IMCIC | 1.10 0.908443
IMCIH | 1.07 0.938081
IMCIG | 1.03 0.966578
IMCIU | 1.03 0.966377
1. North | 1.09 0.917172
__________________________________
Mean VIF | 1.07

39
C. ANC
Number of observations = 117
F (5, 111) = 13.81
Prob > F = 0.0000
R-squared = 0.3835
Adjusted R-squared = 0.3557
Root MSE = 17.083
Source | SS df MS
________________________________________________
Model | 20150.431 5 4030.0862
Residual | 32394.3382 111 291.840885
________________________________________________
Total | 52544.7692 116 452.972149
_______________________________________________
ANCQ | Coefficient. Std. Err. t P>|t| [95% Conf. Interval]
______________________________________________________________________________
ANCC | 0.0459878 0.0710015 0.65 0.519 -.0947064 .186682
ANCH | 0.1304089 0.0750204 1.74 0.085 -.018249 .2790668
ANCG | 0.0068157 0.0680772 0.10 0.920 -.1280838 .1417153
ANCU | .4584046 0.066476 6.90 0.000 .326678 .5901313
1. North | -3.201592 3.582647 -0.89 0.373 -10.30085 3.897663
_cons | -2.083101 6.616274 -0.31 0.753 -15.19369 11.02749
______________________________________________________________________________
VIF estimate
__________________________________
Variable | VIF 1/VIF
__________________________________
ANCC | 1.11 0.903565
ANCH | 1.10 0.908733
ANCG | 1.14 0.877463
ANCU | 1.29 0.776851
1. North | 1.18 0.844527
___________________________________
Mean VIF | 1.16
40
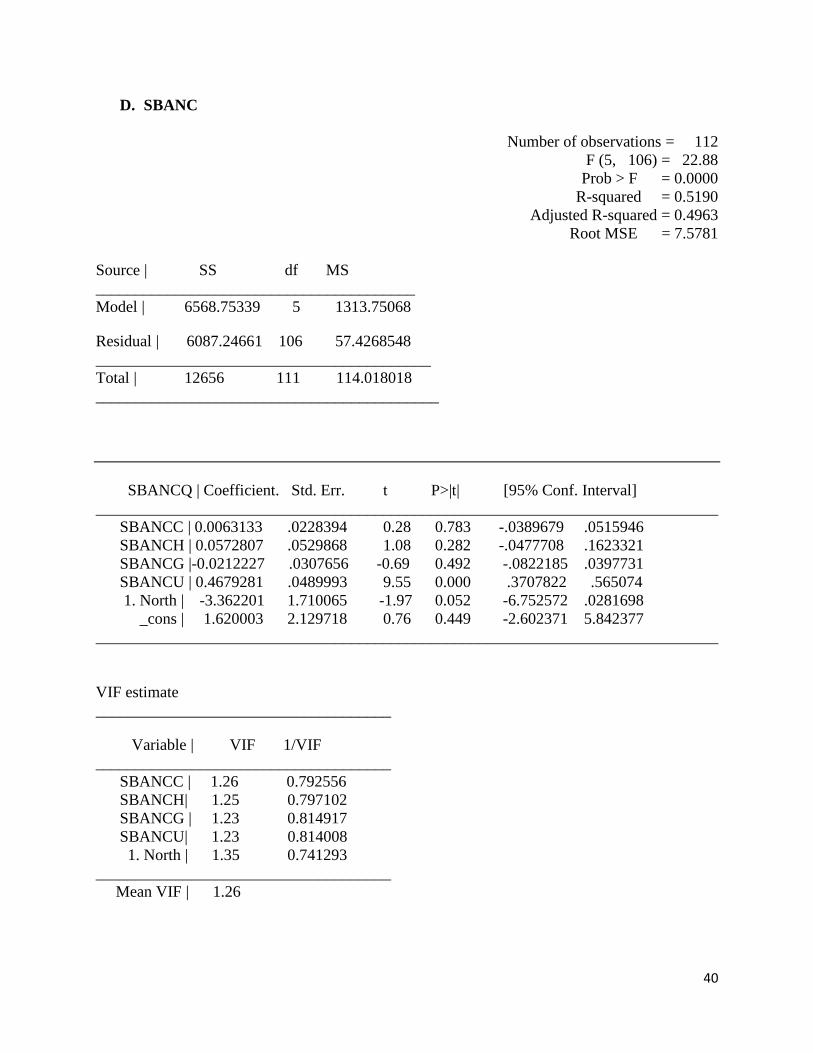
D. SBANC
Number of observations = 112
F (5, 106) = 22.88
Prob > F = 0.0000
R-squared = 0.5190
Adjusted R-squared = 0.4963
Root MSE = 7.5781
Source | SS df MS
________________________________________
Model | 6568.75339 5 1313.75068
Residual | 6087.24661 106 57.4268548
__________________________________________
Total | 12656 111 114.018018
___________________________________________
SBANCQ | Coefficient. Std. Err. t P>|t| [95% Conf. Interval]
______________________________________________________________________________
SBANCC | 0.0063133 .0228394 0.28 0.783 -.0389679 .0515946
SBANCH | 0.0572807 .0529868 1.08 0.282 -.0477708 .1623321
SBANCG |-0.0212227 .0307656 -0.69 0.492 -.0822185 .0397731
SBANCU | 0.4679281 .0489993 9.55 0.000 .3707822 .565074
1. North | -3.362201 1.710065 -1.97 0.052 -6.752572 .0281698
_cons | 1.620003 2.129718 0.76 0.449 -2.602371 5.842377
______________________________________________________________________________
VIF estimate
_____________________________________
Variable | VIF 1/VIF
_____________________________________
SBANCC | 1.26 0.792556
SBANCH| 1.25 0.797102
SBANCG | 1.23 0.814917
SBANCU| 1.23 0.814008
1. North | 1.35 0.741293
_____________________________________
Mean VIF | 1.26