utilizing genome-scale models to optimize nutrient supply
TRANSCRIPT

ARTICLE OPEN
Utilizing genome-scale models to optimize nutrient supply
for sustained algal growth and lipid productivityChien-Ting Li1, Jacob Yelsky 1, Yiqun Chen 1, Cristal Zuñiga 2,3, Richard Eng1, Liqun Jiang1,4, Alison Shapiro 1, Kai-Wen Huang 1,
Karsten Zengler2,3,5 and Michael J. Betenbaugh1*
Nutrient availability is critical for growth of algae and other microbes used for generating valuable biochemical products.Determining the optimal levels of nutrient supplies to cultures can eliminate feeding of excess nutrients, lowering production costsand reducing nutrient pollution into the environment. With the advent of omics and bioinformatics methods, it is now possible toconstruct genome-scale models that accurately describe the metabolism of microorganisms. In this study, a genome-scale model ofthe green alga Chlorella vulgaris (iCZ946) was applied to predict feeding of multiple nutrients, including nitrate and glucose, underboth autotrophic and heterotrophic conditions. The objective function was changed from optimizing growth to instead minimizingnitrate and glucose uptake rates, enabling predictions of feed rates for these nutrients. The metabolic model control (MMC)algorithm was validated for autotrophic growth, saving 18% nitrate while sustaining algal growth. Additionally, we obtained similargrowth profiles by simultaneously controlling glucose and nitrate supplies under heterotrophic conditions for both high and lowlevels of glucose and nitrate. Finally, the nitrate supply was controlled in order to retain protein and chlorophyll synthesis, albeit at alower rate, under nitrogen-limiting conditions. This model-driven cultivation strategy doubled the total volumetric yield of biomass,increased fatty acid methyl ester (FAME) yield by 61%, and enhanced lutein yield nearly 3 fold compared to nitrogen starvation. Thisstudy introduces a control methodology that integrates omics data and genome-scale models in order to optimize nutrientsupplies based on the metabolic state of algal cells in different nutrient environments. This approach could transform bioprocessingcontrol into a systems biology-based paradigm suitable for a wide range of species in order to limit nutrient inputs, reduceprocessing costs, and optimize biomanufacturing for the next generation of desirable biotechnology products.
npj Systems Biology and Applications ��������� ; https://doi.org/10.1038/s41540-019-0110-7
INTRODUCTION
Microalgae offer significant opportunities to generate diverseproducts across many different areas including health productslike lutein,1 pharmaceutical products like camelid heavy chain onlyantibodies (VHH),
2 and energy precursors for biodiesel.3 Due to itshigh growth rate and high lipid content, Chlorella vulgaris hasbeen recognized as a promising candidate for algal biofuelproduction.4 Furthermore, studies have found higher lipidproductivity in C. vulgaris under heterotrophic growth conditionsor nitrogen starvation.4,5 However, the cost of inputs including thesource of nitrogen, often in the form of nitrate, as well as theorganic carbon source, typically glucose in heterotrophic condi-tion, can have a significant impact on overall productions costs.6 Inaddition, the reduction of growth rate under nitrogen starvationcan represent another bottleneck due to the loss of algal biomass.One approach to overcome these limitations is to optimize the
natural cells growth and lipid production by controlling nutrientfeeding. For example, one approach is to control glucoseconcentration within a defined range during algal culture usingmeasurements and simple feedback control algorithms. Previousstudies controlled glucose concentration in the range of 5 to 40 g/L to reach a high cell density culture, increasing cell density from6.25 to 117.18 gDW/L in 32 h.7
In order to more effectively control nonlinear biologicalprocesses like cell culture, model predictive control (MPC), a
model-based control strategy, has been designed as one approachto achieve more finely tuned bioreactor control.8 Mathematicalequations can be constructed to represent the bioreactor systemand nutrient supplies optimized based on the simulations. Thisstrategy has been validated in silico for penicillin fermentationprocess, biohydrogen production in Cyanothece sp, and biofuelproduction in algae.9–11 It was also tested in Chlorella in a CSTRsystem for CO2 mitigation and in an open pond system underdifferent light intensities.12,13 These MPC approaches typicallyincorporate empirical kinetic models based on experimental datain order to predict optimal algal growth conditions. Researchersobtain model parameters from experimental measurements of cellgrowth rate and nutrient consumption rate and constructequations in order to simulate algal growth in the models. Thoseparameters are often associated with the bioreactor systemincluding volume and dilution rate or reflect external character-istics of the cell including growth rate.However, these previous efforts typically lack a detailed
description of the metabolic characteristics of the algal cellsthemselves and therefore cannot account for nutrient require-ments and accompanying cell compositions. These models, whilehighly descriptive of growth at the macroscopic level, typically donot include the mathematical framework to describe exactly howspecific nutrients such as nitrate and glucose are incorporatedwithin the cellular metabolic framework under different cultureconditions. Incorporating cellular metabolic details can enable
1Department of Chemical and Biomolecular Engineering, Johns Hopkins University, 3400 North Charles Street, Baltimore, MD 21218, USA. 2Department of Pediatrics, University ofCalifornia, San Diego, 9500 Gilman Drive, La Jolla, CA 92093-0760, USA. 3Department of Bioengineering, University of California, San Diego, 9500 Gilman Drive, La Jolla, CA 92093-0412, USA. 4School of Environmental Science and Engineering, Shandong University, No.27 Shanda Nan Road, Jinan 250100, China. 5Center for Microbiome Innovation, Universityof California, San Diego, 9500 Gilman Drive, La Jolla, CA 92093-0436, USA *email: [email protected]
www.nature.com/npjsba
Published in partnership with the Systems Biology Institute
1234567890():,;

biotechnologies to more effectively understand and potentiallyoptimize the utilization of nutrients within algal cells duringgrowth and lipid production, and be able to consider changes inalgal metabolism for different nutrient input scenarios.Fortunately, the advent of genome-scale models has enabled
the biotechnology community to better understand the allocationand distribution of nutrients to metabolites and biomass.14
Genome-scale metabolic models are a system biology tool thatrepresent the metabolism of a cell based on its genomicsequence. In order to reconstruct biological networks into agenome-scale model, metabolic reactions in the form of massbalance equations that integrate nutrient transport, intracellularmetabolism, and biomass accumulation are included.15 Modelconstraints are obtained by considering genomics, transcrip-tomics, proteomics as well as cellular composition information.16
Thousands of metabolic reactions are composed as a largestoichiometric matrix (m x n); followed by flux balance analysisrequired that is solved in order to identify the flux rates of eachreaction. Furthermore, as the model is typically underdetermined,linear programming is incorporated in order to identify an optimalflux solution by maximizing an objective function, typically thebiomass production rate.17
Genome-scale models have been constructed for a wide varietyof industrial relevant species including E. coli,18 yeast19 andmammalian cells.20 Indeed, previous research has appliedgenome-scale models to a variety of applications includingmicrobial strain optimization,21 intracellular metabolite poolprediction,16 and the discovery of new metabolic reactions.22
Recently, our group constructed a genome-scale model for C.vulgaris (iCZ843), which provides the most comprehensiverepresentation of the physiology of this organism to date,including 843 genes, 2,294 reactions, and 1,770 metabolites.23
This model contains five cellular compartments including thecytoplasm, mitochondrion, chloroplast, thylakoid and glyoxysome,in addition to the extracellular environment, allowing metabolicexchange within and between the different compartments. Inaddition, corresponding experiments successfully validated modelpredictions, including the capacity to vary the growth rate of C.vulgaris by altering nutrient inputs. Furthermore, the iCZ843model was used to contextualize metabolomics data over thecourse of growth, evaluating dynamic changes in the biomasscomposition under different nutrient conditions, resulting in anupdated model of C. vulgaris model (iCZ946).16
In genome-scale model studies, biomass production is typicallyset as the objective function in order to drive the optimization inthe model and predict cell growth rates.17 However, for ourmetabolic model control (MMC) applications, the primary objec-tive may be the capacity to control nutrient utilizations in order tocontrol inputs that can then be provided based on modelpredictions. In the current study, growth of C. vulgaris wasestimated based on experimental optical density (OD) measure-ments and then used to predict subsequent growth rates duringthe exponential phase. Since the primary objective of this studywas to optimize the nutrient supply for algal culture, the objectivefunction was instead changed to optimize nutrient flux input,including nitrate or glucose uptake into algal cells. We thenapplied the genome-scale model in order to improve predictionsof the nutrients required for growth in response to differentculture conditions. As a result, we demonstrate the capacity toutilize the metabolic model control in order to more effectivelyand efficiently optimize bioprocessing for the generation of highlevels of algal biomass and biofuel precursors for potentialapplications in biotechnology. More importantly, this frameworkdemonstrates a new avenue for applying genome-scale models asa way to optimize bioprocessing across a wide range of cell linesand potential applications in biotechnology.
RESULTS
Controlling nitrate addition under autotrophic condition foroptimized growth rates
In order to evaluate the MMC approach, model iCZ946-PAT1 wasused to control nitrate supply to autotrophic C. vulgaris cultures.Model iCZ946-PAT1 was previously constructed based on thebiomass composition obtained under phototrophic and nitrogensufficient conditions (Fig. S1 and Table S1). In the currentapproach, the growth rate (μ) was calculated based on the opticaldensity value (OD750) taken from experimental data at a previoustime point (ODt-1) and the current time point (ODt). Then, thegrowth rate within the model was constrained to the calculatedgrowth value (μ) and the objective function was changed to thenitrate uptake rate (FN). Specifically, the model was optimized tocalculate the minimum nitrate amount required to sustain thiscalculated growth rate over a particular time interval (Fig. 1a).One uncontrolled C. vulgaris culture was cultured with 250mg/L
nitrate, while three others were cultured with 25 mg/L nitrate andfed with 80%, 100 and 120% of the optimal nitrate requirementbased on model predictions after 25mg/L nitrate was consumedcompletely in the medium. For example, if the genome-scalemodel predicted C. vulgaris cultures need 100 mg/L nitrate tosustain the growth for the next 24 h, we would add 80mg/L,100mg/L, and 120mg/L to MMC-80%, MMC-100%, and MMC-120% cultures respectively. Based on the culture volume, a specificamount of nitrate was fed to the culture to reach theconcentration predicted by the model. All cultures were bubbledwith 5% CO2 in order to make excess carbon source available inculture and therefore make nitrate the main variable affecting thegrowth rate. The controlled cultures fed with nitrate at 25mg/Lconsumed all the nitrogen source by 46 h. Genome-scalemetabolic model control was then applied to calculate thesubsequent nitrate supply needed at 46, 70, 94, 118, 142, 150, and166 h (see arrows) (Fig. 1a, b). Eventually, the uncontrolledC. vulgaris cultures consumed all 250 mg/L nitrate by 182 h andthe model predictive feeding was stopped after that time point.Measured nitrate concentration was nearly 0 mg/L in the mediumat all the time points after 46 h for all MMC conditions, indicatingthat the total nitrate supplied to the medium was transported orconsumed completely into the cell.Nitrate was added to all the three MMC cultures at 46, 70, 94,
118, 142, 150, and 166 h to reach a total amount available of170mg/L, 220mg/L, and 250mg/L over the entire duration for the80%, 100%, and 120% MMC conditions, respectively (Fig. 1C). Eventhough significantly <250 mg/L nitrate was fed to the 80% and100% MMC cultures (P ≤ 0.05), growth rates comparable to thebulk-fed group were achieved in the 100% MMC cultures (Fig. 1d).All four cultures reached OD750= 2.2 in 182 h, after which algaeentered a nitrogen starvation stage when the MMC feeding wasstopped. As displayed by the 120% MMC condition, even thoughcells took up all of the nitrate supplied to the medium, feeding anamount of nitrate higher than predicted by the genome-scalemodel did not benefit algal growth in nitrogen replete or nitrogendepleted conditions (Fig. 1d). This result was further supported bythe growth rate obtained for the bulk-fed 250mg/L, which wassimilar to that obtained for 100% MMC culture. Even though thebulk-fed and the MMC 120% group consumed 22% and 14.5%more nitrate than the 100% MMC group respectively, all threegroups exhibited nearly comparable growth rates (Table S2,Fig. 1c, d). However, supplying 80% of the nitrate amountpredicted by the model resulted in a slower growth rate especiallyafter 241 h (P ≤ 0.05) (Fig. 1d and Table S2). The slow growth rateof the 80% MMC group and unimproved growth rate of 120%MMC group indicate that the genome-scale model can predict theoptimal nitrate amount required for C. vulgaris growth.In addition, we also performed an experiment to show that by
incorporating real-time measurements, this MMC approach help
1234567890():,;

to enhance the performance of algal cultures and also controlnutrient supply more efficiently compared with standardapproaches based on biological approaches.In this experiment, C. vulgaris culture was fed with nitrate using
3 different feeding strategies. The control case included an initialloading of 285 mg/L nitrate with no subsequent feeding. A secondcase was based on the biological knowledge of the growth rate(0.0137 h−1) from the previous experiment (Fig. 1) to predict thenitrate supply; this nitrate was fed every 12 h, which was actuallymore often than the MMC case followed (Fig. S2a). For the thirdMMC conditions, however, we measured the OD750 value every24 h, and then input the growth rates into our genome-scalemodel to determine the proper amount to feed every 24 h fornitrate control in the MMC cultures (Fig. S2a).The uncontrolled C. vulgaris culture was fed with 285mg/L
nitrate initially and the nitrate was consumed completely in themedia by around 147 h (Fig. S2b). For the biological based feedingcase, the OD750 reached a slightly lower value of 3.9 while alsoutilizing approximately 285mg/L nitrate by experimental comple-tion. However we added a total of only around 233mg/L nitrate tothe MMC cultures saving ~18% nitrate while reaching a similarOD750 around 4.3 at 255 h as the uncontrolled batch experiment
(Fig. S2c, d). By using real-time OD750 measurements, we canpredict growth rate and supply nutrients more accurately.
The growth rates of C. vulgaris can be controlled underheterotrophy
After successfully applying the genome-scale model iCZ946-PAT1to control nitrate utilization under autotrophy, a new glucosecontrol feature was included in the model to simulate hetero-trophic growth. In this experiment, we applied the iCZ946-HT1model, which used biomass composition and omics dataexperimentally determined under heterotrophic and nitrogensufficient conditions (Fig. S1 and Table S1). By using this growthdata, we evaluated the demand of glucose and nitrogen in orderto characterize growth conditions. First, the measured opticaldensity (ODt−1, ODt) was used to calculate the growth rate (μ) andto constrain biomass accumulation rate in iCZ946-HT1. Next, theglucose uptake rate (FG) was set as the objective function (Fig. 2a).The model was then optimized to calculate the minimum amountof glucose (FG,t->t+1) required to sustain algal growth. Then,glucose uptake rate was constrained using the predicted valueand nitrate uptake rate (FN) was set as a new objective function in
Fig. 1 Metabolic model control under autotrophic conditions. Arrows indicate the feeding time points; a Algorithm of metabolic modelcontrol (MMC); b Nitrate level in the medium (mg/L); c Total nitrate supply during the culture (mg/L); d Growth curve (OD750). The p-value attime points 1–6 was provided in Table S2. The data represents the mean ± SD for n= 3. *P ≤ 0.05 **P ≤ 0.01
C.-T. Li et al.
3
Published in partnership with the Systems Biology Institute npj Systems Biology and Applications (2019) ��
1234567890():,;

a subsequent simulation (Fig. 2a). The optimization then yields theamount of nitrate (FN,t->t+1) required to sustain algal growth.This algorithm was performed at combinations of two different
levels of glucose (10 g/L [HG], 1 g/L [LG]) and two different levelsof nitrate (250 mg/L [HN], 25 mg/L [LN]). Experimental measure-ments showed that the low glucose groups (LGHN and LGLN)consumed all the initial glucose within 96 h (Fig. 2b). Based on theexperimental culture volume, specific amounts of glucose werefed to the low glucose groups every 24 h based on experimentalculture volume and model predictions (see arrows in Fig. 2b). Theadded glucose was nearly consumed between 96 and 120 h(Fig. 2b). However, after 120 h, the glucose levels started toincrease in both LG groups, indicating the glucose was notcompletely consumed in the culture medium. At 168 h, ~3800mg/L and 3600mg/L of glucose was left in LGHN and LGLN groups,respectively (Fig. 2b). A total of around 11,000 mg/L was fed toboth groups over 168 h (Fig. 2c), resulting in overfeeding after120 h.Experimental results indicated that C. vulgaris consumed 25mg/L
nitrate (HGLN and LGLN) and 250mg/L nitrate (HGHN and LGHN)by 48 and 120 h. Specific amounts of nitrate were fed to thecultures every 24 h based on cell growth rate and modelpredictions for nitrogen uptake rate (Fig. 2d, e). Unlike the trendsobserved for glucose supplementation under the heterotrophicconditions, the algae consumed nearly all the nitrate addedduring each time interval between 48 and 168 h (Fig. 2d). In thisway, the nitrate consumption pattern for C. vulgaris was differentfrom the glucose uptake rate over the same period, in whichglucose consumption rate did not match model predictions.Biomass accumulation in all four C. vulgaris cultures was tracked
as OD750 increased from 0.08 to 7.7 between 0 and 168 h (Fig. 2f).Initial low nitrate (25 mg/L) and low glucose (1 g/L) levels wereexhausted at 48 (time point 1) and 96 h (time point 2),respectively, and the initial nitrate was exhausted at 120 h (time
point 3), for the high nitrate case (250 mg/L). The uncoupling ofglucose consumption and model predictions at 120 h suggests apotential bottleneck to glucose consumption at high cell densitiesof C. vulgaris (Fig. 2b), perhaps due to a limitation in oxygensupply or a limitation in glucose uptake rate that can occur athigher glucose levels.24–26 As a result, the current model forheterotrophic growth did not account for these observed bottle-necks to glucose consumption.Therefore, the MMC algorithm was modified to reflect more
accurately the reduced glucose uptake rate in algal cultureoccurring at higher biomass concentrations. Previously, glucoseuptake limitations into Chlorella have been observed and modeledto account for substrate limitation.24,26 To account for suchlimitation in our studies, we obtained an empirical equationdescribing the relationship between glucose consumption rateand biomass build up rate and this equation was incorporatedinto the model. The relationship was determined using theintegrated value of total biomass produced and glucose uptakerate (Fig. S3a, b). A polynomial regression line accurately fit thetrend of glucose uptake rate as a function of biomass accumula-tion by using GraphPad software (R2= 0.947) (Fig. S3c). Thismodification was incorporated into MMC to account for thelimitation in the cellular glucose uptake rate capability (Fig. 3a).Consideration of both constraints restricts both the growth rateprediction and the glucose uptake rate. By utilizing this newequation to predict glucose uptake rate, we were able to estimateeffective growth rates. As a result, we achieved more representa-tive glucose and nitrate uptake rates.Experimental validation was performed again with four different
combinations (HGHN, LGHN, HGLN, and LGLN). C. vulgarisconsumed all the initially fed glucose in the LG group (1 g/L;LGHN and LGLN) between 61 and 85 h (Fig. 3b). The MMCalgorithm, was used to supply glucose after 61 h. Applying thisnew constraint on glucose uptake in the model dramatically
Fig. 2 Metabolic model control under heterotrophic conditions without constraints on glucose uptake rate. Arrows indicate the time pointsfor feeding nutrients. a Algorithm of metabolic model control; b Glucose level in the medium (mg/L); c Total glucose supply during the culture(mg/L); d Nitrate level in the medium (mg/L); e Total nitrate supply during the culture (mg/L); f Growth curve (OD750). Point 1: 25mg/L nitraterun out; Point 2: 1 g/L glucose run out; Point 3: 250mg/L nitrate run out. The data represents the mean ± SD for n= 3
C.-T. Li et al.
4
npj Systems Biology and Applications (2019) �� Published in partnership with the Systems Biology Institute

decreased the amount of surplus glucose in the medium to0–900 mg/L in the LG group (1 g/L; LGHN and LGLN) during theperiod of metabolic model control between 61 and 133 h. Around5600–6000mg/L glucose was fed to the LG group (1 g/L) duringthe same period of time (Fig. 3c). In the HG group (10 g/L; HGHNand HGLN), C. vulgaris only consumed 4100–5800mg/L of theinitially provided 10,000 mg/L glucose during the experiment, andleft a significant amount of glucose in the medium (Fig. 3b).Regarding the LN groups (25 mg/L; HGLN and LGLN), 25mg/L of
nitrate was consumed after 37 h and 250mg/L of nitrate wasconsumed between 85 and 109 h for the HN groups (250 mg/L;HGHN and LGHN) (Fig. 3d). Nitrate control was started in the lownitrate group around 37 h and for the high nitrate group around85 h. Between 640 mg/L and 740mg/L of nitrate was fed to all fourcultures (HGHN, HGLN, LGHN, LGLN) increasing OD750 from 0.08 tothe range of 8.8 and 9.7 in 133 h (Fig. 3e, f).
Modifying biomass composition in genome scale model to controlnitrate supply for sustaining algal growth with high lipidproductivity
Under nitrogen starvation, C. vulgaris has been found toaccumulate high intracellular lipid levels by altering its biomasscomposition from low fatty acid content (~10%) to up to 60% fattyacid.4 C. vulgaris is able to accomplish this shift in biomasscomposition by recycling intracellular protein back into aminoacids, which contributes to lipid synthesis.27 However, algae suffertwo major drawbacks as a result of this adjustment which are theloss of protein and chlorophyll.28 These sacrifices of critical cellularcomponents are likely to lead to an eventual cessation in growth.
Indeed, we observed that C. vulgaris ceases growth duringnitrogen starvation when protein content falls below ~10%(Fig. S4). Our genome scale model was therefore applied tocontrol nitrate supply in order to sustain a protein level around10% sufficient for continued algal growth even under stressedconditions.We previously explored the impact of different nutrient
condition changes on the biomass composition and themetabolism of algal cells in a genome scale model.16 In thecurrent work, the two different models, iCZ946-PAT1 and iCZ946-HT1, representing autotrophic and heterotrophic cultures, wereincorporated into our metabolic model control algorithm andsuccessfully validated the feasibility of nutrient optimization, asshown in Figs. 1 and 3. To account for these changes in algalbiomass composition under nitrogen starvation, amino acidcontent was modified from the previously published autotrophicgenome-scale model iCZ946-PAT5 (Table S1), which assumed 16%of amino acid content in the biomass composition and wasconstructed using omics data under nitrogen starvation condi-tions. Our modified models were constructed to include instead10% amino acid content (iCZ946-PAT5-10%AA) and 2% aminoacid content for the biomass composition (iCZ946-PAT5-2%AA), asshown in Fig. 4a. The nitrate amount calculated for iCZ946-PAT5-10%AA model should permit algae to synthesize enough proteinand preserve sufficient chlorophyll in order to maintain steadyalgal growth while also potentially yielding a high lipid contentunder nitrogen starvation metabolism. In contrast, C. vulgaris wasexpected to cease growing when the nitrate supply was restrictedto 2% as predicted by the iCZ946-PAT5-2%AA model.
Fig. 3 Metabolic model control in heterotrophic conditions with a constraint on glucose uptake rate. Arrows indicate the time points forfeeding nutrients. a Algorithm of metabolic model control (MMC); b Glucose level in the medium (mg/L); c Total glucose supply during theculture (mg/L); d Nitrate level in the medium (mg/L); e Total nitrate supply during the culture (mg/L); f Growth curve (OD750). Point 1: 25 mg/Lnitrate run out; Point 2: 1 g/L glucose run out; Point 3: 250mg/L nitrate run out. The data represents the mean ± SD for n= 3
C.-T. Li et al.
5
Published in partnership with the Systems Biology Institute npj Systems Biology and Applications (2019) ��

To validate this concept, we again performed an autotrophicexperiment in which nitrate was supplemented to cultures every20–24 h based on our model prediction (Fig. 4b). One set of twoflasks were subjected to nitrogen starvation and two other setswere supplied with a small amount of nitrate based on modelpredictions using either the iCZ946-PAT5-10% AA model oriCZ946-PAT5-2%AA model. For the first 165 h of growth, all C.vulgaris cultures grew similarly and reached OD750= 1.0 (Fig. 4b).However, after 165 h, MMC cultures supplemented with nitratestarted to grow faster than the nitrogen starvation cultures (P ≤0.05). At 261 h, C. vulgaris reached OD750= 1.1 for the nitrogenstarvation culture, while OD750 increased to 1.3 in both MMC-2%AA and MMC-10%AA cultures. At the end of the experiment,around 549 h, OD750 only increased slightly to 1.3 for the nitrogenstarvation culture. In the MMC-2%AA case, algal growth progres-sively slowed relative to the 10%AA around 309 h (P ≤ 0.01), whilestill greater than the complete nitrogen starvation case. Incontrast, the MMC-10%AA culture continued to expand over thecomplete duration of the culture period and reached a final OD750
of 2.3 at 549 h (P ≤ 0.01). These results indicated that an average of0.06 mg/L/h nitrate could support algal growth while targeting aprotein content at or near 10%.Dry biomass was examined at three different time points: 261 h,
429 h, and 549 h, representing periods at which growth slowedsignificantly for the reduced and depleted nitrate cases (Fig. 4c).Indeed, the nitrogen starvation group, which stopped growingafter around 237 h, showed similar biomass yields at its last twotime points, ranging from 290mg/L to 300mg/L. The MMC-2%AAgroup showed an increase in biomass between all time points,growing from 390mg/L at 261 h to ~430mg/L at 429 h and520mg/L at 549 h. C. vulgaris maintained steady growth understressed conditions for the MMC-10%AA condition. The biomassyield steadily increased from 340mg/L at 261 h, to 470 mg/L at429 h, finally reaching 610 mg/L at 549 h. The addition of nitrateusing the iCZ946-PAT5-10%AA model facilitated a biomassincrease of 30% at 261 h, 61% at 429 h, and 105% at 549 h
compared to the complete nitrogen-starvation case (P ≤ 0.01).Compared with MMC-2%AA cultures, the biomass increased 17%at 549 h (P ≤ 0.05) with no significant difference at 261 h and 429 h(Fig. 4c). In total, around 36mg/L and 21mg/L nitrate were addedto the MMC-10%AA and MMC-2%AA cultures respectively over the549 h cell culture period (Fig. 4d). The reduction in growth rateafter 309 h and biomass at 549 h in the MMC-2%AA culturessuggested that the supplied nitrate in MMC-2%AA condition wasinsufficient to maintain growth in the late stages of cultivation,confirming the need for a higher amino acid content in the modelin order to maintain sufficient algal growth.FAME content and total FAME yield were measured to evaluate
the role of using MMC on lipid productivity. As expected, at 261,429 and 549 h, algae in the nitrogen starvation group accumu-lated the highest FAME content among the three differentconditions: 35% at 261 h, 44% at 429 h and 52% at 549 h(Fig. 5a–c). Alternatively, at 549 h, the MMC-2%AA groupaccumulated 48% FAME content and the MMC-10%AA groupaccumulated 45% FAME content, which were 4% and 7%, belowthe nitrogen starvation case. This slightly decreased FAME contentis to be expected, as a greater fraction of algae metabolism wasdedicated to maintaining chlorophyll and protein content in theMMC cultures.Importantly, the overall FAME yield, which incorporates both
FAME content and biomass production, exhibited a differentaccumulation pattern. While the nitrogen starvation group yielded175mg/L at 549 h, the MMC-2%AA and MMC-10%AA groupprovided 275 mg/L and 281 mg/L total FAME yield respectively.Compared with MMC-10%AA conditions, the slower growth rateat 549 h did not affect the FAME yield in MMC-2% AA cultures.Over the three sampling periods, the MMC-10%AA groupdisplayed an increasingly higher total FAME yield 28% and 61%when compared to the nitrogen starvation group at 429 h and549 h (P ≤ 0.01), respectively.
Fig. 4 Metabolic model control under nitrogen limitation. a Biomass compositions in the models (normalized to 100%); b Growth curve(OD750); c Biomass concentration (mg/L); d Total nitrate supply during the culture (mg/L). The data represents the mean ± SD for n= 3. *P ≤0.05 **P ≤ 0.01
C.-T. Li et al.
6
npj Systems Biology and Applications (2019) �� Published in partnership with the Systems Biology Institute

Change in biomass constituents under nitrogen starvation andmetabolic model control conditions
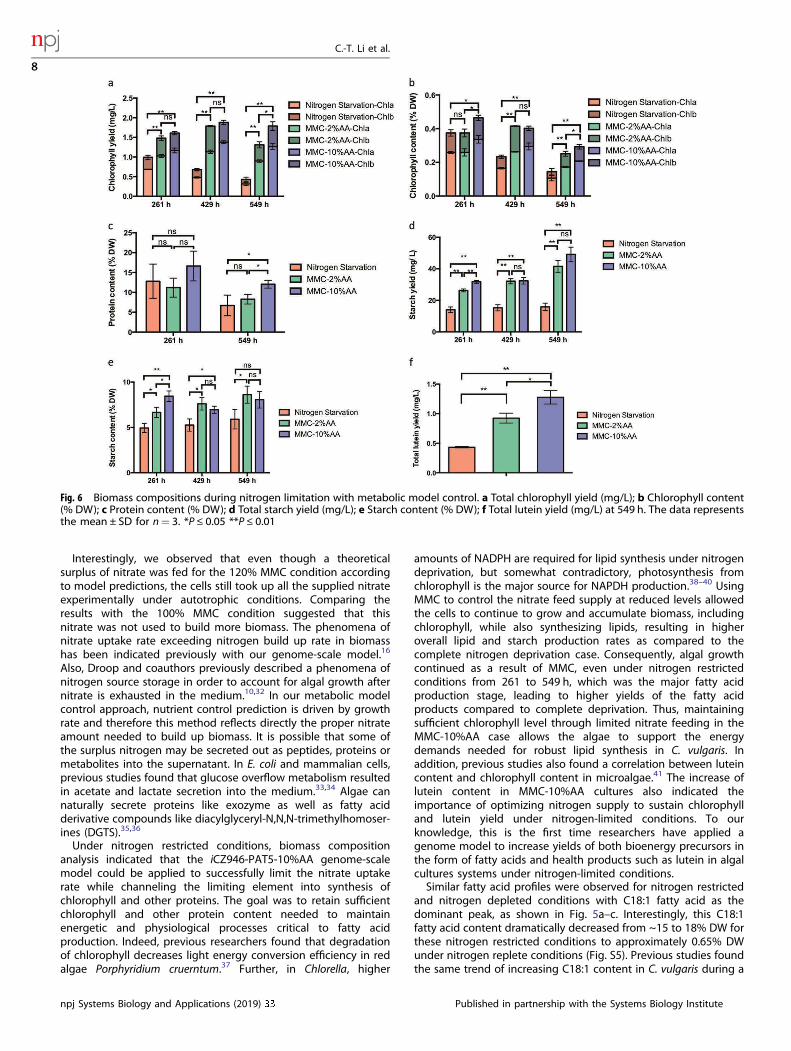
After successfully controlling C. vulgaris growth with high FAMEproductivity under nitrogen starvation using our genome-scalemetabolic model control approach, dry biomass was analyzed tocompare the effect of MMC on other biomass constituents. Totalchlorophyll yield decreased from 0.99mg/L at 261 h to 0.43mg/Lat 549 h for the nitrogen deprivation case (Fig. 6a). Indeed,C. vulgaris is known to degrade the chlorophyll during nitrogenstarvation conditions.29 Supplying insufficient levels of nitrate tothe MMC-2%AA group also resulted in degradation of chlorophyllfrom 1.48 mg/L at 261 h to 1.31 mg/L at 549 h. Alternatively, totalchlorophyll was maintained between 1.61 to 1.79 mg/L from 261to 549 h in the MMC-10%AA group. Since overall biomass steadilyincreased for both MMC groups, the chlorophyll contentdecreased across all the cultures (Fig. 6b). However, thechlorophyll content was around 0.29% in MMC-10%AA cultures,higher than 0.25% in MMC-2%AA and 0.14% in nitrogen starvation(P ≤ 0.05). These results suggested that the iCZ946-PAT5-10%AAmodel can predict the level of nitrate necessary to maintainsubstantial chlorophyll content in C. vulgaris for longer periods,sustaining the energy capture capability from sunlight andbuilding up biomass with an elevated fatty acid content in alimiting nitrogen environment.Since nitrate is a major source of nitrogen for protein synthesis
in algae, the protein contents were also measured for all threeconditions. At 261 h, protein content for the nitrogen starvation,MMC-2%AA and MMC-10%AA cases were around 11–16% (Fig.6c). By 549 h, protein content decreased to 6.7%, 8.2% and 12%under complete nitrogen starvation, MMC-2%AA and the MMC-10%AA conditions, respectively. We hypothesized that 10%protein may be the approximate lower threshold at which algaecan maintain metabolic functions and continue growth undernitrogen limitations (See Fig. S4). Indeed, our experimentconfirmed this lower threshold, as nitrogen starvation ceasedgrowing around 165 h and MMC-2%AA groups growth progres-sively slowed around 309 h (Fig. 4b). Meanwhile, the proteincontent for the MMC-10%AA group was sustained around 10%even at 549 h. Previously, protein content has been found todecrease during nitrogen starvation,30 but this is the first study toshow that continual supplementation of nitrate can maintain theprotein content at a reduced level.
In addition to lipids, algae also use starch to store the energycaptured from sunlight. Since more chlorophyll was present in thetwo MMC groups, more energy should be captured in the algalcells, therefore we also determined the starch yield and starchcontent in this work. We found that under nitrogen starvationconditions, total starch yield was constant between 14 and 15mg/L between the three time points (Fig. 6d). In the two MMC groups,the total starch yield increased stably to a higher level thancomplete nitrate starvation at 261–549 h (P ≤ 0.01) with 42mg/Land 49mg/L for the MMC-2%AA and MMC-10%AA group.Previous studies with C. zofingiensis found that starch synthesiswas more active during the initial stages of nitrogen starvation,but decreased gradually as nitrogen starvation continued.31 Ourresults indicated that without MMC, cells suppressed starchsynthesis from 261 to 529 h. For both MMC groups, our resultsindicated that starch synthesis driven by sunlight was faster thanthe degradation due to limitations in the nitrogen levels. Thestarch content in both MMC groups was also higher than innitrogen starvation case at most of the time points (Fig. 6e). Totallutein yield was also measured; using the iCZ946-PAT5–10%AAmodel resulted in enhanced lutein yields of 195% and 38%, whencompared to the nitrogen starvation group (P ≤ 0.01) and theMMC-2%AA group at 549 h (P ≤ 0.05), respectively (Fig. 6f).
DISCUSSION
In this work, we demonstrate the application of a genome-scalemodel for metabolic model control for three different algal cultureconditions. Under autotrophic conditions, we validated that thisapproach could provide an accurate prediction of the amount ofnitrate needed without affecting cell growth, saving 18% ofnitrate. Under heterotrophic conditions, we showed that thisalgorithm could also be applied to calculate multiple nutrientdemands including glucose and nitrate while maintaining efficientgrowth. We also confirmed that this methodology could beapplied to cultures under restricted nitrogen conditions. Themodel was used to predict a sufficient amount of nitrate neededto maintain algal growth rate while targeting a reduced proteincontent, enabling the cells to maintain fatty acid and luteinproductivity. This MMC strategy led to a 61% increase in totalFAME yield and 195% increase in total lutein yield at 549 hcompared to the nitrate deprivation case.
Fig. 5 Fatty acid production at different time points. FAME content (% DW) at a 261 h, b 429 h, c 549 h. Total FAME yield (mg/L) at d 261 h,e 429 h, f 549 h. The data represents the mean ± SD for n= 3. *P ≤ 0.05 **P ≤ 0.01
C.-T. Li et al.
7
Published in partnership with the Systems Biology Institute npj Systems Biology and Applications (2019) ��
Interestingly, we observed that even though a theoreticalsurplus of nitrate was fed for the 120% MMC condition accordingto model predictions, the cells still took up all the supplied nitrateexperimentally under autotrophic conditions. Comparing theresults with the 100% MMC condition suggested that thisnitrate was not used to build more biomass. The phenomena ofnitrate uptake rate exceeding nitrogen build up rate in biomasshas been indicated previously with our genome-scale model.16
Also, Droop and coauthors previously described a phenomena ofnitrogen source storage in order to account for algal growth afternitrate is exhausted in the medium.10,32 In our metabolic modelcontrol approach, nutrient control prediction is driven by growthrate and therefore this method reflects directly the proper nitrateamount needed to build up biomass. It is possible that some ofthe surplus nitrogen may be secreted out as peptides, proteins ormetabolites into the supernatant. In E. coli and mammalian cells,previous studies found that glucose overflow metabolism resultedin acetate and lactate secretion into the medium.33,34 Algae cannaturally secrete proteins like exozyme as well as fatty acidderivative compounds like diacylglyceryl-N,N,N-trimethylhomoser-ines (DGTS).35,36
Under nitrogen restricted conditions, biomass compositionanalysis indicated that the iCZ946-PAT5-10%AA genome-scalemodel could be applied to successfully limit the nitrate uptakerate while channeling the limiting element into synthesis ofchlorophyll and other proteins. The goal was to retain sufficientchlorophyll and other protein content needed to maintainenergetic and physiological processes critical to fatty acidproduction. Indeed, previous researchers found that degradationof chlorophyll decreases light energy conversion efficiency in redalgae Porphyridium cruerntum.37 Further, in Chlorella, higher
amounts of NADPH are required for lipid synthesis under nitrogendeprivation, but somewhat contradictory, photosynthesis fromchlorophyll is the major source for NAPDH production.38–40 UsingMMC to control the nitrate feed supply at reduced levels allowedthe cells to continue to grow and accumulate biomass, includingchlorophyll, while also synthesizing lipids, resulting in higheroverall lipid and starch production rates as compared to thecomplete nitrogen deprivation case. Consequently, algal growthcontinued as a result of MMC, even under nitrogen restrictedconditions from 261 to 549 h, which was the major fatty acidproduction stage, leading to higher yields of the fatty acidproducts compared to complete deprivation. Thus, maintainingsufficient chlorophyll level through limited nitrate feeding in theMMC-10%AA case allows the algae to support the energydemands needed for robust lipid synthesis in C. vulgaris. Inaddition, previous studies also found a correlation between luteincontent and chlorophyll content in microalgae.41 The increase oflutein content in MMC-10%AA cultures also indicated theimportance of optimizing nitrogen supply to sustain chlorophylland lutein yield under nitrogen-limited conditions. To ourknowledge, this is the first time researchers have applied agenome model to increase yields of both bioenergy precursors inthe form of fatty acids and health products such as lutein in algalcultures systems under nitrogen-limited conditions.Similar fatty acid profiles were observed for nitrogen restricted
and nitrogen depleted conditions with C18:1 fatty acid as thedominant peak, as shown in Fig. 5a–c. Interestingly, this C18:1fatty acid content dramatically decreased from ~15 to 18% DW forthese nitrogen restricted conditions to approximately 0.65% DWunder nitrogen replete conditions (Fig. S5). Previous studies foundthe same trend of increasing C18:1 content in C. vulgaris during a
Fig. 6 Biomass compositions during nitrogen limitation with metabolic model control. a Total chlorophyll yield (mg/L); b Chlorophyll content(% DW); c Protein content (% DW); d Total starch yield (mg/L); e Starch content (% DW); f Total lutein yield (mg/L) at 549 h. The data representsthe mean ± SD for n= 3. *P ≤ 0.05 **P ≤ 0.01
C.-T. Li et al.
8
npj Systems Biology and Applications (2019) �� Published in partnership with the Systems Biology Institute

shift from nitrogen replete to nitrogen starvation conditions.4,42
The presence of a predominance of C18:1 fatty acid in all threecultures of this study (nitrogen depletion and nitrogen restriction)indicates that some levels of cellular response to nitrogenstarvation were evident even for the two MMC groups in whichthe cells were fed with limited amounts of nitrate.Previously, a study connected a kinetic model with a C.
reinhardtii genome-scale model to optimize nitrate supply andlight intensity for D. salina cultures.43 In this study, we expandedthe capability of our multi-compartment C. vulgaris genome-scalemodels to control multiple nutrients, in this case glucose andnitrate, concurrently for C. vulgaris microalgal cultivation studies,including different biomass compositions that can vary as a resultof the nutrient inputs. Previously, control has been implementedfor algal fed-batch heterotrophic cultures using conventionalmethods to control glucose concentration within a certain range44
or kinetic models to optimize feeding rate.25 However, theprevious model predictive methods used simple correlations todescribe the kinetic interaction between substrate uptake rate andbiomass build up rate. In this study, we have demonstrated howgenomic information, metabolic networks and biomass composi-tions can be incorporated to build metabolic model control inorder to provide a more precise understanding and control ofheterotrophic algal cell cultures. In addition, previous studiesobserved that a high amount of glucose in the medium cannegatively inhibit cell growth in two different Chlorella species.44
Our strategy successfully controlled glucose and nitrate at lowconcentration, which may be particularly useful for scaling upbioreactors in order to limit nutrient input costs and remediateglucose inhibition challenges.Overall, this study demonstrates the power of building genome-
scale metabolic models control for nutrient optimization withmicrobial algal cultures. As data collecting processes evolve,genome-scale models can be implemented into biomanufacturingin order to predict the specific amount of nutrients needed tosupport algal growth for different conditions and final processobjectives as illustrated in supplemental Fig. S6. This systematiccontrol strategy represents a potentially promising method forenhancing biofuel precursor production rates from microalgalcultures while controlling inputs in order to lower overallproduction costs of algal bioprocessing. A similar genome-basedcontrol approach involving restricted nutrient feeding could alsobe considered for optimizing productivities for other cell factoriesthat generate valuable products during non-growth phases suchas yeast production of organic acids45 and mammalian cellgeneration of recombinant proteins.46
METHODS
Algal strain and cultivation conditionsGreen microalgae Chlorella vulgaris UTEX 395 was obtained from theCulture Collection of Algae at the University of Texas at Austin andmaintained on sterile agar plates (1.5% w-v) containing Bold’s BasalMedium (BBM). Liquid cultures were inoculated with a single colony in12.5 mL of sterile BBM. Cells were transferred to 100mL or 250mL glassFernbach flasks (New Jersey, USA) at 25 °C using BBM. Autotrophic cultureswere grown with different nitrate concentration under fluorescenceillumination (30 μEm−2 s−1). Heterotrophic cultures were grown withdifferent glucose and nitrate concentration with 24 h dark. Nitrogenstarvation cultures were grown under BBM without nitrate as nitrogensource. The growth of the cultures was monitored by measuring opticaldensity (OD) at 750 nm. During the metabolic model control, specificamounts of 25 g/L nitrate or 20 g/L glucose were added manually into thecultures based on model prediction every 20–28 h. All the cultures weredone in biological triplicate in this study.
Measurement of algal biomass dry weight and FAME contentLiquid cultures were harvested using a high-speed centrifuge (BeckmanJ2–21, Baltimore, USA) at 4000 x g for 10minutes. The pellets were storedat −80 °C and lyophilized for 24 h at −40 °C under freeze-dried machine.FAME production followed the procedure provided by.47 FAMEs were
analyzed using a Agilent’s Gas Chromatography (GC) system withdischarge ionization detection equipped with a capillary column(Stabilwax-DA, 30m 0.25mm ID, film thickness 0.25mm). GC inlet wasset at 250 °C and the injections were in a volume of 1 μL. The temperatureprogram started at 50 °C and then increased to 170 °C at a rate of 20 °Cmin−1, with a plateau for 1 min. After this plateau, the temperatureincreased from 170 °C to 220 °C at a rate of 4 °C min−1 and then keptconstant for 14minutes. The total analysis time was 35minutes. Heliumwas used as carrier gas.
Measurement of lutein yield, starch content, chlorophyll contentand protein contentLutein extraction followed the procedure provided by.48 The dried algaepellets (5–10mg) were homogenized using a mortar and pestle with 4 mLextraction solvent, the mixture of dichloromethane (25%) and methanol(75%), for 2 min and 2 times. The extraction solution was centrifuged at10000 x g for 10min and kept in dark in −20 °C. The solution was filteredbefore HPLC analysis. The mobile phases are eluent A (dichloromethane:methanol: acetonitrile: water, 5.0:85.0:5.5:4.5, v/v) and eluent B (dichlor-omethane: methanol: acetonitrile: water, 25.0:28.0:42.5:4.5, v/v).Starch content in dry biomass was analyzed using an assay kit (K-TSHK,
Megazyme). Starch in dried algae pellets were hydrolyzed into glucose byα-amylase and amyloglucosidase. Then glucose was digested by enzymehexokinase and glucose-6-phosphate dehydrogenase. After the reaction,the absorbance at 340 nm was measured.Chlorophyll content followed procedure provided by.49 Chlorophyll in
the dry algae pellets was extracted by DMSO and absorbance at 665 nmand 649 nm were measured.Protein content followed procedure provided by.4 Dry Biomass was
sonicated on ice for 4 °C for 30 s × 6 cycles. Lysates were centrifuged at16,000 x g for 2 min and the supernatant were analyzed by bicinchoninicacid assay (BCA assay).
Genome scale model simulation for nutrient controlThe iCZ946 model was obtained from.16 Biomass composition, RNA-seqand proteomics data were collected previously under photoautotrophic(PA) conditions and heterotrophic (H) conditions.4,50 Six sample pointswere collected to build six different photoautotrophic models (PAT1-PAT6)and five samples were used to construct five different heterotrophicmodels respectively (HT1-HT5) as described in our previous publication.16
Data collected for all models, except PAT1 and HT1, were undertakenduring nitrogen depletion conditions (Fig. S1). iCZ946-PAT1 model wasapplied for nutrient optimization in autotrophic conditions and iCZ946-HT1model was used for nutrient optimization in heterotrophic conditions. TheiCZ946-PAT5-10%AA and iCZ946-PAT5-2%AA models were built bychanging amino acid composition in iCZ946-PAT5 model. The growthrate (μ) was constrained in the model and the objective function waschanged to minimize nitrate uptake rate (FN) or glucose uptake rate (FG).Genome-scale model simulations were performed using the GurobiOptimizer Version 5.6.3 (Gurobi Optimization Inc., Houston, Texas) solverin MATLAB (The MathWorks Inc., Natick, MA) with the COBRA Toolbox.51
DATA AVAILABILITY
The data that support the findings of this study are available from the correspondingauthor upon reasonable request.
Received: 6 November 2018; Accepted: 21 August 2019;
REFERENCES
1. Fernández-Sevilla, J. M., Fernández, F. G. A. & Grima, E. M. Biotechnological pro-duction of lutein and its applications. Appl. Microbiol. Biotechnol. 86, 27–40 (2010).
2. Barrera, D. J. et al. Algal chloroplast produced camelid VHH antitoxins are capableof neutralizing botulinum neurotoxin. Plant Biotechnol. J. 13, 117–124 (2015).
C.-T. Li et al.
9
Published in partnership with the Systems Biology Institute npj Systems Biology and Applications (2019) ��

3. Brennan, L. & Owende, P. Biofuels from microalgae—a review of technologies forproduction, processing, and extractions of biofuels and co-products. Renew.
Sustain. Energy Rev. 14, 557–577 (2010).4. Guarnieri, M. T. et al. Examination of triacylglycerol biosynthetic pathways via de
novo transcriptomic and proteomic analyses in an unsequenced microalga. PLoSONE 6, e25851 (2011).
5. Rosenberg, J. N. et al. Comparative analyses of three chlorella species in responseto light and sugar reveal distinctive lipid accumulation patterns in the MicroalgaC. sorokiniana. PLoS ONE 9, e92460 (2014).
6. Li, X., Xu, H. & Wu, Q. Large-scale biodiesel production from microalga Chlorellaprotothecoides through heterotrophic cultivation in bioreactors. Biotechnol.
Bioeng. 98, 764–771 (2007).7. Doucha, J. & Lívanský, K. Production of high-density Chlorella culture grown in
fermenters. J. Appl. Phycol. 24, 35–43 (2012).8. Ramaswamy, S., Cutright, T. J. & Qammar, H. K. Control of a continuous bioreactor
using model predictive control. Process Biochem. 40, 2763–2770 (2005).9. del Rio-Chanona, E. A. et al. Optimal operation strategy for biohydrogen pro-
duction. Ind. Eng. Chem. Res. 54, 6334–6343 (2015).10. Bernard, O. Hurdles and challenges for modelling and control of microalgae
for CO2 mitigation and biofuel production. J. Process Control 21, 1378–1389(2011).
11. Ashoori, A., Moshiri, B., Khaki-Sedigh, A. & Bakhtiari, M. R. Optimal control of anonlinear fed-batch fermentation process using model predictive approach. J.Process Control 19, 1162–1173 (2009).
12. Juneja, A. & Murthy, G. S. Model predictive control coupled with economic andenvironmental constraints for optimum algal production. Bioresour. Technol. 250,556–563 (2018).
13. Tebbani, S., Lopes, F., Filali, R., Dumur, D. & Pareau, D. Nonlinear predictive controlfor maximization of CO2 bio-fixation by microalgae in a photobioreactor. Bio-process Biosyst. Eng. 37, 83–97 (2014).
14. Tibocha-Bonilla, J. D., Zuñiga, C., Godoy-Silva, R. D. & Zengler, K. Advances inmetabolic modeling of oleaginous microalgae. Biotechnol. Biofuels 11, 241(2018).
15. O’Brien, E. J., Monk, J. M. & Palsson, B. O. Using genome-scale models to predictbiological capabilities. Cell 161, 971–987 (2015).
16. Zuniga, C. et al. Predicting dynamic metabolic demands in the photosyntheticeukaryote Chlorella vulgaris. Plant Physiol., 00605.02017 (2017).
17. Orth, J. D., Thiele, I. & Palsson, B. Ø. What is flux balance analysis? Nat. Biotechnol.28, 245 (2010).
18. Reed, J. L., Vo, T. D., Schilling, C. H. & Palsson, B. O. An expanded genome-scalemodel of Escherichia coli K-12 (i JR904 GSM/GPR). Genome Biol. 4, R54 (2003).
19. Förster, J., Famili, I., Fu, P., Palsson, B. Ø. & Nielsen, J. Genome-scale reconstructionof the Saccharomyces cerevisiae metabolic network. Genome Res. 13, 244–253(2003).
20. Hefzi, H. et al. A consensus genome-scale reconstruction of Chinese hamsterovary cell metabolism. Cell Syst. 3, 434–443. e438 (2016).
21. Burgard, A. P., Pharkya, P. & Maranas, C. D. Optknock: a bilevel programmingframework for identifying gene knockout strategies for microbial strain optimi-zation. Biotechnol. Bioeng. 84, 647–657 (2003).
22. Rolfsson, O., Palsson, B. Ø. & Thiele, I. The human metabolic reconstruction Recon1 directs hypotheses of novel human metabolic functions. BMC Syst. Biol. 5, 155(2011).
23. Zuñiga, C. et al. Genome-scale metabolic model for the green alga Chlorellavulgaris utex 395 accurately predicts phenotypes under autotrophic, hetero-trophic, and mixotrophic growth conditions. Plant Physiol., 00593.02016 (2016).
24. Heath, R. L. A constitutive enzyme system for glucose transport by Chlorellasorokiniana. Plant Physiol. 64, 224–227 (1979).
25. Bumbak, F., Cook, S., Zachleder, V., Hauser, S. & Kovar, K. Best practices in het-erotrophic high-cell-density microalgal processes: achievements, potential andpossible limitations. Appl. Microbiol. Biotechnol. 91, 31 (2011).
26. Komor, E., Haass, D., Komor, B. & Tanner, W. The active hexose-uptake system ofChlorella vulgaris: Km-values for 6-deoxyglucose influx and efflux and theircontribution to sugar accumulation. Eur. J. Biochem. 39, 193–200 (1973).
27. Chen, H., Zheng, Y., Zhan, J., He, C. & Wang, Q. Comparative metabolic profiling ofthe lipid-producing green microalga Chlorella reveals that nitrogen and carbonmetabolic pathways contribute to lipid metabolism. Biotechnol. Biofuels 10, 153(2017).
28. Ördög, V., Stirk, W. A., Bálint, P., van Staden, J. & Lovász, C. Changes in lipid,protein and pigment concentrations in nitrogen-stressed Chlorella minutissimacultures. J. Appl. Phycol. 24, 907–914 (2012).
29. Mandels, G. R. A quantitative study of chlorosis in Chlorella under conditions ofsulphur deficiency. Plant Physiol. 18, 449 (1943).
30. Lv, J.-M., Cheng, L.-H., Xu, X.-H., Zhang, L. & Chen, H.-L. Enhanced lipid productionof Chlorella vulgaris by adjustment of cultivation conditions. Bioresour. Technol.101, 6797–6804 (2010).
31. Zhu, S. et al. Metabolic changes of starch and lipid triggered by nitrogen star-vation in the microalga Chlorella zofingiensis. Bioresour. Technol. 152, 292–298(2014).
32. Droop, M. R. 25 years of algal growth kinetics a personal view. Bot. Mar. 26,99–112 (1983).
33. Basan, M. et al. Overflow metabolism in Escherichia coli results from efficientproteome allocation. Nature 528, 99 (2015).
34. Young, J. D. Metabolic flux rewiring in mammalian cell cultures. Curr. Opin. Bio-technol. 24, 1108–1115 (2013).
35. Liu, L., Pohnert, G. & Wei, D. Extracellular metabolites from industrial microalgaeand their biotechnological potential. Mar. drugs 14, 191 (2016).
36. Kind, T. et al. Qualitative analysis of algal secretions with multiple mass spec-trometric platforms. J. Chromatogr. A 1244, 139–147 (2012).
37. Zhao, L.-S. et al. Nitrogen starvation impacts the photosynthetic performance ofporphyridium cruentum as revealed by Chlorophyll a fluorescence. Sci. Rep. 7,8542 (2017).
38. Wu, C., Xiong, W., Dai, J. & Wu, Q. Genome-based metabolic mapping and 13Cflux analysis reveal systematic properties of an oleaginous microalga Chlorellaprotothecoides. Plant Physiol. 167, 586–599 (2015).
39. Gopalakrishnan, S., Baker, J., Kristoffersen, L. & Betenbaugh, M. J. Redistribution ofmetabolic fluxes in Chlorella protothecoides by variation of media nitrogenconcentration. Metab. Eng. Commun. 2, 124–131 (2015).
40. Xiong, W., Liu, L., Wu, C., Yang, C. & Wu, Q. 13C-tracer and gas chromatography-mass spectrometry analyses reveal metabolic flux distribution in the oleaginousmicroalga Chlorella protothecoides. Plant Physiol. 154, 1001–1011 (2010).
41. Fu, W. et al. Effects of abiotic stressors on lutein production in the greenmicroalga Dunaliella salina. Microb. Cell Factor. 13, 3 (2014).
42. Stephenson, A. L., Dennis, J. S., Howe, C. J., Scott, S. A. & Smith, A. G. Influence ofnitrogen-limitation regime on the production by Chlorella vulgaris of lipids forbiodiesel feedstocks. Biofuels 1, 47–58 (2010).
43. Flassig, R. J., Fachet, M., Höffner, K., Barton, P. I. & Sundmacher, K. Dynamic fluxbalance modeling to increase the production of high-value compounds in greenmicroalgae. Biotechnol. biofuels 9, 165 (2016).
44. Xiong, W., Li, X., Xiang, J. & Wu, Q. High-density fermentation of microalgaChlorella protothecoides in bioreactor for microbio-diesel production. Appl.
Microbiol. Biotechnol. 78, 29–36 (2008).45. Finogenova, T. V., Morgunov, I. G., Kamzolova, S. V. & Chernyavskaya, O. G.
Organic acid production by the yeast Yarrowia lipolytica: a review of prospects.Appl. Biochem. Microbiol. 41, 418–425 (2005).
46. Kim, J. Y., Kim, Y.-G. & Lee, G. M. CHO cells in biotechnology for production ofrecombinant proteins: current state and further potential. Appl. Microbiol. Bio-
technol. 93, 917–930 (2012).47. Dong, T. et al. Direct quantification of fatty acids in wet microalgal and yeast
biomass via a rapid in situ fatty acid methyl ester derivatization approach. Appl.Microbiol. Biotechnol. 99, 10237–10247 (2015).
48. Yuan, J.-P., Chen, F., Liu, X. & Li, X.-Z. Carotenoid composition in the greenmicroalga Chlorococcum. Food Chem. 76, 319–325 (2002).
49. Sumanta, N., Haque, C. I., Nishika, J. & Suprakash, R. Spectrophotometric analysisof chlorophylls and carotenoids from commonly grown fern species by usingvarious extracting solvents. Res. J. Chem. Sci. 2231, 606X (2014).
50. Guarnieri, M. T., Nag, A., Yang, S. & Pienkos, P. T. Proteomic analysis of Chlorellavulgaris: potential targets for enhanced lipid accumulation. J. Proteom. 93,245–253 (2013).
51. Schellenberger, J. et al. Quantitative prediction of cellular metabolism withconstraint-based models: the COBRA Toolboxv2. 0. Nat. Protoc. 6, 1290–1307(2011).
ACKNOWLEDGEMENTS
This work was supported by Emerging Frontiers in Research and Innovation program
in U.S. National Science Foundation (Grant number: 1332344) and Department of
Energy (Grant number: DE-SC0012658). The authors also thank Dr. Ed Bouwer and
Steven Chow at the Department of Environmental Health and Engineering, JHU for
assistance with analysis using GC-FID.
AUTHOR CONTRIBUTIONS
C.T.L, J.Y, Y.C, C.Z, K.Z. and M.J.B. contributed to conception and design of the
experiment. C.T.L., J.Y., A.S., R.E., Y.C., L.J. and K.W.H. conducted the experiments. C.T.L.,
Y.C. and M.J.B. analyzed the data. C.T.L., J.Y., C.Z., K.Z. and M.J.B. drafted the manuscript
and all authors reviewed it critically for approval of the final version to be submitted.
C.-T. Li et al.
10
npj Systems Biology and Applications (2019) �� Published in partnership with the Systems Biology Institute
COMPETING INTERESTS
The authors declare no competing interests.
ADDITIONAL INFORMATION
Supplementary information is available for this paper at https://doi.org/10.1038/s41540-019-0110-7.
Correspondence and requests for materials should be addressed to M.J.B.
Reprints and permission information is available at http://www.nature.com/reprints
Publisher’s note Springer Nature remains neutral with regard to jurisdictional claimsin published maps and institutional affiliations.
Open Access This article is licensed under a Creative CommonsAttribution 4.0 International License, which permits use, sharing,
adaptation, distribution and reproduction in anymedium or format, as long as you giveappropriate credit to the original author(s) and the source, provide a link to the CreativeCommons license, and indicate if changes were made. The images or other third partymaterial in this article are included in the article’s Creative Commons license, unlessindicated otherwise in a credit line to the material. If material is not included in thearticle’s Creative Commons license and your intended use is not permitted by statutoryregulation or exceeds the permitted use, you will need to obtain permission directlyfrom the copyright holder. To view a copy of this license, visit http://creativecommons.org/licenses/by/4.0/.
© The Author(s) 2019
C.-T. Li et al.
11
Published in partnership with the Systems Biology Institute npj Systems Biology and Applications (2019) ��