uv-vis spectrophotometry of quinone flow battery
TRANSCRIPT

31684 | Phys. Chem. Chem. Phys., 2017, 19, 31684--31691 This journal is© the Owner Societies 2017
Cite this:Phys.Chem.Chem.Phys.,
2017, 19, 31684
UV-Vis spectrophotometry of quinone flowbattery electrolyte for in situ monitoring andimproved electrochemical modeling of potentialand quinhydrone formation†
Liuchuan Tong, ‡a Qing Chen, ‡§b Andrew A. Wong, ‡b
Rafael Gomez-Bombarelli, ¶a Alan Aspuru-Guzik, a Roy G. Gordon a andMichael J. Aziz *b
Quinone-based aqueous flow batteries provide a potential opportunity for large-scale, low-cost energy
storage due to their composition from earth abundant elements, high aqueous solubility, reversible
redox kinetics and their chemical tunability such as reduction potential. In an operating flow battery
utilizing 9,10-anthraquinone-2,7-disulfonic acid, the aggregation of an oxidized quinone and a reduced
hydroquinone to form a quinhydrone dimer causes significant variations from ideal solution behavior
and of optical absorption from the Beer–Lambert law. We utilize in situ UV-Vis spectrophotometry to
establish (a), quinone, hydroquinone and quinhydrone molar attenuation profiles and (b), an equilibrium
constant for formation of the quinhydrone dimer (KQHQ) B 80 M�1. We use the molar optical
attenuation profiles to identify the total molecular concentration and state of charge at arbitrary
mixtures of quinone and hydroquinone. We report density functional theory calculations to support the
quinhydrone UV-Vis measurements and to provide insight into the dimerization conformations. We
instrument a quinone–bromine flow battery with a Pd–H reference electrode in order to demonstrate
how complexation in both the negative (quinone) and positive (bromine) electrolytes directly impacts
measured half-cell and full-cell voltages. This work shows how accounting for electrolyte complexation
improves the accuracy of electrochemical modeling of flow battery electrolytes.
Introduction
Quinones are widely involved in many processes involvingelectron transfer, such as ubiquinone in respiratory systems1
and plastoquinone in photosynthesis.2 Their unique electro-chemical properties attract much attention from electrochemistswho often study quinones as model systems for spontaneousproton-coupled electron transfer processes.3 In addition, becauseof their high aqueous solubility, fast charge-transfer kinetics andthe capability of multi-electron transfer in addition to beingcomposed of earth abundant elements, quinones have been the
subject of increased attention in the field of electrical energystorage. Quinones in their crystalline or polymeric solid forms finduse as reactive electrodes,4,5 and solvated quinone molecules areemployed in aqueous and non-aqueous redox flow batteries.6–9
Recent works explore low-cost electrolytes containing redox-active quinone molecules for aqueous flow batteries. Anthra-quinones have been rendered highly soluble in acidic and basicsolutions through sulfonation6 and hydroxylation10 respectively, andthe low redox potentials of certain anthraquinones yield a consider-able cell voltage when paired with a high potential redox couple.10
Quinone-based flow batteries have attracted a great deal of attentionfor their potential to regulate fluctuations in energy demand and theaddress the intermittency challenge of renewable wind and photo-voltaic supply through cost-effective grid-scale storage.6,10,11
To further improve quinone-based flow battery performance,the behavior of the quinone/hydroquinone redox couple mustbe understood, especially at the high concentration requiredfor practical operation. Quinone molecules are known to formquinhydrone complexes between the oxidized and the reducedforms.12–14 This dimer arises from hydrogen bonding, charge-transfer between quinone and hydroquinone, and from a
a Department of Chemistry and Chemical Biology, Harvard University,
12 Oxford Street, Cambridge, Massachusetts 02138, USAb Harvard School of Engineering and Applied Sciences, 29 Oxford Street,
Cambridge, Massachusetts 02138, USA. E-mail: [email protected]
† Electronic supplementary information (ESI) available. See DOI: 10.1039/c7cp05881k‡ These authors contributed equally as co-first authors.§ Present address: Department of Mechanical and Aerospace Engineering,Hong Kong University of Science and Technology, Clear Water Bay, Kowloon,Hong Kong.¶ Present address: Kyulux North America Inc., 10 Post office Sq. Boston, Massa-chusetts, 02109, USA.
Received 28th August 2017,Accepted 13th November 2017
DOI: 10.1039/c7cp05881k
rsc.li/pccp
PCCP
PAPER
Publ
ishe
d on
15
Nov
embe
r 20
17. D
ownl
oade
d by
Har
vard
Uni
vers
ity o
n 06
/12/
2017
14:
47:2
7.
View Article OnlineView Journal | View Issue

This journal is© the Owner Societies 2017 Phys. Chem. Chem. Phys., 2017, 19, 31684--31691 | 31685
combination of dispersion interactions between the extendedaromatic systems when they coexist in the solution. Such adimer structure was used in the invention of quinhydrone pHelectrodes almost a century ago.15 This quinhydrone has itsown unique optical absorbance signature due to allowed inter-molecular electron transfer. The interaction of dissolved monomersresults in a change in the electrolyte activity, shifting the reductionpotential. When the speciation is greatly driven toward quinhydroneformation, the cell voltage can significantly deviate from that of anideal solution, in large part due to changes in the unboundmonomer species concentrations; this is similar to the behaviorof the positive side of the QBFB where the tribromide complexdominates the speciation.
In this work, we use UV-Vis absorption spectrophotometryand density functional theory (DFT) calculations to quantify theoptical properties of quinone, hydroquinone and quinhydrone.Additionally, we explore the underlying quinhydrone formationmechanism, based on which we estimate a value for thequinhydrone equilibrium constant. UV-Vis spectrophotometryhas already been established as a valuable tool for thoseinterested in operating commercial flow batteries.16,17 By consi-dering quinhydrone formation as well as complexation in thebromine-based positive electrolyte, full-cell and half-cell voltageapproximations using the unbound monomer species concen-trations applied to the Nernst equation are significantlyimproved, matching experimentally measured values.
Experimental
In this study, the quinone used is specifically 9,10-anthraquinone-2,7-disulfonic acid (AQDS). For conciseness inthe following discussion, quinone (Q), hydroquinone (HQ) andquinhydrone (QHQ) will stand for AQDS, H2AQDS, and theirquinhydrone dimer respectively.
In-line UV-Vis spectrophotometry
All reported UV-Vis spectrophotometry data in this study arecollected in-line during electrochemical experiments with a
custom-built 5 cm2 quinone–hydrogen flow cell (QHFC), asshown schematically in Fig. 1(a). Hydrogen is used at thecharging anode made of platinum-coated porous carbon paper,separated by a Nafion 212 ion exchange membrane. Hydrogenis used specifically to prevent crossover contamination in thequinone electrolyte from other redox species. A 100 mm opticalpath-length flow cell (Ocean Optics FIA-USP-100) is plumbed tothe outlet of the QHFC. A deuterium–tungsten light source(Ocean Optics DH-2000-BAL) is connected to the optical flowcell using 25 cm optical fibers (Ocean Optics QP400-025-SR-BX)with a mirroring optical fiber and UV-Vis spectrophotometer(Ocean Optics Flame-S-UV-VIS). This setup is used for allabsorption measurements. 20 mL of 200 mM AQDS in 1 MH2SO4 electrolyte is pumped through the QHFC at 60 mL min�1
with a peristaltic pump (Cole Parmer MasterFlex L/S). Given anopen-circuit voltage (OCV) of 0.213 V, chronoamperometryat �0.1 V is used to fully reduce the flowing quinone in thecarbon electrode while the UV-Vis absorption spectra are beingrecorded every 5 seconds. The quinone is then re-oxidized bychronoamperometry at 0.5 V, generating hydrogen cathodicallyat the hydrogen electrode. 10 mL of quinone electrolyte isthen removed and replaced by 10 mL of 1 M H2SO4; a portionof the removed electrolyte is saved to accurately quantify theconcentration in each experiment. The electrochemical proce-dure and subsequent dilution are repeated to obtain spectraat various concentrations. The starting quinone concentration,taken at 0% state of charge (SOC), for each experiment isdefined as [Q]0.
The chronoamperometry charge–discharge data are normal-ized by coulometry from 0% to 100% SOC to identify spectra in10% SOC increments. SOC is defined by the fraction of totalhydroquinone molecule concentration ([HQ] + [QHQ]) and thestarting quinone concentration (i.e. ([HQ] + [QHQ])/[Q]0). The0% and 100% SOC absorbance spectra for each startingconcentration are then normalized by that concentration andthe optical flow cell path length to give the molar attenuation ofthe quinone and hydroquinone respectively. As will be shownlater, the spectra at intermediate SOCs can be determined by alinear system of equations using these molar attenuation spectra.
Fig. 1 Cell configuration for (a) quinone–hydrogen flow cell (QHFC) and (b) quinone–bromine flow battery (QBFB).
Paper PCCP
Publ
ishe
d on
15
Nov
embe
r 20
17. D
ownl
oade
d by
Har
vard
Uni
vers
ity o
n 06
/12/
2017
14:
47:2
7.
View Article Online

31686 | Phys. Chem. Chem. Phys., 2017, 19, 31684--31691 This journal is© the Owner Societies 2017
UV-Vis spectra taken between 0% and 100% SOC at severaldifferent concentrations demonstrate the appearance, only atintermediate states of charge, of an absorbance peak between500 nm and 800 nm, i.e. at significantly longer wavelengthsthan the quinone and hydroquinone absorption ranges alone.These spectra are fit across this wavelength range to obtain aquinhydrone equilibrium constant (KQHQ) and a molar attenua-tion constant (eQHQ(l)).
Theoretical
The interaction between reduced and oxidized AQDS is modeledusing DFT. Initial conformations are generated stochasticallyusing frozen monomer geometries and varying the relativedisplacement and orientation of the reduced and oxidizedmolecules. These starting configurations are pre-optimized usingthe PM6DH, a computationally-fast semi-empirical method withcorrections for dispersion and hydrogen bond interactions. Thegeometries are further refined by optimizing the geometries atthe DFT B3LYP/6-31G(d) level of theory18 with an additive D3dispersion interaction correction19 using Terachem v1.5. Singlepoint calculations at the optimized geometries are performedusing B3LYP-D3/6-311G(d,p) to estimate aggregation energies,and using TD-DFT B3LYP-D3/6-31G(d) and TD-DFT oB97X-D/6-31G(d) levels of theory20 to estimate the absorption spectra ofthe quinhydrone. Solvent effects are included in the DFT calcula-tions using the conductor-like polarizable continuum (CPCM)solvation model in water.21,22
In order to capture the role of interaction with the watersolvent molecules, calculations are also performed on explicitlyhydrated complexes via cluster-continuum calculations.23
One water molecule is added per hydrogen-bond donor atom(oxygen atoms), for a total of 16 water molecules. Solventmolecules are placed randomly near oxygen atoms in the pre-arranged quinhydrone system and then relaxed by full geometryoptimization.
Electrochemistry
Because the negolyte, posolyte (negative and positive electrolyterespectively) and overall cell voltages (Eneg, Epos, and Ecell
respectively) will change based on the true electrolyte speciesconcentrations, we use electrochemical techniques to corro-borate the KQHQ value measured by UV-Vis spectrophotometry.To extract the Eneg and Epos experimentally, we install a referenceelectrode in the quinone–bromine flow battery (QBFB) to separatethe two half-cell voltage contributions from the total cell voltage.The cell configuration for this half-cell experiment is illustrated inFig. 1(b). A Pd–H reference electrode is sandwiched between twosheets of Nafion membrane, the location of which is justified byprior research.24 All potentials are reported here vs. SHE based onan average potential of the Pd–H electrode measured before andafter the half-cell testing. Under these conditions, the referenceelectrode potential is B50 mV vs. RHE.25 A less than 5 mVpotential change is usually observed during the measurement.
The build of the quinone–bromide cell follows that in ref. 25(Chen et al.). On each side, a commercial graphite plate withinterdigitated flow channels (Fuel Cell Tech, Albuquerque, NM)
feeds an electrolyte to a porous carbon electrode at a rate of100 mL per minute controlled by a MasterFlex (Cole Parmer)diaphragm pump. The electrode comprises a stack of 3 sheetsof SGL 10AA (each nominally 400 mm thick) carbon paper,compressed to B75% of the original thickness, defined byTeflon gaskets. The geometric area of the electrodes is 2 cm2.The SGL paper is pre-treated by baking at 400 1C in air for24 hours. The reference electrode is sandwiched between twoNafion 115 membranes, which are soaked in DI-water at roomtemperature for B24 hours prior to the experiments. Thetemperature of the cell is approximately 20 1C.
15 to 20 mL of negolyte is used for the cell. It contains either1.0 or 0.2 M AQDS, with an additional 1.0 M or 2.6 M H2SO4
respectively to maintain 3 M free protons in the electrolyte.The posolyte contains 0.5 M Br2 and 3.0 M HBr. The volumeratio is maintained at 1 : 1.2 negolyte : posolyte. For each cell,the charge associated to the reduction of AQDS is assessed byreducing the negolyte at �0.1 V vs. Pd–H, until the currentreaches a steadily low value (as demonstrated in Fig. S6, ESI†).With this assessment of the total charge, the quinone isreduced in 10% SOC increments between 0% and 100% andthe open circuit voltage with respect to the reference electrodeis measured at each increment. These data are compared totheoretical potentials based on the Nernst equation based onthe unbound monomer species concentrations both omittingand incorporating the effect of species complexation.
Results and discussionIn-line UV-Vis spectrophotometry
In an operating quinone flow battery, the SOC relates therelative concentrations of Q and HQ species and is most oftendetermined by electrochemical methods. in situ UV-V is spectro-photometry measurements of Q and HQ species at differentSOCs can be found in Fig. 2(a). Normalizing the absorptionoptical density (OD) at 0% and 100% SOC by the flow cell pathlength (100 mm) and solution concentration (2.25 mM) providesthe active species molar attenuation (e(l)). Fig. 2(b) shows themolar attenuation of the quinone eQ(l) and hydroquinoneeHQ(l) in the UV and visible regions. Using the Beer–Lambert law,
A(l) = e(l)c l (1)
where A is the absorbance (�log(transmittance)) of the solution,c is the concentration, and l is the optical path length throughthe solution, the absorbance spectrum for l o 500 nm at anintermediate state of charge can be determined by a linearcombination between Q and HQ:
A(l) = eQ(l)[Q]0l(1 � SOC) + SOCeHQ(l)[Q]0l (2)
As will be shown later, the dimerization product of Q and HQ isthe only species that absorbs in the region l4 500 nm. Fig. 2(c)shows that the intermediate-SOC solution absorption averagefor various starting solution concentrations can be recreated bya linear combination between Q and HQ absorbance between
PCCP Paper
Publ
ishe
d on
15
Nov
embe
r 20
17. D
ownl
oade
d by
Har
vard
Uni
vers
ity o
n 06
/12/
2017
14:
47:2
7.
View Article Online

This journal is© the Owner Societies 2017 Phys. Chem. Chem. Phys., 2017, 19, 31684--31691 | 31687
200–500 nm wavelength using the SOC as the only fittingparameter. This method, using [Q]0 as an additional fittingparameter, can be used to identify the concentration and theSOC of a quinone flow battery in operando, providing a non-electrochemical method for measuring these quantities.
Quinhydrone
It has been known that Q and HQ dimerize to quinhydrone(QHQ), a phenomenon that is detectable at sufficientlyhigh concentrations of both parent species. The first steptoward understanding the impact from quinhydrone formationis quantifying the reaction equilibrium constant. The quinhy-drone equilibrium can be written as
QþHQ !KQHQ
QHQ (3)
with equilibrium constant KQHQ defined as
KQHQ ¼gQHQ½QHQ�
gQ½Q�gHQ½HQ� (4)
where g represents the molar activity coefficient of a particularspecies and the square brackets indicate concentrations inmoles per liter. We can further define an activity-coefficientcorrected equilibrium constant KQHQ
0 as
KQHQ0¼KQHQ
0=g0 ¼ ½QHQ�
½Q�½HQ� (5)
in whichg0 = gQHQ/gQgHQ.Instantaneous [Q], [HQ] and [QHQ] in the solution can be
connected to [Q]0 via cell SOC in the form of
[Q]0 = [Q] + [HQ] + 2[QHQ], (6)
SOC ¼ ½HQ� þ ½QHQ�½Q� þ ½HQ� þ 2½QHQ� ¼
½HQ� þ ½QHQ�½Q�0
(7)
KQHQ0 can therefore be expressed as a function of [Q]0, [QHQ]
and SOC
KQHQ0¼ ½QHQ�
Q½ �02SOCð1� SOCÞ � Q½ �0½QHQ� þ ½QHQ�2 (8)
With known [Q]0 and SOC, KQHQ0 may be determined from a
measurement of [QHQ].Given the distinct light absorption spectra of Q and HQ as
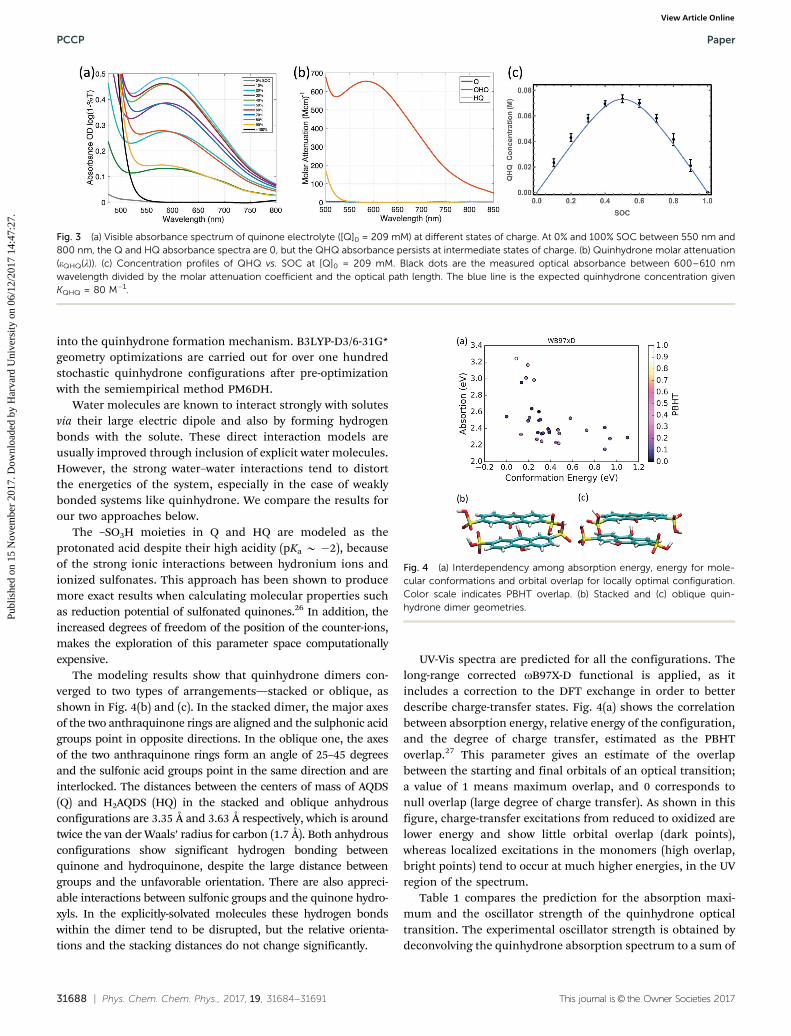
described above, it is possible to quantify deviations from anideal spectrum. At intermediate SOCs a broad absorbance bandbetween 550 and 800 nm arises, showing no proportionality toeither [Q] or [HQ], as shown in Fig. 3(a). This absorbancereaches maximum at 50% SOC or a 1 : 1 stoichiometry betweenQ and HQ and is symmetric by SOC about this point. This resultindicates that the species absorbing in this band is correlatedto the product of the concentrations of Q and HQ, as would beexpected for a QHQ complex.
[QHQ] is then quantified based on the measured spectra atintermediate SOCs for several different starting quinone con-centrations. For the visible wavelengths over which Q and HQdo not absorb (i.e. 4550 nm), the absorbance of QHQ can alsobe given by the Beer–Lambert law
AQHQ(l) = eQHQ(l)[QHQ]l (9)
where eQHQ is the QHQ molar attenuation coefficient. Combiningeqn (8) and (9) gives
Q½ �02SOCð1� SOCÞ ¼ 1
KQHQ0 þ Q½ �0
� �AQHQðlÞeQHQðlÞl
� AQHQðlÞeQHQðlÞl
� �2
(10)
From the experimental setup, [Q]0, SOC and l are known andAQHQ(l) is measured. Allowing KQHQ
0 and eQHQ(l) to be indepen-dent variables, we fit the data to obtain a wavelength-dependentQHQ molar attenuation, as shown in Fig. 3(b). The result isKQHQ
0 B 80 M�1, which can be modeled across all SOCs and fitswell to experimental data as shown in Fig. 3(c). Later in this work,this value of the equilibrium constant will be used to betteraccount for the negolyte half-cell potential.
Quantum chemical calculations
DFT calculations are performed to support the experimentallyobserved quinhydrone absorbance as well as to gain insight
Fig. 2 (a) In situ UV-Vis absorbance spectra by state of charge (SOC) for 1.25 mM AQDS through a 100 mm optical flow cell. (b) UV molar attenuationspectra for quinone (eQ(l)) and hydroquinone (eHQ(l)). (c) Quinone SOC calculated by a linear combination of Q and HQ molar attenuation vs. SOCmeasured by coulometry showing a close relationship between the two techniques. Data points are averaged from various dilute AQDS concentrationsbetween 1 and 56 mM. All data are measured using a 100 um path length flow cell as shown in Fig. 1(a). The average values are reported with error barsrepresenting one standard deviation. Attenuation values above 1.6 OD are considered to reach a photon-detection limit for the spectrometer and are notused when calculating the average.
Paper PCCP
Publ
ishe
d on
15
Nov
embe
r 20
17. D
ownl
oade
d by
Har
vard
Uni
vers
ity o
n 06
/12/
2017
14:
47:2
7.
View Article Online
31688 | Phys. Chem. Chem. Phys., 2017, 19, 31684--31691 This journal is© the Owner Societies 2017
into the quinhydrone formation mechanism. B3LYP-D3/6-31G*geometry optimizations are carried out for over one hundredstochastic quinhydrone configurations after pre-optimizationwith the semiempirical method PM6DH.
Water molecules are known to interact strongly with solutesvia their large electric dipole and also by forming hydrogenbonds with the solute. These direct interaction models areusually improved through inclusion of explicit water molecules.However, the strong water–water interactions tend to distortthe energetics of the system, especially in the case of weaklybonded systems like quinhydrone. We compare the results forour two approaches below.
The –SO3H moieties in Q and HQ are modeled as theprotonated acid despite their high acidity (pKa B �2), becauseof the strong ionic interactions between hydronium ions andionized sulfonates. This approach has been shown to producemore exact results when calculating molecular properties suchas reduction potential of sulfonated quinones.26 In addition, theincreased degrees of freedom of the position of the counter-ions,makes the exploration of this parameter space computationallyexpensive.
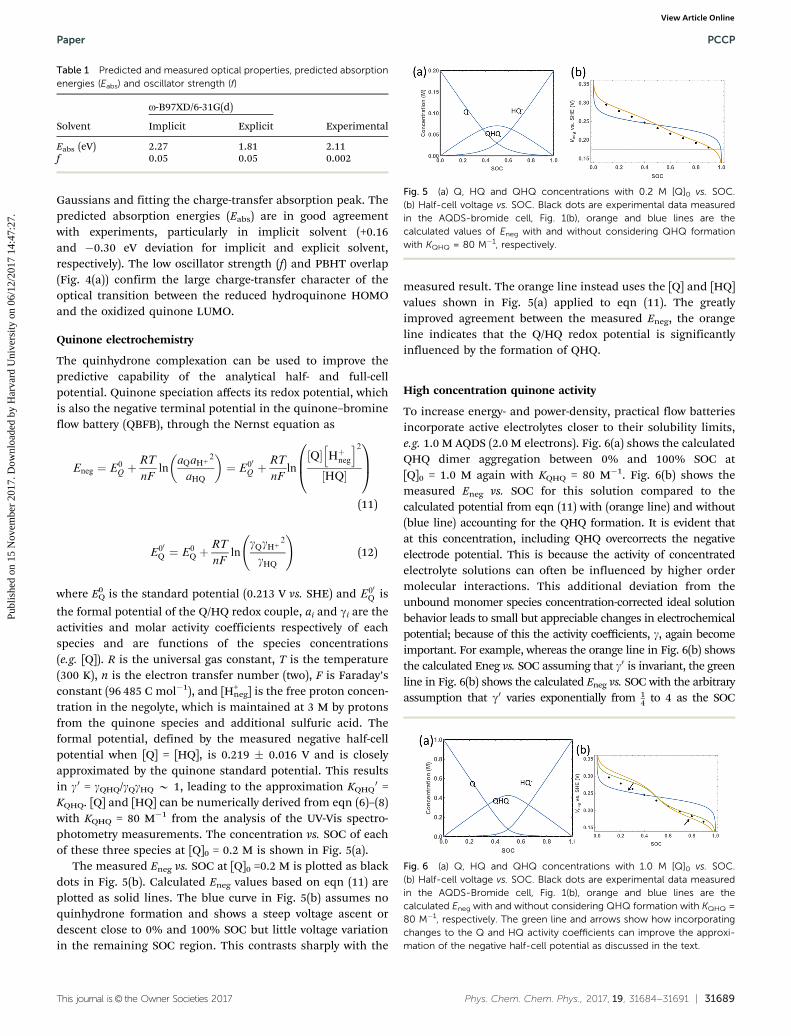
The modeling results show that quinhydrone dimers con-verged to two types of arrangements—stacked or oblique, asshown in Fig. 4(b) and (c). In the stacked dimer, the major axesof the two anthraquinone rings are aligned and the sulphonic acidgroups point in opposite directions. In the oblique one, the axesof the two anthraquinone rings form an angle of 25–45 degreesand the sulfonic acid groups point in the same direction and areinterlocked. The distances between the centers of mass of AQDS(Q) and H2AQDS (HQ) in the stacked and oblique anhydrousconfigurations are 3.35 Å and 3.63 Å respectively, which is aroundtwice the van der Waals’ radius for carbon (1.7 Å). Both anhydrousconfigurations show significant hydrogen bonding betweenquinone and hydroquinone, despite the large distance betweengroups and the unfavorable orientation. There are also appreci-able interactions between sulfonic groups and the quinone hydro-xyls. In the explicitly-solvated molecules these hydrogen bondswithin the dimer tend to be disrupted, but the relative orienta-tions and the stacking distances do not change significantly.
UV-Vis spectra are predicted for all the configurations. Thelong-range corrected oB97X-D functional is applied, as itincludes a correction to the DFT exchange in order to betterdescribe charge-transfer states. Fig. 4(a) shows the correlationbetween absorption energy, relative energy of the configuration,and the degree of charge transfer, estimated as the PBHToverlap.27 This parameter gives an estimate of the overlapbetween the starting and final orbitals of an optical transition;a value of 1 means maximum overlap, and 0 corresponds tonull overlap (large degree of charge transfer). As shown in thisfigure, charge-transfer excitations from reduced to oxidized arelower energy and show little orbital overlap (dark points),whereas localized excitations in the monomers (high overlap,bright points) tend to occur at much higher energies, in the UVregion of the spectrum.
Table 1 compares the prediction for the absorption maxi-mum and the oscillator strength of the quinhydrone opticaltransition. The experimental oscillator strength is obtained bydeconvolving the quinhydrone absorption spectrum to a sum of
Fig. 4 (a) Interdependency among absorption energy, energy for mole-cular conformations and orbital overlap for locally optimal configuration.Color scale indicates PBHT overlap. (b) Stacked and (c) oblique quin-hydrone dimer geometries.
Fig. 3 (a) Visible absorbance spectrum of quinone electrolyte ([Q]0 = 209 mM) at different states of charge. At 0% and 100% SOC between 550 nm and800 nm, the Q and HQ absorbance spectra are 0, but the QHQ absorbance persists at intermediate states of charge. (b) Quinhydrone molar attenuation(eQHQ(l)). (c) Concentration profiles of QHQ vs. SOC at [Q]0 = 209 mM. Black dots are the measured optical absorbance between 600–610 nmwavelength divided by the molar attenuation coefficient and the optical path length. The blue line is the expected quinhydrone concentration givenKQHQ = 80 M�1.
PCCP Paper
Publ
ishe
d on
15
Nov
embe
r 20
17. D
ownl
oade
d by
Har
vard
Uni
vers
ity o
n 06
/12/
2017
14:
47:2
7.
View Article Online
This journal is© the Owner Societies 2017 Phys. Chem. Chem. Phys., 2017, 19, 31684--31691 | 31689
Gaussians and fitting the charge-transfer absorption peak. Thepredicted absorption energies (Eabs) are in good agreementwith experiments, particularly in implicit solvent (+0.16and �0.30 eV deviation for implicit and explicit solvent,respectively). The low oscillator strength (f) and PBHT overlap(Fig. 4(a)) confirm the large charge-transfer character of theoptical transition between the reduced hydroquinone HOMOand the oxidized quinone LUMO.
Quinone electrochemistry
The quinhydrone complexation can be used to improve thepredictive capability of the analytical half- and full-cellpotential. Quinone speciation affects its redox potential, whichis also the negative terminal potential in the quinone–bromineflow battery (QBFB), through the Nernst equation as
Eneg ¼ E0Q þ
RT
nFln
aQaHþ2
aHQ
� �¼ E00
Q þRT
nFln½Q� Hþnegh i2½HQ�
0B@
1CA
(11)
E00Q ¼ E0
Q þRT
nFln
gQgHþ2
gHQ
!(12)
where E0Q is the standard potential (0.213 V vs. SHE) and E00
Q is
the formal potential of the Q/HQ redox couple, ai and gi are theactivities and molar activity coefficients respectively of eachspecies and are functions of the species concentrations(e.g. [Q]). R is the universal gas constant, T is the temperature(300 K), n is the electron transfer number (two), F is Faraday’sconstant (96 485 C mol�1), and [H+
neg] is the free proton concen-tration in the negolyte, which is maintained at 3 M by protonsfrom the quinone species and additional sulfuric acid. Theformal potential, defined by the measured negative half-cellpotential when [Q] = [HQ], is 0.219 � 0.016 V and is closelyapproximated by the quinone standard potential. This resultsin g0 = gQHQ/gQgHQ B 1, leading to the approximation KQHQ
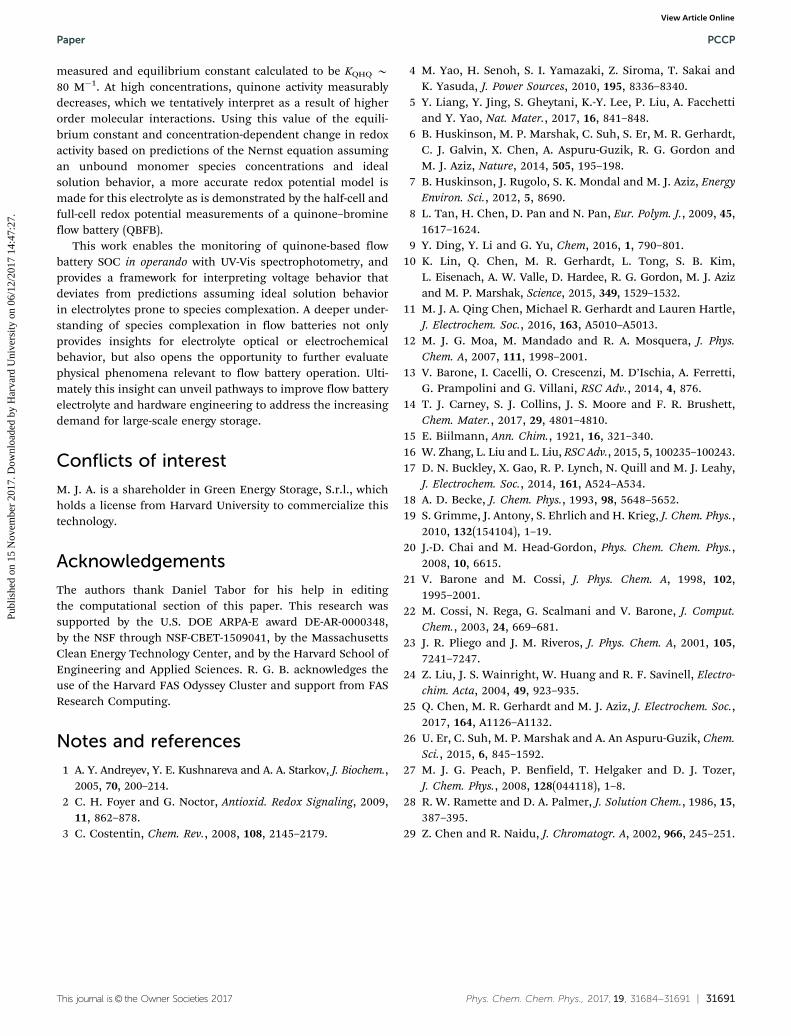
0 =KQHQ. [Q] and [HQ] can be numerically derived from eqn (6)–(8)with KQHQ = 80 M�1 from the analysis of the UV-Vis spectro-photometry measurements. The concentration vs. SOC of eachof these three species at [Q]0 = 0.2 M is shown in Fig. 5(a).
The measured Eneg vs. SOC at [Q]0 =0.2 M is plotted as blackdots in Fig. 5(b). Calculated Eneg values based on eqn (11) areplotted as solid lines. The blue curve in Fig. 5(b) assumes noquinhydrone formation and shows a steep voltage ascent ordescent close to 0% and 100% SOC but little voltage variationin the remaining SOC region. This contrasts sharply with the
measured result. The orange line instead uses the [Q] and [HQ]values shown in Fig. 5(a) applied to eqn (11). The greatlyimproved agreement between the measured Eneg, the orangeline indicates that the Q/HQ redox potential is significantlyinfluenced by the formation of QHQ.
High concentration quinone activity
To increase energy- and power-density, practical flow batteriesincorporate active electrolytes closer to their solubility limits,e.g. 1.0 M AQDS (2.0 M electrons). Fig. 6(a) shows the calculatedQHQ dimer aggregation between 0% and 100% SOC at[Q]0 = 1.0 M again with KQHQ = 80 M�1. Fig. 6(b) shows themeasured Eneg vs. SOC for this solution compared to thecalculated potential from eqn (11) with (orange line) and without(blue line) accounting for the QHQ formation. It is evident thatat this concentration, including QHQ overcorrects the negativeelectrode potential. This is because the activity of concentratedelectrolyte solutions can often be influenced by higher ordermolecular interactions. This additional deviation from theunbound monomer species concentration-corrected ideal solutionbehavior leads to small but appreciable changes in electrochemicalpotential; because of this the activity coefficients, g, again becomeimportant. For example, whereas the orange line in Fig. 6(b) showsthe calculated Eneg vs. SOC assuming that g0 is invariant, the greenline in Fig. 6(b) shows the calculated Eneg vs. SOC with the arbitraryassumption that g0 varies exponentially from 1
4 to 4 as the SOC
Table 1 Predicted and measured optical properties, predicted absorptionenergies (Eabs) and oscillator strength (f)
Solvent
o-B97XD/6-31G(d)
ExperimentalImplicit Explicit
Eabs (eV) 2.27 1.81 2.11f 0.05 0.05 0.002
Fig. 5 (a) Q, HQ and QHQ concentrations with 0.2 M [Q]0 vs. SOC.(b) Half-cell voltage vs. SOC. Black dots are experimental data measuredin the AQDS-bromide cell, Fig. 1(b), orange and blue lines are thecalculated values of Eneg with and without considering QHQ formationwith KQHQ = 80 M�1, respectively.
Fig. 6 (a) Q, HQ and QHQ concentrations with 1.0 M [Q]0 vs. SOC.(b) Half-cell voltage vs. SOC. Black dots are experimental data measuredin the AQDS-Bromide cell, Fig. 1(b), orange and blue lines are thecalculated Eneg with and without considering QHQ formation with KQHQ =80 M�1, respectively. The green line and arrows show how incorporatingchanges to the Q and HQ activity coefficients can improve the approxi-mation of the negative half-cell potential as discussed in the text.
Paper PCCP
Publ
ishe
d on
15
Nov
embe
r 20
17. D
ownl
oade
d by
Har
vard
Uni
vers
ity o
n 06
/12/
2017
14:
47:2
7.
View Article Online

31690 | Phys. Chem. Chem. Phys., 2017, 19, 31684--31691 This journal is© the Owner Societies 2017
varies from 0% to 100%. As shown in the next section, solutions tothe full-cell open circuit potential incorporating the QHQ formationonly, with g0 invariant, are sufficient for significantly improvingthe accuracy of the calculation. Observations for the high-concentration change in activity are discussed in the ESI;† a fullresolution will require further research.
Bromine electrochemistry
The above results show that the consideration of the quin-hydrone equilibrium indeed improves the voltage prediction ofthe negative side of the QBFB. To develop a complete voltageprediction for the QBFB, we need to further include theequilibrium between bromine and bromide in the posolyte.The formation of tribromide and pentabromide ions has beenthoroughly investigated in previous work.28 Assuming completedissociation of the anions from protons due to the low pKa ofHBr, the equilibria can be written as
Br� þ Br2 $KBr3
�Br3�;KBr3
� ¼ Br3�½ �
Br2½ � Br�½ � (13)
Br� þ 2Br2 $KBr5
�Br5�;KBr5� ¼
Br5�½ �
Br2½ �2 Br�½ �(14)
Similar to the quinhydrone equilibrium eqn (5), we use Kto represent the activity-coefficient corrected equilibrium con-stant. The bromine/bromide redox potential, which is thepositive terminal voltage of the QBFB, can be calculated basedon the Nernst equation
Epos ¼ E00Br þ
RT
nFln
Br2
Br�½ �2
!(15)
In the following analysis, we again start with the dilutesolution assumption. Therefore, KBr3� and KBr5� are takendirectly from dilute solution measurements to be 16.7 and
40 respectively. The formal potential, E00Br, defined by the
measured positive half-cell potential when [Br2] = [Br�], isfound to be 1.06 � 0.014 V and is closely approximated bythe Br2/Br� standard potential of 1.08 V vs. SHE. In Fig. 7(a) weplot the concentration of each bromide species vs. SOC in a
solution with starting nominal concentrations of Br2 and Br� of0.5 and 3 M. [Br�] decreases sharply with the cell SOC, which isstill defined by eqn (7) given a 1 : 1.2 negolyte to posolytevolume ratio. [Br3
�] rises and then peaks at around 80% SOC,after which [Br2] increases noticeably.
In addition to the difference between Eneg and Epos, ajunction potential Ejunc (or often called Donnan potential)across the ion selective Nafion membrane needs to be consid-ered in the full-cell OCV calculation. Because protons are thedominating charge carriers, this potential can be estimated as
Ejunc ¼RT
Fln
HþnegHþpos
!(16)
The largest value of which is 10 mV for 1 M quinone at 100%SOC. The overall cell voltage therefore is
Ecell = Epos � Eneg + Ejunc (17)
Ecell measured in a full-cell test is plotted as black dots inFig. 7(b) together with values calculated from eqn (17). The blueline represents the full-cell potential without accounting forcomplexation, the orange line includes the bromide complexa-tion only, and the green line incorporates both bromide andquinone complexation. Similar to our earlier results in the caseof half-cell potential, the measured full-cell voltage deviatesfrom the prediction of the Nernst equation based on theunbound monomer species concentration, whereas consider-ing the chemical equilibria of the two electrolytes significantlyimproves the accuracy of the analytical solution.
The general pattern of the effect that complexation has onvoltages is redistributing sharp voltage changes at low and highSOC toward intermediate SOCs, resulting in more uniformvoltage change over the whole SOC range. This effect occursbecause all complexation species incorporate the dischargedand charged species, thereby limiting their relative concen-tration changes at low and high SOCs. This phenomenon alsopersists for other flow battery chemistries, e.g. in the posolyte ofvanadium RFBs.29 The vanadium complex is found to signifi-cantly affect the electrolyte composition measurements viaUV-Vis spectrophotometry, but we are aware of no discussionabout its impact on cell voltage. This may be because the lowvalue of the equilibrium constant does not cause the voltage todeviate noticeably from theoretical values based on the unboundmonomer electrolyte composition.17 However, it is likely thatstronger association could occur with other flow battery chemis-tries, or even in vanadium systems with a different anionic species.
Conclusion
In this work, we show how quinone (Q) and hydroquinone (HQ)absolute and relative species concentration can be determinedby UV-Vis spectrophotometry assuming a linear combinationof molar attenuation based on the Beer–Lambert law. Theformation of a third species, quinhydrone (QHQ), from thedimerization of Q and HQ, is directly observed by UV-Visspectrophotometry; the QHQ molar attenuation coefficient is
Fig. 7 QBFB full cell. (a) Posolyte speciation with [HBr]0 = 3 M and [Br2]0 =0.5 M by SOC; (b) the same posolyte against a 1.0 M [Q]0 negolyte full-cellOCV vs. SOC. Black dots are experimental data. The blue line representsthe OCV by the Nernst equation without any species complexation.The orange incorporates tri- and pentabromide complexation only, andgreen incorporates tri- and pentabromide complexation in addition toquinhydrone dimer formation. It is clear that both posolyte and negolytecomplexation are critical for accurate predictions of the full-cell OCV.
PCCP Paper
Publ
ishe
d on
15
Nov
embe
r 20
17. D
ownl
oade
d by
Har
vard
Uni
vers
ity o
n 06
/12/
2017
14:
47:2
7.
View Article Online
This journal is© the Owner Societies 2017 Phys. Chem. Chem. Phys., 2017, 19, 31684--31691 | 31691
measured and equilibrium constant calculated to be KQHQ B80 M�1. At high concentrations, quinone activity measurablydecreases, which we tentatively interpret as a result of higherorder molecular interactions. Using this value of the equili-brium constant and concentration-dependent change in redoxactivity based on predictions of the Nernst equation assumingan unbound monomer species concentrations and idealsolution behavior, a more accurate redox potential model ismade for this electrolyte as is demonstrated by the half-cell andfull-cell redox potential measurements of a quinone–bromineflow battery (QBFB).
This work enables the monitoring of quinone-based flowbattery SOC in operando with UV-Vis spectrophotometry, andprovides a framework for interpreting voltage behavior thatdeviates from predictions assuming ideal solution behaviorin electrolytes prone to species complexation. A deeper under-standing of species complexation in flow batteries not onlyprovides insights for electrolyte optical or electrochemicalbehavior, but also opens the opportunity to further evaluatephysical phenomena relevant to flow battery operation. Ulti-mately this insight can unveil pathways to improve flow batteryelectrolyte and hardware engineering to address the increasingdemand for large-scale energy storage.
Conflicts of interest
M. J. A. is a shareholder in Green Energy Storage, S.r.l., whichholds a license from Harvard University to commercialize thistechnology.
Acknowledgements
The authors thank Daniel Tabor for his help in editingthe computational section of this paper. This research wassupported by the U.S. DOE ARPA-E award DE-AR-0000348,by the NSF through NSF-CBET-1509041, by the MassachusettsClean Energy Technology Center, and by the Harvard School ofEngineering and Applied Sciences. R. G. B. acknowledges theuse of the Harvard FAS Odyssey Cluster and support from FASResearch Computing.
Notes and references
1 A. Y. Andreyev, Y. E. Kushnareva and A. A. Starkov, J. Biochem.,2005, 70, 200–214.
2 C. H. Foyer and G. Noctor, Antioxid. Redox Signaling, 2009,11, 862–878.
3 C. Costentin, Chem. Rev., 2008, 108, 2145–2179.
4 M. Yao, H. Senoh, S. I. Yamazaki, Z. Siroma, T. Sakai andK. Yasuda, J. Power Sources, 2010, 195, 8336–8340.
5 Y. Liang, Y. Jing, S. Gheytani, K.-Y. Lee, P. Liu, A. Facchettiand Y. Yao, Nat. Mater., 2017, 16, 841–848.
6 B. Huskinson, M. P. Marshak, C. Suh, S. Er, M. R. Gerhardt,C. J. Galvin, X. Chen, A. Aspuru-Guzik, R. G. Gordon andM. J. Aziz, Nature, 2014, 505, 195–198.
7 B. Huskinson, J. Rugolo, S. K. Mondal and M. J. Aziz, EnergyEnviron. Sci., 2012, 5, 8690.
8 L. Tan, H. Chen, D. Pan and N. Pan, Eur. Polym. J., 2009, 45,1617–1624.
9 Y. Ding, Y. Li and G. Yu, Chem, 2016, 1, 790–801.10 K. Lin, Q. Chen, M. R. Gerhardt, L. Tong, S. B. Kim,
L. Eisenach, A. W. Valle, D. Hardee, R. G. Gordon, M. J. Azizand M. P. Marshak, Science, 2015, 349, 1529–1532.
11 M. J. A. Qing Chen, Michael R. Gerhardt and Lauren Hartle,J. Electrochem. Soc., 2016, 163, A5010–A5013.
12 M. J. G. Moa, M. Mandado and R. A. Mosquera, J. Phys.Chem. A, 2007, 111, 1998–2001.
13 V. Barone, I. Cacelli, O. Crescenzi, M. D’Ischia, A. Ferretti,G. Prampolini and G. Villani, RSC Adv., 2014, 4, 876.
14 T. J. Carney, S. J. Collins, J. S. Moore and F. R. Brushett,Chem. Mater., 2017, 29, 4801–4810.
15 E. Biilmann, Ann. Chim., 1921, 16, 321–340.16 W. Zhang, L. Liu and L. Liu, RSC Adv., 2015, 5, 100235–100243.17 D. N. Buckley, X. Gao, R. P. Lynch, N. Quill and M. J. Leahy,
J. Electrochem. Soc., 2014, 161, A524–A534.18 A. D. Becke, J. Chem. Phys., 1993, 98, 5648–5652.19 S. Grimme, J. Antony, S. Ehrlich and H. Krieg, J. Chem. Phys.,
2010, 132(154104), 1–19.20 J.-D. Chai and M. Head-Gordon, Phys. Chem. Chem. Phys.,
2008, 10, 6615.21 V. Barone and M. Cossi, J. Phys. Chem. A, 1998, 102,
1995–2001.22 M. Cossi, N. Rega, G. Scalmani and V. Barone, J. Comput.
Chem., 2003, 24, 669–681.23 J. R. Pliego and J. M. Riveros, J. Phys. Chem. A, 2001, 105,
7241–7247.24 Z. Liu, J. S. Wainright, W. Huang and R. F. Savinell, Electro-
chim. Acta, 2004, 49, 923–935.25 Q. Chen, M. R. Gerhardt and M. J. Aziz, J. Electrochem. Soc.,
2017, 164, A1126–A1132.26 U. Er, C. Suh, M. P. Marshak and A. An Aspuru-Guzik, Chem.
Sci., 2015, 6, 845–1592.27 M. J. G. Peach, P. Benfield, T. Helgaker and D. J. Tozer,
J. Chem. Phys., 2008, 128(044118), 1–8.28 R. W. Ramette and D. A. Palmer, J. Solution Chem., 1986, 15,
387–395.29 Z. Chen and R. Naidu, J. Chromatogr. A, 2002, 966, 245–251.
Paper PCCP
Publ
ishe
d on
15
Nov
embe
r 20
17. D
ownl
oade
d by
Har
vard
Uni
vers
ity o
n 06
/12/
2017
14:
47:2
7.
View Article Online