uva-dare (digital academic repository) services … new middle class in mumbai ..... 143...
TRANSCRIPT

UvA-DARE is a service provided by the library of the University of Amsterdam (http://dare.uva.nl)
UvA-DARE (Digital Academic Repository)
Services-driven growth and India’s changing socio-economic fabric
Krishnan, S.
Link to publication
Citation for published version (APA):Krishnan, S. (2017). Services-driven growth and India’s changing socio-economic fabric: Emergence of a newmiddle class and the contribution of Mumbai’s IT-eS industry to its formation
General rightsIt is not permitted to download or to forward/distribute the text or part of it without the consent of the author(s) and/or copyright holder(s),other than for strictly personal, individual use, unless the work is under an open content license (like Creative Commons).
Disclaimer/Complaints regulationsIf you believe that digital publication of certain material infringes any of your rights or (privacy) interests, please let the Library know, statingyour reasons. In case of a legitimate complaint, the Library will make the material inaccessible and/or remove it from the website. Please Askthe Library: http://uba.uva.nl/en/contact, or a letter to: Library of the University of Amsterdam, Secretariat, Singel 425, 1012 WP Amsterdam,The Netherlands. You will be contacted as soon as possible.
Download date: 28 Jun 2018

SERVICES-DRIVEN GROWTH AND INDIA’S CHANGING SOCIO-ECONOMIC FABRICEmergence of a New Middle Class and the Contribution of Mumbai’s IT-eS Industry to its Formation
Sandhya Krishnan


SERVICES-DRIVEN GROWTH AND INDIA’S CHANGING SOCIO-ECONOMIC FABRIC
Emergence of a New Middle Class and the
Contribution of Mumbai’s IT-eS Industry to its Formation
Sandhya Krishnan

This research has benefitted from the financial support of the Netherlands Organisation for Scientific Research- Science for Global Development (NWO-WOTRO), grant number W01.65.329.00. It was also supported by the Amsterdam Institute for Social Science Research (AISSR), Universiteit van Amsterdam.
© 2017 Sandhya Krishnan. All rights reserved. No part of this publication may be reproduced, stored in a retrieval system, or transmitted, in any form or by any means, electronic, mechanical, photocopying, recording or otherwise, without the written permission by the author.
Design, Layout and Print: Mind Design
Cover Photos: Neeraj Hatekar
ISBN: 978-90-78862-30-7

SERVICES-DRIVEN GROWTH AND INDIA’S
CHANGING SOCIO-ECONOMIC FABRIC Emergence of a New Middle Class and the
Contribution of Mumbai’s IT-eS Industry to its Formation
ACADEMISCH PROEFSCHRIFT
ter verkrijging van de graad van doctor
aan de Universiteit van Amsterdam
op gezag van de Rector Magnificus
prof. dr. ir. K. I. J. Maex
ten overstaan van een door het College voor Promoties ingestelde commissie,
in het openbaar te verdedigen in de Agnietenkapel
op woensdag 6 december 2017, te 12:00 uur
door
Sandhya Krishnan
geboren te Mumbai, India

Promotiecommissie
Promotor: prof. dr. R. C. Kloosterman Universiteit van Amsterdam
Copromotor: dr. N. P. C. Beerepoot Universiteit van Amsterdam
prof. dr. N. R. Hatekar University of Mumbai
Overige Leden: prof. dr. J. M. Bavinck Norges Arktisk Universitet, Tromso
prof. dr. P. Knorringa Erasmus Universiteit, Rotterdam
dr. G. Nooteboom Universiteit van Amsterdam
dr. N. R. M. Pouw Universiteit van Amsterdam
prof. dr. P. Raghuram The Open University, Milton Keynes
Faculteit der Maatschappij- en Gedragswetenschappen

Table of Contents
List of Tables .................................................................................................................... i
List of Figures ................................................................................................................. ii
List of Abbreviations and Symbols ........................................................................... iv
Acknowledgements ......................................................................................................... v
Chapter 1 | Introduction ................................................................................................. 1
1.1 Introduction .............................................................................................................. 1
1.2 Research significance .............................................................................................. 7
1.3 The offshore-service industry in India: Emergence and evolution ........... 11
1.4 Research questions ................................................................................................15
1.5 Chapter scheme ......................................................................................................16
Chapter 2| Theoretical Conceptualisation: Applying Bourdieu’s Forms of Capital to Understand New Middle Class Formation in India .......................19
2.1 Introduction ............................................................................................................19
2.2 Bourdieu’s forms of capital .................................................................................21
2.3 The middle class in India .....................................................................................23
2.4 Enigma around the new middle class ...............................................................27
2.5 Operationalising the concept of the new middle class ................................. 32
2.6 Concluding remarks ..............................................................................................35
Chapter 3| Research Methods .............................................................................37
3.1 Introduction ............................................................................................................37
3.2 The NSS Household Consumer Expenditure Survey ................................... 38
3.3 Data on IT-eS employees .....................................................................................45
3.4 Semi-structured interviews ................................................................................46
3.5 Primary survey .......................................................................................................48
3.6 Research site location - Mumbai .......................................................................50
3.7 Research ethics and limitations of the study .................................................56
Chapter 4| Expansion of the Middle Class in India and its Changing Consumption Patterns ............................................................................................59
4.1 Introduction ............................................................................................................59
4.2 Expanding consumption expenditure in India ...............................................61
4.3 Economic definitions of the middle class and their estimates- A critical review .......................................................................65
4.4 Estimating middle class size ...............................................................................71
4.5 Regional distribution of the middle class .......................................................81
4.6 Changing spending patterns ..............................................................................85
4.7 Asset ownership of the middle class ................................................................90 4.8 Conclusion ..............................................................................................................95
Chapter 5 | Structure of the Middle Class: An Analysis of its Education, Employment and Ethnic Composition ..............................................................101
5.1 Introduction ..........................................................................................................101
5.2 Middle class and education ...............................................................................103
5.3 Occupational structure .......................................................................................106
5.4 Ethnic composition of the middle class ........................................................111
5.5 Conclusion ............................................................................................................116
Chapter 6 | Access to Employment Opportunities in Mumbai’s IT-eS Industry and its Implications for the Formation of a New Middle Class...121
6.1 Introduction ..........................................................................................................121
6.2 Employment opportunities in the offshore-service industry- A review of existing debates ............................................................................123
6.3 Operationalisation of the concept ‘pre-existing middle class’ .................126
6.4 Class backgrounds of IT-eS workers .............................................................128
6.5 What causes the urban middle class bias? ....................................................132
6.6 Conclusion ............................................................................................................139

Chapter 7 | How the IT-eS Industry Contributes to the Formation of a Consumerist New Middle Class in Mumbai .....................................................143
7.1 Introduction ..........................................................................................................143
7.2 The consumerist new middle class .................................................................145
7.3 Data ........................................................................................................................148
7.4 New middle class consumption ........................................................................149
7.5 IT-eS industry as a long term career option ................................................164
7.6 Conclusion ............................................................................................................169
Chapter 8 | Conclusion ........................................................................................173
8.1 Key findings of the research ............................................................................174
8.2 Implications of the research findings ............................................................183
8.3 Policy recommendations ....................................................................................189
8.4 Avenues for further research ............................................................................191
8.5 Final remarks .......................................................................................................197
References ...............................................................................................................199
Appendix .................................................................................................................213
A3.1 Table: Summary of Interviews Conducted for the Research ...............213
A3.2 Survey Questionnaire Answered by IT-eS Employees in Mumbai ......216
A4.1 Table: Size of Different Classes in India (%) ............................................229
A4.2 Table: State-wise Size of Middle Class Population (%) ..........................230
A4.3a Table: Average Share of Consumption Expenditure on Different Item Groups, India (%) ...........................................................231
A4.3b Table: Average Share of Consumption Expenditure on Different Item Groups, Rural India (%) ......................................................232
A4.3c Table: Average Share of Consumption Expenditure on Different Item Groups, Urban India (%) ....................................................233

A4.4a Table: Ownership of Consumer Assets across Classes, India (%) .......234
A4.4b Table: Ownership of Consumer Assets across Classes, Rural India (%) .................................................................................................234
A4.4c Table: Ownership of Consumer Assets across Classes, Urban India (%) ..............................................................................................235
A5.1a Table: Class-wise Distribution of Literacy Level of Household Heads, India (%) ..........................................................................236
A5.1b Table: Class-wise Distribution of Literacy Level of Household Heads, Rural India (%) ..............................................................237
A5.1c Table: Class-wise Distribution of Literacy Level of Household Heads, Urban India (%) .............................................................238
A5.2a Table: Class-wise Distribution of Primary Industry of Occupation of Households- Rural India (%) .............................................239
A5.2b Table: Class-wise Distribution of Primary Industry of Occupation of Households- Urban India (%) ............................................242
A5.3a Table: Class distribution across castes and religions, India (%) .............................................................................................................245
A5.3b Table: Class distribution across castes and religions, Rural India (%) .................................................................................................247
A5.3c Table: Class distribution across castes and religions, Urban India (%) ................................................................................................249
English Summary ..................................................................................................252
Nederlandse Samenvatting ..................................................................................257

i
List of Tables
Table 1.1 Overview of the Main Chapters ................................................................ 17
Table 2.1 Different Conceptualisations of the New Middle Class ...................... 31
Table 2.2 Operationalisation of the Concept of New Middle Class Based on Bourdieu’s Forms of Capital .................................................... 34
Table 3.1 Sample Summary ........................................................................................... 48
Table 3.2 Respondents’ Job Profile .............................................................................. 49
Table 4.1 Compound Annual Growth Rate of Real Daily Per Capita Consumption Expenditure across Deciles .............................................. 62
Table 4.2 Daily Per Capita Consumption Expenditure Range for Different Classes in India Using the Banerjee-Duflo Definition ......................... 72
Table 6.1 Factors Determining Employment in the IT-eS Industry .................. 135
Table 7.1 Why Workers Join the IT-eS Industry .................................................... 153
Table 7.2 Reasons for Short-Term Employment in the IT-eS Industry ............ 165

ii
List of Figures
Figure 3.1 IT and IT-eS Firms in Mumbai Metropolitan Region (MMR) ..... 53
Figure 4.1 Daily Average Per Capita Consumption Expenditure across Expenditure Deciles, India ...................................................................... 63
Figure 4.2 Daily Average Per Capita Expenditure across Expenditure Deciles, Rural India ................................................................................... 64
Figure 4.3 Daily Average Per Capita Consumption Expenditure across Expenditure Deciles, Urban India ......................................................... 64
Figure 4.4 Size of Different Classes in India .......................................................... 74
Figure 4.5 Size of Different Classes within the Middle Class, India ................ 75
Figure 4.6 Size of Different Classes in Rural India ............................................... 76
Figure 4.7 Size of Different Classes in Urban India ............................................. 77
Figure 4.8 Middle Class Size by Different Definitions, India .............................. 80
Figure 4.9 Middle Class Size by Different Definitions, Rural India .................. 80
Figure 4.10 Middle Class Size by Different Definitions, Urban India ................. 81
Figure 4.11 State-Wise Share of Middle Class in Total State Population, India, 2004-05 ............................................................................................. 83
Figure 4.12 State-Wise Share of Middle Class in Total State Population, India, 2011-12 ............................................................................................. 84
Figure 4.13 Average Expenditure Share on Various Item Groups, India ........... 86
Figure 4.14 Ownership of Personal Vehicles, India ................................................ 91
Figure 4.15 Ownership of Household Appliances, India, 2004-05 ...................... 93
Figure 4.16 Ownership of Household Appliances, India, 2011-12 ...................... 93
Figure 4.17 Ownership of Modern, Technology-Driven Assets, India, 2011-12 ............................................................................................. 95

iii
Figure 5.1 Class-Wise Distribution of Highest Level of Literacy, India, 2004-05 ............................................................................................. 105
Figure 5.2 Class-Wise Distribution of Highest Level of Literacy, India, 2011-12 ............................................................................................. 105
Figure 5.3 Employment Distribution of Middle Class Households, Rural India ................................................................................................... 108
Figure 5.4 Employment Distribution of Middle Class Households, Urban India ................................................................................................. 108
Figure 5.5 Class Distribution across Caste and Religious Groups, India, 2004-05 ............................................................................................. 114
Figure 5.6 Class Distribution across Caste and Religious Groups, India, 2011-12 ............................................................................................. 114
Figure 6.1 Presence of IT and IT-eS Firms across India .................................... 132
Figure 7.1 Kernel Density Estimation of Consumption Expenditure Distribution of Mumbai’s IT-eS Employees (N=307) ..................... 150
Figure 7.2 Kernel Density Estimation of Income Distribution of Mumbai’s IT-eS Employees (N=307) .............................................. 152
Figure 7.3 Median Share of Consumption Expenditure of IT-eS Employees on Various Item Groups (N=269) .................................... 156

iv
iv
List of Abbreviations and Symbols ADB Asian Development Bank
AfDB African Development Bank
BPM Business Process Management
BPO Business Process Outsourcing
CES Consumer Expenditure Survey
CPI Consumer Price Inflation
CPI-AL CPI- Agricultural Labourers
CPI-IW CPI- Industrial Workers
CSDS Centre for the Study of Developing Societies
FSU First Stage Unit
GDP Gross Domestic Product
HR Human Resource
ISIC International Standard Industrial Classification
IT Information Technology
IT-eS Information Technology- enabled Services
KPO Knowledge Process Outsourcing
MMR Mumbai Metropolitan Region
MPCE Monthly Per Capita Consumption Expenditure
MRP Mixed Reference Period
NASSCOM National Association of Software and Services Companies
NCAER National Council for Applied Economic Research
NCR National Capital Region
NIC National Industrial Classification
NSS National Sample Survey
OBC Other Backward Classes
PPP Purchasing Power Parity
SC Scheduled Caste
ST Scheduled Tribe
STPI Software and Technology Parks of India
URP Uniform Reference Period
USU
` $
Uniform Stage Unit
Indian Rupee
US Dollar

v
v
Acknowledgements
Many individuals have contributed in different capacities in helping me successfully
complete this PhD thesis. I have been extremely fortunate to be guided by an excellent
team of supervisors, who have in various ways brought out the best of my abilities as a
researcher. Niels Beerepoot has been a sincere, dedicated and patient supervisor. He has
meticulously read several drafts of the different chapters of this thesis and his feedback
has significantly improved this work. Also, he has often gone beyond his role as a
supervisor, in helping me (and my colleagues) acclimate to life in a foreign country. Be it
receiving us at the airport on our first visit to the Netherlands, sharing pictures in advance
of the apartment we would live in during our stay there, or sending Christmas sweets to
India, his ways of expressing concern and affection have been very touching. It is difficult
to express in words my gratitude to my local supervisor Neeraj Hatekar. He has made me
push my limits and come up with work that I could otherwise have not imagined to do on
my own. His ideas gave a new direction to this thesis and helped shape this research in an
innovative way. He has in general kindled in me a passion for research and for playing with
numbers. My promoter Robert Kloosterman has been very encouraging and appreciative.
His comments have helped refine the finer points of this thesis. Besides my supervisors, I
have also greatly benefitted from the comments of Bart Lambregts, whose critical
observations and a keen eye for details made me think through many of the arguments and
improve upon them.
This study would not have seen the light of the day without the co-operation of the many
interview and survey respondents. Research ethics do not allow me to name the
respondents, but I am indebted to each of them for having taken out time from their erratic
work schedules to patiently and candidly speak to a stranger. The nature of functioning of
the offshore-services industry had made getting access to respondents extremely difficult.
I am grateful to R Chandrashekar, Dulari Deshpande, Lalitha, Neeraj Hatekar, Parshuram
Subramanian, Rajani Mathur, Randhir Kumar, Renita D’Souza, Siddharth Kalro, Sneha
Gouniyal and Sonali Prabhu for introducing me to potential respondents. I sincerely
appreciate the efforts of Pallavi Belhekar and Mayank Gupta in providing assistance with
the data analysis for this research; and of Kabir Agarwal in producing GIS graphics. I am

vi
vi
also thankful to the Secretariat at the University of Amsterdam, especially to Puikang Chan,
for efficiently handling administrative issues.
The PhD journey can often be mentally draining, but I was lucky to have well-wishers who
enabled me to sail through it successfully. Rajani Mathur has at all times been a patient
listener to my often trivial complaints about things related and unrelated to the PhD. Her
love and affection have enriched me as a person. Shoba Ghosh has been a constant moral
support and guide, whose positivity and wisdom helped me overcome the dull moments of
the PhD. Bhavna Jaisingh has been a wonderful friend, without whose constant nudging, I
would have perhaps not applied for this PhD position. She guided me throughout the
application process, diligently read and improved upon drafts of my writing samples
required for the application of this position. Her objective and sincere assessments of
situations have immensely helped me on both personal and professional fronts. Rajni
Sharma and Vanessa Vroon were also very encouraging; their tips from their own PhD
experiences helped me focus on my work.
I could not have asked for a better group of project-colleagues than Jana Kleibert, Leian
Marasigan and Randhir Kumar. While Randhir kept us entertained with his funny one-
liners, Leian was always a good house-mate to have in Amsterdam, and Jana’s witty
remarks and academic experiences were a pleasure to listen to. The research-friendly
atmosphere and resources at the Vibhooti Shukla Centre of the University of Mumbai
played a vital role in helping me work on my thesis with ease. The company of friends like
Akshata Salvi, Bhavesh Salunkhe, Kadambari Chheda, Linette Lopez and Rashmi Singh at
the Centre helped a great extent in making my work hours less monotonous. Busarin
Lertchavalitsakul, Ines Faria, Ivan Clemente, Jofelle Tesorio, Johny Stephen, Lola Salès, Tara
Saharan and Vanessa Vroon made my stay in Amsterdam and elsewhere in Europe easier
in multiple ways.
Finally, I owe a lot in my life to my family- my parents and my sister. I would not have
reached this far without their unconditional care and support. They have been extremely
patient with and understanding of my PhD journey, silently rendering support in all
possible ways.


1
Chapter 1| Introduction
1.1 Introduction
It is well past 20:00 hours on a Friday, but there are at least 40 young men and women,
seated in this spacious office, dressed in Indian or western semi-formal attire, with their
identity cards hanging around their necks. Two or three of them are sharing a cubicle,
busy clicking the mouse and staring at their computer screens. Some of them are seated
facing a wall lined with clocks, each displaying the current local time of a different city-
New York, London, Mumbai, Singapore and Sydney. I am told that the young employees
are working for the London market. Further to the right of these cubicles, are closed-door
cabins, belonging to managers of these young workers. As I walk a few steps ahead, to the
left, I encounter another set of cubicles, with over a dozen other young men and women
doing tasks similar to that of the first group. Further straight, I am pleasantly surprised to
see another group of youngsters play a match of table-tennis. Further left from the table-
tennis court, is a busy cafeteria, with well-dressed attendants, serving Indian, Chinese and
continental food. There appears to be an equal demand for all types of cuisines on offer. I
manage to discreetly click a few pictures of different pockets of the office. But in a few
minutes I am warned by an irate security guard against using my camera inside the office
premises. I abide and walk towards the exit.
My chance visit to this back-office of an international bank located in the south of
Mumbai occurred because of my friend who worked in the same organisation, in
an earlier shift catering to the Singapore market. On that day, she had to get back
to her office to collect her mobile-phone that she happened to leave behind there. I
grabbed the opportunity to accompany her to see the working inside one of the
many back-offices of international banks that have mushroomed in various cities
of India, radically changing the outlook of these cities and reshaping the
international image of the country. These back-offices are part of the larger
Chapter 1| Introduction
2
offshore-service industry, which is seen as the most iconic manifestation of the
economic transformation that India is undergoing from the late 1980s onwards.
Initially the industry was dominated by Information Technology (IT) services,
but over the years the type and scale of services offshored to India have expanded
to include IT-enabled services (IT-eS), also known as Business Process
Outsourcing (BPO) and Knowledge Process Outsourcing (KPO). The industry
has transformed work places and the work culture of young, urban Indians,
providing them with employment opportunities that were previously unknown.
Working in international time-zones, interacting with clients located abroad,
adapting to their professional practices are some of the characteristic features of
workers of the offshore-service industry. The industry in turn offers its employees
an international work ambience and a fairly high remuneration. Consequently,
these workers tend to internalise the international professional and lifestyle
practices, allegedly, leading to enduring changes in their own consumption habits
and lifestyles (J. Murphy, 2011). In this light, many studies attribute the offshore-
service industry to have contributed to the formation of a “new middle class”
(Fernandes, 2006; Fuller & Narasimhan, 2007; J. Murphy, 2011; Upadhya, 2009).
This thesis contributes to this body of research on the offshore-service industry in
India and its role in the formation of a new middle class.
Although the most symbolic one, offshore-service industry workers are only a
part of the larger new middle class in India (see Fernandes, 2006; Upadhya, 2008,
2009). To gain a more comprehensive understanding of the emergence of the new
middle class and the contribution of the offshore-service industry to the formation
of the class, this thesis first studies the general expansion of the middle class and
the emergence of a new middle class in India. This is followed by an examination
of how the processes in the offshore-service industry specifically contribute to a
new middle class formation. Within the offshore-service industry, the thesis takes
the case of IT-eS workers located in the city of Mumbai. Mumbai is the financial
Chapter 1

3
capital of the country and globally ranks third as the most attractive service
offshoring destination (Tholons, 2014).
The following sub-sections explain the motivation for this research and describe
the study set-up. Section 1.2 brings out the relevance of this research in the
context of globalisation, development and class formation. This is followed with a
description of the emergence and significance of the offshore-service industry in
India. Sections 1.4 and 1.5 respectively present the main research questions and
chapter layout of this thesis.
1.1.1 Motivation for research
Since the beginning of the twenty-first century, middle classes in the US and
other western countries have shrunk in size and fallen backward in income and
wealth (Birdsall, 2016; Pew Research Center, 2012). Simultaneously, economic
and political power is shifting towards emerging market economies in Asia, Africa
and South America, which are witnessing an unprecedented expansion in the size
of their middle classes and an increase in their level of income and consumption
(ADB, 2010; AfDB, 2011; Birdsall, 2016; Cavusgil & Buckley, 2016; Kharas, 2010;
Wilson & Dragusanu, 2008). According to Birdsall (2016), the birth of these new
middle classes qualifies as a triumph of capitalism and globalisation. Milanovic
(2016) shows that the years between 1988 and 2008 have been the most
globalised for the world and that this period has most benefitted people in the
middle of the income distribution living mainly in developing Asia, particularly in
India and China. After the 2008 recession, while consumer demand from the
western middle classes has been stagnating, middle classes in countries such as
India and China are playing a key role in rebalancing the world economy.
Consumer demand from the latter continues to be robust, driven mainly by their
middle classes (ADB, 2010; Wilson & Dragusanu, 2008). Moreover, these middle
classes are not only expanding quantitatively, but are also qualitatively
Introduction
4
converging towards the western middle classes in terms of their consumption
practices and lifestyles (Fernandes, 2006; Guarín & Knorringa, 2014; Pinches,
1999). This thesis draws its motivation from such studies on the formation of a
new middle class in the Global South, especially in India, enabled by
contemporary forces of service-driven globalisation.
The Indian economy opened up to global market forces with the adoption of its
new economic policy of liberalisation and globalisation in the year 1991. The
forces of globalisation in India have manifested most prominently in the form of
the offshore-service industry, wherein service tasks from developed countries
have been transferred to countries such as India, where there is sufficient
availability of skilled manpower at a relatively low cost. It hence becomes
pertinent to study how the offshore-service industry has contributed to the
expansion of the middle class and to the formation of a new middle class in India.
This research is relevant to understand the socio-economic impact of service-
sector driven globalisation via new social class formations in countries that are
benefitting from it. More generally, this research adds to a deeper understanding
of the developmental impact of the rise of the offshore-service sector in the Global
South by examining the creation and access to new employment opportunities
brought about by globalisation along with its socio-economic impact on its direct
beneficiaries and on the society at large (see for example, Lambregts, Beerepoot &
Kloosterman, 2016; Raychaudhuri & De, 2012).
Research on the precise contribution of the offshore-service industry to a new
middle class formation in India is quite sparse. Fernandes (2006), in her extensive
study on the new middle class in India shows how the processes of liberalisation
and globalisation have led to the formation of a consumption-oriented new middle
class. Given the global orientation of the offshore-service industry (as illustrated
in p.1), it is possible that workers in the industry have greater exposure to
Chapter 1

5
international lifestyles and consumption practices than the rest of the society,
making them the frontrunners in terms of changing patterns of consumption and
lifestyles. The nature of the new middle class created by the offshore-service
industry in particular, and that by liberalisation and globalisation in general, may
hence vary significantly, which studies such as that by Fernandes (2006) do not
capture. Research on the offshore-service industry often begins with the assertion
that the industry has contributed to a new middle class formation, without
questioning why these workers may be identified as the new middle class (see for
example, Fuller & Narasimhan, 2007; Upadhya, 2008). Furthermore, these studies
reflect little upon the processes within the industry that enable the workers to
become new middle class. Also, studies on the offshore-service industry generally
concentrate only on IT workers (Fuller & Narasimhan, 2007; Upadhya, 2008).
The IT-eS segment of the offshore-service industry is relatively new, which has
not been dealt with in detail so far.
Another critical limitation in existing literature is the lack of clarity on what is
new about the new middle class. At least three different conceptualisations of the
new middle class can be identified based on extant studies (see Chapter 2 for a
further elaboration of the debates surrounding the concept of the new middle
class).
(1) Research in the international sphere define the new middle class as that
unprecedented phenomenon that has occurred in developing economies over the
last two or three decades, wherein the poor have substantially shrunk in numbers
and the size of the middle class has consequently expanded (ADB, 2010; Birdsall,
2016; Wietzke & Sumner, 2014). According to these studies, the global middle
class now has new members from developing economies, who are rapidly
replacing the middle classes from the advanced economies.
Introduction

6
(2) Related to the first view of the new middle class, the second view, in the
specific context of the Indian society, defines the new middle class as one that
signifies the disintegration of the Indian caste system, wherein many people from
historically socially disadvantaged backgrounds have reaped the benefits of
economic growth and entered the middle class (Jaffrelot & van der Veer, 2008;
Sheth, 1999).
(3) Finally, the new middle class is also looked upon as a class that has benefitted
from global capitalism and consequently become more affluent, adopted new
forms of lifestyles and consumption practices and become a transnational class
(Fernandes, 2006; Pinches, 1999; Upadhya, 2009). In the Indian context, this
strand of literature claims that the new middle class is essentially urban and
upper-caste oriented, in stark contrast to the previous understanding of the
Indian new middle class.
These diverse conceptualisations of the new middle class also indicate there is
little clarity over issues such as whether the new middle class is a segment within
the larger middle class; whether it consists of members who were not a part of the
erstwhile middle class or whether it primarily consists of segments of the pre-
existing middle class who have taken up new consumption practices and lifestyles
because of their exposure to western culture, thanks to globalisation. In other
words, there is significant ambiguity on the characteristics that make the new
middle class “new”.
1.1.2 Study set-up
This thesis addresses these gaps in the existing literature by first interrogating
what is really knew about the twenty-first century Indian middle class. To
achieve this end, the first part of the thesis (chapters 4 and 5), based on the
National Sample Survey (NSS), a national level dataset on household consumer
expenditure, studies the expansion of the middle class in India between 1999-00
Chapter 1

7
and 2011-12. Drawing from the different existing conceptualisations of the new
middle class discussed above, these chapters explore how the middle class in India
has quantitatively expanded and how its consumption patterns and social
composition have changed during the period under analysis. The second part of
the thesis (chapters 6 and 7), drawing on primary field data collected between
2012 and 2014 in Mumbai, examines the contribution of the offshore-service
industry to a new middle class formation. Chapter 6 investigates how the industry
enables erstwhile non-middle class members and other disadvantaged social
groups to access its (economically attractive) employment opportunities and enter
the middle class, thus contributing to an expansion in the size of the middle class
and in diversifying its social composition. Chapter 7 studies the processes through
which the industry brings about changes in the consumption practices and
lifestyles of its employees. As observed earlier, most of the existing studies on the
offshore-service industry in India focus on the IT segment, while this study takes
the case of the IT-eS industry in Mumbai. The latter segment demands a separate
focus, because unlike IT, employment in the IT-eS industry does not necessarily
require a professional educational qualification. This makes employment
opportunities in the industry and consequent membership to the middle class
potentially open to a wider segment of the society. Where ever relevant, the study
makes comparisons with existing empirical evidence on IT workers.
1.2 Research significance
This research primarily contributes to the field of international development
studies in the context of service sector globalisation and the formation of a new
middle class. It analyses developmental outcomes of service sector globalisation in
a country that is its biggest beneficiary (Dossani & Kenney, 2007, 2009;
Friedman, 2006). Within the broader debate on service sector driven growth (see
Ghani & O’Connell, 2014; Kloosterman, Beerepoot & Lambregts, 2016), this study
Introduction

8
concentrates on how the offshore-service industry contributes to development in
India in a socio-economic sense via the creation of a new middle class.
Implications of middle class expansion for development
As mentioned in the preceding section, there is considerable empirical evidence
that globalisation has contributed to the expansion of the middle classes in
developing countries, particularly in India and China. A large middle class has
important implications for economic, political and social development of a society.
Birdsall (2010, 2016) asserts that a large middle class is indispensable to sustained
economic and political growth. Similarly, Easterly (2001) finds a significant and
positive relationship between a large middle class and higher growth, more
education, better health, better infrastructure, more political stability and more
social modernisation. Banerjee & Duflo (2008) view the middle class as the
primary source of vital inputs for the entrepreneurial class. According to Doepke
& Zilibotti (2008), their emphasis on human capital accumulation and savings
makes the middle class central to the process of capitalist accumulation. Besides
these, the middle class is increasingly considered vital for driving consumer
demand (Birdsall, 2010). Kharas (2010) argues that elasticity of income of the
middle class being greater than one makes them demand a range of consumer
goods and services at that level of income. K. M. Murphy, Shleifer & Vishny
(1989) show that unlike the very rich who demand imported luxuries, the middle
class, as consumers of mass production of domestic goods promote
industrialisation and growth in their own country. As already mentioned, in the
present times, when consumer demand from the western middle classes is
stagnant, growth of middle classes in countries like India has become important
also for driving global consumption (ADB, 2010; Kharas, 2010; Wilson &
Dragusanu, 2008). In the Indian context, where class is generally equated with
caste and the middle class is associated with upper-caste (Beteille, 2007), an
expansion of middle class size will potentially entail upward mobility of the lower
castes, as the latter become a part of the burgeoning middle class.
Chapter 1

9
If the offshore-service industry entails an expansion of the existing middle class
by providing employment opportunities to the low income groups and by
enabling them to enter the middle class, it would have important implications for
economic and social development. Besides, evidence in favour of higher
consumption among offshore-service workers will further strengthen the role of
the middle class in driving consumption. However, existing evidence on the
offshore-service industry in India shows that while the industry contributes to a
new middle class formation, its inherent nature of high-skill work accentuates
existing class inequalities rather than diminishing them (D'Costa, 2011; Dreze &
Sen, 2013; Raychaudhuri & De, 2012). This contradicts studies such as those by
Milanovic (2016) and Birdsall (2016), which find a positive association between
globalisation and middle class expansion. Such ambiguities demonstrate the
necessity for further research on this subject.
By first looking at the general expansion of the middle class and emergence of the
new middle class in India in the age of globalisation, this research establishes how
globalisation has contributed to a new middle class in India. Second, the
investigation on who has access to employment opportunities in the offshore-
service industry brings to light whether the industry benefits only a small section
of the existing middle class, or enables erstwhile non-middle class members to
move up the class ladder and enter the middle class. These results will have
important implications on whether globalisation and a service-sector led
development trajectory promote equality or widen existing class inequalities (see
for example, Lambregts et al., 2016; Raychaudhuri & De, 2012). Finally, by
studying the qualitative changes in the lifestyles and consumption practices of the
workers, the research shows how globalisation has enabled the emergence of a
new middle class that converges with the global middle class not only in terms of
Introduction

10
incomes, but also in the cultural realm (see for example, Guarín & Knorringa,
2014; Pinches, 1999).
Class theories
Another contribution of this thesis lies in the area of class studies. Class theories
have evolved over time to reflect the increasing complexities of society. While
Marx theorised society in terms of two classes based on their relationship to the
means of production, contemporary theories such as that by Bourdieu (1986) have
incorporated more dimensions such as consumption and symbolic capital into
class. Empirical studies now not only recognise the existence of a middle class,
but different segments are differentiated within the middle class itself (Banerjee &
Duflo, 2008; Sridharan, 2004). Based on Bourdieu’s class analysis, a recent study
by Savage et al. (2013) identified the existence of seven different classes in Great
Britain. This research, by studying the emergence of a new middle class in India
adds to a more refined understanding of the formation of new social classes as
different types of professions emerge in the backdrop of globalisation (Fernandes,
2006; Savage et al., 2013).
Significance for policy makers and private firms
The emergence of a new middle class and expansion in consumer demand has
important implications for both policy makers and private manufacturers. A
greater demand for education, better health and infrastructure facilities that arise
from a larger middle class implies that policy makers must ensure adequate
supply of such public goods. Countries where middle classes are burgeoning are of
special interest to multi-national firms and domestic manufacturers, as they have
new and larger markets to sell their produce (Ablett, Baijal, Beinhocker & Bose,
2007; Farrell, Gersch & Stephenson, 2006; Fernandes, 2000). Moreover, as
consumption practices change and there arises demand for newer products, firms
ought to innovate to meet the changes in demand.
Chapter 1

11
Thesis in a larger context
This thesis is part of a larger project titled ‘Understanding the current wave in
globalisation: the segmented outcomes of offshore-service sector development in India and
the Philippines’, funded by the Netherlands Organisation for Scientific Research
(grant number W01.65.329.00). The project is divided into four PhD research
subjects, each of which deal with a related, yet different issue of the impacts of the
offshore-service industry in Mumbai and Manila. Project 1, using a Global
Production Network approach studies the emergence, evolution and
developmental impact of the offshore-service sector in the Philippines, with a
limited comparative analysis with the Indian case (Kleibert, 2015). Project 2
studies the segmented labour market outcomes of the industry in the Philippines,
focusing on long term career prospects of the workers (Marasigan, 2016). The
current research is the third project, which studies the contribution of the
industry to a new middle class formation in India. Project 4 deals with indirect
employment opportunities created by the industry in India, focusing on economic
and social upgrading of local firms and workers in Mumbai (Kumar, 2016).
Together these four projects facilitate the understanding of various
developmental outcomes of contemporary processes of globalisation, that is, the
offshore-service industry, in the recipient countries of India and the Philippines
(see Lambregts et al., 2016).
1.3 The offshore-service industry in India: Emergence and
evolution
The offshore-service industry represents the latest form of globalisation, where
services are traded across countries. Baldwin (2006, 2016) describes the process of
globalisation as two consecutive unbundling(s). The first unbundling occurred
when countries exchanged finished goods or intermediate inputs with each other.
Here, most goods were produced in a single location, as it was both uneconomic
Introduction

12
and difficult to fragment the production process across different locations. But
revolutionary progress in communication and information technologies around
the 1980s and 1990s enabled a historic break-up of the production process and
gave rise to the second unbundling of globalisation. After the second unbundling,
the many tasks required to provide knowledge-intensive services are performed in
several, disparate locations. Thus, international trade today not only means the
exchange of complete goods, but also trade in services. This is referred to as
‘offshore outsourcing of services’, implying transfer of service tasks to a supplier
located overseas (Grossman & Rossi-Hansberg, 2006).
The expanding feasibility of offshoring formerly non-tradable services has been
referred to as the “Third Industrial Revolution” (Blinder, 2006), or the “next wave
of globalisation” (Dossani & Kenney, 2007). Outsourcing (the transfer of service
tasks to another supplier) by itself is not a new phenomenon. But what has
attracted recent debates in the field is offshore outsourcing of services, where
service jobs involving high labour costs in a particular country have been
outsourced to a supplier located in another low-cost country. In this research, the
terms offshoring, outsourcing and offshore outsourcing are used interchangeably,
all of them implying outsourcing of service activities to an offshore location.
India boasts of a large English-speaking population on account of a British
colonial past. The country also has a large number of college graduates and IT
workers who are employable at a relatively low cost. Since the offshore-service
industry mainly draws its pool of workers from an English-speaking and low-cost
labour force, India has become one of the most attractive destinations in this
sector. Moreover, western firms that relocate their services production to India
can offer higher wages than Indian firms to attract the most talented workers, but
still operate profitably because of considerable labour arbitrage. Together with
favourable demographic characteristics and cost advantage, advancement of
Chapter 1

13
technology coupled with market oriented reforms has also encouraged the
establishment of the offshore-service industry in the country. The Computer
Policy introduced in 1984, which explicitly prioritised software exports,
represented the first measure to stimulate the IT industry in India (Rastogi &
Pradhan, 2011). Further, in 1991, the Indian government established the Software
Technology Parks of India (STPI), which enabled companies to set up their offices
and share a common satellite link. Also, companies operating within the STPIs
benefitted from a number of tax breaks (Rastogi & Pradhan, 2011).
In the early 1990s however, the software industry was small and was not really
offshore. Its revenues came almost entirely from body-shopping, where instead of
relocating services to India, workers themselves were relocated abroad to work
on-site. But when a few American companies contracted with some leading Indian
services companies of that time for offshore services, it boosted the offshore
outsourcing of IT services (ETIG, 2004). In fact, the emergence of the IT
industry and offshoring of software services to India acted as a fillip to the arrival
of the IT-eS industry. While it took about 15 to 20 years for the Indian IT
industry to become a global player, the IT-eS industry achieved a similar
recognition in less than five years (Agarwal et al., 2005; ETIG, 2004). In the
initial stages, most of the services offered by the IT-eS industry were call-centre
operations. Today, the services offered are rather broad. It covers customer care,
financial services, human resources, administration and content development,
legal process outsourcing, research and knowledge services. Most of these
services cater to the banking and finance industry, although these are gradually
expanding to include power, telecommunications and many such sectors.
Besides the type of offshore services offered in India, the type of firms involved in
the industry has also undergone massive changes over time. Initially, companies
from the US, for example, set up their operational units in India, which served
Introduction

14
their own companies abroad. These are called captive units. This was followed by
third party firms, that is, Indian firms which provided outsourcing services to
their clients abroad. Later, the captive units started offering their services to
external clients as well. More recently, Indian multi-national companies have set
up their firms in other countries, such as the Philippines, from where they offer
their outsourcing services (Kleibert, 2015).
To distinguish between the low and high-end services within the IT-eS industry,
the former are called BPO services, while the latter are named KPO services.
Lately, to reflect the entire gamut of the IT-enabled services offered, the sector is
also referred to as Business Process Management (BPM). This research uses the
term IT-eS to refer to the entire gamut of low, middle and high-end knowledge
services offered by the offshore-service industry.
India continues to be the undisputed leader in the global service offshoring
business; capturing 56 per cent of the world’s service outsourcing market and 38
per cent of the global IT-eS business (NASSCOM, 2015, 2016b). The sector has
also contributed immensely to India’s economic growth. According to NASSCOM
(2016b), the share of the IT and IT-eS industries to India’s GDP increased from
about 1 per cent in 1980-90 to 9.3 per cent in 2010-15. Export earnings from the
sector, at $108 billion in 2015-16, comprised 45 per cent of India’s total export
revenue. Of this, 22 per cent came from the IT-eS segment. The industry is also
an important employment generator. It is the largest private sector employer in
the country, with approximately 3.7 million directly employed workers in 2010-
15. Besides its role in the economic development of the country, the offshore-
service sector is also claimed to have altered the social fabric of the Indian society,
in effect, contributing towards the emergence of a new middle class (Fernandes,
2006; Upadhya, 2009).
Chapter 1

15
1.4 Research questions
Drawing from evidences and gaps in existing literature on the offshore-service
industry and the formation of a new middle class in India, we arrive at the
following central research question of this thesis:
How did the middle class in India quantitatively and qualitatively change in the
past two decades and how has emergence of the IT-eS industry in Mumbai
contributed to a new middle class formation during this period?
The central research question is further divided into the following more specific
research questions and sub-questions.
Research question I:
How has the middle class in India quantitatively and qualitatively changed in the
recent years between 1999-00 and 2011-12?
• Sub-question i: How has the Indian middle class expanded quantitatively
between 1999-00 and 2011-12 and in which regions of India has this
expansion taken place?
• Sub-question ii: What are the consumption patterns of the middle class,
how do they differ from those of the other classes and how have they
changed between 1999-00 and 2011-12?
• Sub-question iii: What is the social composition of the middle class with
respect to its occupation, education, religion and caste and how has this
changed over the period under analysis?
Research question II:
How has emergence of the IT-eS industry in Mumbai contributed to a new middle
class formation?
Introduction

16
• Sub-question iv: How accessible are the employment opportunities in the
IT-eS industry in Mumbai to different social groups, especially to those
from non-middle class and disadvantaged social backgrounds?
• Sub-question v: What are the income levels, consumption practices and
lifestyles of IT-eS employees and how does employment in the industry
influence them?
Research question I studies the qualitative and quantitative changes in the middle
class in India, which will help us arrive at an understanding of the emergence of
the new middle class in the larger national context. Research question II
investigates the specific contribution of the IT-eS industry to a new middle class
formation. These questions together enable in gaining a comprehensive
understanding of the recent emergence of the new middle class in India and the
contribution of service sector globalisation to such a class formation.
1.5 Chapter scheme
The complexity of the concept of class makes it important to first arrive at a clear
framework of class, which can aid in the empirical analysis of the new middle
class. Chapter 2 of this thesis discusses the class framework proposed by Bourdieu
(1986) that will be used in this study and the operationalisation of the concept of
the new middle class based on this class framework. Chapter 3 lays down the
research methods used in this study. Chapters from 4 to 7, form the main
empirical chapters of this thesis, which answer the research questions presented
above. Chapters 4 and 5 together answer research question I, while chapters 6 and
7 answer question II (see Table 1.1 for an overview of the main chapters). Chapter
8 concludes this study by summarising the findings, explaining their implications
and proposing ideas for further research.
Chapter 1

17
Table 1.1 Overview of the Main Chapters
Chapter Research
questions
answered
Data-base Academic discussion
4:
Expansion of the
middle class in India
and its changing
consumption patterns
Sub-questions
(i) and (ii)
National Sample
Survey (NSS) data on
household consumer
expenditure, 1999-00,
2004-05 and 2011-12
Recent expansion of the
Indian middle class
ADB (2010); Banerjee
& Duflo (2008);
Milanovic (2016);
Ravallion (2010)
5:
Structure of the middle
class: An analysis of its
education, employment
and ethnic composition
Sub-question
(iii)
National Sample
Survey (NSS) data on
household consumer
expenditure, 1999-00,
2004-05 and 2011-12
Structural composition of
the Indian middle class
Banerjee & Duflo
(2008);
Fernandes (2006);
Sheth (1999)
6:
Access to employment
opportunities in
Mumbai’s IT-eS
industry and its
implications for the
formation of a new
middle class
Sub-question
(iv)
Primary field data
collected from 2012 to
2014 via interviews
and survey of IT-eS
employees in Mumbai
Segmented access to the
offshore-service industry
in India
D'Costa (2011);
Fuller & Narasimhan,
(2007);
Upadhya (2007)
7:
How the IT-eS
industry contributes to
the formation of a
consumerist new
middle class in Mumbai
Sub-question (v) Primary field data
collected from 2012 to
2014 via interviews
and survey of IT-eS
employees in Mumbai
The rise of a consumerist
new middle class in India
Fernandes (2006);
Lakha (1999);
J. Murphy (2011)
Introduction

18

19
Chapter 2| Theoretical Conceptualisation: Applying Bourdieu’s Forms of Capital to Understand New Middle Class Formation in India
2.1 Introduction
All societies are stratified on the basis of income and consumption levels,
occupational distribution, labour processes, ethnic origin and such other
differences. Class is a useful analytical tool that encompasses these different
dimensions along which societies are stratified to provide a holistic understanding
of how societies function and how socio-economic and cultural transformations
take place. Kelly (2007: 3) observes that “the concept of class has made something
of a comeback in recent years in both academic and popular debates”. It is hence
not surprising that many scholars study contemporary socio-economic
transformations taking place in the world from the lens of class (see for example,
Savage et al., 2013). This thesis thus adopts the conceptual tool of class to explore
the socio-economic changes in contemporary India brought about by the
emergence of the offshore-service industry. The concept of class and its
application to study societal transformations is however not straight-forward. In
general, the concept of class has evolved with time to reflect the increasing
complexities of societies, but different class typologies analyse the society from
different perspectives.
In the Marxist tradition, class relations are seen as a form of relations of
production, where rights and powers of people over productive resources are
unequally distributed. In the Weberian class analysis, just like Marxist, the rights
and powers that individuals have over productive assets define the material basis
of class relations. But in Weberian analysis, the rights and powers shape an
individual’s life chances, rather than structure exploitation, which was the key
Chapter 2| Theoretical Conceptualisation: Applying Bourdieu’s Forms of Capital to Understand New Middle Class Formation in India

20
ingredient of Marxist analysis (Wright, 2005). Contemporary approaches to class
such as that of Goldthrope, consider class positions as resulting from differences
in occupational situations (Goldthorpe, 1980).
One of the leading approaches to class analysis is a framework proposed by the
French sociologist Pierre Bourdieu (see for example, Bourdieu, 1986; Weininger,
2005). Bourdieu incorporates more dimensions to class analysis than earlier
theorists, better reflecting contemporary manifestations of class identity,
especially forms of consumption, that have become increasingly significant in
recent analyses of the middle class (see for instance, Birdsall, 2010, 2016; Chun,
Hasan & Ulubasoglu, 2011; Kharas, 2010). Bourdieu’s notion of class structure
encompasses the entirety of the occupational division of labour. Bourdieu is not
confronted by the problem upon which many Marxian theories have foundered;
that of determining how to cope with all those occupations which cannot be
characterised in terms of owners or workers. His model encompasses middle class
occupations as well as all those occupations that lie in the fringes of the
occupational distribution such as artists and other professionals (Weininger,
2005). Another important feature of Bourdieu’s analysis is that unlike Weber, he
does not distinguish between social class and status groups. According to
Bourdieu, status groups are a manifestation of the existence of different social
classes. These classes are differentiated not only in economic terms, but also in
symbolic terms, such as differences in lifestyles. Lifestyle practices establish
symbolic boundaries between individuals occupying different locations in the class
structure. It is this symbolic-based segregation of classes that is especially useful
in analysing the emergence of the new middle class in India. This study is hence
anchored on the theoretical framework of class proposed by Bourdieu.
The following section gives an overview of Bourdieu’s class framework. Section
2.3 describes the essential characteristics of the middle class in India from the
Chapter 2
21
time of its formation in the nineteenth century until the liberalisation period. This
is followed by a discussion of the features of the new middle class in India based
on extant literature. Section 2.5, drawing on the discussion from the earlier
sections, operationalises the concept of the new middle class, anchored on
Bourdieu’s class framework. The last section presents the concluding remarks.
2.2 Bourdieu’s forms of capital
Bourdieu’s class framework is based on the conceptual tools of capital, habitus and
field. The concept of capital can be understood as the set of usable resources and
powers (Weininger, 2005), the possession of which determines the position of an
individual in the class structure. Habitus refers to the deeply ingrained habits,
skills or dispositions that individuals unconsciously acquire due to their life
experiences. According to Bourdieu our taste for cultural objects such as work of
art are shaped by the habitus. Finally, field refers to the distinct arenas of social
practice such as education, religion, law, and so on, which have their own set of
rules, knowledge and forms of capital. In this thesis, however, we limit the
analysis of class to the concept of capital, as this alone will suffice to study the
formation of a new middle class in India (see Savage et al., 2013 who also employ
only the concept of capital in their study of social classes in Great Britain).
Bourdieu elaborates on his idea of capital in multiple studies, with variations
introduced in each of them. This study understands and uses the concept of
capital as proposed in his work The Forms of Capital (Bourdieu, 1986).
Capital, according to Bourdieu (1986) can be understood as power, which when
appropriated by an agent or groups of agents, enables them to appropriate social
energy in the form of material labour. Capital has the potential to produce profits,
but more importantly to reproduce itself in identical and expanded forms.
However, by nature, capital takes time to accumulate, tends to persist in its being,
not allowing everything to be equally possible or impossible, or related to chance.
Theoretical Conceptualisation

22
In other words, capital is unequally distributed. The structure of the distribution
of different types of capital at a given moment in time represents the structure of
the social world or the class structure.
Bourdieu (1986) identifies three fundamental forms of capital- economic capital,
cultural capital and social capital.
• Economic capital is at the root of all other forms of capital. It can be
directly converted into money and may be institutionalised in the form of
property rights. The concept of economic capital of Bourdieu emanates
from the Marxist idea of relationship to the means of production and is
also related to the economic idea of class. But beyond this, there is little
overlap between Bourdieu and Marxist ideas of class, or the economic
definition of class.
• Bourdieu (1986) argues that while economic capital is the fundamental
form of capital, class relations cannot be reduced to an analysis of only
economic relations, but simultaneously entails an analysis of symbolic
relations. Such symbolic relations can be analysed using the concept of
cultural capital. The notion of cultural capital “refers to a culturally specific
competence... which is efficacious as a resource or power in a particular
social setting” (Weininger, 2005: 87). Cultural capital is often a
manifestation of economic capital, but may not necessarily be directly
convertible into money. “In highly differentiated societies two social
agencies are primarily responsible for inculcating cultural capital: the
family and the school” (Weininger, 2005: 87).
Cultural capital takes three forms- embodied capital, objectified capital
and institutionalised capital. Embodied capital is linked to the body and
refers to the time invested in acquiring bodily attributes such as building
a physique, or unconsciously acquired, but visible attributes such as an
accent and comportment. Objectified capital relates to the possession of
Chapter 2

23
material objects such as works of art (presupposing economic capital), and
also knowing how to use them. Academic qualification is an example of
institutionalised capital, that is, capital, which has a legal guarantee. As
these cultural capitals hold a symbolic value, they are also referred to as
symbolic capital.
• Finally, social capital refers to the size of network or connections of an
individual, which can be effectively mobilised.
Bourdieu (1986) asserts that the real logic of the functioning of different forms of
capital lies in their power of conversion from one form to another. The different
types of capital are derived from economic capital, but only at the cost of
transformation. Some forms of capital can be instantaneously converted from
economic capital, while others may require a great amount of investment of time
or effort. For example, economic capital may give immediate access to some goods
and services, while access to others may be dependent on building long term
social contacts or investing in some form of cultural capital. The different types of
capital can also be distinguished on the basis of their reproducibility or the degree
of ease with which they are transmitted.
In order to apply this class framework in the case of India’s new middle class, it is
essential to understand the inter-play of different forms of capital that gave rise to
the formation of the middle class in India as well as the specific social context
under which the Indian middle class operates. The following section hence briefly
traces the history of the emergence of the middle class in India, focusing on the
different forms of capital the class possessed.
2.3 The middle class in India
The concept of the middle class has always been complex to define. In the Indian
case the existence of other social stratifications such as caste that often intersect
Theoretical Conceptualisation

24
with class make it even more convoluted. Joshi (2010a) observes that most
scholars who use this category treat the middle class as an already understood
social group. Common is the idea that the category refers to people who belong to
the upper strata of the society, without being at the very top. While financially
comfortable, they are people who need to work to earn a living (Joshi, 2010a). In
general, the middle class in India has been understood in terms of its occupation,
wherein artisans, craftsmen, merchants as well as the professional class of
lawyers, teachers, and doctors have been categorised as belonging to the middle
class (Doepke & Zilibotti, 2008; Haynes, McGowan, Roy & Yanagisawa, 2010;
Joshi, 2010b). Because of the difficulty in arriving at an objective definition of the
Indian middle class, this section, by tracing the growth of the middle class from
the time of its emergence in the nineteenth century until the liberalisation period
of the 1990s, provides a few objective pointers that can be associated with the
Indian middle class. It specifically discusses the forms of capital generally
associated with the Indian middle class.
The middle class in India was not a very visible social group before the nineteenth
century. It was only during the British rule in the nineteenth century that a
middle class started to emerge in India in a noticeable form (Joshi, 2010b).
According to Joshi (2010a: xix), important social, economic and political changes
accompanying the British rule in India presented new opportunities to a segment
of educated Indians to articulate their set of beliefs, values and modes of politics.
This initiation of a new cultural politics distinguished this group from other social
groups both above and below, leading to the making of the middle class in
colonial India. Educated Indians “invested in presses, worked as journalists,
created civic and political associations and published and debated their ideas
either in the press or in the forums of their associations” (Joshi, 2010a: xvii).
Fernandes (2006: 6) argues that such culturalist arguments tend to underestimate
the significance of socio-economic dimensions of the colonial middle class. She
Chapter 2

25
asserts that although the power of the middle class may have rested in its ability
to act as a cultural entrepreneur, the socio-economic conditions limited the
number and sort of people who could aspire to be part of the middle class.
The formation of the Indian middle class was primarily based on the foundation of
economic and cultural capitals. British administrative requirements in India led to
the introduction of the English language and western education. But access to
education in the English language was limited to a select few who had some basic
socio-economic resources at their disposal. These typically consisted of those who
had earlier served in the courts of indigenous rulers and large landlords (Joshi,
2010a). This British intention is reflected in the famous quote by Macaulay
(Macaulay, 1835: 8):
“It is impossible for us... to educate the body of the people. We must at present do our best to
form a class who may be interpreters between us and the millions whom we govern; a class
of persons, Indian in blood and colour, but English in tastes, in opinions, in morals and in
intellect.”
The few people endowed with some pre-existing economic capital and the cultural
capital of education in the English language thus came to form the middle class in
colonial India. The possession of these capitals in turn enabled the middle class to
occupy important positions under the British administrative set-up. The colonial
middle class was engaged in professional, literary, service-based occupations,
unlike an industrial middle class which was characteristic of the West. British
industrial policy in India blunted a full-fledged expansion of the manufacturing
sector in the country. New firms floated by parent British companies were
vertically integrated under the management of the parent firm, resulting in a
limited number of managers controlling the bulk of the country’s economic power
(Fernandes, 2006: 4). This pattern of industrial development led the colonial
middle class to rely on service related occupations based on its educational
Theoretical Conceptualisation

26
resources and thereby get access to employment and economic power. The upper
tier, which constituted a small segment of the middle class, got employment
opportunities in the civil services and private-sector employment. The larger
lower tier was employed as clerks and teachers. Employment in the few existing
service-based occupations ensured that the middle class in British India occupied
the upper-strata of the income distribution, without being at the very top
(Hatekar, Kumar & Mathur, 2009; Joshi, 2010b). As Bourdieu (1986) asserts, the
real logic of the functioning of different forms of capital lies in their power to
convert from one form to another. The cultural capitals of the middle class were
further transformed into economic capital as English language skills carried a
wage premium.
Besides education, English language skills and service-based occupations, another
salient feature of the Indian middle class was its upper-caste character1
(Fernandes, 2006: 9). Since the middle class comprised of those who already had
some access to basic socio-economic resources, they mainly came from upper-caste
Hindu and high-born Muslim families (Joshi, 2010a). Existing caste inequalities in
pre-British India were thus reshaped and reinforced in the making of the middle
class in colonial India. Furthermore, as colonial educational policy was
concentrated in the cities of Bombay (now Mumbai) and Calcutta (now Kolkata);
the colonial middle class was strikingly urban in nature. In the case of Bombay,
Dobbin (1972) cites the growth of the intelligentsia employed in a range of
professional occupations in law and government service because of the spread of
educational institutions in the city.
1 It may however be noted that in general although the Indian middle class was identified by its upper-caste character, there were considerable regional variations in middle class characteristics across India. For discussions on regional variations in the Indian middle class, see Joshi (2010b).
Chapter 2

27
In sum, the salient features of the early colonial middle class in India were its
education in the English language, employment in professional services, relatively
high levels of income and an urban and upper caste orientation. The middle class
was not only endowed with specific economic and cultural capitals, but the
existing Indian social structure of the caste system also influenced its
composition. These features of the Indian middle class remained more or less
stable in independent India of the twentieth century. There was no significant
expansion in the size of the middle class at least until the early 1990s.
The policy of liberalisation, which gradually started in the late 1980s and formally
adopted in the year 1991, marked a stark shift in independent India’s economic
policy towards market orientation. This shift in policy stance steered a higher rate
of economic growth for the country. It is claimed that economic growth has been
accompanied with an expansion in the size of the middle class, as benefits of
growth have spread to wider sections of the Indian society, enabling many new
households to enter the middle class (ADB, 2010; Sridharan, 2004). Besides the
expansion in middle class size, it is also argued that globalisation and
liberalisation have enabled at least part of the middle class to adopt new forms of
lifestyles and consumption practices, which were hitherto not identified with the
Indian middle class. In other words, sections of the middle class have come to
possess certain symbolic capital that differentiate them from not only the other
classes but also from the earlier middle class (Fernandes, 2006). The idea of this
‘new’ middle class, as briefly discussed in the last chapter, is however not that
straight forward. The following section presents the debates surrounding the
concept of the new middle class.
2.4 Enigma around the new middle class
The concept of the new middle class is quite a mysterious one (see Table 2.1, p. 31
for an overview of the various conceptualisations of the new middle class). The
Theoretical Conceptualisation

28
usage of the term dates back to at least as early as 1909. Anton Pannekoek, in his
analysis of the German new middle class, described the class as the then emerging
professional class of professors, authors, physicians, lawyers and such other
intellectuals who were replacing the old middle class of small capitalists as the
medium income earners of Germany (Pannekoek, 1909). The new middle class
was different from the old not only in terms of its occupation, but also by the fact
that unlike the old middle class, it did not own the means of production, but sold
its labour power to the capitalists.
In India, the concept of the new middle class is a rather recent one, popularised,
arguably, by the work of Fernandes (2006). Fernandes (2006) describes the new
middle class as a group that is fundamentally tied to the success of economic
reforms of liberalisation and globalisation in India; that is based on a culture of
consumption, unlike the old middle class which was averse to ostentatious display
of wealth. This class is economically more prosperous than the ‘old’ middle class
and generally they match the income and consumption levels of the affluent in the
West (Joshi, 2010a). It is for this reason that the class is sometimes also referred
to as the ‘new rich’ (Fuller & Narasimhan, 2007; Pinches, 1999). Fernandes (2006)
also argues that the newness of the new middle class does not entail a shift in the
social basis or composition of the middle class, implying that they come from pre-
existing middle class families (dominated by the urban upper-castes). Service
outsourcing workers are claimed to be part of the larger group of such a new
middle class.
Fernandes' (2006) analysis of the new middle class is bolstered by J. Murphy
(2011) and Upadhya (2007, 2008, 2009) in their study on offshore-service industry
workers. Upadhya (2009) views the Indian new middle class as more affluent,
transnational and consumerist than the ‘old’ middle class. It is the segment that is
globalised, highly educated, professional and upwardly mobile. Members of the
Chapter 2

29
new middle class are harbingers of cultural change on account of their increased
exposure to western culture brought about by stints of travel abroad and frequent
interaction with foreigners (Upadhya, 2008). In line with Fernandes (2006),
Upadhya (2007) also finds the new middle class to be dominated by urban, upper-
caste professionals, coming from the existing middle class. J. Murphy (2011), in
exploring the lifestyles of call-centre workers claims that the new middle class in
India can be characterised as part of an emergent global middle class, sharing
common lifestyles and values with its western counterpart. The new middle class
according to these studies is based on the new economy jobs in India brought
about by liberalisation and globalisation, is identified via its globalised (or
westernised) consumption practices and is essentially a segment of the pre-
existing middle class, that is, urban upper-castes.
While the above analysis of the new middle class in India is the dominant view,
other insights on the new middle class are in stark contrast to this understanding.
Some studies find no change in the attitudes towards consumption between the
middle class of the British era and the middle class of liberalised India (Haynes et
al., 2010; Kidambi, 2010; Nadeem, 2009), whereas others view newness in the new
middle class in terms of their changing social composition (Jaffrelot & van der
Veer, 2008; Sheth, 1999). According to Haynes et al. (2010), consumption was an
integral part of the Indian middle class even in the colonial times and that
newness in the new middle class does not entail any change in its attitude towards
consumption. Kidambi (2010) also finds evidence of consumerist tendencies in the
middle class in Bombay (now Mumbai) during the British era. According to him,
white collar workers of the colonial period emphasised the distinctive material
needs that distinguished them from the manual working classes. They argued that
as members of a respectable class, they had no choice but to engage in forms of
consumption that were intrinsic to their social position. Similarly, Nadeem (2009)
argues that the western-oriented workers of the outsourcing sector and the
Theoretical Conceptualisation

30
English-speaking Indian middle class of the British era are not very different in
emulating western lifestyles or habits. He observes that since the outsourcing
sector inculcates values like individualism and freedom amongst its workers, as
against the traditional Indian family value system, those outside the sector view
the workers as westernised. In yet another understanding of the new middle class,
Lakha (1999) argues that new middle class identity is both global and at the same
time rooted in India. The peculiar tension between the global and the local is
what distinguishes the new middle class from other classes as well as from other
segments of a more broadly defined middle class.
Further, while Fernandes (2006) and Upadhya (2007) find the Indian new middle
class to be little different in its social composition as compared to the pre-existing
middle class, Jaffrelot & van der Veer (2008) and Sheth (1999) view the class as
socially more inclusive than the earlier middle class. According to Sheth (1999),
the newness in the new middle class is based on the diversified social origins of its
members, especially in terms of their castes. Similarly, Jaffrelot & van der Veer
(2008) define the new middle class as a socially inclusive group that is traceable to
the disintegration of the Indian caste system.
A yet another contrasting view (generally observed in international studies)
equates the new middle class to the burgeoning middle classes in developing
economies (see Birdsall, 2016). Wietzke & Sumner (2014) describe the new
middle class in developing economies as comprising of both the vulnerable lower-
middle class (spending slightly above $2 per capita per day) as well as the more
affluent global middle class (spending above $10 per capita per day). According to
them, both these groups are increasing in numbers in the developing countries
and together they constitute the new middle class. In his research on inequality
and globalisation, Milanovic (2016) observes that the emerging global middle
class in developing countries are still relatively poor and less educated than the
Chapter 2

31
middle classes in the West. They should hence not be assigned the same status as
the middle classes in the West. This contradicts the often held view of the new
middle class in India, which equates its identity to newly gained material affluence
and westernisation (J. Murphy, 2011; Upadhya, 2008).
Table 2.1 Different Conceptualisations of the New Middle Class
Idea Studies
Early conceptualisation
1. Emerging class of professional workers (Pannekoek, 1909)
Contemporary conceptualisations (in liberalised India, tied to global capitalism)
2. A new consumption culture- westernised,
transnational; but no change in social basis
(Fernandes, 2006; J. Murphy,
2011; Upadhya, 2008, 2009)
3. No significant change in consumption practices,
no complete westernisation of consumption,
rather a blend of Indian and western cultures
(Lakha, 1999; Nadeem, 2009)
4. New social basis, that is, come from
disadvantaged castes, who were traditionally
not part of the middle class
(Jaffrelot & van der Veer, 2008;
Sheth, 1999)
Contemporary conceptualisations (in a global, developing country context)
5.
6.
Signifies the burgeoning middle classes in
developing economies, aided by fall in poverty
rates due to impressive economic growth in
these countries in the last two or three decades
Includes both the lower-middle class (income
>$2) and the new rich (income > $10) in
developing economies
(ADB, 2010; Birdsall, 2016;
Wilson & Dragusanu, 2008)
(Wietzke & Sumner, 2014)
Source: Compiled by the author.
Theoretical Conceptualisation
32
2.5 Operationalising the concept of the new middle class
The diverse ways of understanding the new middle class point that newness in
the new middle class lies in the acquisition of a higher level of economic capital
(income and consumption expenditures) or in the possession of new forms of
cultural capital (different lifestyles and consumption habits) or entails a new social
structure (in terms of new caste groups entering the middle class). This thesis
explores all these forms of newness in the middle class to investigate what really
is new about the new middle class in India and how the IT-eS industry
contributes to the formation of such a new middle class. Table 2.2 summarises
how these different types of newness in the sense of acquisition of different forms
of capital will be analysed in each of the empirical chapters.
Chapter 4, drawing on the contemporary global conceptualisation of new middle
class by Birdsall (2016), Wietzke & Sumner (2014) and others cited in Table 2.1,
studies how the size of the middle class has expanded as new households have
entered the class by acquiring a higher level of economic capital in the form of
income and consumption expenditure. Based on literature associating middle-class
growth to greater demand for consumer goods (see for example, Banerjee &
Duflo, 2008; K. M. Murphy et al., 1989), the chapter also examines how the
increase in economic capital translates into a higher level of objectified cultural
capital as households spend more and own expensive material objects with an
increase in their consumption expenditure. Chapter 5 studies changes in the
distribution of institutionalised cultural capital, that is, level of education among
the middle class as a result of a change in their level of economic capital. This
relates to the role of the middle class in human capital accumulation (see Birdsall,
2016; Doepke & Zilibotti, 2008; Easterly, 2001). Drawing on the arguments put
forth by Jaffrelot & van der Veer (2008) and Sheth (1999), who associate newness
in the middle class with changes in its caste composition, the chapter also studies
how occupational and ethnic distributions of the middle class have changed with
Chapter 2

33
changes in the level of economic capital. Chapter 6 assesses the accessibility of
employment opportunities in the IT-eS industry to non-middle class employees.
In other words, it studies the significance of the possession of economic and
cultural capitals intrinsic to the established middle class for accessing
employment opportunities of the IT-eS industry. Finally, Chapter 7, by
examining changes in the lifestyles and consumption practices of IT-eS employees
reveals how the pre-existing forms of capital of IT-eS employees are transformed
into new forms of economic and cultural capitals to produce a new middle class
identity.
It may be noted that this study is largely restricted to the analysis of economic
and cultural capitals and how their possession and transformation into new forms
of capital gives rise to a new middle class formation. The role of the third form of
capital asserted by Bourdieu, that is, social capital, in new middle class formation
has largely been omitted from this thesis. We recognise that social capital in the
form of social networks might be an important determinant for accessing
employment opportunities in the IT-eS industry and eventually for growing up
the career ladder. However, because of its relatively limited relevance in the
formation of a new middle class identity, this form of capital is not examined in
detail in this thesis. Nonetheless, Chapter 6 will briefly reflect on the role of social
capital in accessing employment opportunities in the IT-eS industry, at least in a
few exceptional cases.
Theoretical Conceptualisation

34
Table 2.2 Operationalisation of the Concept of New Middle Class Based on
Bourdieu's Forms of Capital
Research question
addressed
(see Section 1.4)
Form of capital
analysed Indicator
Dimension of
newness analysed
Chapter 4
Sub-question (i) Economic capital Consumption
expenditure
New entrants into the
Indian middle class
Sub-question (ii) Objectified cultural
capital
Changes in spending
patterns, ownership
and consumption of
new types of goods
and services
Changes in spending
patterns and
ownership of assets of
the Indian middle
class
Chapter 5
Sub-question (iii) Institutionalised
cultural capital
Education,
occupation, ethnic
composition*
Changes in social
composition of the
Indian middle class
with respect to
education, occupation,
caste and religion
Chapter 6
Sub-question (iv) Cultural capital
Level of education,
English language
skills, occupation,
place of origin* and
ethnic origin*
Contribution of the
IT-eS industry to new
middle class
formation via
accessibility of its
employment
opportunities to
employees from non-
middle class families
Chapter 2

35
Table 2.2 Continued...
Research question
addressed
(see Section 1.4)
Form of capital
analysed Indicator
Dimension of
newness analysed
Chapter 7
Sub-question (v) Economic and
cultural capital
Income, consumption
expenditure,
lifestyles and
consumption
practices of IT-eS
employees
Contribution of the
IT-eS industry to new
middle class
formation via changes
in income and
lifestyles of employees
after entering the
industry
Note: * indicates that these variables do not directly fit into Bourdieu’s forms of capital, but are
analysed because of their relevance in new middle class formation in the Indian social context.
Source: Compiled by the author.
2.6 Concluding remarks
This chapter provided an overview of Bourdieu’s popular work, Forms of Capital
(Bourdieu, 1986), which will function as the primary theoretical anchor for the
study of the new middle class in this thesis. Along with this, the chapter also
discussed the emergence of the middle class in India from the nineteenth century
until the twenty-first century. This helps us better understand the social and
political processes that have shaped the early Indian middle class, which continue
to bear an influence on the class even today. Bourdieu’s concept of forms of capital
will be applied in this study taking into account the unique social characteristics
of the Indian middle class. While this chapter provided the overall theoretical
framework for this thesis, the individual empirical chapters have their own
theoretical sections, pertaining to the subject discussed in that chapter. Before
discussing the empirical results, the following chapter presents the research
methods employed in this study.
Theoretical Conceptualisation

36

37
Chapter 3| Research Methods
3.1 Introduction
As explained so far, this thesis investigates a broad phenomenon of the expansion
of the middle class in India, followed by an in-depth examination of the
contribution of the IT-eS industry to a new middle class formation in Mumbai.
Obviously, a single research method or data-set will not suffice to study both
broad and in-depth phenomena. This research hence draws on primary data
collected via semi-structured interviews and a survey of IT-eS employees in
Mumbai, as well as a large-scale national survey called the National Sample
Survey (NSS), conducted by the Ministry of Statistics and Programme
Implementation, Government of India. The NSS data is purely quantitative, while
the data on IT-eS employees is both quantitative and qualitative in nature.
The choice of a mixed-research, multi-strand method is guided by the nature of
research questions at hand and the availability of data to answer them. As Yin
(2009) points out, the choice of research method depends in large part on the
research question. The study of the recent expansion of the middle class in India
demands a national level data-set, collected over a relatively long period of time,
which is impossible to gather by an individual researcher in a short time span of a
few years. The NSS surveys are household level primary surveys that are
regularly conducted across India since a long period of time. Hence, we make use
of these surveys to understand the broad patterns of expansion of the middle class
in India. While data from the NSS give a macro picture of the growth of the
middle class in India, they do not provide a nuanced understanding of the
contribution of the IT-eS industry to a new middle class formation. To study the
latter, it is essential to focus specifically on the industry and its employees.
NASSCOM, the industry body of service offshore companies in India is perhaps
Chapter 3| Research Methods

38
the most authoritative source of information on the IT and IT-eS industries in
India. NASSCOM regularly publishes the latest statistics on the industry such as
revenue generated, growth rates and employment creation (see NASSCOM,
2015). These statistics however provide only an overview of the size of the
industry and its expansion. For a complete understanding of the emergence of the
IT-eS industry and its contribution to a new middle class formation, it was
decided to undertake a primary field study in the form of interviews and a survey,
which respectively provide a comprehensive analysis and a broad understanding
of the research questions at hand. Mumbai was chosen as the field location to
study the IT-eS industry because of a wide presence of the industry in the city,
along with other considerations, elaborated in Section 3.6.
The following section describes the NSS surveys, including its sample design and
the methodology used for extracting the data and arriving at the results. Section
3.3 discusses the primary data gathered on IT-eS employees. Sections 3.4 and 3.5,
respectively describe the data gathered via semi-structured interviews and a
survey. This is followed by a brief description of the research site to study the IT-
eS industry. The final section deals with research ethics and limitations of the
methods.
3.2 The NSS Household Consumer Expenditure Survey
The NSS was set up by the Government of India in the year 1950 to collect
household level socio-economic data across the country. The household Consumer
Expenditure Survey (CES) is one of the large-scale, periodically conducted
surveys of the NSS. This survey is being carried out regularly from 1973-74
onwards, on a large sample of households across India, on a quinquennial basis.
Annual surveys are also carried out, although less regularly, on a smaller sample
of households. The CES is one of the most important and widely used sources of
data to study various socio-economic aspects of Indian households (Deaton, 1997).
Chapter 3

39
Hence, to study the expansion of the Indian middle class and its consumption and
spending behaviour, the CES becomes a natural choice.
The analysis in this thesis is based on three quinquennial rounds of the CES (also
called the ‘thick’ samples) conducted in 1999-00 (55th round), 2004-05 (61st round)
and 2011-12 (68th round). 2011-12 is the latest period for which the quinquennial
survey on household consumer expenditure has been conducted, making it the end
point of our analysis. We skip the 66th quinquennial round of the survey,
conducted in 2009-10, as 2009 was declared a national drought year2, making data
from this round unusable. In fact, the 68th round of the CES was undertaken to
replace the 66th round data. The 55th round of the survey is chosen as the starting
period because firstly, the new middle class as well as the IT-eS industry in India
are claimed to have taken-off from around this period. Secondly, surveys older
than the 55th round give rise to problems of comparability as the 55th round
witnessed some major changes to the questionnaire design of the CES.
Sen (2000) however, points out at problems of comparability of the 55th round of
the CES with both older and later rounds, arising out of a flawed questionnaire
design. Unlike the older quinquennial rounds of the CES that used a uniform
recall period of 30 days for all items of consumption, the 55th round questionnaire
used a mixed recall period of both 7 days and 30 days for food items, administered
to the same sample of households. This has perhaps led to underestimation and
overestimation of the level of consumption expenditure in the 55th round. It is
claimed that households that were first asked about their 7-day consumption
level, reported their 30-day consumption level by merely multiplying their 7-day
consumption by four. In contrast, those households who reported their 30-day
2 The Indian Meteorological Department defines a drought year as that year when the rainfall during the four monsoon months of June to September falls deficient by 10 per cent of its long term average. Because Indian agriculture is predominantly rainfall dependent, a drought severely affects the average level of consumption in the country.
Research Methods

40
level consumption first, reported their 7-day consumption level by dividing the
former by 4. Because of this issue, studies based on the CES often refrain from
analysing the 55th round data (see for example, Basole & Basu, 2015; Motiram &
Naraparaju, 2015). However, as observed by Deaton & Dreze (2002), for
intermediate consumer goods such as fuel, medical care and miscellaneous goods
and services, the 55th round continued to use a uniform recall period of 30 days,
and for durable and semi-durable goods such as clothing and bedding the recall
period was 365 days, similar to that of the later rounds. Thus, the extent of
incorrect estimation of the level of consumption expenditure in the 55th round
may not be as high as that claimed by Sen (2000). In the light of this reasoning,
we choose to include the 55th round of the CES in our analysis, with the
qualification that it might marginally over-estimate or under-estimate the level of
consumption expenditure across households.
3.2.1 NSS sample design
Each of the NSS surveys used in this study draws on a sample size of over 100,000
households. The surveys cover the whole of India, except a few remote areas,
which are inaccessible for field investigators. The period of survey is of one year
duration, starting on 1st July of the survey year and ending on 30th June.
The CES adopts a stratified multi-stage sampling design. Districts in each state of
India are first divided into two basic strata of rural and urban areas. These are
further sub-stratified into groups of villages or towns, such that each sub-stratum
has more or less equal number of population. From each sub-stratum, the required
number of sample villages or towns is chosen, each of which is called a First Stage
Unit (FSU). The total number of FSUs is allotted to each state in proportion to
the population of the state. If the population of an FSU is below 1200, then a
sample of households is listed in the FSU, called the Ultimate Stage Unit (USU).
The composition of sample households in an USU is decided according to the
Chapter 3

41
level of consumption expenditure in that rural or urban stratum, such that
households with different levels of consumption expenditure are appropriately
represented in the sample. The data on the level of consumption expenditure of
the rural and urban strata is gathered from the previous round of the CES. If the
population of an FSU is 1200 or more, then the FSU is further divided into
hamlets (in rural areas) or sub-blocks (in urban areas), the number of hamlets or
sub-blocks in an FSU depending on the population size of the FSU. The USUs are
then chosen from each hamlet or sub-block. The final households surveyed are
assigned a weight in proportion to their representation in the total population. All
aggregates based on the NSS surveys are thus weighted aggregates for the
population or for a sub-population as a whole.
3.2.2 Reading and analysing NSS data in R
After the survey is carried out, its key results are published on the website of the
Ministry of Statistics and Porgramme Implementation, Government of India (see
http://www.mospi.nic.in/download-reports). However, for a comprehensive
analysis of the survey results, users are expected to purchase the unit-level survey
data, that is, the raw data, and carry out the calculations. This study has analysed
the unit-level data of the CES for the three rounds mentioned above. Because of
the large volume of the unit-level data, extracting and analysing the data is a
challenge. The absence of easily accessible material on the process of reading and
analysing the data makes NSS data analysis complex. This sub-section hence
outlines the procedure for reading and analysing the unit-level NSS data, with a
view to make the task easier for future NSS data users. Because all computations
for this study were carried out in the open-source statistical software R, we lay
down the procedure for reading and analysing NSS data using R. A basic working
knowledge of R is a pre-requisite to understand the commands listed here. A
similar procedure of data extraction and analysis can be followed for all NSS
survey data as well as by other software users. The unit-level data of different
Research Methods
42
rounds of NSS surveys are distributed in two formats- old and new. The latter is
more user-friendly and is relatively easy to read on different computational
software. However, the procedure to read and analyse NSS data presented here is
based on the old format. We believe that if users can handle the data provided in
the old format, then reading the new format requires no additional proficiency.
Because of the extremely large size of the data, they are grouped into different
levels, with data on each level provided in a separate .TXT file. The layout sheet
that accompanies the data files gives the list of variables contained in each level.
The CES data for the 68th round, for instance, is presented in 11 different levels.
Level one, for example, contains data on the common characteristics that identify
the household, level four gives data on social and demographic characteristics of
the household and each of its members, whereas levels five to nine provide
extensive information on the value and quantity of consumption expenditure of
households on different goods and services.
The first step is to extract the relevant data from each of the files. The raw data,
which are not separated by columns, are to be split appropriately into different
columns using information on the width of each column provided in the layout
sheet. The commands given in Box 3.1 read the data for a particular level (level 3
of the 68th round in this case), split them into different columns, assign a title to
each column and create a unique household-id for each household. A similar set of
commands can be executed to read each of the other levels.
Chapter 3
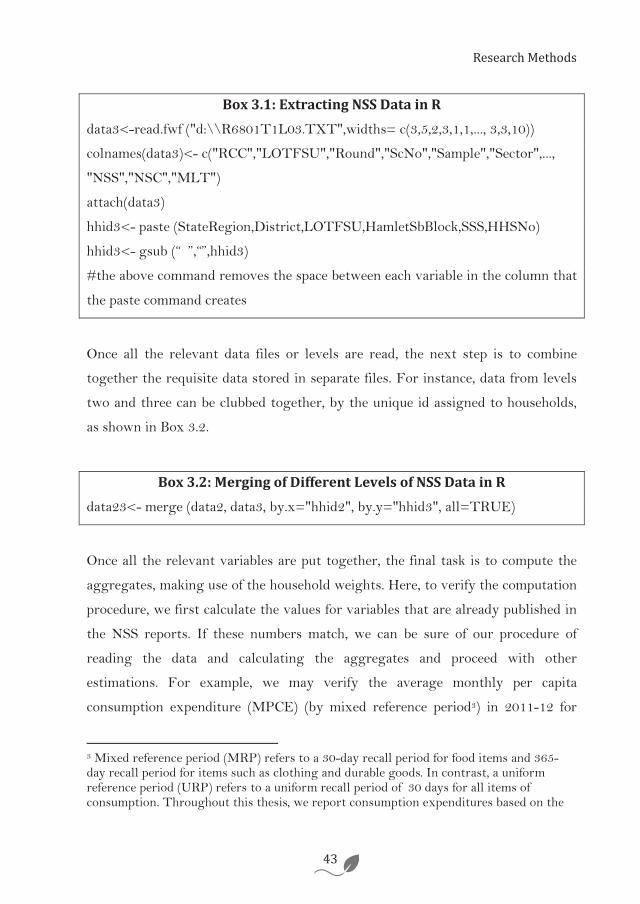
43
Box 3.1: Extracting NSS Data in R data3<-read.fwf ("d:\\R6801T1L03.TXT",widths= c(3,5,2,3,1,1,..., 3,3,10))
colnames(data3)<- c("RCC","LOTFSU","Round","ScNo","Sample","Sector",...,
"NSS","NSC","MLT")
attach(data3)
hhid3<- paste (StateRegion,District,LOTFSU,HamletSbBlock,SSS,HHSNo)
hhid3<- gsub (“ ”,“”,hhid3)
#the above command removes the space between each variable in the column that
the paste command creates
Once all the relevant data files or levels are read, the next step is to combine
together the requisite data stored in separate files. For instance, data from levels
two and three can be clubbed together, by the unique id assigned to households,
as shown in Box 3.2.
Box 3.2: Merging of Different Levels of NSS Data in R
data23<- merge (data2, data3, by.x="hhid2", by.y="hhid3", all=TRUE)
Once all the relevant variables are put together, the final task is to compute the
aggregates, making use of the household weights. Here, to verify the computation
procedure, we first calculate the values for variables that are already published in
the NSS reports. If these numbers match, we can be sure of our procedure of
reading the data and calculating the aggregates and proceed with other
estimations. For example, we may verify the average monthly per capita
consumption expenditure (MPCE) (by mixed reference period3) in 2011-12 for
3 Mixed reference period (MRP) refers to a 30-day recall period for food items and 365-day recall period for items such as clothing and durable goods. In contrast, a uniform reference period (URP) refers to a uniform recall period of 30 days for all items of consumption. Throughout this thesis, we report consumption expenditures based on the
Research Methods

44
rural and urban areas by executing the commands in R given in Box 3.3 (after
executing the commands shown in Box 3.1 and Box 3.2).
Box 3.3 Computing Average Monthly Per Capita Consumption
Expenditure in R
#the following command computes the household weights
mlt<- ifelse(NSS3==NSC3,(MLT3/(100*100)),(MLT3/(200*100)))
#the household weights are then multiplied by the household size, in order to arrive
at per capita weights, to calculate consumption expenditure at per capita levels
finalmlt<- mlt*HHSize
#the following command combines the data on calculated weights with the data on
level 2 and 3
fdata<- cbind(data23, mlt, finalmlt)
#the data for rural and urban areas are then extracted separately, in the following
commands
rural<- subset(fdata,Sector3==1)
urban<- subset(fdata,Sector3==2)
#finally we compute the per capita average consumption expenditure for rural and
urban India
mpcerural<- sum(rural$(MPCEMrp/100)*rural$finalmlt)/sum(rural$finalmlt)
mpceurban<- sum(urban$(MPCEMrp/100)*urban$finalmlt)/sum(urban$finalmlt)
Once the values for a few aggregates are verified in this manner with those given
in the official reports, we can proceed with computing other aggregates which are
not published in the reports. The results arrived at in Chapters 4 and 5 of this
thesis are the outcome of such a procedure of reading, computing and verifying
MRP method as it is considered to be a better measure of consumption expenditure than the URP.
Chapter 3

45
the data for the 55th, 61st and 68th rounds of the consumer expenditure surveys of
the NSS.
3.3 Data on IT-eS employees
The NSS surveys on consumption expenditure provide a broad overview of the
size and expansion of the middle class in India between 1999-00 and 2011-12. For
a comprehensive understanding of the contribution of the IT-eS industry to new
middle class formation, this study draws on data collected via semi-structured
interviews, which is qualitative in nature and a survey, which is quantitative. The
purpose of such a multi-methods and multi-strand approach is both triangulation
and complementarity. While triangulation corroborates the findings from both
methods, complementarity elaborates the results from one method with results
from the other (Bryman, 2003, 2007).
The primary unit of analysis of both the interviews and the survey are the
employees working in the IT-eS industry. This includes only the core group of
employees of the firms, excluding support staff such as security guards and house-
keepers, as well as top-level managers. The support staffs are the indirect
beneficiaries of the industry who fall into a socio-economic category different
from that of the core employees (see Kumar, 2016 for a detailed analysis on the
indirect beneficiaries of the IT-eS industry in India). Similarly, managerial level
executives come from a higher social class, who cannot be analysed together with
the core group of IT-eS employees. However, a few managerial level employees
were included in the interview sample in order to validate the findings arrived at
from the core group of workers. Further, the analysis pertains only to IT-eS
workers working for the international market. While the domestic IT-eS industry
in India is steadily expanding, its dynamics are different from that of its
international counterpart. This is reflected in the different eligibility criteria for
employment in the two sectors (for example, language requirements), making the
Research Methods

46
pool of employees working in the two segments different from each other in terms
of their skill sets and educational levels.
The following sections describe the two methods of semi-structured interviews
and survey in detail.
3.4 Semi-structured interviews
The fieldwork for this research began with semi-structured interviews of
employees and top-level managers of the IT-eS industry in Mumbai. Interviews
were chosen as one of the research methods for their value in offering in-depth
information about the phenomenon being observed (Yin, 2009). Before conducting
the actual interviews for this research, the author accompanied another researcher
(a colleague in the same research project) for her interviews of top-level managers
of the IT and IT-eS industries in Mumbai. Although the author was merely an
observer in this process, it helped her gain preliminary understanding of the
working of the IT-eS industry in Mumbai and to initiate a few contacts in the
industry.
The actual interviews for this research began in October 2012 and culminated in
November 2014. In between this period, this author also visited the University of
Amsterdam for research training, attending course-work and presenting the
initial findings of the research in academic seminars. There was no specific
fieldwork period assigned for the interviews as gaining access to interviewees was
one of the biggest challenges faced during the research process. Because
international IT-eS firms deal with highly confidential data of clients located
abroad, they are wary of sharing any kind of information with strangers, even if
they are for purely academic purposes. This researcher even encountered a few
potential interviewees who refused to divulge any information about their work as
they were legally bound to not share any work-related information with
Chapter 3

47
outsiders. Access to potential respondents was further difficult as most of them
work during the night and spend the day taking rest, having very little time to
talk to researchers. Similar challenges in gaining access to the IT and IT-eS
industries in India have been documented by Kleibert (2015), Kumar (2016) and
Vira & James (2012). Because of this difficulty in gaining access to potential
respondents, the fieldwork period was stretched across two years, with interviews
being conducted whenever the researcher got lucky in finding a respondent
willing to participate in the research. The researcher being located in the same
city as that of the research site helped in stretching the fieldwork period. 28 in-
depth semi-structured interviews were conducted by the researcher during this
period of two years.
The difficult access to respondents played a role in the sample design for the
research. Because of the industry’s inaccessibility, potential interviewees were
contacted via the author’s personal networks, instead of a random sampling
method. However, to avoid any sample bias arising out of the author’s own class
background, the networks were specifically asked to suggest interviewees coming
from diverse social backgrounds, working in different companies, in different job
profiles and with diversified industry experience. Appointments for the interviews
were taken over the telephone, after which the interview took place at a location
of convenience to the respondent. Of the 28 interviewees, 24 were reached via the
author’s personal networks and contacts of four interviewees were obtained from
the earlier respondents. Most of the respondents were current employees of the
IT-eS industry, but former employees as well as high-level managers also formed
a part of the sample (see Table 3.1 for a summary of the sample). The job-profile
of the interview respondents was varied, ranging from data-entry operators and
call-centre executives to HR managers (see Table 3.2). Each interview lasted for
an average of about an hour (see Appendix A3.1 for a detailed list of interviews
conducted). All interviews were transcribed and the insights from them are
Research Methods

48
analysed in Chapters 6 and 7. These chapters also explain the nature of questions
included in the interviews.
3.5 Primary survey
Table 3.1 Sample Summary
Interviews Survey
Employees Industry
experts
Total
(Employees +
experts)
Employees
Sample size 22 06 28 330
Male 17 06 23 225
Female 05 00 05 105
Current employees 17 06 23 256
Former employees 05 00 05 74
Average age
(years) 28 - - 25
Average
experience in the
industry (years)
5.7 - - 2.5
Source: Compiled by the author based on the field data collected.
A primary survey of 330 current and former IT-eS employees complemented the
semi-structured interviews (see Table 3.1 for a sample summary). The purpose of
the survey was to triangulate the findings from the interviews as well as to
complement them by gaining broad inferences about the research. Responses from
the initial interviews were used as the basis to structure the survey questionnaire,
which was further built taking the research questions into consideration (see
Appendix A3.2 for the survey questionnaire). Again, given the wariness of
Chapter 3
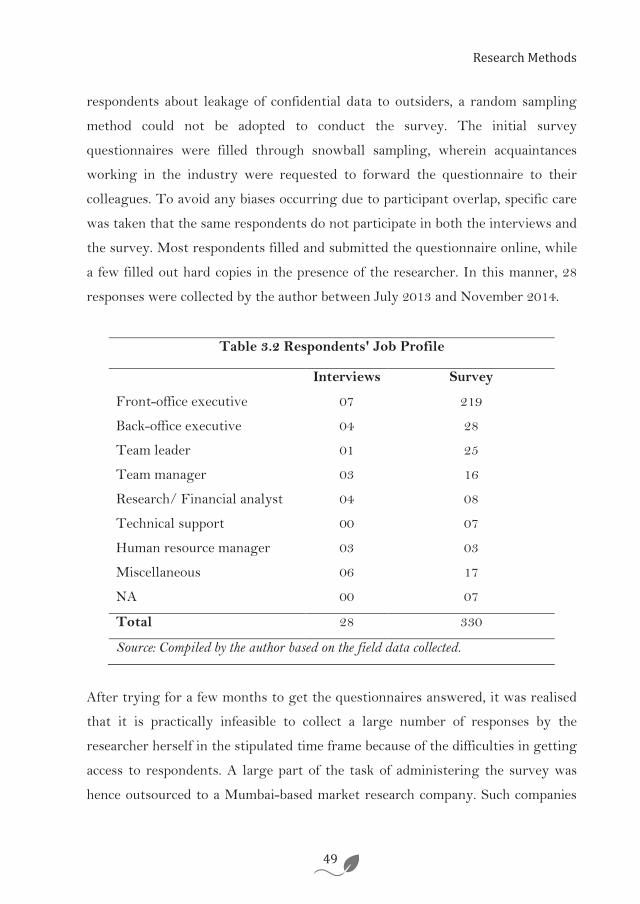
49
respondents about leakage of confidential data to outsiders, a random sampling
method could not be adopted to conduct the survey. The initial survey
questionnaires were filled through snowball sampling, wherein acquaintances
working in the industry were requested to forward the questionnaire to their
colleagues. To avoid any biases occurring due to participant overlap, specific care
was taken that the same respondents do not participate in both the interviews and
the survey. Most respondents filled and submitted the questionnaire online, while
a few filled out hard copies in the presence of the researcher. In this manner, 28
responses were collected by the author between July 2013 and November 2014.
Table 3.2 Respondents' Job Profile
Interviews Survey
Front-office executive 07 219
Back-office executive 04 28
Team leader 01 25
Team manager 03 16
Research/ Financial analyst 04 08
Technical support 00 07
Human resource manager 03 03
Miscellaneous 06 17
NA 00 07
Total 28 330
Source: Compiled by the author based on the field data collected.
After trying for a few months to get the questionnaires answered, it was realised
that it is practically infeasible to collect a large number of responses by the
researcher herself in the stipulated time frame because of the difficulties in getting
access to respondents. A large part of the task of administering the survey was
hence outsourced to a Mumbai-based market research company. Such companies
Research Methods

50
have the necessary connections with firms to access the requisite information.
They also have the manpower to conduct large scale surveys in a short period of
time. The company collected 302 responses between August 2013 and September
2013. The data collected by the company was validated by contacting a random
sample of 53 survey respondents of the company via telephone and verifying their
responses. Further, this data was also compared with the smaller sample collected
by the author (see Vira & James, 2012, who also adopt a similar method to study
IT and IT-eS industry workers in India).
Similar to the interviews, the sample of employees in the survey was drawn from
diverse activities in the IT-eS sector, ranging from data-entry operations and call-
centres to advanced financial analytics (see Table 3.2). The majority of
respondents worked in lower-end segments of the IT-eS industry as front-office
or back-office executives. The former consists of jobs involving direct interaction
with clients such as call-centre operations or handling online customer queries via
chat or email. The latter consists of data-entry jobs or basic data analysis,
involving no direct interaction with clients. The typical education level of these
respondents was a higher secondary school or a graduate degree. Those in the
higher-end segment of the industry, who worked as financial analysts or
workforce strategists typically held a Masters’ degree in commerce, economics,
finance or management or a professional qualification such as a charted
accountant. The data from the survey was entered into MS-Excel and analysed in
R. The survey questions and results are presented in Chapters 6 and 7.
3.6 Research site location-Mumbai
As already elucidated, India is globally the most attractive location for offshoring
of services. IT and IT-eS firms in India are mainly concentrated in the metro
cities of Bengaluru (formerly Bangalore), Chennai (formerly Madras), New Delhi
and its surrounding areas of Noida and Gurugram (together called the National
Chapter 3

51
Capital region), and Mumbai (formerly Bombay). Lately, smaller cities like Pune
are also becoming attractive locations for the setting up of offshore-service
companies. However, given the vast distances between the cities and the
difficulties in gaining access to the firms and its employees, the field work for this
study was concentrated only in the city of Mumbai.
Mumbai was chosen as the research site for a variety of reasons. First, the city has
traditionally been the commercial capital of India. It was initially developed as a
port city, after which it became the textile manufacturing hub of the country.
Gradually, with the decline of the textile mills, the city has been developed as the
financial centre of the country, attracting many multi-national finance and allied
services firms (D’Monte, 2002). Furthermore, in the British colonial era, Mumbai
was one of the few cities to be developed as an educational hub, especially in
higher-level English education (see Dobbin, 1972). Consequently, the city has
become an attractive destination for higher educational opportunities and
continues to produce many well-qualified college graduates and professionals.
The presence of many established service sector firms along with sufficient
availability of a talented labour pool has made the city an attractive destination
for service offshore firms, particularly in the IT-eS segment of the industry, which
is mostly finance-based. Mumbai is globally ranked third and nationally second in
the rankings of service outsourcing destinations (Tholons, 2014). Second,
Mumbai has attracted many researchers on all kinds of urban and economic
issues, but very few studies on the IT and IT-eS industries in India have
concentrated on Mumbai, despite its importance as a global destination for
offshoring services. Most of the extant studies focus on the southern cities of
Bengaluru and Chennai, or the capital city of New Delhi (see Fuller &
Narasimhan, 2007; Upadhya, 2007; Vira & James, 2012). Third, Mumbai was
practically the most feasible location to undertake the study because of the
familiarity of the author with the city.
Research Methods

52
Mumbai is located along the west coast of India. It is the capital city of the state
of Maharashtra. The island city in the south and the adjoining suburban areas to
the north together constitute Greater Mumbai, that is, the Mumbai city-proper. It
has a total area of 603.4 km2 and a population size of 12.4 million in 2011, making
it the most populous city in India. Additionally, parts of the adjoining districts of
Thane, Raigad and Palghar, which includes the satellite city of Navi Mumbai
(New Mumbai), constitute the Mumbai Metropolitan Region (MMR). With a
population size of 22.8 million in 2011, the MMR is the second largest urban
agglomeration in the country and the ninth largest globally. It has an area of
4,355 km2. The research for this study was conducted in various parts of the
MMR, as most IT-eS firms are situated in the western and central suburban
region of Mumbai city and in parts of Thane and Navi Mumbai, rather than in the
island city in the south (see Figure 3.1 for an indicative map of IT and IT-eS firms
located in Mumbai). The location of firms across the city was a practical
constraint for the research as it meant travelling across the length and breadth of
the city for conducting the research. It may be noted that there are no
comparisons made across firms or IT parks located in different regions of the city
as these parks are not segregated in different locations based on their
specialisation or such other dimension. The location of IT-eS firms away from the
main city and in different pockets of the MMR is purely on account of spatial
constraints within the city and cost considerations.
Chapter 3
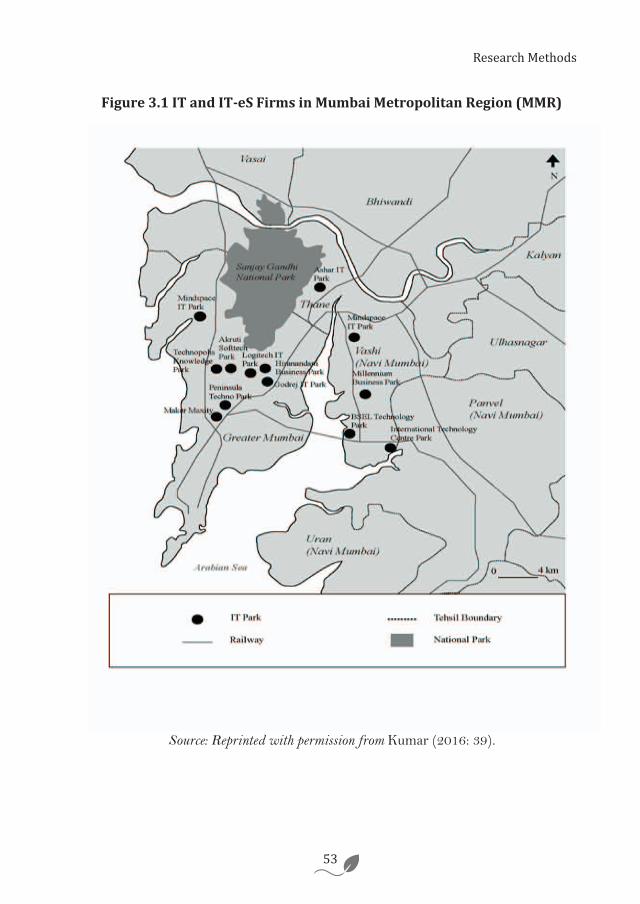
53
Figure 3.1 IT and IT-eS Firms in Mumbai Metropolitan Region (MMR)
Source: Reprinted with permission from Kumar (2016: 39).
Research Methods

54
Imag
e 1:
Aer
ial V
iew
of
Mum
bai P
hoto
cou
rtes
y: N
eera
j Hat
ekar
54

55
Imag
e 2:
Vie
w f
rom
insi
de a
n IT
-eS
firm
loca
ted
in M
umba
i Pho
to: S
andh
ya K
rish
nan
55

56
3.7 Research ethics and limitations of the study
While conducting this study, efforts have been made to follow the ethical
practices that ideally govern any research procedure. Analysis of the NSS data
was undertaken meticulously. Wherever possible, the calculated figures were
cross-checked with those in the published reports of the NSS. Other
computations, not available in the official reports, were verified with the help of
research assistants, who performed the same calculations as this author. All
interview and survey respondents were thoroughly informed about the purpose of
the research. Interviews were recorded only after seeking prior permission from
the respondents. Wherever such permissions were not granted, the researcher
resorted to note-taking. Because most respondents were wary of their identities
being revealed, the names of all participants and the companies they are
associated with have been kept confidential throughout this study.
While this research has been undertaken earnestly, it is not without its
limitations. Results from the NSS surveys should be interpreted keeping in mind
their shortcomings. First, the survey is based on self-reporting of the participants
and there is no way to verify the answers of the respondents. Second, all data are
collected at the household level, wherein per capita figures are arrived at by
dividing the household level data by the household size. To this extent, the NSS
data do not reveal the differences in consumption expenditure between members
of a sample household. Third, similar to other large scale surveys, the information
at the tails of the survey distribution may not be very accurate. Finally, data from
the NSS are in divergence with other large scale data sets on consumption
expenditure such as the National Accounts Statistics, wherein the latter source
generally has a greater mean. However, given the exhaustive information on
consumption expenditure available in the NSS surveys, we chose to use this data
source, despite its imperfections.
Chapter 3

57
In the primary data on IT-eS employees, the empirical analysis is constrained to
the city of Mumbai. The city of Mumbai is unique in multiple ways. Mumbai
attracts the largest number of migrants in India because of the availability of jobs
in the city. However, real estate prices in the city are very high even by global
standards, making the city quite expensive to live in. Hence, employees from pre-
existing middle class families that have secure jobs elsewhere in India, have little
incentive to migrate to the city. These peculiarities of Mumbai should be taken
note of before extending the results from this study to other metropolitan cities of
India that have also attracted the IT-eS industry. Furthermore, these results have
limited applicability to the smaller Indian cities that are emerging as offshoring
hubs. Given the different dynamics of small cities as compared to the large ones,
the impact of the industry on the former may be quite different from that on the
latter. Also, although the phenomenon of the emergence of the service-
outsourcing industry and the consequent emergence of a new middle class is not
unique to India, this study cannot be generalised to other locations where similar
transformations are at work. Every society is unique in its own ways; in India, for
instance, studies on class ought to incorporate the dimension of caste (Beteille,
2007; Sheth, 1999), making it incomparable with other societies where similar
social systems do not exist. At the most, this research can help compare similar
developments taking place in other parts of the world.
Finally, data from the NSS surveys, such as that on consumption expenditure of
households may not be strictly comparable to that gathered from the primary
field survey. Though the city of Mumbai is part of the NSS sample, city-level data
cannot be analysed separately as the sample size at the city-level is quite small in
the NSS surveys to draw any reliable conclusions. In contrast, data from the
primary survey is restricted to the city of Mumbai. Hence, to minimise problems
of comparability, we compare the urban level data from the NSS surveys with that
of the primary level data, wherever required. However, given the uniqueness of
each city in India, this comparison has its own problems. The results in this study
should be interpreted keeping in mind these limitations of the data.
Research Methods

58
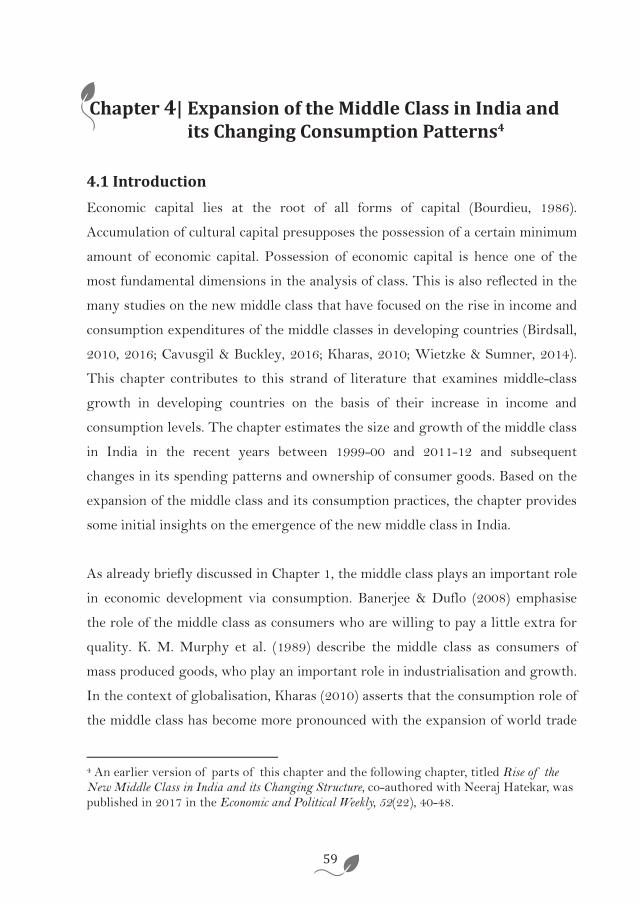
59
Chapter 4| Expansion of the Middle Class in India and its Changing Consumption Patterns4
4.1 Introduction
Economic capital lies at the root of all forms of capital (Bourdieu, 1986).
Accumulation of cultural capital presupposes the possession of a certain minimum
amount of economic capital. Possession of economic capital is hence one of the
most fundamental dimensions in the analysis of class. This is also reflected in the
many studies on the new middle class that have focused on the rise in income and
consumption expenditures of the middle classes in developing countries (Birdsall,
2010, 2016; Cavusgil & Buckley, 2016; Kharas, 2010; Wietzke & Sumner, 2014).
This chapter contributes to this strand of literature that examines middle-class
growth in developing countries on the basis of their increase in income and
consumption levels. The chapter estimates the size and growth of the middle class
in India in the recent years between 1999-00 and 2011-12 and subsequent
changes in its spending patterns and ownership of consumer goods. Based on the
expansion of the middle class and its consumption practices, the chapter provides
some initial insights on the emergence of the new middle class in India.
As already briefly discussed in Chapter 1, the middle class plays an important role
in economic development via consumption. Banerjee & Duflo (2008) emphasise
the role of the middle class as consumers who are willing to pay a little extra for
quality. K. M. Murphy et al. (1989) describe the middle class as consumers of
mass produced goods, who play an important role in industrialisation and growth.
In the context of globalisation, Kharas (2010) asserts that the consumption role of
the middle class has become more pronounced with the expansion of world trade
4 An earlier version of parts of this chapter and the following chapter, titled Rise of the New Middle Class in India and its Changing Structure, co-authored with Neeraj Hatekar, was published in 2017 in the Economic and Political Weekly, 52(22), 40-48.
Chapter 4| Expansion of the Middle Class in India and its Changing Consumption Patterns4

60
as globally more people now have access to a wider variety of consumer goods.
The current global economic scenario has made the consumption role of the
middle class in emerging economies even more significant. In the light of the
global economic crisis as consumer demand from the western middle classes
continues to remain bleak, middle classes in developing economies like India have
become all the more important not only for driving domestic growth, but also in
the recovery of global consumer demand (ADB, 2010; Kharas, 2010; Wilson &
Dragusanu, 2008).
The analysis in this chapter on spending patterns of the middle class and the type
of consumer goods it owns adds to such existing literature on the consumption-
based developmental role of the middle class. It also enables us to comprehend the
changes in consumption behaviour across classes in both qualitative (type of
goods owned or consumed) and quantitative terms (change in share of
expenditure on different goods). Besides, such a national level analysis puts the
changes in lifestyles and consumption practices brought about by the emergence
of the IT-eS industry in a larger perspective (see chapter 7). Existing studies on
the expansion of the middle class in India are quite dated (see for example,
Ravallion, 2010; Sridharan, 2004), focusing on the period starting from India’s
liberalisation in 1990 until the crisis period of 2008-09. If we are to expect middle
classes in countries like India to rebalance global consumption growth, it is vital
to measure its growth after the world economic crisis set in. This chapter
provides updated estimates of middle-class growth in India, until the year 2011-
12.
As described in the last chapter, this chapter draws on NSS data on Household
Consumer Expenditure in India. The following section provides an overview of
the growth in consumption expenditure in India between 1999-00 and 2011-12.
The subsequent section surveys existing income/consumption-based definitions
Chapter 4

61
of the middle class and their estimates, thereby arriving at the definition that will
be used in this thesis. Middle class size in India and its growth from 1999-00 to
2011-12 are estimated in Section 4.4. Section 4.5 traces middle class expansion
across different states in India, while section 4.6 studies the spending patterns
across classes. This is followed with an analysis on the distribution of select
groups of assets across classes. The final section concludes.
4.2 Expanding consumption expenditure in India
The middle class in India has been at the centre of attention for its rising
consumption capacity (Ablett et al., 2007; ADB, 2010; Ravallion, 2010; Shukla,
2010), but little is known about growth in aggregate consumption expenditure of
the entire population. Before we investigate the expanding size of the middle
class, it is hence worthwhile to glance at the growth of consumption expenditure
in general in India in the recent years between 1999-00 and 2011-12.
Figure 4.1 shows, that between 1999-00 and 2004-05 (henceforth t1) real per
capita consumption expenditure in India hardly showed any growth. Contrary to
claims made in several reports about India’s rising consumption expenditure in
the early 2000s (see ADB, 2010; Wilson and Dragusanu, 2008), growth in real
consumption expenditure actually declined in t1 across all deciles, except the top
two (see also Table 4.1). A rural-urban segregation of data (Figures 4.2 and 4.3)
shows, that rural India performed much worse than its urban counterpart. Except
for the richest 10 per cent of the population, rural India witnessed a negative
growth in its consumption expenditure in t1. In urban India in contrast, except for
the poorest 10 per cent of the population, all expenditure groups recorded a
growth in their consumption expenditure, although only marginally. During the
years 2004-05 and 2011-12 (henceforth t2) consumption expenditure in India
witnessed a remarkable growth across all expenditure deciles in both rural and
urban areas, although the latter recorded a relatively higher rate of growth. This
Expansion of the Middle Class in India

62
shows that India’s consumption growth actually accelerated during times when
the world economy in general was witnessing a slowdown in growth. This
vindicates the assertions made in several studies that consumer demand from
countries such as India will help rebalance global economic growth (ADB, 2010;
Kharas, 2010; Wilson & Dragusanu, 2008).
Table 4.1Compound Annual Growth Rate of Real Daily Per Capita Consumption Expenditure across Deciles (%)
Decile 1999-00 to 2004-05 (t1) 2004-05 to 2011-12 (t2)
India Rural Urban India Rural Urban
1 -0.81 -0.84 -0.15 4.42 4.28 4.23
2 -0.83 -0.88 0.05 4.61 4.46 4.50
3 -0.85 -0.97 0.23 4.70 4.59 4.62
4 -0.77 -0.96 0.48 4.80 4.60 4.76
5 -0.72 -0.89 0.68 4.96 4.66 4.79
6 -0.57 -0.91 0.89 5.12 4.79 4.73
7 -0.38 -0.80 1.20 5.28 4.91 4.63
8 -0.15 -0.72 1.33 5.34 5.04 4.68
9 0.54 -0.59 1.80 5.32 5.05 4.63
10 1.91 1.13 1.97 5.60 4.88 5.66
Source: Author’s calculations based on NSS Household Consumer Expenditure Surveys,
1999-00, 2004-05 and 2011-12.
Note: Consumption expenditure is based on the Mixed Reference Period method.
Inflation rates are computed using the GDP deflator.
Although consumption expenditure growth in India has improved in t2 as
compared to t1, the data point towards an unequal distribution of returns to
growth. In t1, real consumption expenditure growth declined among the large
majority of Indians, but the relatively poorer sections of the population recorded a
larger rate of decline in consumption growth than the relatively rich. Especially in
urban India, the rate of growth in consumption expenditure systematically
Chapter 4

63
increased along the consumption curve. Similarly, in t2, even as the rate of growth
in consumption expenditure was positive across all expenditure deciles, in
general, the relatively rich witnessed a higher rate of expenditure growth as
compared to the poor. Also, the higher growth rate among the relatively rich in t2
has occurred in spite of a higher base. Thus, even though all expenditure groups
were better-off in t2 than in t1, the distribution of consumption expenditure
growth in both periods was rather unequal, the proceeds of growth most
benefitting the top-most deciles of the population.
Figure 4.1 Daily Average Per Capita Consumption Expenditure across Expenditure Deciles, India
Source: Author’s calculations based on NSS Household Consumer Expenditure Surveys, 1999-00,
20004-05 and 2011-12
Expansion of the Middle Class in India
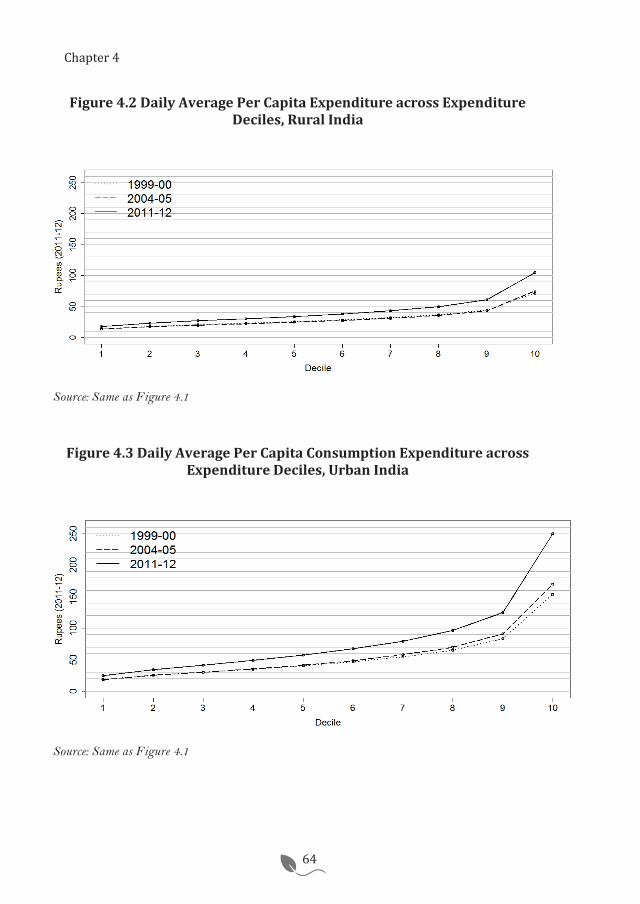
64
Figure 4.2 Daily Average Per Capita Expenditure across Expenditure Deciles, Rural India
Source: Same as Figure 4.1
Figure 4.3 Daily Average Per Capita Consumption Expenditure across Expenditure Deciles, Urban India
Source: Same as Figure 4.1
Chapter 4

65
The question of interest for this study is how the middle class in particular
performed during this period. Let us consider period t2, when consumption
expenditure growth was positive across the entire population. In urban India, if
we leave out the top-most decile of the population, we find that the highest
increase in consumption expenditure growth happened somewhere in the middle
of the distribution, between the 40th and 60th percentiles of the population.
Similarly, in rural India, leaving out the richest 10 per cent of the population, the
50th to 80th percentiles of the population witnessed the highest increase in
consumption expenditure. Based on Easterly's (2001) definition, who classifies the
middle class as those between the 20th and 80th percentile of the population, our
data indicates that if we ignore the richest 10 per cent of the population, the
highest growth rates in consumption expenditure in India in t2 was recorded by
the middle class. However, relative definitions such as that of Easterly (2001) are
of little help in estimating the size of middle class expansion over time. Absolute
definitions will be useful for inter-temporal analyses of middle-class growth. The
following section surveys some of the existing absolute-type definitions of the
middle class, arriving at the one that will be used in this study.
4.3 Economic definitions of the middle class and their estimates- A
critical review
4.3.1 Survey of middle class definitions
There are several income-based or consumption-based definitions of the middle
class. These can broadly be classified into relative and absolute types. In the
relative type, Birdsall, Graham & Pettinato (2000) define middle strata households
as those with per capita income in the range of 75 and 125 per cent of the median
household per capita income. Easterly (2001) defines the middle class as those
lying between the 20th and 80th percentile of their country’s consumption
distribution. Relative definitions are essentially useful for conducting cross-
Expansion of the Middle Class in India

66
sectional analyses of the middle class. For inter-temporal studies on the middle
class like the present one, absolute definitions need to be employed. But even
within the absolute type, there are a host of different definitions of the middle
class. This section critically reviews a select few, subsequently choosing one
definition that will be applied in this thesis.
One type of absolute definition is proposed by Kharas (2010), who defines the
middle class as those with daily per capita incomes between $10 and $100 in
purchasing power parity (PPP) terms. The lower bound is chosen with reference
to the average poverty line in Portugal and Italy, while the upper bound is chosen
as twice the median income of Luxembourg, the richest advanced country. Meyer
& Birdsall (2012), in their study on the middle class in India use the same lower
threshold of $10 per capita per day, measured in 2005 PPP, but their upper bound
is defined at $50. They argue that the lower bound of $10 is the global minimum
to be categorised as the middle class. The upper bound is set at $50 because most
Latin American households earning beyond this limit consider themselves rich,
not middle class (see Birdsall, 2012). Kochhar (2015), in his study on the global
middle class defines the class as those with a daily income or consumption
between $10 and $20, measured in 2011 PPP. Similar to Meyer & Birdsall (2012),
Kochhar (2015) associates the lower threshold of $10 (which is five times the
global poverty line) with economic security, which insulates people from falling
back into poverty. Wilson & Dragusanu (2008) define the global middle class as
those with an annual income between $6000 and $30000 (2007 PPP) or between
$15 and $80 on a daily basis. A popular definition of the middle class in the Indian
context is provided by the National Council of Applied Economic Research
(NCAER). It defines middle class households as those earning an annual income
between `200,000 and `1 million in 2001-02 prices (Shukla 2010: 100). Assuming
an average household size of five, this approximately equals $11 and $55,
respectively, per capita per day, in 2005 PPP terms, close to the bounds defined
Chapter 4

67
by Meyer & Birdsall (2012). In essence, these definitions imply that the middle
class are those who are well above poverty not only in their own countries, but
also by the standards of developed countries.
In contrast to the above definitions, which mostly cater to measuring the global
middle class, some studies have come up with definitions of the middle class
particularly in the context of developing countries. They include within the
middle class all those individuals who are fairly above the poverty line by
developing country standards, having a sufficient amount of discretionary income
to spend. Using household surveys of 13 developing countries including India,
Banerjee & Duflo (2008) define the middle class as those who spend between $2
and $10 per capita, per day, valued at 1993 PPP. Within the middle class, they
further consider two groups of households- the lower-middle class, whose daily
per capita expenditures are between $2 and $4 and the upper-middle class, whose
expenditures lie between $6 and $10. Banerjee & Duflo (2008) acknowledge that
the lower limit of $2 is well below the poverty line of developed countries.
However, for most of the countries considered in their sample, this range
composed of those lying between the 20th and 80th percentile of the income
distribution of these countries, in line with Easterly's (2001) relative definition of
the middle class. Furthermore, for rural India, the $2 line lies above the 80th
percentile of the consumption distribution, so that the $2 to $4 category is richer
than Easterly’s middle class. Similarly, Ravallion (2010) identifies the developing
world’s middle class as those who are not poor by the standards of developing
countries but are poor by the standards of rich countries. He defines the lower
bound of middle class as the median of poverty lines of 70 developing countries,
which is $2 per capita, per day, measured in 2005 PPP. The upper bound is
defined as the poverty line of the US in 2005, which is $13. ADB (2010) identifies
the middle class in developing Asia using the same lower bound of $2 (2005 PPP),
but a higher upper bound of $20 per person per day, which is roughly equivalent
Expansion of the Middle Class in India

68
to the poverty line of Italy. The middle class is further divided into three groups,
depending on their ability to save and consume. The lower-middle class, that is,
individuals spending between $2 and $4, are only slightly above the global
poverty line and very vulnerable of slipping back into poverty. The middle-middle
class, at $4 - $10 is living above subsistence and able to save and consume
discretionary goods. Finally, upper-middle class, consuming between $10 and $20
per day are above the poverty lines of Brazil and Italy, respectively.
Different from these income and consumption-based approaches, Krishna & Bajpai
(2015) define the middle class in India on the basis of ownership of transportation
assets. They define the lower-middle class as those whose best available means of
transportation is a motor-cycle or a motor-scooter. The upper-middle class
consists of those who possess a car, whereas the rich are those who possess both
an air-conditioner and a car. The authors are of the view that in contemporary
India, assets are the key status symbols of middle class identity.
4.3.2 Estimates of middle class size in India
Obviously, these varied definitions give different estimates of the size of the
middle class in India. Research based on a developing country definition of the
middle class, that is, those spending roughly above $2 per day, find that around
2005, India’s middle class accounted for about a quarter of its population. For
instance, Ravallion (2010) finds India’s middle class to have expanded from 17.3
per cent of the population (146.8 million people) in 1991 to 24.1 per cent (263.7
million people) in 2005. Similarly, the ADB (2010) classifies 274.13 million
Indians, accounting for 25.05 per cent of the country’s population in 2005, as
middle class. According to Sridharan (2004), India’s middle class has expanded
from 14.2 per cent of households in 1989-90 to 25.8 per cent in 1998-99. Banerjee
& Duflo (2008) find 12 per cent of rural India and 38 per cent of urban India in
Chapter 4

69
the middle class. Most of them however are in the lower-middle class, spending
less than $4 per day.
Studies that use a global definition of the middle class, that is, which define the
middle class as those with incomes more than $10 per capita per day, find India’s
middle class size to be much smaller, ranging between 5 and 10 per cent of its
population. Meyer & Birdsall (2012), estimate India’s middle class size at 69.2
million people, or 5.9 per cent of the total population. Out of this, 27.8 million
people live in rural areas and 41.3 million in urban areas. Thus, according to the
estimates of Meyer & Birdsall (2012), most of India’s middle class is concentrated
in the urban areas. Kochhar (2015) finds little growth in India’s middle class
between 2001 and 2011. According to him, the share of population that could be
considered middle class increased from 1 per cent to just 3 per cent in this period.
In fact, instead of a burgeoning middle class, he finds that India’s ranks of low-
income earners have swelled in this period.
A few other studies, based on a global definition of the middle class similarly find
India’s middle class size to be relatively small. However, these studies expect the
class to expand further in the future, such that it will drive global consumption.
Kharas (2010), for example, estimates India’s middle class size to be in the range
of 5 to 10 per cent of its population in 2009. But between 2015 and 2025, half of
India is expected to be in the middle class category and in the next 30 years the
class is expected to dramatically expand to 90 per cent of its population. Similarly,
Wilson & Dragusanu (2008) estimate India’s middle class size at just 5 per cent of
the population in 2007, but expect the country to become the driver of global
middle class creation in the next decade, with the vast majority of Indians
entering the middle class by 2040. Ablett et al. (2007), in their study on the rise of
the Indian middle class, predict that as a result of drastic poverty reduction
India’s middle class size will swell by over 10 times from 50 million people in
Expansion of the Middle Class in India
70
2006 to 583 million people in 2025. Although most of this increase will happen in
the urban areas, rural areas too will benefit from the new wealth and consumption
creation.
In stark contrast to the above studies that expect India’s middle class to grow
further in the future, Krishna & Bajpai (2015) find the proportion of the middle
class to have increased from 11 per cent in 1992-93 to 22 per cent in 2005-06, but
declined thereafter to 17 per cent in 2007-08. Much of the stagnation in middle-
class growth appears to have taken place in rural India.
Such varied estimates of the size and trends in middle-class growth in India
suggest that it is necessary to carefully re-calibrate the growth in India’s middle
class, particularly after the crisis period of 2008-09.
4.3.3 Arriving at a suitable middle class definition
Given these various definitions and estimates of the middle class, the critical
question is which of them best describes the middle class in India. Though
Krishna & Bajpai (2015) use a rather novel definition, which well relates to the
contemporary middle class in India, it is not without problems. First, the authors
themselves point out that assets are relatively more stationary than income or
consumption, implying that ownership of assets does not accurately reflect the
fast-paced change in income and consumption taking place in India lately. Second,
ownership of type of transportation assets depends on local infrastructure,
particularly, transport facilities, which are quite diverse in different regions of
India. Thirdly, as economies grow, the value of different assets change, making
this definition redundant for long term analyses. A transportation-asset based
classification is hence not the best way to define the middle class.
Chapter 4

71
The income or expenditure bounds of the middle class put forth by Kharas (2010),
Kochhar (2015), Meyer & Birdsall (2012), NCAER and Wilson & Dragusanu
(2008) are better suited in a developed country context. As Banerjee & Duflo
(2008) and Birdsall (2016) show, the minimum threshold of $10 that these
definitions use, is quite high in a developing country context. The definitions
proposed by ADB (2010), Banerjee & Duflo (2008) and Ravallion (2010) are set at
a lower bound of $2. A minimum expenditure of $2 is reasonable to be identified
as middle class in a developing country as it ensures a base amount of
consumption that can contribute economically to growth (Chun et al., 2011).
However, ADB (2010) and Ravallion (2010) measure expenditures in 2005 PPP.
Compared to the World Bank poverty line of $1.9 a day (2011 PPP), it places the
middle class only marginally above the poor. As against this, Banerjee & Duflo
(2008) measure expenditure at a higher real value of 1993 PPP which is
sufficiently greater than both the global poverty line and the national poverty line
for India5. As Banerjee & Duflo (2008) themselves observe, the range of $2 to $4
enables us to compare the differences in expenditures of the poor and the bottom
of the middle class and whether they change as we move higher in the
expenditure distribution. The upper-bound of $10 is ideal to ensure that no non-
middle class person is left out of the category as well as no affluent member is
included in the middle class. We therefore find the definition offered by Banerjee
& Duflo (2008) the most fitting to be applied in the Indian context among all
existing economic definitions of the middle class.
4.4 Estimating middle class size
To calculate the size of the middle class in India using the NSS data for the years
1999-00, 2004-05 and 2011-12, we first convert the consumption expenditure
5 The national poverty line suggested by the Tendulkar committee (Planning Commission, 2013) is daily per capita expenditure of `27.2 (2011-12 prices) or $1.8 (2011 PPP) for rural India and `33.3 (2011-12 prices) or $2.2 (2011 PPP) for urban India.
Expansion of the Middle Class in India

72
ranges proposed by Banerjee & Duflo (2008) in 1993 PPP dollars (private
consumption) to Indian Rupees. Thereafter, we adjust them for inflation rates in
India for the years under consideration. To calculate inflation rates, we use the
GDP deflator instead of the Consumer Price Index (CPI). We do so because the
new CPI series for India (CPI-rural and CPI-urban) is available only from 2011-
12 onwards. Older CPI indices do not correctly reflect prices faced by the
aggregate national population as they are restricted to Agricultural Labourers
(CPI-AL) or to Industrial Workers (CPI-IW) alone. Nonetheless, we compared
middle class expenditure ranges for rural and urban areas using both GDP
deflator and CPI-AL (for rural areas) and CPI-IW (for urban areas) adjusted
prices. Since there are no significant differences in the expenditure ranges, we
settled for the GDP deflator. The Rupee-denominated expenditure ranges for the
different classes thus obtained are presented in Table 4.2.
Table 4.2 Daily Per Capita Consumption Expenditure Range for Different Classes
in India Using the Banerjee-Duflo Definition (figures in `)
1999-00 2004-05 2011-12
Poor (<$2) <20.3 <24.7 <39.5
Middle class ($2-$10) 20.3-101.7 24.7-123.4 39.5-197.3
Lower-middle class ($2-
$4) 20.3 - 40.7 24.7 - 49.4 39.5 - 78.9
Middle-middle class ($4-
$6) 40.7-61.0 49.4-74.0 78.9-118.4
Upper-middle class ($6-
$10) 61.0 - 101.7 74.0 - 123.4 118.4 - 197.3
Affluent (>$10) >101.7 >123.4 >197.3
Source: Author’s calculations based on World Data Bank (PPP rates- private consumption) and Handbook of Statistics on Indian Economy, Reserve Bank of India (GDP deflator). Converting the middle class expenditure ranges of Table 4.2 to percentile terms
by applying them to the data in Figure 4.1, we find that the middle class in 1999-
00 and 2004-05 were above the 80th percentile of the population distribution of
Chapter 4

73
consumption expenditure. In other words, the middle class in t1 were well above
Easterly’s (2001) relative definition of the middle class, which ranged between
20th and 80th percentiles of the consumption distribution. In 2011-12, the middle
class in India lay among the top 50 percent of the population, which partly
includes the middle class as per Easterly’s (2001) definition.
Figures from 4.4 to 4.7 show the actual size of different classes in India, across
rural and urban areas. In t1 there was no significant change in the size of the
middle class in India. In fact, the share of the middle class in the total population
shrunk marginally, while that of the poor increased. Within the middle class
(Figure 4.5), the middle-middle and upper-middle classes expanded, but this was
offset by a larger decline in the share of the lower-middle class. These findings are
consistent with results presented in Section 4.2 above on the growth in
consumption expenditure in India across different expenditure deciles. Since the
majority of the Indian population, especially the relatively poorer sections of the
population witnessed a negative growth rate in their consumption expenditure in
t1, it is not surprising that the size of the middle class remained stagnant during
this period.
In contrast to t1, in t2, we witness an astonishing change in class composition in
India. The share of the poor declined from over 70 per cent to less than 50 per
cent of the population (Figure 4.4). The middle class, which accounted for less
than 30 per cent of the population earlier, rose to over 50 per cent. In absolute
size, the middle class almost doubled, from 304 million in 2004-05 to 604 million
in 2011-12. The middle-middle and upper-middle classes also expanded, from a
mere 5 per cent of the population in 2004-05 to 13 per cent in 2011-12 (see also
Appendix A4.1). Interestingly, the bulk of the expansion in the middle class in
this period was led by the lower-middle class, which constituted three-fourths of
the total middle class population. These results are also in line with that of
Expansion of the Middle Class in India

74
Section 4.2, where all expenditure deciles recorded a considerable growth in their
real consumption expenditures in t2, but those in the middle of the distribution
showed among the highest rate of growth in consumption.
Figure 4.4 Size of Different Classes in India
Source: Author’s calculations based on NSS Household Consumer Expenditure surveys, 1999-00,
2004-05 and 2011-12.
Chapter 4
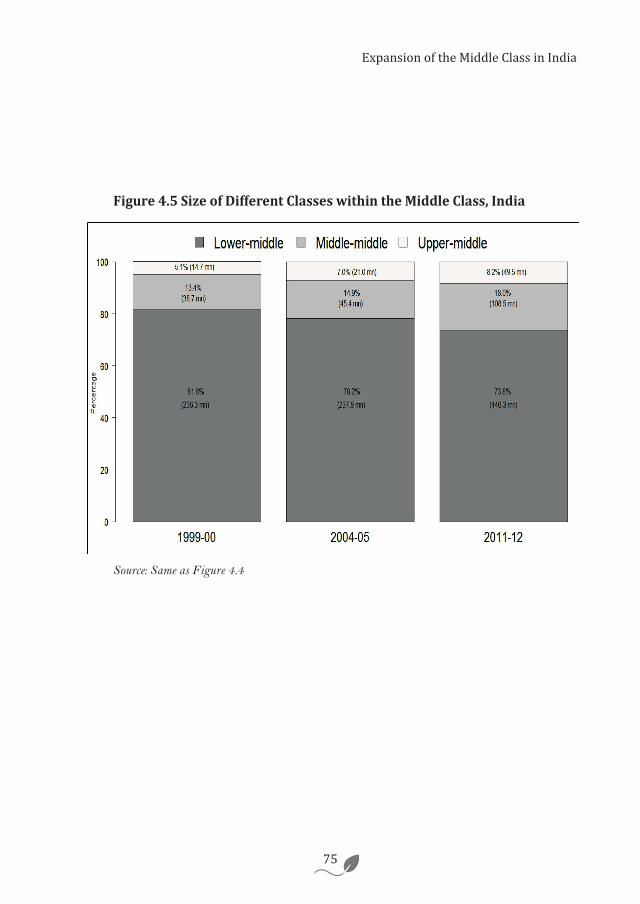
75
Figure 4.5 Size of Different Classes within the Middle Class, India
Source: Same as Figure 4.4
Expansion of the Middle Class in India

76
Figure 4.6 Size of Different Classes in Rural India
Source: Same as Figure 4.4
Chapter 4

77
Figure 4.7 Size of Different Classes in Urban India
Source: Same as Figure 4.4
Segregation of the data into rural and urban areas (Figures 4.6 and 4.7) indicates
that rural India showed a similar trend, where in t1 the poor swelled in numbers,
proportion of the lower-middle class declined, while the rest of the classes
expanded marginally. Urban India, in contrast, witnessed a marginal decline in
the share of the poor (in line with the results in Section 4.2, where urban India
recorded a positive growth in consumption expenditure for 90 per cent of the
population), although in absolute numbers, it increased by about five million. The
urban middle class expanded slightly, in the middle-middle and upper-middle
categories. By contrast, in t2, both rural and urban areas witnessed an increase in
the share of the middle class and reduction of the poor. In fact, rural India
Expansion of the Middle Class in India

78
surpassed its urban counterpart in terms of total middle class population by 107
million more people.
The findings suggest that the seven years between 2004-05 and 2011-12 have
been quite significant for India, in both rural and urban areas. The middle class
has swelled in an unprecedented fashion, albeit mainly in the $2 to $4 category.
Several people have come out of poverty to join the lower-middle class ranks.
These findings are consistent with that of ADB (2010), Banerjee & Duflo (2008)
and Kochhar (2015) who also show that the largest increase in class size has been
recorded among the lower-middle ranks of the Indian population. However, these
studies also assert that the middle class in India is essentially an urban
phenomenon, which contradicts the results presented here. The findings here are
also in contrast to that of Krishna & Bajpai (2015), who find Indian middle-class
growth to have decelerated in the last few years, especially in the rural areas.
4.4.1 Robustness of estimates
It could be argued that the deviation in the present results from existing studies is
merely a matter of differences in the definition of the middle class. To verify the
robustness of these results, we carry out an exercise to check how the estimates
vary with changes in definition of the middle class. We compare the definition
that we use with three other absolute definitions of the middle class, namely, ADB
(2010), Meyer & Birdsall (2012) and Krishna & Bajpai (2015). The first definition
defines the middle class as those who are just above the poverty line; the second
compares them to the global middle class, while the third uses transportation
assets as the defining characteristic of the middle class67.
6 Meyer & Birdsall’s (2012) definition is income-based, while NSS surveys provide data on consumption. Hence, to arrive at an income distribution from the consumption distribution we make use of the quintile-wise income-expenditure ratio of households for 2004-05 given in Shukla (2010). We calculate corresponding income levels for each consumption quintile, separately for rural and urban areas and then combine them to
Chapter 4

79
We find that depending on the definition used, the size of the middle class varies
drastically (Figures 4.8 - 4.10). In rural India, by the definition of Meyer &
Birdsall (2012), the middle class was as small as 5 per cent in 2011-12, compared
to 41 per cent by the definition of Banerjee & Duflo (2008). Similarly, the size of
the urban middle class varies between 20 and 80 per cent, depending on the
definition used. However, irrespective of the definition used, the growth in the
share of the middle class was almost flat in t1, but rose remarkably in t2.
Moreover, even by the ownership of assets-based definition of Krishna & Bajpai
(2015), we find the middle class to have expanded in both rural and urban areas,
much in contrast to the findings of the authors themselves. This shows that the
estimates of the size of the middle class presented are in general robust to changes
in definition of the class.
arrive at the aggregate income distribution. Since the income-expenditure ratios are available only for 2004-05, we assume the ratio to be constant over all three years under analysis. 7 To estimate middle class size by the Krishna & Bajpai (2015) definition, we draw on NSS data on ownership of transportation assets. Because NSS survey for 1999-00 does not supply this data, we arrive at middle class estimates based on Krishna & Bajpai's definition only for 2004-05 and 2011-12.
Expansion of the Middle Class in India

80
Figure 4.8 Middle Class Size by Different Definitions, India
Source: Author’s calculations based on NSS Consumer Expenditure surveys, 1999-00, 2004-05
and 2011-12.
Figure 4.9 Middle Class Size by Different Definitions, Rural India
Source: Same as Figure 4.8.
Chapter 4
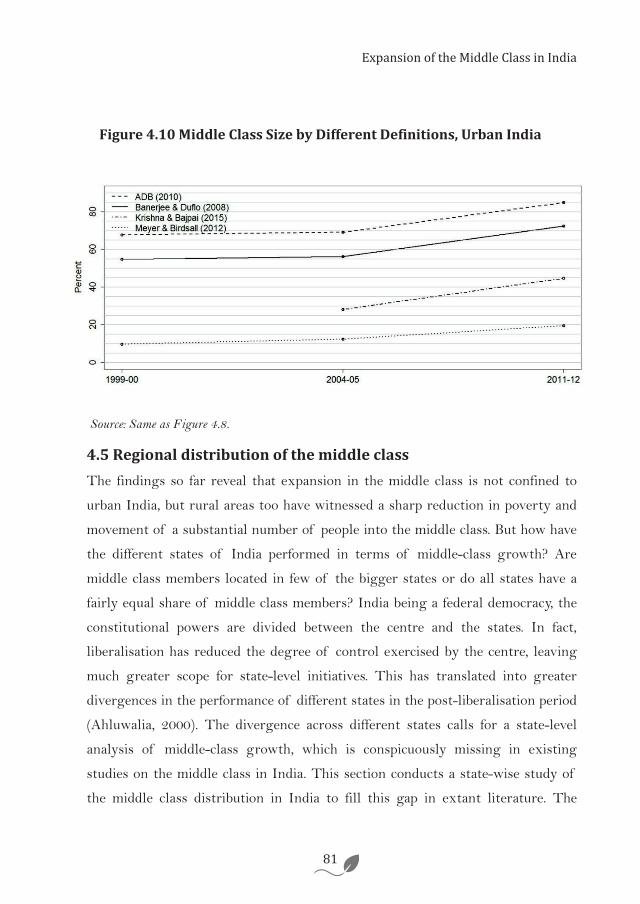
81
Figure 4.10 Middle Class Size by Different Definitions, Urban India
Source: Same as Figure 4.8.
4.5 Regional distribution of the middle class
The findings so far reveal that expansion in the middle class is not confined to
urban India, but rural areas too have witnessed a sharp reduction in poverty and
movement of a substantial number of people into the middle class. But how have
the different states of India performed in terms of middle-class growth? Are
middle class members located in few of the bigger states or do all states have a
fairly equal share of middle class members? India being a federal democracy, the
constitutional powers are divided between the centre and the states. In fact,
liberalisation has reduced the degree of control exercised by the centre, leaving
much greater scope for state-level initiatives. This has translated into greater
divergences in the performance of different states in the post-liberalisation period
(Ahluwalia, 2000). The divergence across different states calls for a state-level
analysis of middle-class growth, which is conspicuously missing in existing
studies on the middle class in India. This section conducts a state-wise study of
the middle class distribution in India to fill this gap in extant literature. The
Expansion of the Middle Class in India
Figure 4.10 Middle Class Size by Different Definitions, Urban India
Source: Same as Figure 4.8.
4.5 Regional distribution of the middle class
The findings so far reveal that expansion in the middle class is not confined to
urban India, but rural areas too have witnessed a sharp reduction in poverty and
movement of a substantial number of people into the middle class. But how have
the different states of India performed in terms of middle-class growth? Are
middle class members located in few of the bigger states or do all states have a
fairly equal share of middle class members? India being a federal democracy, the
constitutional powers are divided between the centre and the states. In fact,
liberalisation has reduced the degree of control exercised by the centre, leaving
much greater scope for state-level initiatives. This has translated into greater
divergences in the performance of different states in the post-liberalisation period
(Ahluwalia, 2000). The divergence across different states calls for a state-level
analysis of middle-class growth, which is conspicuously missing in existing
studies on the middle class in India. This section conducts a state-wise study of
the middle class distribution in India to fill this gap in extant literature. The

82
analysis is however limited to t2 as the reconstitution of a few states in the year
2000 makes comparison between t1 and t2 unfeasible for the reconstituted states.
Nevertheless, Appendix A4.2 gives state-wise middle class size for all three years.
Figure 4.11 shows that in 2004-05, the proportion of middle class population in
many of the states in India was below the national average, that is, less than 30
per cent of the respective state populations. Only two southern states of Tamil
Nadu and Kerala, two western states of Maharashtra and Gujarat and some of the
states in the north, such as Jammu and Kashmir, Haryana and Punjab were
among the large states with a middle class population share above national
average. These results indicate considerable divergence in growth between
different states, in line with the study of Ahluwalia (2000).
In 2011-12, the fraction of middle class population increased in the majority of the
states (Figure 4.12). Importantly, distribution of middle class population share
also became more balanced across states, reflecting growth convergence between
states in the recent years. Some states, such as Andhra Pradesh, Karnataka and
Rajasthan in particular fared exceptionally well. Proportion of middle class in
Andhra Pradesh increased from 29.6 per cent to 71.3 per cent in t2, while that of
Rajasthan grew from 26.3 per cent to 65.5 per cent. Similarly, the middle class
population share in Karnataka improved from 25.8 per cent to 55.7 per cent.
These results are consistent with studies on the performance of Indian states,
which show that the states of Andhra Pradesh and Karnataka have done the most
to initiate reforms in the recent years (Joseph, 2003). While these states
performed exceptionally well, states in the east of India showed hardly any
growth in the share of middle class population. In the states of Bihar,
Chhattisgarh, Jharkhand and Odisha, though the proportion of middle class
population showed an improvement, it continued to stay at less than 30 per cent
throughout t2. Other state-level analyses in India also reveal that the historic
Chapter 4

83
divergence across more-developed and less-developed states continues till date,
although governments of less-developed states such as Bihar are attempting to
offset their negative legacy of relative backwardness by delivering services much
better than would be expected of states at low levels of development (Mundle,
Chowdhury & Satadru, 2016). States in the north-east of India also showed an
improvement in the size of the middle class in t2. But given the small sample sizes
of these states in the NSS surveys, we refrain from drawing any far-reaching
conclusions about the middle class sizes in these states.
Figure 4.11 State-Wise Share of Middle Class in Total State Population, India, 2004-05
Source: Author’s calculations based on NSS Household Consumer Expenditure survey, 2004-05.
Expansion of the Middle Class in India

84
Figure 4.12 State-Wise Share of Middle Class in Total State Population, India, 2011-12
Source: Author’s calculations based on NSS Household Consumer Expenditure survey, 2011-12.
The analysis so far reveals that the middle class in India expanded in an
unprecedented fashion in both rural and urban areas as well as across different
states in t2. The stark difference in the growth in consumption expenditure
between the period t1 and t2 could partly be attributed to the data problems
associated with the 55th round of the NSS survey, which were discussed in
Chapter 3. Data inconsistency is however likely to play only a minor role. The
remarkable growth in India’s consumption expenditure in t2 is more likely to be
explained by the country’s economic growth during this period. India’s per capita
compound annual GDP grew at 7 per cent in t2, compared to 4 per cent in t1.
Nevertheless, additional investigation is required to understand the specific
Chapter 4

85
factors behind the phenomenal growth of India’s economy and particularly the
middle class, during the period t2. Further analysis on why some states performed
better than the others is also called for. Extant literature suggests that in the
Indian case investment in social infrastructure, particularly in education, plays a
more important role than investment in physical infrastructure in the relative
performance of different states (Karnik & Lalvani, 2012). The precise role of such
different factors like investment in social and physical infrastructure, governance
and institutions across different states has to be further looked into, which
however is beyond the scope of this research.
4.6 Changing spending patterns
The study so far shows that the middle class in India has recorded an
unprecedented growth in its size in t2. In other words, many households have
successfully acquired a higher level of economic capital that has enabled them to
be classified as the middle class. This and the following sections together
investigate how this increase in economic capital has translated into greater
accumulation of objectified cultural capital. This section examines how spending
patterns of households have changed with changes in their level of total
consumption expenditure.
Figure 4.13 shows that there are significant differences in spending patterns
between classes. The middle class spends about two-thirds of its monthly
expenditure on basic necessities of food, clothing, fuel and rent. The affluent
spend less than half of their monthly expenditure on basic necessities, while the
poor spend close to 80 per cent. The relatively lower share of expenditure spent
on food by the middle class and the affluent as compared to the poor frees up
resources to be spent on discretionary items such as consumer services, durable
goods, health and education.
Expansion of the Middle Class in India

86
Figure 4.13 Average Expenditure Share on Various Item Groups, India
(1999-00 to 2011-12)
Source: Author’s calculations based on NSS Household Consumer Expenditure Surveys, 1999-00,
2004-05 and 2011-12.
Expenditure on necessities
In accordance with the Engel’s law, the proportion of food expenditure to total
expenditure diminishes as we move up the consumption expenditure ladder.
While on an average the poor spent about 60 per cent of their monthly
expenditure on food between 1999-00 and 2011-12, the middle class spent around
45 per cent and the affluent, about 25 per cent. There are considerable differences
in expenditure patterns also within the middle class. The lower-middle class spent
about half of its total expenditure on food, whereas the upper-middle class spent
only about one-third. More importantly, a marginal increase in consumption
expenditure from less than $2 to between $2 and $4 substantially lowers the
expenditure share on food. Within the food group, expenditure share on staples
such as cereals and pulses plummets with an increase in consumption expenditure
(Appendix A4.3a). In contrast, the fraction of expenditure on more expensive
Chapter 4

87
sources of calories such as milk, fruits and meat increases as one moves from the
category of the poor to the lower-middle class, but steadily declines thereafter.
Proportion of expenditure allotted to luxurious foods such as beverages,
refreshments and intoxicants increases with the level of consumption expenditure.
Thus, as incomes increase and households enter the middle class, they spend a
smaller proportion of their total consumption expenditure on basic food items, but
increase their share of expenditure on relatively expensive and luxurious food
items.
Similar to food, the share of expenditure on clothing, bedding and footwear
(labelled ‘Clothing’ in Figure 4.13) as well as fuel decreases as households move
up the class order. Proportion of spending on rent in contrast, increases
considerably with a rise in average expenditure.
Expenditure on discretionary goods
There are significant differences also in spending patterns of discretionary goods
between classes. The fraction of expenditure on education is almost three times
higher for the middle class and twice for the lower-middle class as compared to
the poor. The affluent spend a slightly higher share of their expenditure on
education than the upper-middle class. Similarly, expenditure share on health also
increases as we move up the class ladder. Share of expenditure on institutional
medical care rises as we move up the class structure, whereas that of non-
institutional health care falls. Thus, as expenditures rise, people tend to fall ill less
often, but spend more on quality health services. The significantly higher
spending on education and health by the middle class reflects the class’ inclination
towards human capital accumulation, which can foster development in the future
(see also Banerjee & Duflo, 2008; Doepke & Zilibotti, 2008; Easterly, 2001).
Expansion of the Middle Class in India

88
Consumer services such as domestic help, laundry, telephone charges, conveyance
and entertainment constitute a large share of discretionary expenditure, which
increases significantly as households move up the class order. Fraction of
expenditure on durable goods too increases as household expenditure rises.
Within durable goods, the share of expenditure on bulky durable items such as
furniture, household appliances and personal vehicles increases remarkably as one
moves up the class hierarchy, whereas that on small and semi-durable items such
as toilet articles, small electronic goods like bulbs and tube-lights falls with a rise
in consumption expenditure. As Figure 4.13 shows, consumer services and
durable goods together make up over 20 per cent of the share of the middle class’
total consumption expenditure, indicating the importance of the middle class as a
driver of consumer goods and services (see also Banerjee & Duflo, 2008; K. M.
Murphy et al., 1989).
While there are considerable differences in spending patterns across classes, their
inter-temporal change is ambiguous. The share of expenditure on food and
clothing, bedding and footwear declined across all classes in t1. But in t2, when
average consumption expenditure increased at a faster rate than in t1, proportion
of expenditure on these items remained rather unchanged or even increased,
among the middle class and the affluent (Appendix A4.3a - A4.3c). The fraction of
expenditure on fuel, in contrast, increased in t1, but declined in t2. Further, while
the share of rent and taxes in total consumption expenditure increased in the first
period, its trend in t2 varied across different classes. One reason for the noticeable
difference in distribution of expenditures across commodities over time could be
due to the data problems with the 55th round of the survey, already mentioned
earlier. However, if data deviations are not stark, as we suppose, these differing
trends in expenditure shares over time can perhaps be explained by the change in
relative prices of these commodities. The increase in the proportion of
expenditure on food and clothing in t2 is possibly due to the relatively large rise in
Chapter 4

89
prices of these goods in that period as compared to other commodities, such as
fuel. The rise in the share of rent paid by the upper-middle and the affluent
classes is perhaps linked to the housing boom in urban India, which largely caters
to the upper ranks of the society (see Nijman, 2006). But given the increase in real
per capita consumption expenditures in t2, we can be assured that in absolute
value, the expenditure on consumer durables, education and health has increased
with an expansion in the size of the middle class.
Even though the middle class in India spends a higher proportion of its
expenditure on non-food items as compared to the poor, the share is quite meagre
when compared to middle classes in the West. For instance, in 2012, even the
bottom 20 per cent of the US population spent as low as 16.1 per cent of its
income on food8, compared to 44.5 per cent and 23.5 per cent in case of the Indian
middle class and the affluent, respectively. There are thus enormous differences in
spending habits of the Indian middle class and that of the middle classes in the
West. These differences in spending habits can partly be attributed to the fact
that the Indian middle class is much poorer as compared to the American middle
class. Besides, greater productivity in Western agriculture as compared to Indian
agriculture will have implications on food prices, resulting in the Indian middle
class spending a lot more on food than its American counterpart.
Since there is enough evidence that proportionate consumption of durable goods
increases as households enter the middle class, it is useful to explore the type of
durable goods that middle class households consume. In the context of
investigating the nature of newness in the new middle class, the question that is
especially of interest is how the composition in the ownership of durable goods
has undergone a change in the recent years. Is the existing Indian middle class
increasingly consuming more of luxurious or modern commodities, which makes
8 Consumer Expenditure Survey, US Bureau of Labor Statistics, 2014.
Expansion of the Middle Class in India

90
it a new middle class? In other words, how is new middle class identity expressed
via the acquisition of objectified cultural capital? The following section examines
these questions.
4.7 Asset ownership of the middle class
Expansion in the sale of consumer durables such as refrigerators, mobile phones
and so on is symbolic of a burgeoning middle class (ADB, 2010). K. M. Murphy et
al. (1989) assert that the middle classes are the natural consumers of
manufactured goods. While the poor lack the spending power to create demand
for consumer goods, the rich will demand more of handmade and imported
luxuries than domestic manufactures. Thus, the distinguishing factor between the
middle class, and the affluent and poor is the former’s ownership of consumer
goods produced on a large scale. We consider three groups of durable items-
personal vehicles, household appliances and modern, technology-driven goods.
Ownership of some of these goods, especially the modern consumer goods such as
mobile phones, personal computer, cars and air-conditioners is associated with a
‘new’ middle class status (Fernandes, 2006). These groups of assets are not only
status markers, but also affect one’s capability to access and succeed in the
contemporary age of service sector globalisation and digitisation. Because NSS
data on ownership of assets is available only for 2004-05 and 2011-12, the
analysis here is restricted to these two years.
Figure 4.14 shows that there are considerable differences in the ownership of type
of personal vehicles between different classes. As we move up the class hierarchy,
ownership of bicycles becomes less common while that of cars and motor-cycles
becomes more common. The differentiating factor between the poor and the
middle class lies in the ownership of motor-cycles, whereas car ownership
differentiates the affluent from the middle class. It is worth noting that the
popular association between increase in car sales and growth of the middle class is
Chapter 4

91
misplaced as only a negligible proportion of the middle class owns cars. Even
within the middle class, there is a stark difference in the structure of ownership of
vehicles, with the lower-middle class primarily owning bicycles and motor-cycles
and the upper-middle class owning motor-cycles and cars (see Appendix A4.4a).
Across rural and urban areas as well as over time, this class-wise distribution of
ownership of personal vehicles shows little change (see Appendix A4.4b and
A4.4c). These findings also show if we are to understand the ‘new’ middle class as
owners of the more expensive consumer goods such as cars, then the class turns
out to be a small segment, most of which actually are not middle class, but the
affluent.
Figure 4.14 Ownership of Personal Vehicles, India
Source: Author’s calculations based on NSS Household Consumer Expenditure Surveys, 2004-05
and 2011-12.
Ownership of all household appliances increases as we move up the class order
(Figures 4.15–4.16), but the incidence of ownership varies between commodities.
Televisions and fans are largely owned by the middle class and the affluent
Expansion of the Middle Class in India
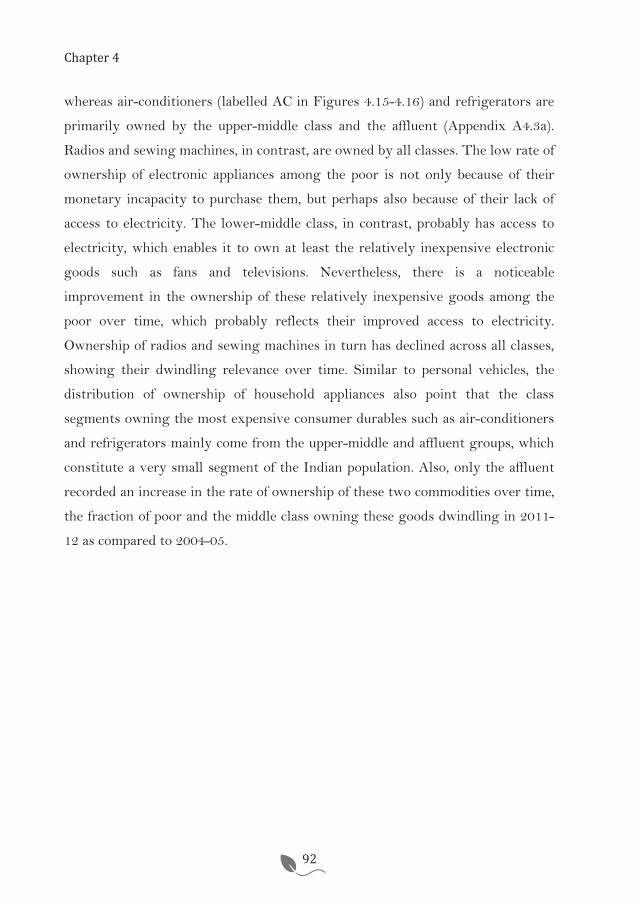
92
whereas air-conditioners (labelled AC in Figures 4.15-4.16) and refrigerators are
primarily owned by the upper-middle class and the affluent (Appendix A4.3a).
Radios and sewing machines, in contrast, are owned by all classes. The low rate of
ownership of electronic appliances among the poor is not only because of their
monetary incapacity to purchase them, but perhaps also because of their lack of
access to electricity. The lower-middle class, in contrast, probably has access to
electricity, which enables it to own at least the relatively inexpensive electronic
goods such as fans and televisions. Nevertheless, there is a noticeable
improvement in the ownership of these relatively inexpensive goods among the
poor over time, which probably reflects their improved access to electricity.
Ownership of radios and sewing machines in turn has declined across all classes,
showing their dwindling relevance over time. Similar to personal vehicles, the
distribution of ownership of household appliances also point that the class
segments owning the most expensive consumer durables such as air-conditioners
and refrigerators mainly come from the upper-middle and affluent groups, which
constitute a very small segment of the Indian population. Also, only the affluent
recorded an increase in the rate of ownership of these two commodities over time,
the fraction of poor and the middle class owning these goods dwindling in 2011-
12 as compared to 2004-05.
Chapter 4

93
Figure 4.15 Ownership of Household Appliances, India, 2004-05
Source: Author’s calculations based on NSS Household Consumer Expenditure Survey, 2004-05.
Figure 4.16 Ownership of Household Appliances, India, 2011-12
Source: Author’s calculations based on NSS Household Consumer Expenditure Survey, 2011-12.
Expansion of the Middle Class in India

94
While some assets such as radios and sewing machines have lost relevance with
time, technological developments have introduced new goods in the market. The
onset of digitisation in recent years has made goods such as mobile phones and
personal computers easily accessible to consumers. The rather recent significance
of these goods is reflected in the NSS surveys themselves, wherein they were
incorporated only in the survey schedule of 2011-12. The data presented in
Figure 4.17 hence pertains to 2011-12 alone. A striking finding of our analysis is
the widespread ownership of mobile phones across all classes, in both rural and
urban areas (Appendix A4.4a – A4.4c). The popular association of increase in the
sale of mobile phones with a burgeoning middle class is thus flawed, as they have
penetrated even among the poor. The wide-spread ownership of mobile phones
across all classes is perhaps a reflection of the decreasing cost of mobile handsets
in India as well as minimal usage charges. Moreover, mobile phones have
penetrated across all classes even though there remains a large gap between
classes in the case of penetration of fixed telephone lines (only 1 per cent of the
poor and 8.4 per cent of the middle class had a fixed telephone line connection in
2011-12, compared to 43 per cent of the affluent). The Indian society appears to
have leapfrogged a generation of the communication revolution.
Ownership of personal computers (PC/laptop in Figure 4.17), unlike mobile
phones, differs substantially across classes. While less than three per cent of the
lower-middle class own personal computers, more than 64 per cent of the affluent
own them (Appendix A4.4a - A4.4c). Further, households in urban areas are far
more likely to own a personal computer than in rural areas. The sharp difference
in the ownership of personal computers between classes and between rural and
urban areas is not a reflection of differences in income or expenditure alone. Class-
wise differences in ownership of other consumer durables such as televisions, air-
conditioners and refrigerators are less conspicuous, although they are as
expensive as personal computers. The glaring difference in ownership of personal
Chapter 4

95
computers hints towards a stark digital divide, where large numbers of the
population perhaps lack computer literacy. It is vital to look at how this translates
into access to new employment opportunities provided by industries in the
services offshoring sector, where at least basic computer skills are mandatory.
Figure 4.17 Ownership of Modern, Technology-Driven Assets, India, 2011-12
Source: Author’s calculations based on NSS Household Consumer Expenditure Survey, 2011-12.
4.8 Conclusion
This chapter traced the expansion of the middle class in India and its spending
patterns in the recent period between 1999-00 and 2011-12, that is, changes in the
possession of economic and objectified cultural capitals. A cursory view of
consumption expenditure showed that compared to the period from 1999-00 to
2004-05, the years from 2004-05 to 2011-12 recorded an impressive growth in
consumption expenditure in India across all expenditure deciles in both urban and
rural India. A class-wise analysis further showed that most of this growth in
consumption expenditure has been driven by the middle class. After remaining
Expansion of the Middle Class in India

96
stagnant in the initial years, the size of the middle class almost doubled between
2004-05 and 2011-12, totalling over 600 million individuals, or around half of
India’s population. Although this expansion was driven by the lower-middle class,
it was witnessed across both rural and urban areas, as well as in majority of the
states of India. The middle class in India today is thus much larger in size and
geographically more spread-out than the earlier middle class. The middle class in
India can thus be termed new in terms of the large number of households who
have joined the class in the recent years, leaving behind poverty. This bolsters the
notion of the new middle class proposed by Birdsall (2016), Wietzke & Sumner
(2014) and others, presented in Chapter 2. However, the majority of the new
entrants to the middle class being only slightly above poverty are potentially
vulnerable to fall back to poverty in case of an economic shock (see also ADB,
2010; Ravallion, 2010).
The expansion in the size of the middle class has considerably altered the
composition of consumption. With middle class households spending a relatively
larger proportion of their total expenditure on discretionary items such as
education, health, rent, consumer services and durable goods as compared to the
poor, the overall demand for these items has risen. The expansion of the lower-
middle class has expanded the market for average priced and frugally innovated
consumer goods such as motor-cycles, television sets and mobile handsets. The
market for luxurious commodities such as cars and air-conditioners remains
relatively small, catering to the upper-middle and affluent segments. Multi-
national firms, vying large consumer markets in emerging economies ought to
look to invest in frugal innovations that are affordable by the enormously large
lower-middle class population (see also Farrell et al., 2006). However, as more
households move up the expenditure ladder from the lower-middle to the upper-
middle class, we may expect demand for more luxurious goods such as cars and
air-conditioners to rise in the future. The analysis vindicates arguments made in
Chapter 4

97
existing studies such as K. M. Murphy et al. (1989), relating a vast middle class to
large scale demand for consumer goods and services. While frugally innovated
consumer goods are in demand, the results also hint towards a digital divide,
wherein goods such as personal computers, requiring a relatively high level of
technological literacy (although only as expensive as television sets) are owned by
a small fraction of the society comprising of the upper-middle and affluent classes.
The chapter also shows that relative price levels of commodities too play a role in
determining demand for different goods and services. Spiralling food inflation in
India between 2004-05 and 2011-12, for instance, has decreased the relative share
of expenditure on discretionary goods, in spite of a rise in the level of total
consumption expenditure. Further, relatively lower food prices in countries like
the US enables even the poor there to spend a larger proportion of their
expenditure on discretionary goods compared to the middle class in India. The
Indian middle class thus spends a far larger proportion of its expenditure on
necessities when compared to the middle class in the US.
In terms of Bourdieu’s class framework, these results imply that from 2004-05 to
2011-12, a large number of households in India were able to acquire a high level
of economic capital, which in turn resulted in their acquisition of a higher level of
objectified cultural capital. The ownership of these forms of capital has enabled
them to enter the middle class and led to the formation of a new middle class in
India. The possession of objectified cultural capital by the new middle class is
however not determined by the level of economic capital alone. Relative prices
and competitiveness of different industries also play a vital role in influencing the
ownership of objectified cultural capital. This chapter also showed that the
ownership of certain kinds of objectified capital such as personal computers,
demands the acquisition of other forms of cultural capital such as computer
literacy, which will take more time to acquire than economic capital.
Expansion of the Middle Class in India

98
The findings of this chapter open up further questions about the nature of the new
middle class. As observed in Chapter 2, new middle class identity has also been
understood in terms of changes in the structural composition of the middle class,
implying a more socially inclusive class (see Jaffrelot & van der Veer, 2008; Sheth,
1999). The subsequent chapter examines this dimension of the Indian middle
class. It takes up the following important questions: While there is a clear
increase in the size of economic and objectified cultural capital of many
individuals, is this also accompanied with changes in their institutional capital and
social and labour market positions? Although the present Indian middle class is
quantitatively larger than the earlier middle class, how qualitatively different is it
from the earlier middle class? What type of occupations are members of the
middle class involved in? What is their level of education, and caste and religious
affiliation? Finally, what do changes in these qualitative characteristics tell us
about the newness in the middle class in India?
Chapter 4

99

100

101
Chapter 5| Structure of the Middle Class: An Analysis of its Education, Employment and Ethnic Composition
5.1 Introduction
The last chapter estimated the size of the middle class in India and studied its role
as consumers. Though consumption is undoubtedly one of the important
characteristics of the middle class, it alone does not provide a complete picture of
the class. Structural composition relating to occupation, education and ethnic
origin (caste and religion in the Indian case) are important qualitative
characteristics that enable us to further understand the newness in the nature of
the middle class. Conventionally, when using sociological definitions of class, the
middle class in India was identified on the basis of these qualitative
characteristics, while its role as consumers received little attention. Fernandes
(2006) and Haynes et al. (2010) describe how the colonial middle class in India
was based on English education and employment in the services and literary
professions. Because access to education was largely restricted to the upper castes,
the majority of the middle class came from upper-caste Hindu or high-caste
Muslim families (Fernandes, 2006; Joshi, 2010a). The middle class in independent
India too was identified with respect to its occupation and education (Bardhan
1989; Beteille 2007). With the emergence of globalisation and liberalisation, as
consumption has taken precedence over these qualitative characteristics, little
attention has been paid to changes in the structural composition of the middle
class in terms of its education, occupation and ethnic composition. Given that
many new households have entered the middle class in t2, it becomes pertinent to
understand how structurally similar or different they are from the established
middle class.
This chapter sheds light on this often ignored qualitative dimension of the middle
class. It focuses on changes in the distribution of education, type of occupation
Chapter 5| Structure of the Middle Class: An Analysis of its Education, Employment and Ethnic Composition
102
and caste and religious affiliation of the middle class in the period between 2004-
05 and 2011-12, when the middle class expanded in an unprecedented fashion.
The nature of changes in the qualitative characteristics of the expanded middle
class will further shed light on the newness of the middle class. The chapter also
gives some preliminary insight on the role of modern services such as the IT and
IT-eS industries in new middle class formation (which will be discussed in detail
in the next two chapters).
The qualitative characteristics of occupation and education are representative of
cultural capital, whereas ethnic origin plays a vital role in class identity in the
Indian social context. These dimensions also reflect the developmental potential
of the middle class. An increase in ethnic diversity within the middle class as the
class expands indicates that development has been socially more inclusive. Middle
classes with steady jobs have the assurance that there will be a fixed income
coming in at regular intervals, allowing them to focus on building their careers
and those of their children (Banerjee & Duflo, 2008). Similarly, an educated
middle class will invest in its offspring’s education and subsequently drive growth
in an industrialised society (Doepke & Zilibotti, 2008). In fact, these factors not
only enable the middle class to foster growth, but they are important to sustain
the growth of the middle class itself. As the ADB (2010: xxvii) observes,
“ultimately, two factors drive the creation and sustenance of a middle class- stable,
secure, well-paid jobs with good benefits and higher education.’’
Similar to the last chapter, the findings of this chapter are based on data from the
55th, 61st and 68th rounds of the NSS surveys on Household Consumer
Expenditure. The analysis in the chapter however is largely restricted to the last
two rounds, when the middle class recorded an unprecedented expansion in its
size. Also, except in case of occupational distribution, wherein we look at rural
and urban data separately, the analysis focuses at the all-India data. While
Chapter 5

103
occupational distribution is expected to significantly vary between rural and
urban areas, distributions of education, caste and religious affiliations will differ
little between rural and urban areas. Nevertheless, class-wise rural and urban
level data on distributions of all variables for the three years are provided in the
Appendix to the chapter.
The following section studies the distribution of level of education across classes
in India. The sections thereafter investigate the type of occupation of middle class
households and the ethnic composition of the class. The final section concludes
with a summary of the findings and their implications.
5.2 Middle class and education
One of the prime reasons for which the middle class is considered vital for
development is its investment in human capital accumulation, particularly in
education (Doepke & Zilibotti, 2008; Easterly, 2001). So far no study on the
middle class in liberalised India has provided a comprehensive analysis of its
distribution of education. As discussed in Chapter 2, studies on the middle class in
colonial India point out that possession of institutionalised cultural capital in the
form of education was an important characteristic distinguishing the middle class
from the rest of the society. Joshi (2010a) asserts that educational training of the
middle class in colonial India enabled it to participate in and shape public debates
and contribute to the Indian independence struggle. The middle class in colonial
India not only had a relatively higher level of education than classes below it, but
more importantly, it was educated in the English language. However, the NSS
data does not provide any information on the knowledge of the English language
of the respondents. This section hence only looks at the level of education of
different classes, exploring whether education continues to be a distinctive factor
characterising the new entrants to the middle class. Because individuals of
different age groups will have different levels of education, education level of the
Structure of the Middle Class

104
household head is taken as a proxy for the level of education of the household in
general.
Figures 5.1 and 5.2 show that there are considerable differences in literacy levels
across classes. Most middle class household heads are likely to have completed at
least up to middle or secondary school education, as against poor household
heads, who are largely illiterate. Further, illiteracy rates drop drastically as
households rise above poverty to enter the middle class. Although middle class
household heads are not among the most highly educated, the likelihood of them
to have some amount of basic education is much higher as compared to the poor.
But there are significant differences in the level of education within the middle
class. As Appendix A5.1a shows, the majority of the lower-middle and middle-
middle classes have completed up to middle or secondary school education
whereas the upper-middle class is more likely to hold a graduate degree.
We also see that over time, the level of education has improved across all
households in India. However, the expansion in middle class size in t2 is not
accompanied with better levels of education within the middle class. Out of the 75
million additional households that joined the middle class between 2004-05 and
2011-12, 28 per cent or 21 million household heads were illiterate, whereas only
18 million household heads possessed a graduate degree. Many entrants to the
middle class in t2 have thus recorded an increase in their consumption expenditure
in spite of low levels of education. Moreover, we find a uniform decline in the
proportion of the better educated households and an increase in the proportion of
the less educated across all categories within the middle class. Thus, it is not only
the poor who may have entered the lower-middle class despite a low level of
education, but those have moved up to the middle-middle and upper-middle
classes too have been able to do so with relatively low levels of education.
Chapter 5

105
Figure 5.1 Class-Wise Distribution of Highest Level of Literacy, India, 2004-05
Source: Author’s calculations based on NSS Consumer Expenditure Survey, 2004-05
Figure 5.2 Class-Wise Distribution of Highest Level of Literacy, India, 2011-12
Source: Author’s calculations based on NSS Consumer Expenditure Survey, 2011-12
Structure of the Middle Class

106
Our results imply that although many households have witnessed an increase in
their level of economic capital in t2, they have accumulated little institutionalised
cultural capital in the form of education. The relatively low levels of education of
the recent entrants to the middle class as compared to the established middle class
reflect that the former are qualitatively different from the latter in terms of their
level of education, making them a ‘new’ middle class in terms of their levels of
education. These results indicate that unlike the traditional colonial and post-
independent middle class, which was characterised by high levels of education
(Fernandes, 2006; Joshi, 2010a), such a criterion does not appear to be a necessity
to enter the middle class in the post-liberalisation era. What factors then, if not
higher levels of education, have enabled millions of Indians to witness an increase
in their consumption expenditure levels? One explanation is that the benefits of
economic growth have trickled down even to households that are not highly
educated. The following section studies this possibility further.
5.3 Occupational structure
Type of occupation is an important variable that has traditionally characterised
classes. Middle classes the world over have generally been associated with
employment in skilled jobs. Landes (1998) identified the great English middle
class as comprising of merchants and shopkeepers, manufacturers and bankers,
men of law and other professions. In the Indian case, Misra (2010: 42) notes that
the conventional middle class has been dominated by members of the educated
professions such as government servants, lawyers, college teachers and doctors.
Other studies claim that as people enter the middle class, in rural areas they move
into technical occupations from agriculture-based ones and in urban areas they
shift from manual employment to administrative or managerial occupations (see
ADB 2010; Banerjee & Duflo 2008). Besides the shift in the industry of
occupation, Banerjee & Duflo (2008) find a steady job to be the single most
Chapter 5

107
important characteristic of middle classes in developing countries. Irrespective of
the precise type of job, middle classes are generally regarded to be employed in
relatively well-educated professions. But given the rather low level of education of
the recent entrants to the middle class, it becomes interesting to examine its
occupational structure.
Figures 5.3 and 5.4 present the employment distribution of the middle class in
rural and urban India, respectively. The data presented here is in accordance with
the National Industrial Classification of India (NIC)9, 2008. NSS surveys of 1999-
00 and 2004-05 follow the NIC 1998 codes, whereas the 2011-12 survey follows
the NIC 2008 codes. The former have been brought in line with the NIC 2008
format using the concordance tables. It is important to note that this data pertains
to the primary occupation of the household, and not of the individual. That is, it
refers to the industry of occupation from which the household earned its largest
share of income during the year of the survey.
Figures 5.3 and 5.4 show that significant changes have taken place in the
occupational distribution of the middle class in t2. In rural areas, while agriculture
employs the largest share of middle class households, there has been a noticeable
increase in the proportion of households involved in the construction sector.
Construction has in fact become the second largest employer of the rural middle
class after agriculture, replacing manufacturing and trade activities. Urban India
too has witnessed a considerable decline in the fraction of middle class households
employed in traditional urban middle class occupations of manufacturing, trade
9 The National Industrial Classification (NIC) is the statistical system followed in India to classify different industries or economic activities in the country. NIC 2008 is in line with its international counterpart, the International Standard Industrial Classification of All Economic Activities (ISIC), Revision 4, released in 2008 by the United Nations Statistics Division.
Structure of the Middle Class

108
and various other service activities. These have been replaced by jobs in the
construction sector.
Figure 5.3 Employment Distribution of Middle Class Households, Rural India
Source: Author’s calculations based on NSS Household Consumer Expenditure survey, 2004-05
and 2011-12.
Figure 5.4 Employment Distribution of Middle Class Households, Urban India
Source: Same as Figure 5.3.
Chapter 5

109
However, there are substantial differences in the occupational distribution within
the middle class. As the tables A5.2a and A5.2b in the Appendix show, it is
primarily the lower-middle class, in both rural and urban areas that is employed
in the construction sector. In fact, the occupational structure of the lower-middle
class does not seem very different from that of the poor. Banerjee & Duflo (2008)
as well as Hatekar & More (2016) also find that at first blush the occupational
patterns of the poor and the lower-middle class seem similar. Hatekar & More
(2016) show that the difference between the lower-middle class and the poor lies
in the fact that the former have more number of wage earners per family than the
latter. Banerjee & Duflo (2008) cite a number of concealed differences in the
occupations of the poor and the lower-middle class. For instance, the rural middle
class is less directly connected to agriculture than the poor. The NSS consumer
expenditure surveys, however, lack the data for such nuanced understanding of
differences in occupations across classes. Further research using other data
sources that provide more rich information on occupations may help in
understanding the intricate differences in occupational patterns between classes.
Within the middle-middle and upper-middle classes, the relatively low-skilled
occupations such as manufacturing and trade have become more significant than
high-skilled occupations such as public administration. These results also show
that new service activities of liberalised India represented by finance, insurance
and the IT industries have a rather limited role in the expansion of the middle
class. In rural areas, a negligible fraction of the middle class was employed in new
service activities in 2004-05, which further declined in 2011-12. In urban areas,
though 5.8 per cent of the middle class was employed in these services in 2004-05,
it declined to five per cent in 2011-12. Moreover, these new service activities
appear to mostly cater to the urban upper-middle class and affluent groups. Even
within the upper-middle class, the share of households engaged in these
occupations has shrunk in t2. These results are in stark contrast to the existing
Structure of the Middle Class

110
assertions that new employment opportunities brought about by liberalisation
and globalisation have resulted in the formation of a new middle class in India
(Fernandes, 2006).
The most striking finding of our analysis is that the construction sector has
turned out to be the most significant driver of middle class expansion in India
between 2004-05 and 2011-12. Given that most of the expansion in the middle
class has happened at the lower-middle class level, the construction sector appears
to have lifted a large number of households out of poverty and enabled them to
enter the lower-middle class. Srivastava & Sutradhar (2016), in their recent study
on construction workers in India show evidence of higher expenditure on
consumption, housing and children’s education by households of construction
sector workers. A few media reports also point out that casual labourers in both
rural and urban areas have witnessed the highest wage increase in India between
2004-05 and 2011-12 (Deshpande & Bhattacharya, 2013; John, 2007). A large part
of these casual workers, in rural and urban areas are engaged in the construction
sector, thanks to the spurt in real estate activities in the country in recent years.
In rural areas many workers have temporarily migrated to cities to take up work
in urban construction activities. The boom in construction activities has swelled
wages for construction workers and consequently taken many people out of
agriculture and moved them into construction activities. This also indicates that
although new service activities such as finance and IT may be directly boosting
consumption expenditure of only a few households at the top of the pyramid, they
are indirectly contributing to a burgeoning middle class at the lower level by
creating more demand for real estate and thus construction workers. The
construction sector is the biggest beneficiary of the trickle-down effect of the
organised service industry. Further enquiry on the trickle-down effect of modern
service industries and the subsequent rise of employment in casual work,
Chapter 5

111
especially the construction sector is called for, which, however, is beyond the
scope of this thesis.
The results in this section add to a further understanding of the findings of the
previous section, where a large number of households despite having low levels of
education have successfully managed to enter the middle class. It shows that the
majority of the new entrants to the middle class ought to be looked upon as a
diverse group, engaged in different kinds of economic activities, unlike the
conventional middle class, which was largely engaged in literary-based
occupations. The different educational and occupational backgrounds of the new
entrants make the middle class ‘new’. Given that many households employed in
unskilled and casual work have been able to transition from poverty into the
lower-middle class, it is likely they also come from diverse ethnic backgrounds,
different from those of the traditional Indian middle class. The following section
investigates this prospect.
5.4 Ethnic composition of the middle class
Caste and religion have traditionally been an integral part of the socio-economic
fabric of the Indian society. An individual’s occupation was determined by his
caste, wherein the uppermost castes were into learned professions, while the
lowermost castes performed menial jobs. This structure influenced the social
composition of the middle class since its formation in the colonial times, making
caste and religious identity one of the defining characteristics of class.
Most middle class people in the colonial era were upper-caste Hindus, ashraf or
high-born Muslims, or such other high status groups (Joshi, 2010a: xvii).
However, with time a large part of the support system of caste has collapsed in
India (Sheth, 1999). Members of different castes now compete with each other for
entry into the middle class, making the vast middle class highly diversified in
Structure of the Middle Class

112
terms of social origins of its members. Sheth (1999) cites a survey conducted by
the Centre for the Study of Developing Societies (CSDS) in 1996, which found
that about half of the middle class population in India came from different lower
castes. Similarly, Hnatkovska, Lahiri & Paul (2013) find evidence in favour of
inter-generational mobility of lower-caste groups, where the sharpest mobility is
among lower-caste households falling in the middle income range. In contrast to
this, other studies find that social background continues to influence middle class
membership in India. Krishna & Bajpai (2015) show that upper-caste Hindus
dominate the Indian middle class in the liberalised era, while lower-caste groups
are over represented in the lowest status group. Similar claims have also been
made by Fernandes (2006), Fuller & Narasimhan (2007) and Upadhya (2007) in
the context of new middle class membership in liberalised India. However, these
claims are based on analyses conducted on a small section within the middle class,
that is, those working in new service activities, or typically the upper-middle
class, as observed in the preceding section. Because most of the growth in the
middle class in t2 has happened in the lower-middle category, it is quite likely that
they come from more diverse ethnic backgrounds. This section looks at whether
caste and religion continue to be important determinants for entering the Indian
middle class.
The numerous castes and caste groups existing in India are officially classified
into four broad categories. These are: (i) the forward or upper castes, which
include intermediate castes, (ii) the backward castes, comprising small and
marginal peasants and artisans, classified as Other Backward Classes (OBCs), (iii)
the Dalits or former untouchables, classified as Scheduled Castes (SCs) and (iv)
the tribal communities, classified as Scheduled Tribes (STs). Although there are
several sub-castes within these broad caste groups, for simplicity, this study uses
this official state nomenclature of castes. In addition to castes, there are also
several religious groups in India. Again, for simplicity, we consider only Hindus
Chapter 5

113
and Muslims. They respectively form the single largest majority and the largest
minority religious groups in the country, together constituting over 90 per cent
of India’s population.
Figures 5.5 and 5.6 present the class distribution across different social groups in
India for the years 2004-05 and 2011-12, respectively. The figures show wide
disparities in class membership across different social groups. Religious identity
has a considerable influence on class status. As the data shows, an upper-caste
Hindu is far more likely to be in the middle class as compared to an upper-caste
Muslim. Caste differences exist in both religious groups, but are more pronounced
among the Hindus than among the Muslims. Upper-caste Hindus are the most
economically prosperous social group, with close to 50 per cent of them belonging
to the middle class in 2004-05. In contrast, in the same period, less than 10 per
cent of ST Hindus (the most underprivileged caste group) belonged to the middle
class and over 90 per cent of them lived on less than $2 a day. However, with the
expansion of the middle class, these inter-caste and inter-religious differences
have noticeably shrunk. As Figures 5.5 and 5.6 show, all social groups have
witnessed an expansion in middle class size in t2 and a subsequent reduction in the
proportion of the poor. While the proportion of middle class members within
upper-caste Hindus increased from 49 per cent in 2004-05 to 68 per cent in 2011-
12, it has risen from 23 per cent to 46 per cent among upper-caste Muslims and
from 9.6 to 26.4 per cent among ST Hindus.
Structure of the Middle Class
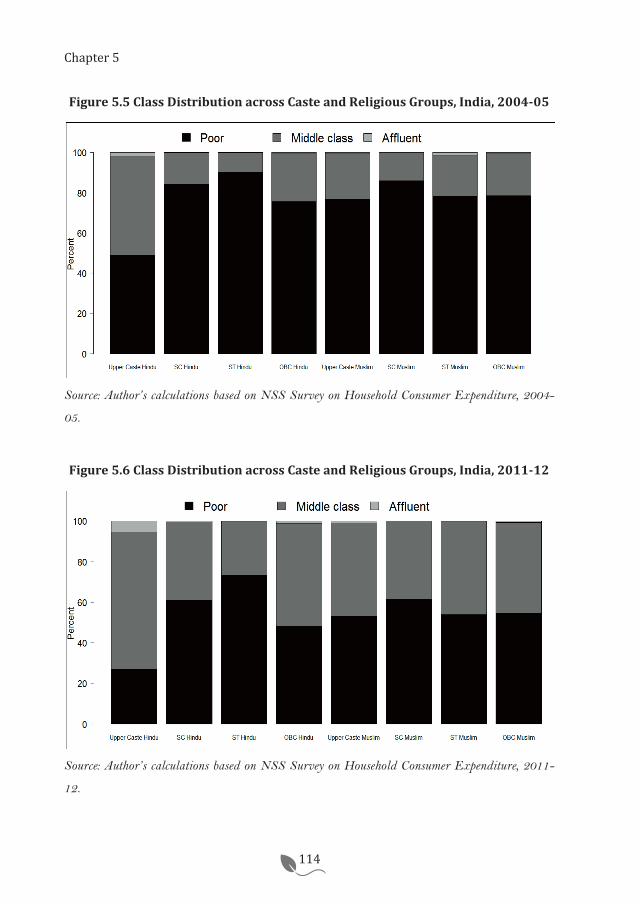
114
Figure 5.5 Class Distribution across Caste and Religious Groups, India, 2004-05
Source: Author’s calculations based on NSS Survey on Household Consumer Expenditure, 2004-
05.
Figure 5.6 Class Distribution across Caste and Religious Groups, India, 2011-12
Source: Author’s calculations based on NSS Survey on Household Consumer Expenditure, 2011-
12.
Chapter 5

115
More importantly, the share of upper-caste Hindus has shrunk within the middle
class, from 38 per cent to 27 per cent in t2 with a corresponding increase in the
proportion of other social groups (see Appendix A5.3a). For instance, the share of
OBC Hindus in the middle class has increased from 30 per cent to 37 per cent and
that of SC Hindus has risen from 5 per cent to 14 per cent. Further, OBC Hindus
have replaced upper-caste Hindus as the largest social group within the middle
class. The increase in the fraction of OBCs in the middle class and the
corresponding decline in the proportion of upper castes may be partially related to
the inclusion of many former upper-caste groups in the OBC category. A few of
the middle class upper-caste members may have merely moved to the OBC
category, swelling the number of OBC members in the middle class. But despite
these changes in the classification of caste groups, it cannot be denied that several
lower-caste groups have managed to enter the middle class in t2. However, the
lower-caste groups primarily belong to the lower-middle category, while upper-
caste Hindus continue to constitute the majority segment in the upper-middle and
affluent classes.
These results illustrate that ethnic composition of the middle class has diversified
with an expansion in the size of the class. Socially disadvantaged groups have
successfully entered the middle class. This however does not imply that these
groups have also accomplished better access to higher education or employment
in skilled jobs. Most of the lower-castes primarily belong to the lower-middle
class, which, as seen in the preceding sections is characterised with low levels of
education and unskilled work. In contrast, the high-caste Hindus continue to
dominate the middle-middle and upper-middle classes, who are characterised with
higher levels of education and employment in more skilled occupations. On the
positive side, between the years 2004-05 and 2011-12, many lower-caste, less
educated households have successfully managed to raise their income and
consumption levels. Increase in the demand for unskilled workers has provided
Structure of the Middle Class

116
the socially disadvantaged with new opportunities for upward economic mobility.
Access to institutionalised cultural capital like education is however a slower
process, which even in the current times is challenging for the under-privileged
caste and religious groups.
5.5 Conclusion
This chapter investigated the structural composition of the middle class by
looking at three qualitative aspects of the class- its education, occupation and
ethnic composition. The findings indicate that the social base of the contemporary
middle class is much wider than that of the conventional middle class in India,
which qualifies this class as the ‘new’ middle class. Many recent entrants to the
middle class are from historically disadvantaged caste backgrounds, characterised
with low levels of education and employment in manual jobs, particularly in the
construction sector. A boom in the construction industry and a demand for casual
labour across India between 2004-05 and 2011-12 have enabled many lower-caste
and unskilled workers to climb up the consumption ladder and enter the new
middle class, albeit in the lower-middle category.
The results presented in this chapter together with the last chapter throw
important insights on the nature of the ‘new’ middle class in India. The last
chapter showed that the size of the middle class in India has expanded
unprecedentedly. Along with this, consumption patterns have changed as more
households spend a lower share of their expenditure on food and other necessities
and a higher share on discretionary goods and services. However, there are other
reasons why the contemporary Indian middle class may be identified as “new”.
The recent entrants to the middle class are structurally quite different from the
conventional middle class. Many of them are from disadvantaged caste and
religious groups, who earlier were not a prominent part of the Indian middle
class. These groups have comparatively low levels of education and are engaged
Chapter 5

117
in unskilled occupations. High economic growth in India between 2004-05 and
2011-12 has enabled these groups to enter the middle class, by being engaged in
unskilled, but well-paying jobs. The entry of these groups into the middle class
has made the class socially diverse in terms of its structural composition of
occupation, level of education and ethnic composition. These changes in the
structural composition of the middle class make it appropriate to call it the ‘new’
middle class.
These empirical results vindicate Bourdieu’s (1986) arguments on the formation
of capitals, described in Chapter 2. They show that higher economic growth in a
society generally aids the accumulation of economic capital for many households.
However, cultural capital takes a longer time for accumulation. Thus, even as
many households in India have moved out of poverty to enter the middle class,
they continue to possess a low level of cultural capital in the form of low literacy
levels and employment in unskilled work.
The findings of this chapter add to debates on the developmental role of the
middle class. This chapter shows that the developmental role of the ‘new’ middle
class is different from that of the conventional middle class. The ‘new’ middle
class is not necessarily an entrepreneurial class that creates employment and
growth for the rest of the society as argued by Banerjee & Duflo (2008). Neither it
is a group of educated service professionals who can intellectually contribute to
public debates in a democracy (see Birdsall, 2016; Easterly, 2001). Rather, the
typical ‘new’ middle class individual is an emerging consumer who is the
backbone of the market economy, albeit still with limited spending power and
engaged in manual labour. Nevertheless, as seen in the last chapter, this class has
sufficient economic resources to invest in human capital accumulation of their
children, which can foster development in the years to come.
Structure of the Middle Class

118
The emergence of a large, but structurally different middle class also has
important social, economic and political consequences. Policy makers should take
note that an expansion in the size of the middle class implies a greater demand for
public goods such as transport facilities, health and education services. This
greater demand should be met with timely adequate supply from the public
authorities to avoid creating excessive pressure on existing infrastructure.
Further, the emergence of a socially diverse middle class can be accompanied with
undesirable social consequences. It could lead to tensions between the recent
entrants to the middle class and the pre-existing middle class as the former
attempt to compete with the latter in different realms of consumption, education
and employment. Caste and religious insecurities and violence could be one such
outcome. The government ought to foresee such possibilities and accordingly
create mechanisms to avoid outbreak of any social conflicts.
Further research is called for to understand the reasons for the remarkable
growth in the construction industry between 2004-05 and 2011-12 and the
possibilities therein to generate more employment opportunities. It also remains
to be seen whether the boom in the construction sector and the consequent
growth in consumption expenditure will sustain in the long run. After 2011-12,
India’s economic growth has shown some moderation, which will directly impact
the consumption levels of households and the rate at which they are moved out of
poverty. But these factors can be assessed only once the relevant data on
household consumption expenditure are available.
The nature of data used in this study limits our understanding of the expansion of
the middle class to some extent. A panel data would enable us to understand class
mobility across the same set of households. For example, such data can throw
light on which households have moved from poverty to the lower-middle class,
which ones have climbed from lower-middle to the middle-middle class, and so on.
Chapter 5

119
Of specific interest for this thesis is to understand whether the IT-eS industry has
enabled households to move out of poverty and enter the middle class. The NSS
data only show that most households employed in industries such as finance and
IT belong to the upper-middle and affluent classes. However, we have no data to
find the extent of class mobility that is facilitated by these industries. In other
words, the data do not help us in understanding how former non-middle class
households, after gaining access to employment opportunities in these industries
move up to the upper-middle class level. The following chapter investigates this
question, based on primary field data gathered on IT-eS employees in Mumbai.
Structure of the Middle Class

120

121
Chapter 6| Access to Employment Opportunities in Mumbai’s IT-eS Industry and its Implications for the Formation of a New Middle Class
6.1 Introduction
The previous chapters showed that the years between 2004-05 and 2011-12 have
witnessed the emergence of a new middle class in India, wherein many
households, from diverse social backgrounds, engaged in different occupations,
have come out of poverty and become part of the middle class. This motivates us
to study the role of the offshore-service industry, one of the main economic
drivers in the past two decades, in the formation of such a new middle class. Lack
of detailed data on the industry in the NSS surveys prevented us from gathering a
comprehensive understanding of this subject. This chapter, using primary data on
IT-eS employees in Mumbai studies accessibility of employment opportunities in
the industry to individuals from diverse social backgrounds. It investigates the
extent to which people from erstwhile non-middle class backgrounds are able to
access employment opportunities in the IT-eS industry and become a part of the
new middle class.
Existing evidence on accessibility of employment opportunities in the offshore-
service industry to different social groups is ambiguous. Industry representatives
have often projected the inclusive nature of the sector, where a large share of
employees are hired from disadvantaged socio-economic backgrounds (see Bagchi,
2006; Rastogi & Pradhan, 2011). Empirical studies by Fuller & Narasimhan
(2008) and Upadhya (2007), by contrast, argue that the industry is biased towards
the small and privileged section of the pre-existing middle class. According to
them the demand for employees with a technical and professional education
Chapter 6| Access to Employment Opportunities in Mumbai’s IT-eS Industry and its Implications for the Formation of a New Middle Class
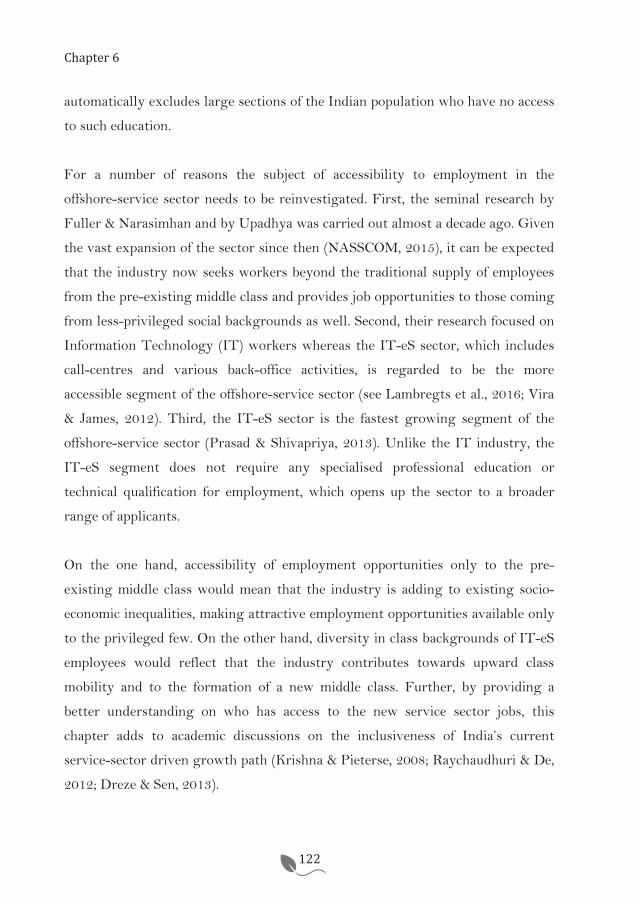
122
automatically excludes large sections of the Indian population who have no access
to such education.
For a number of reasons the subject of accessibility to employment in the
offshore-service sector needs to be reinvestigated. First, the seminal research by
Fuller & Narasimhan and by Upadhya was carried out almost a decade ago. Given
the vast expansion of the sector since then (NASSCOM, 2015), it can be expected
that the industry now seeks workers beyond the traditional supply of employees
from the pre-existing middle class and provides job opportunities to those coming
from less-privileged social backgrounds as well. Second, their research focused on
Information Technology (IT) workers whereas the IT-eS sector, which includes
call-centres and various back-office activities, is regarded to be the more
accessible segment of the offshore-service sector (see Lambregts et al., 2016; Vira
& James, 2012). Third, the IT-eS sector is the fastest growing segment of the
offshore-service sector (Prasad & Shivapriya, 2013). Unlike the IT industry, the
IT-eS segment does not require any specialised professional education or
technical qualification for employment, which opens up the sector to a broader
range of applicants.
On the one hand, accessibility of employment opportunities only to the pre-
existing middle class would mean that the industry is adding to existing socio-
economic inequalities, making attractive employment opportunities available only
to the privileged few. On the other hand, diversity in class backgrounds of IT-eS
employees would reflect that the industry contributes towards upward class
mobility and to the formation of a new middle class. Further, by providing a
better understanding on who has access to the new service sector jobs, this
chapter adds to academic discussions on the inclusiveness of India’s current
service-sector driven growth path (Krishna & Pieterse, 2008; Raychaudhuri & De,
2012; Dreze & Sen, 2013).
Chapter 6
123
As described in chapter 3, this chapter draws on primary data collected via semi-
structured interviews and a survey of IT-eS employees in Mumbai. It studies class
backgrounds of IT-eS workers, investigating whether they come from the pre-
existing middle class or if there is evidence for upward class mobility from non-
middle class to the middle class.
The following section presents debates on the inclusiveness of employment
opportunities in the Indian offshore-service industry, followed by the conceptual
framework of the chapter and its operationalisation. The subsequent two sections
present and discuss the empirical findings. The concluding section summarises
the results and brings out their implications in the broader context of service-
sector globalisation and its contribution to a new middle class formation.
6.2 Employment opportunities in the offshore-service industry- A
review of existing debates
Besides its significant contribution to the Indian economy, the service-offshore
industry is claimed to be an important social leveller that provides employment
opportunities to diverse social groups. NASSCOM, the industry body of software
services companies in India, has often highlighted how offshore-service firms
create employment opportunities for different sections of the society. A recent
report of the industry body stated that nearly 58 per cent of the industry workers
are from Tier II or Tier III cities10 (see NASSCOM, 2016a). Industry leaders too
emphasise the sector’s role in creating employment opportunities for diverse
social groups. Bagchi (2006), the co-founder of a top Indian IT firm, has asserted
that the Indian service-offshore industry has a large number of people who come
10 The Government of India classifies Indian cities into different tiers based on their population size. Cities with population size greater than 100,000 are classified as Tier I, those with a population between 50,000 and 100,000 are classified as Tier II and those with a population size between 20,000 and 50,000 are classified as Tier III.
Access to Employment Opportunities in Mumbai’s IT-eS Industry
124
from economically and socially disadvantaged families, but have broken free from
their backgrounds and are treated at par by their employers. He cites a survey in
his own company, which found that about one-third of employees are from rural,
agricultural backgrounds and about 20 per cent are from small business families.
Another industry representative, Mohandas Pai, associated with a leading
software firm in India, adds that 40 per cent of people joining the offshore-service
sector are first generation graduates who belong to socially disadvantaged
backgrounds (Rastogi & Pradhan, 2011: 25). Empirical findings of Hnatkovska et
al. (2013) support these claims by industry leaders. In their study on occupational
mobility, Hnatkovska et al. (2013) find that since the liberalisation programme in
1991, lower castes in India have been able to move up the occupational and
economic ladder to pursue better and different jobs from that of their parents.
These positive accounts by sector representatives and the empirical findings are
based on the recruitment process in the new private businesses. Hnatkovska et al.
(2013) argue that increasing competition on account of structural reforms in the
Indian economy has helped reduce discrimination by making it more expensive
for businesses to pursue discriminatory labour market practices. Prior to
liberalisation, white-collar, service based jobs were mostly available in the public
sector, where access was highly determined by recommendations and personal
contacts. Private businesses were few in number and mostly family based, where
recruitments generally happened within the family. The onset of liberalisation and
globalisation has allowed smaller firms to enter the business, thus increasing
competition between companies. Private businesses no longer rely on personal
connections, but recruit employees from a larger social base, based on their merit,
talent and hard work. The relatively low level of eligibility criteria in the IT-eS
industry coupled with a comparatively high remuneration for employees makes
the sector stand out among the rest of the modern service industries.
Chapter 6

125
In contrast to these optimistic claims, other empirical accounts on the IT industry
find that workers in the sector come from a rather narrow social base, typically
from pre-existing middle class families. Upadhya (2007), in her study on the IT
industry in Bangalore finds the social profile of the employees to be largely urban,
middle class and high or middle caste. Another study by Fuller & Narasimhan
(2008) shows that the small traditional elite of Tamil Brahmins is
disproportionately represented in South India’s IT industry. Similarly,
Raychaudhuri & De (2012: 229) in their study on the service-offshore industry in
India assert that although the sector has had a positive influence on poverty
reduction through an expansion of income, it has widened inequality because of its
knowledge and skill intensive nature. In a more general vein, Fernandes (2006)
argues that new jobs created via liberalisation and market reforms have benefitted
only the pre-existing middle class. Krishna & Pieterse (2008) explain that
contemporary globalisation and liberalisation are built on existing cleavages in
the society, which fail to benefit the majority in the countryside and the urban
poor.
The lack of consensus about access to employment opportunities to different
social groups and its implications for a new middle class formation calls for a re-
investigation into this debate. Existing studies either look into the general impact
of liberalisation and globalisation (for example, Fernandes 2006; Krishna &
Pieterse, 2008), or, in case of the offshore-service sector, focus on the IT industry
(Fuller & Narasimhan, 2008; Upadhya, 2007). The IT-eS industry, which is an
integral part of the service sector revolution in India, has been sparsely studied in
relation to its access to employment opportunities to different social groups.
Before we discuss the empirical findings, the following section presents the
conceptual framework of this chapter and its operationalisation.
Access to Employment Opportunities in Mumbai’s IT-eS Industry

126
6.3 Operationalisation of the concept ‘pre-existing middle class’
At the heart of the debate on access to employment opportunities in the IT-eS
sector and its implications for a new middle class formation is whether the
industry employs people from diverse socio-economic backgrounds, including
those from non-middle class families. To answer this question, it is pertinent to
understand what is meant by the pre-existing middle class or the middle class in
pre-liberalised India. From the discussion in Chapter 2, we know that the
conventional Indian middle class was characterised in terms of its possession of a
basic level of economic capital, along with cultural capitals in the form of
knowledge of the English language and higher education. Possession of these
capitals in turn resulted in the class being engaged in literary, service-based
occupations. Social dimensions of caste and religious affiliations and urban origin
further intersected with the forms of capital to produce a distinct class identity.
Based on this conceptual framework of the pre-existing middle class, this study
identifies IT-eS employees as belonging to pre-existing middle class families if
they possess the following characteristics:
i. Their parents have completed at least up to higher secondary school
education
ii. Their parents possess knowledge of the English language
iii. Their father is employed in a typical middle class occupation
iv. The family belongs to the upper-caste group and
v. The employee has resided in an urban area for the most part of her life
The study does not take into account any indicator of economic capital as reliable
data on economic capital of families such as income or wealth owned before the
respondent joined the IT-eS industry is hard to collect. Further, as asserted by
Bourdieu (1986), the possession of cultural capital pre-supposes a basic level of
economic capital, making data on economic capital somewhat redundant in this
context.
Chapter 6

127
The conceptualisation of the pre-existing middle class and its operationalisation
are reflected in the questions covered in the survey and semi-structured
interviews of IT-eS employees and employers, the methods of which have been
described in detail in Chapter 3. A large part of the survey pertained to questions
on possession of various forms of capital by the respondents and their families, so
as to identify their class background. Information on education and occupation of
the respondents’ parents, their personal and family incomes, place of upbringing
(rural/urban) and caste and religious affiliations were gathered. Along with
parents’ level of education, their knowledge of the English language was also
taken into account. Identifying an occupation as middle or non-middle class is of
course not easy. Parents’ occupation was classified into: agricultural worker,
industrial or factory worker, public service, private service, self-employed, home-
maker and others. The job designation within the occupational category and the
income earned therein were also noted. The job category, designation and income
together gave a fair idea of the nature of occupation of the parents. Further, the
survey asked respondents the place where they spent the majority of their
formative years. Those who had spent the majority of their time in a city or a
large town were identified as of urban origin. Caste of a respondent was identified
based on the official state nomenclature of castes, described in the previous
chapter.
Besides questions on class backgrounds of respondents, the survey covered other
topics that helped determine the nature of accessibility of employment
opportunities in the IT-eS industry. One of the parts in the survey dealt with
questions on the professional and educational profiles of the respondents. Another
type of questions pertained to the recruitment practices in the IT-eS industry,
focusing on the importance of the various forms of capital for accessing
employment opportunities in the industry. It dealt with questions such as how the
Access to Employment Opportunities in Mumbai’s IT-eS Industry

128
respondent found a job in the industry, the skills she was assessed on before
recruitment and the factors she perceived important to gain access into the
industry.
The semi-structured interviews dealt with similar topics, but allowed the
respondents to describe their opinions and experiences in detail. Since direct
questions about caste and religion are generally considered intrusive in a personal
interview, no information on these variables was gathered in the interviews.
While the survey provided an overview of IT-eS workers’ profile and the factors
determining their employment in the industry, the interviews gave a more
nuanced understanding of these subjects.
6.4 Class backgrounds of IT-eS workers
“Many employees in the sector are first time white collar workers of their
families. Their parents may be auto-rickshaw drivers or maids... This is a
road ahead for an entire generation to come up.” (HR head, October, 2012)
“If you talk of people being attracted to the industry they come from all
backgrounds. But certain skill sets automatically tend to have certain
backgrounds. A person with good English-speaking skills is likely to be from
the middle class background.” (HR head, March, 2013)
The above statements by HR heads of two IT-eS firms show that in line with
existing literature on accessibility of jobs in the offshore-service sector, industry
leaders differ on their opinion on class backgrounds of employees. The survey and
interviews with IT-eS employees reveal that the sector is far less open to
employees from diverse backgrounds than that argued by some industry leaders.
The vast majority of IT-eS employees come from typical middle class
backgrounds as, using our set of criteria, will be shown below.
Chapter 6
129
Well-educated parents
One such middle class feature that characterises IT-eS employees is their parents’
high level of education. An IT-eS employee in his early thirties, holding a
Masters’ degree from a reputed university in Mumbai, is one such respondent
whose parents are highly educated. His first job after completing his Masters’ was
with an analytics firm, offering offshore services. Since then he has rapidly
climbed up the career ladder, currently heading the sales team of a leading Indian
outsourcing firm. This respondent believes that his upbringing in an educated
family played a vital role in enabling him to pursue higher education and have a
successful career in the field of statistics. He says:
“My father has a PhD in mathematics. So I have grown up in this background
of mathematics and statistics.” (Sales executive, February, 2013)
Although not all parents of IT-eS employees are as highly educated, evidence
shows that the majority of them come from fairly well-educated backgrounds. The
survey indicated that 82 per cent fathers of IT-eS employees had attended at least
up to high school, of which over 40 per cent were graduates. Among the mothers,
66 per cent had completed high school education, while 13 per cent held a
graduate degree. Moreover, fewer than 10 per cent of the mothers and less than
one per cent of the fathers were illiterate. Given that adult literacy rate in India in
2011 was only 74 per cent11 it is evident that IT-eS employees come from
relatively highly educated families.
English-language proficiency
Not only are the parents of IT-eS employees well educated, many of them are also
fluent in the English language. The survey found that 40 per cent of IT-eS
employees come from families where both parents can speak English, while only
11 Census of India, 2011 (http://www.censusindia.gov.in/2011-prov-results/indiaatglance.html)
Access to Employment Opportunities in Mumbai’s IT-eS Industry

130
about 20 per cent respondents said that neither of their parents knew English.
Compared to just 13 per cent of Indians, aged between 51 and 65 years who can
speak in English12, English-language proficiency among parents of IT-eS
employees is indeed quite high.
Middle-class occupation
Because of their high level of education and knowledge of the English language,
parents of IT-eS employees are employed in regular salaried, or the relatively
more skilled jobs. A young IT-eS employee describes his father’s profession as
follows:
“My father worked in many places. He was earlier in the docks; then he worked
with a lawyer, and later for an automobile company as a store supervisor.”
(Back-office executive, January, 2013)
The survey showed that 74 per cent of fathers of IT-eS employees were into
service-based, skilled professions. Half of these were managerial professionals or
accountants, about one-third were engaged in medium to large scale businesses
and about 10 per cent were factory-workers. Less than 20 per cent fathers worked
in menial jobs such as that of drivers, electricians or small-scale farmers. Majority
of the mothers were home makers.
Upper-caste Hindus
Along with parents’ educational and occupational background, we also found the
ethnic backgrounds of IT-eS employees to be fairly homogenous. Nearly half of
the respondents came from upper-caste Hindu families, while OBC Hindus
constituted 15 per cent of the sample. Only 1.5 per cent respondents came from
the most under-privileged caste group of SC and ST Hindus. One-fourth of the
survey respondents were Muslims, the largest religious group in India after the
Hindus, but all of them came from the upper castes. Compared to the caste
12 India Human Development Survey, 2004-05 (Desai et al., 2008).
Chapter 6
131
composition at the national level, wherein the OBCs, SCs and STs numerically
dominate the upper castes (see Appendix A5.3a – A5.3c), it is apparent that the
latter are over-represented in the IT-eS industry.
Urban upbringing
Furthermore, there is a stark urban bias in the industry. Nearly all survey
respondents (96 per cent) had an urban upbringing. Moreover, 70 per cent of
employees were brought up in Mumbai, reflecting little geographical diversity in
the industry. It may be argued that because this data is drawn from a sample of
employees working in Mumbai alone, we find this urban bias in the industry.
However, as Figure 6.1 shows, the five metropolitan cities of Mumbai, Delhi-
NCR13 (National Capital Region), Hyderabad, Bengaluru and Chennai house over
200 IT and IT-eS firms each, together attracting more than 70 per cent of India’s
offshore-service companies. None of the Tier II cities have more than 50 firms,
whereas the smaller towns and rural areas have hardly any presence of the
industry. Thus, both in terms of location of the firms and their personnel, the IT-
eS industry is highly biased towards the larger cities of India.
13 Delhi-NCR includes New Delhi and the surrounding areas of Gurugram and Noida.
Access to Employment Opportunities in Mumbai’s IT-eS Industry

132
Figure 6.1 Presence of IT and IT-eS Firms across India
Source: Author’s calculations based on NASSCOM Member Directory, 2016
6.5 What causes the urban middle class bias?
The results clearly show that the majority of IT-eS employees come from urban
middle class families. The important question to investigate is why so few
employees from rural or from non-middle class backgrounds are able to access the
IT-eS industry, despite industry leaders portraying it as a socially diverse sector.
What factors inhibit these employees from accessing employment opportunities in
the industry? To answer this question, we first look at the exceptional cases in the
sample, that is, those employees, who despite belonging to small towns or non-
middle class backgrounds have successfully managed to access employment
opportunities in the sector.
Chapter 6

133
One such exception is a former call-centre employee, who is currently a school
teacher. Her mother, a school dropout, works as a domestic help in middle class
homes. Her father, a tailor, had completed high school level education. Neither of
this respondent’s parents have knowledge of the English language. She was the
first member in her family to complete university education and to be educated in
the English language. She believes that despite her modest social background, her
successful completion of university education in the English language enabled her
to access the IT-eS industry. But it would not have been possible for her to pursue
higher education without the hard work put in by her parents. Another
respondent from a non-middle class background is also a former call-centre
employee, who now works with an Indian real estate firm. Her mother is a
vegetable vendor and her father, a musician at weddings, who only occasionally
earns an income. Despite a low family income this respondent was able to access
the IT-eS industry because of her uncle who completely funded her English
language education up to the university level. Both these respondents were
brought up in Mumbai, but clearly, their parents lacked the necessary economic
and cultural capitals to be classified as middle class.
While these former employees came from a non-middle class background, but
from the financial capital of the country, a young back-office executive comes from
Ranchi, a relatively small city located in one of the most backward regions of
India. Lack of job opportunities around his home compelled him to move to
Mumbai, where his brother already had a job. He confesses that having a brother
already settled in the city helped him find a job in the big metropolis of Mumbai.
“When I came to Mumbai, I was intimidated looking at the crowd and wished
to go back home. But my brother advised me to stay back and look for a job... In
IT-eS firms, since the processes are US or UK based, one cannot escape
speaking in English. Hence, coming from a Hindi background, I had a lot of
Access to Employment Opportunities in Mumbai’s IT-eS Industry
134
communication problems. But I managed because of the help from my
colleagues.”
(Back-office executive, November, 2012)
This respondent’s experience reflects that it indeed is not easy for people from
rural backgrounds or even from small cities to access jobs in the IT-eS industry.
The challenges of living in big cities coupled with lack of exposure to the English
language in backward areas make it difficult for those from non-urban and non-
English-speaking families to access the industry. Moreover, offshore-service firms
are reluctant to locate themselves in small towns because of the lack of skilled
workforce in such areas (Shastry, 2012). The previous cases show that even those
coming from metropolitan cities like Mumbai, but belonging to family
backgrounds where parents lack the economic capital to fund their children’s
education, face difficulties in accessing the industry. These exceptional cases have
been fortunate to have the social capital in the form of relatives, who have
appropriated the necessary economic and cultural capitals to assist them to access
the sector.
Indeed, the nature of work in the IT-eS industry demands specific cultural
capitals, which are largely possessed by the pre-existing urban middle class.
Firstly, IT-eS firms demand a minimum of higher secondary level education (and
increasingly, graduates) even in lower-end services like data entry and call-centre
work. 86.2 per cent of the survey respondents of this study held at least a
university degree. Secondly, the global nature of work in the IT-eS industry
involves interaction with clients located in English-speaking countries, making
English language skills one of the most important criteria for employment. While
English language skills are obviously crucial for front-end services such as call-
centres, they are important even in back-end services where employees are
expected to send emails, for example, and interact with colleagues on the office
Chapter 6

135
floor. As Table 6.1 shows, majority of the survey respondents ranked English-
speaking skills along with a university education among the most important
determinants of access to employment in the IT-eS industry14.
Table 6.1 Factors Determining Employment in the IT-eS Industry
(N=330)
Rank 1 Rank 2 Rank 3
Educational
qualification
124 59 44
Past work experience 31 66 46
English skills (oral) 112 67 49
English skills
(written)
22 60 51
Typing skills 24 22 49
Computer software
skills
12 12 19
Personality 7 1 3
Family background 1 1 2
References 5 4 6
Source: Survey data, 2013-14
The HR head of an IT-eS firm, describing the recruitment process in his company
also testifies this.
“We first screen the candidates based on their education level. Then they are
called for an aptitude test consisting of English, Math and logical reasoning.
14 Survey respondents were allowed to give the same rank to more than one factor if they deemed them to be equally important in determining their employment prospects in the industry. There was also no minimum number of factors that respondents were asked to rank. The sum total of the rank columns in Table 6.1 may hence not match the total sample size.
Access to Employment Opportunities in Mumbai’s IT-eS Industry

136
Imag
e 3:
An
adve
rtis
emen
t an
noun
cing
vac
anci
es in
a le
adin
g IT
-eS
firm
Sou
rce
: Goo
gle
Chapter 6

137
Imag
e 4:
A s
hopp
ing
mal
l in
Mum
bai,
the
typi
cal p
lace
whe
re m
ost
inte
rvie
ws
for
this
stu
dy w
ere
cond
ucte
d
Pho
to: S
andh
ya K
rish
nan
Access to Employment Opportunities in Mumbai’s IT-eS Industry

138
Then there is a speech test, wherein they are given a passage to read. The third
is the hearing ability test, where they are made to listen to a passage in English
and tested on their comprehension of the passage. Finally, there is an
interview.”
(HR head, October, 2012)
A university education and English language skills appear quite basic and in
principle accessible to all sections of the society. However, the pre-existing
inequality of opportunity to access these forms of cultural capital makes the IT-eS
industry accessible to only the pre-existing middle class. As Bourdieu (1986)
argues, cultural capital takes time to accumulate, making it initially accessible
only to the offspring of families who are already endowed with such capital.
The flawed education system in India makes it further difficult for non-middle
class families to access these important capitals. State education at the primary
school level is affordable and accessible to all, but lacks even basic infrastructure
facilities, let alone good quality education. As English is not the native language
of the majority of Indian households, English skills are picked up primarily in
schools. But the medium of instruction in majority of the public schools is in
Hindi or in the regional language of the state, with English being taught only as a
second or third language. Quality elementary education in English is available
mainly in urban private schools, but remains expensive, affordable only by the
pre-existing middle and upper classes (see Dreze & Sen, 2013 for a detailed
account on the problems plaguing the education system in India). In contrast,
higher education, where the medium of instruction is generally in English, is
heavily subsidised by the state and largely available only in urban areas. Because
it is only the urban middle and upper classes that are successfully able to reach up
to high school level, they are the ones who effectively move up to university level
education. Upadhya (2007: 1864) adds that besides education, the offshore-service
Chapter 6

139
sector also requires workers with embodied cultural capital in the form of soft
skills who will be capable of being moulded into “global professionals”. Because it
is primarily the pre-existing middle class that possesses both the economic means
and the social and cultural capital necessary to equip their children to enter
professions in the offshore-service sector, the sector excludes other groups from
accessing it.
These findings are in line with those of Fuller & Narasimhan (2008), Upadhya
(2007) and Vira & James (2012). The study indicates that not much has changed
in the nature of social inclusiveness of the service offshore industry over the last
decade since these enquires were conducted. Moreover, it is not only the IT
industry that is biased towards the middle class, but the relatively more accessible
IT-eS industry too caters essentially to the pre-existing middle class. Ironically,
while the demand for English-speaking graduates has attracted offshore-service
firms to India, it is essentially this demand that also restricts the pool of potential
employees who can access the industry.
6.6 Conclusion
This chapter showed that a disproportionately large share of employment
opportunities in the IT-eS industry in Mumbai accrues to the pre-existing urban
middle class. It establishes that not only in the more knowledge-intensive IT
industry as shown by Upadhya (2007) and Fuller & Narasimhan (2008), but also
in the lower-end IT-eS segment, employment opportunities are skewed towards
the pre-existing middle class. More importantly, this bias in access to
employment opportunities continues even after two decades of operations of the
IT-eS industry in the country. Access to the industry is generally merit-based,
but the nature of work in the industry demands a fair level of English language
skills and university education. Because access to these cultural capitals is largely
Access to Employment Opportunities in Mumbai’s IT-eS Industry

140
restricted to the pre-existing urban middle class, they are the ones who benefit
from the employment opportunities offered by the IT-eS industry.
These results suggest that the service-offshore sector offers good opportunities
for the pre-existing urban middle class to perpetuate itself. The industry’s
contribution to a new middle class formation in the form of new entrants to the
middle class who come from disadvantaged social backgrounds is quite restricted.
This bolsters our results from the national level analysis in the last chapter, which
shows that the majority of the new entrants to the middle class during the recent
years are engaged in low-skilled occupations. Industries such as finance, IT and
communications, which have boomed in the post-liberalisation period, are skill-
intensive and mainly cater to the upper-middle and affluent classes.
These findings are an illustration of how neo-liberal market reforms in India have
enhanced the significance of cultural capitals to access employment opportunities
in the new knowledge-based services. The rise of the service-offshore sector on
the one hand, has introduced new and attractive economic opportunities in
developing countries like India. On the other hand, it relies on modern technology
and continuous upgrading of skills of its workforce. Because the wage premium
associated with the skills demanded by the industry is quite high, it tends to
widen existing social and economic inequalities in the society as access is skewed
to those who already possess the necessary cultural capital.
This study also indicates that the need for education in the English language in
particular has expanded in the modern times of service sector globalisation. The
spread of education can potentially remove barriers arising out of class
stratification and contribute to socio-economic development. India should focus
on making quality primary education as well as English language skills accessible
to social groups across the country so that they can have access to the existing
Chapter 6

141
subsidised education at the higher level. Recognising the growing importance of
the English language, a few government schools across India and a number of
states have introduced the language from Class I (Chhapia, 2014). Also, as part of
corporate social responsibility a few offshore-services industry companies are
investing in training people from socially disadvantaged backgrounds for jobs in
the IT and IT-eS industries. However, cultural skills like language ability take
time to accumulate and until then, access to jobs like in the IT-eS sector will
continue to remain exclusionary. These results have important implications for
countries that aim at following a service-sector led development trajectory (see
Ghani & O’Connell, 2014; Lambregts et al., 2016). Such a trajectory may not only
strengthen existing inequalities in the short run, but as this chapter demonstrates,
it also does not open up to socially disadvantaged groups in the medium term.
Given that the IT-eS industry hardly contributes to the formation of a new
middle class in India by enabling non-middle class individuals to access the
industry and become part of the middle class, the question that follows is, in what
way does the industry contribute to a new middle class formation? As discussed in
Chapters 1 and 2, the idea of a new middle class formation not only entails non-
middle class members experiencing upward class mobility to enter the middle
class, but also refers to conspicuous changes in lifestyles and consumption habits
of the middle class. The NSS surveys tell us little about qualitative changes in the
consumption practices of middle class households. The following chapter explores
this important contribution of the IT-eS industry towards new middle class
formation. It looks at changes in consumption practices and lifestyles of IT-eS
employees, focusing on the contribution of the industry in driving those changes.
Access to Employment Opportunities in Mumbai’s IT-eS Industry

142
143
Chapter 7 | How the IT-eS Industry Contributes to the Formation of a Consumerist New Middle Class in Mumbai15
7.1 Introduction
The last chapter found that the contribution of the IT-eS industry in enabling
non-middle class individuals to access its employment opportunities and enter the
middle class is quite limited. Nevertheless, the industry might still contribute
towards a new class formation by bringing about changes in the lifestyles and
consumption practices of its workers. Most of the existing claims on changing
consumption practices of IT and IT-eS industry workers are anecdotal, based on
media reports or capture the changing advertising images in liberalised India (see
for example, Fernandes, 2006). This chapter provides more rigorous empirical
evidence on the adoption of new consumption practices and lifestyles by IT-eS
workers after they get into the industry. It examines the factors within the
industry that drive these changes in consumption practices of its workers. The
chapter finally assesses why, based on their income level and consumption habits,
the IT-eS workers may be identified as a new social class and how they are a part
of the new middle class.
As observed earlier in this thesis, existing literature on the new middle class
offers varying evidence on the nature of consumption practices of the class. A few
studies argue that the new middle class is characterised with increasing
westernisation of lifestyles and conspicuous, credit-driven, consumption (Brosius,
15 An earlier version of this chapter, titled, How the BPO Industry Contributes to the Formation of a Consumerist New Middle Class in Mumbai was published in 2016 as a single-authored chapter in Lambregts B., Beerepoot, N. & Kloosterman, R. (Eds.), The Local Impact of Globalization in South and Southeast Asia: Offshore business processes in service industries (pp. 183-194), London and New York: Routledge.
Chapter 7| How the IT-eS Industry Contributes to the Formation of a Consumerist New Middle Class in Mumbai15
144
2010; Nijman, 2006). Others find the lifestyles to be a blend of western and
traditional local preferences (Lakha, 1999; Nadeem, 2009). In spite of the
differences in the nature of consumption practices, all of them agree that the new
middle class is endowed with forms of cultural capital which are different from
that of the pre-existing middle class. Most of these studies however view changes
in consumption practices as an effect of the processes of liberalisation and
globalisation in general. Research on the contribution of the offshore-service
industry on changing lifestyles and consumption habits of its employees is sparse.
Nevertheless, studies by J. Murphy (2011), Nadeem (2009) and Upadhya (2008,
2009) show that the industry is instrumental in bringing about changes in
lifestyles, values and attitudes of its employees, making them the “vanguard of the
global middle class”. While Nadeem (2009) studies both IT and IT-eS workers,
Upadhya (2008, 2009) focuses only on IT industry workers and J. Murphy (2011),
within the larger segment of the IT-eS workers, studies call-centre employees.
None of these studies have examined in detail how employment in the IT-eS
industry brings about changes in consumption practices and lifestyles of its
employees.
This chapter fills these gaps in extant literature by providing a comprehensive
analysis of how the IT-eS industry shapes consumption practices and lifestyles of
its employees. The chapter further probes if workers look at the industry as a
long-term career option. This will indicate whether the impact of the industry on
changes in consumption practices will possibly be an enduring one. The chapter
specifically aims to answer the following questions: What are the income levels of
IT-eS employees and where are they positioned in the Indian class structure on
the basis of their incomes? What are the consumption practices and lifestyles of
IT-eS employees like and how does work in the industry influence them?
Bringing answers to these questions together, the chapter examines the nature of
the new consumerist middle class that is contributed by the IT-eS industry. In
Chapter 7
145
Bourdieu’s framework (see chapter 2), this chapter studies the process of
transformation of the pre-existing capitals of IT-eS workers into new forms of
capital after they get employed in the industry. It will be argued that it is the
transformation of capitals that gives rise to the formation of a new class identity.
The rest of the chapter is divided as follows. Section 7.2 surveys the existing
literature on changing consumption practices and lifestyles associated with the
new middle class in India. The data is described in section 7.3. Section 7.4
presents empirical evidence on the changing consumption practices and lifestyles
of IT-eS workers and discusses the role of the industry in bringing about those
changes. The issue of prospects of the IT-eS industry as a long term career option
for workers is discussed in section 7.5. The final section concludes by assessing
the implications of the results on the contribution of the IT-eS industry to a new
middle class formation.
7.2 The consumerist new middle class
Many studies have linked the emergence of the new middle class in India to the
rise of a new consumer culture. Fernandes (2006), for instance, observes that the
processes of liberalisation and globalisation have introduced a plethora of
consumer goods in the Indian market, as against pre-liberalised India, which had
to be content with a few domestically produced consumer goods. However,
Fernandes (2006) adds that the number of people who can actually have access to
the wide range of consumer goods available is very small, indicating in turn that
the size of the consumerist new middle class is rather small. Birdsall et al. (2000)
assert that the spread of information and opening up of markets allowing imports
of many consumer goods have introduced absolute standards of consumption
crossing national boundaries and are visible, if not attainable for the majority of
the citizens in new market economies. Advertising images carried by various
Formation of a Consumerist New Middle Class in Mumbai

146
brands have created a desire among different segments of the Indian society to
participate in the new consumer culture (Brosius, 2010).
However, as Guarín and Knorringa (2014) rightly observe, little information
exists on actual changes in consumer values and preferences of the new middle
class. Most of these changes are seen as operating through communication media,
mass advertising and aggressive campaigns of global brands. Nevertheless, a few
studies throw some empirical light on the nature of changing consumption
practices of the new middle class, mostly linking them to increasing
westernisation. Lakha (1999) asserts that the new middle class not only
symbolises availability of a wide range of consumer goods, but also reflects the
adoption of new forms of consumption habits and lifestyles. He finds that global
consumer icons and western style consumerism are on the rise among the middle
class in globalised India. Similar arguments are presented by Jaffrelot & van der
Veer (2008). They claim that new western consumer goods made their appearance
in the Indian market and the pre-existing middle class, the first target of the
importers, developed more Americanised tastes and habits.
Nijman (2006) also finds strong evidence of the emergence of a consumption
culture in Mumbai, akin to the West. Besides westernisation of consumption
habits, he also observes a significant increase of credit-based consumption among
the middle and upper-middle classes of Mumbai. According to his study, most of
the consumption of the new middle class is financed through debts. Nijman (2006:
772) states, “(new) middle class status is most commonly associated with visible
consumption which creates a temptation for aspiring upwardly mobile Indians to spend
even they don’t have the money- as long as they can get the credit.” Similarly, Brosius
(2010), who studies the sites of new consumption practices of the middle class in
India, finds evidence of conspicuous, credit-driven and debt-laden consumption.
Chapter 7
147
While the consumerist middle class may be adapting western-style consumption
and spending habits, some studies find that they are not at the exclusion of
existing local styles and cultural sensibilities. According to Lakha (1999), local
tastes and preferences interact with western-style consumerism to produce a
distinct consumption style of the Indian new middle class. For example, while
brand names are an important consideration, these may not be western brands.
Guarín & Knorringa (2014) are sceptical about the exact change in consumer
preferences of the middle class. They argue that while there is no doubt that
consumption patterns change with increased wealth, with a shift from basics to
discretionary items, there is no evidence of an inevitable westernisation of
consumption or convergence towards a global consumer culture. They suggest
that there is both convergence and divergence in consumer cultures of middle
classes across the world.
While evidence on the nature of changing consumption practices of the middle
class in India is far from clear, extant studies also do not reflect upon the
processes through which these changes take place. Though the offshore-service
industry is regarded as one of the significant contributors to the formation of the
consumerist new middle class, very few studies have explored the role of the
industry in bringing about these changes. One among these is the study by
Upadhya (2008) on IT workers, who finds that the opportunity to live abroad that
the industry provides to its employees gives them exposure to western-style
consumerism, creating a class of global middle class Indians. In another study on
the Indian call-centre industry, J. Murphy (2011: 417) characterises the employees
as “part of an emergent global middle class sharing common lifestyles and values
with their counterparts in western countries”. These studies, however, do not
shed enough light on how work in the IT and IT-eS industry really influences the
changing consumption practices of its employees. The rest of the chapter
conducts a detailed empirical investigation to fill these existing gaps on research
Formation of a Consumerist New Middle Class in Mumbai

148
on the contribution of the IT-eS industry to the formation of a consumerist new
middle class in India.
7.3 Data
Analogous to the previous chapter, this chapter is also based on primary data
collected via semi-structured interviews and a survey, which have already been
described earlier in Chapter 3. The empirical evidence in this chapter draws on
the set of questions in the survey and interviews designed to assess the role of the
IT-eS industry in influencing the consumption practices and lifestyles of the
employees. One set of questions captured changes in income, spending patterns
and consumption habits that employees witnessed after joining the industry.
Another set of questions evaluated the respondents’ plans to continue to work in
the industry, thus assessing the possible long term influence of the industry on
new middle class formation.
The first set of questions contained both objective and subjective indicators. The
objective questions pertained to the respondents’ income in the IT-eS industry
and their spending, saving and borrowing behaviour. Questions on expenditure
and borrowings included the major item groups where respondents spent their
income and the reasons for them to incur debts. The subjective questions included
self-perceived changes in lifestyles and consumption practices of the respondents.
In order to assess the role of the IT-eS industry in bringing about these changes,
respondents were asked about the facilities and fringe benefits provided to them
as employees of the industry and the general environment within the workplace.
The second set of questions was directed towards getting an idea about the
respondents’ future plans in the industry, in order to assess the possible medium
to long term impact of the industry on new middle class formation. Current
employees were asked for how long they intended to continue working in the
Chapter 7

149
industry and the reasons for the same. Former employees were asked to list the
reasons for leaving the industry and whether they would like to get into the
industry again in the future. The following sections present the empirical findings
based on these data collected.
7.4 New middle class consumption
“Smart phones, watches, Levi’s jeans, branded shoes... The new middle class is
about going to places and doing things that possibly the last generation could
not and having the spending power to do it as well.”
(Call-centre executive, December, 2012)
The above description by an interview respondent points at two key features of
the consumerist new middle class. First, the new middle class created by the IT-
eS industry has a higher purchasing power than the earlier middle class. In other
words, the new middle class is endowed with higher economic capital as compared
to the pre-existing middle class. Second, this higher purchasing power enables the
class to indulge in consumption practices strikingly different from those of the
earlier middle class in India. The new middle class consumes a variety of
international brands, its new consumption practices akin to the western middle
class. The new middle class seems to have gathered new forms of cultural capital
that distinguishes it from the earlier middle class. Sections 7.4.1 and 7.4.2
respectively discuss the role of the IT-eS industry in contributing to these key
identifying features of the consumerist new middle class- its higher economic
capital and new forms of cultural capital.
7.4.1 Income in the IT-eS Industry
There is ample evidence that the remuneration paid to offshore service employees
is several times higher than that paid to an average Indian employee as well to
traditional middle class employees such as government administrators and school
teachers (Fuller & Narasimhan, 2007; J. Murphy, 2011). The findings from the
Formation of a Consumerist New Middle Class in Mumbai

150
survey and interviews in the last chapter bolster these existing evidences. But
where exactly do IT-eS employees stand in the national income/consumption
expenditure distribution? Figures 7.1 and 7.2 respectively show the kernel density
estimation of daily per capita consumption expenditure and daily per capita
income of IT-eS employees in Mumbai. The total area under the curve in each of
the figures equals one, the area between any two points on the X-axis denoting
the probability that consumption expenditure or income lies within the interval of
those two points. The figures are based on data of 307 survey respondents, who
shared valid information about their personal income and savings.
Figure 7.1 Kernel Density Estimation of Consumption Expenditure
Distribution of Mumbai’s IT-eS Employees (N=307)
Source: Author’s Survey, 2013-14
Figure 7.1 shows daily per capita consumption expenditure distribution of IT-eS
employees in $ 1993 PPP terms to facilitate comparison with the middle class
definition proposed by Banerjee & Duflo (2008). Consumption expenditure here is
calculated as the difference between the employee’s average monthly income and
Chapter 7

151
average monthly savings. Since respondents find it easier to report their personal
income and savings relative to their consumption expenditure, the survey traced
the former variables rather than the latter. The figure shows that modal
consumption expenditure of IT-eS employees is well above the middle class
range. Only 11.4 per cent of the employees fall in the middle class consumption
expenditure range. Even within the middle class, the majority of the employees
are in the upper-middle class, with less than one per cent employees in the lower-
middle class. A vast share of 88.6 per cent of IT-eS employees belong to the
affluent category.
Because the definition by Banerjee & Duflo (2008) is based on developing country
standards, it is worthwhile to also look at the position of IT-eS employees within
a global definition of the middle class, such as that of Meyer & Birdsall (2012).
This will indicate if IT-eS employees are indeed part of the global middle class.
Figure 7.2 shows the kernel density estimation of daily per capita income of IT-eS
employees converted to 2005 PPP dollars to facilitate comparison with Meyer &
Birdsall’s (2012) calculations. The two vertical lines in the figure correspond to
income levels of $10 and $50 respectively, representing the middle class income
range as per the definition of Meyer & Birdsall (2012). The figure shows that
barely two per cent of IT-eS employees earn less than the global middle class
level of income of $10 per capita, per day. The majority of IT-eS employees (about
87 per cent) earn in the range of the global middle class level income and about 10
per cent earn above global middle-class level incomes. Using the same definition,
Meyer & Birdsall (2012) found that less than 10 per cent of India’s population
belonged to the middle class in 2009-10. We can hence conclude that the IT-eS
industry pays its employees incomes far higher than what an average Indian earns
and commensurate with global middle class standards. These results make it clear
that IT-eS employees not only belong to a privileged section within the Indian
middle class, but many of them are a part of the affluent group of the society. This
Formation of a Consumerist New Middle Class in Mumbai

152
calls for reflecting on whether the IT-eS employees should indeed be called the
new middle class, or whether they are better described as the “emerging affluent”
or the “new rich” (see Standard Charted, 2015).
Figure 7.2 Kernel Density Estimation of Income Distribution of Mumbai’s IT-eS Employees (N=307)
Source: Same as Figure 7.1
Besides occupying the higher end of the income and consumption distribution,
IT-eS employees also earn far more than what their parents earned when they
were young or what they still continue to earn at close to retirement. Many
employees feel that they are financially better-off than their parents because they
have been fortunate to have employment opportunities such as that in the IT-eS
industry, which pays them very well. A young, former IT-eS employee, when
asked whether he thinks he has done better in life than his parents, responded
thus:
“I think I have done better than them but that is because I have had the
opportunities that they never had.” (Former call-centre executive,
February, 2013)
Chapter 7

153
Indeed, the primary attraction for employment in the IT-eS industry is the
remuneration in the industry. Average income in the IT-eS sector is higher than
not only other jobs in the private sector, but also most government jobs.
Moreover, the IT-eS industry is open to graduates devoid of any work experience,
making it an attractive career option particularly for the youth. Evidence from
both the survey (see Table 7.1) and interviews clearly point out that the relatively
high remuneration paid in the industry is the primary reason for the vast majority
of employees to choose to work in the IT-eS sector. A young graduate working
for an American IT-eS firm recalls why she chose to work in the IT-eS industry
rather than in an Indian firm.
“The pay in IT-eS firms was at least three times higher than the Indian
companies I had applied to.” (Back-office executive, November 2012)
Table 7.1Why Workers Join the IT-eS Industry
(N=255)
Rank 1 Rank 2 Rank 3
Attractive remuneration 113 52 26
Scope to continue further studies 34 44 34
Night shifts 42 50 53
Easy to gain entry 33 34 33
Attractive work profile 24 33 31
Respectable job 12 09 21
Secure job 09 10 20
Lack of other job options 12 03 10
Accidental 07 05 00
Source: Author’s survey, 2013-14
Formation of a Consumerist New Middle Class in Mumbai

154
The IT-eS industry provides pre-existing middle class families, who already have
access to some basic economic capital, with opportunities to further enhance that
capital. This enables them to occupy a relatively high position in the national
income/consumption expenditure distribution. In fact, as Figures 7.1 and 7.2
showed, the majority of these employees are not even positioned in the upper-
middle class, but are part of the small group of affluent Indians, or the global
middle class.
7.4.2 Consumption practices in the IT-eS industry
7.4.2.1 Changes in lifestyles and personality
Embodied capital
The IT-eS industry not only augments the economic capital of the urban middle
class youth, but also transforms their cultural capitals. This research finds that
the nature of work in the IT-eS industry makes a noticeable impact on the
embodied capital of the employees. Since IT-eS workers interact with clients
abroad, they are trained on a variety of soft skills. Call-centre agents are trained
on their voice and accent; most employees are educated about the cultural
backgrounds of their clients located abroad, while some are trained on behavioural
etiquettes. The survey showed that 56 per cent respondents receive some kind of
on-the-job training in the industry. Out of these, 64 per cent employees receive
training in voice and accent, 45 per cent are trained on computer skills, 32 per
cent get soft skills training and 47 per cent workers receive process specific
training. The on-the-job training has a considerable impact on the personalities of
the workers. 77 per cent respondents claimed that they found an improvement in
their communication and people skills while 66 per cent employees were more
aware of multiple cultures after working in the industry. Nevertheless, working in
the industry also has a negative influence on a small fraction of the employees.
About 10 per cent respondents said that they picked up smoking or drinking
habits after entering the industry. A small number of workers stated that they
Chapter 7

155
already had these habits before entering the industry, but most respondents
claimed that they stayed away from smoking or drinking.
The most striking impact on embodied capital is on the personality and attitude of
the workers. The grooming and training that workers receive on the job leave a
positive and enduring impact on their personalities, which are reflected even
outside their work. One respondent shares her experience:
“We are taught not to offend our customers. If for nine hours a day we are
talking to customers then it tends to reflect on our daily language. I noticed a
lot of shop owners know me in my area. They remember that I had gone to
their shop six months back. Now they remember you because you were polite
and nice to them at one time. This has happened after I joined the sector.”
(Knowledge coach, December, 2012)
Another respondent, who has spent over a decade working for an IT-eS firm,
finds a stark change in his personality after working in the industry.
“The kind of training you get in this industry, the kind of grooming that you
get, there is a lot of exposure. I suddenly got this confidence.”
(Team leader, November, 2012)
Objectified capital
While the work culture leaves a noticeable impact on the personalities of the
workers, the high remuneration in the industry has a great influence on the
spending patterns of employees. Figure 7.3 shows the key item groups where IT-
eS employees spend their income. Even though employees spend a substantial
portion of their income on household necessities, they spend a considerable share
also on discretionary goods and services. As figure 7.3 shows, a large fraction of
income of IT-eS workers is especially spent on clothing, grooming and
conveyance. Most importantly, compared to the national level data presented in
Formation of a Consumerist New Middle Class in Mumbai

156
Chapter 4, IT-eS employees spend a considerably smaller share of their
expenditure on necessities and a larger fraction on discretionary items relative to
even the urban affluent. Spending patterns of IT-eS employees are not related
merely to their high remuneration. Many factors within the IT-eS industry
determine their spending choices.
Figure 7.3 Median Share of Consumption Expenditure of IT-eS Employees on Various Item Groups (N=269)
Source: Same as Figure 7.1
The work environment in the IT-eS industry particularly plays a critical role in
bringing about changes in lifestyles and spending patterns of employees. The
survey finds that an overwhelming 98 per cent of the employees witness some
change in their lifestyle and consumption practices after entering the IT-eS
industry. Dress sense and eating habits, especially, are two areas where most
employees are found to have experienced significant changes. The survey finds
that over 55 per cent of the respondents become more brand conscious while
buying their clothes after getting into the industry, 43 per cent wear more
modern and fashionable outfits and 37 per cent feel that they have a better dress
sense than before. Besides changes in dress sense, many respondents also reported
Chapter 7

157
to have witnessed changes in their food habits after entering the industry. 35 per
cent of the survey respondents affirmed that they try new and different kinds of
cuisines while 27 per cent eat out at restaurants more often than before. This is in
line with the data presented in Figure 7.3, wherein employees spend a substantial
share of their income on clothing and grooming and on restaurants.
The interviews shed more light on the nature of changes in the dress sense and
eating habits of IT-eS employees. One respondent describes the changes in his
dress sense after joining the IT-eS sector:
“In companies like my previous job [a coaching institute], no one really looks
(at your clothes). When you come to a BPO, you see people wearing different
clothes, the way they wear it, the combination... so it changes. Earlier I used to
buy clothes from Fashion Street [a popular street in Mumbai that sells
fashionable wear at low prices]. I do not like the clothes there anymore. Now I
only buy from Westside [an Indian retail chain].” (Back-office executive,
January, 2013)
Another respondent reports on his changing dining behaviour:
“Earlier going out would mean visiting an Udipi restaurant [a modest Indian
vegetarian restaurant] and having a roti [Indian bread], sabji [vegetable]
and a dessert. In the evening you would go and have some chaat [a snack].
Now, you want to try new places. So you may go to a Pizza Hut or you may
try Mexican or Thai food. Once in a while we also splurge and go to a
Mainland China or a Taj restaurant.” (Supervisor, February, 2013)
These narrations show that changes in dressing imply both having a better dress
sense as well as being more brand-conscious. Changing food habits among IT-eS
workers consist of both going to more expensive places to eat and experimenting
with multicultural cuisines.
Formation of a Consumerist New Middle Class in Mumbai

158
Besides dress and food habits, another area where many respondents reported to
have recorded changes in their way of consumption was the mode of transport
used. Since employees in the IT-eS industry generally work in night shifts, they
are provided complimentary pick-up and drop-off services by cars or comfortable
buses. Consequently, they tend to travel in such comfortable and relatively
expensive modes of transport even outside of work (see Figure 7.3, which shows
that IT-eS employees spend five per cent of their monthly expenditure on
conveyance). The ambience in firms indeed plays a crucial role in influencing the
changing consumption habits of employees. As the back-office executive
described, his dress sense changed after looking at others in his workplace who
wore better clothes than him and the realisation that his way of dressing was
being noticed.
Amenities within IT-eS firms and performance based incentives given to
employees introduce them to new forms of consumption practices. Interview
respondents noted that their offices have “nice coffee vending machines and machines
for soft-drinks”, wherein these drinks are made available at subsidised rates.
Several companies also have multinational food joints and cafes such as
McDonalds, Pizza Hut and Starbucks located within their office premises.
Shopping malls housing similar joints have also strategically located themselves
around outsourcing companies. In fact, as entry into the office premises is
restricted to outsiders, most interviews conducted for this research took place in
cafes located in shopping malls around the respondents’ workplaces (see Appendix
A2.1). A few big outsourcing firms even have in-house gyms, libraries, beauty
salons, sport complexes and such other facilities that employees may use outside
their working hours. Not surprisingly, workers tend to visit similar places also
outside of work. Results from the survey show that 67 per cent of the employees
get free transport facilities, 31 per cent workers are given credit or debit cards on
joining the company, 29 per cent have multi-cuisine cafeterias in their office
Chapter 7

159
premises and 34 per cent have either gymnasiums or sport facilities or both within
their offices. Only 17 per cent of the employees do not have any such facilities at
their workplaces.
Besides these facilities, the IT-eS industry also offers several perks to its
employees. Though perks have been historically provided in the Indian public
sector too, the IT-eS industry has transformed the status implications of these
perks by linking them to new patterns of consumption (Fernandes, 2006). While
the Indian public sector provides its employees with standard benefits such as
insurance, medical facilities, provident fund and so on, IT-eS companies, besides
these standard benefits, also offer monetary and non-pecuniary benefits such as
smart phones and home appliances, which are typically attractive to the young,
who are found in majority in the industry. Survey results show that 70 per cent of
the employees get performance-based pecuniary rewards, 30 per cent receive non-
monetary rewards in the form of gifts such as mobile phones, computer laptops
and home appliances, 54 per cent get standard benefits like provident fund, while
only six per cent do not receive any form of additional incentives. The IT-eS
industry thus provides its employees with exposure to a variety of quality goods
and services, introducing them to new forms of consumption behaviour, making
them a conspicuous symbol of a consumerist class. An industry expert describes
how the facilities provided transform the lifestyles of IT-eS employees.
“Earlier only a General Manager would be sent a car to be picked up. Today,
all these guys are being sent cars. And if the driver is even 10 minutes late, they
abuse him. Standards and expectations have risen.” (HR head, October,
2012)
The empirical evidence so far shows that the work atmosphere in the IT-eS
industry has an important influence on the lifestyles of its employees. The higher
economic capital in the industry endows employees with new forms of objectified
Formation of a Consumerist New Middle Class in Mumbai

160
capital, wherein they not only own more material objects, but also learn how to
consume them. This however does not imply that employees adopt an
Americanised or westernised lifestyle. Their lifestyles are modern, but also
influenced by local traditions. IT-eS employees may thus eat out at expensive
restaurants more frequently than the average Indian, but their cuisines are both
Indian and multi-national. Similarly, although IT-eS employees assign
importance to the way they dress, the places from where they shop and the
clothes they wear continue to be rooted in traditions. These findings bolster those
of Guarín & Knorringa (2014) and Lakha (1999), who claim that consumption
practices of the new middle class, though global in nature, are influenced by local
tastes and preferences.
7.4.2.2 Credit-driven consumption?
While lifestyles of IT-eS employees may not be westernised in the true sense of
the term, existing literature claims that much of their consumption is debt-laden
or credit-driven (Brosius, 2010; Nijman, 2006). The survey however shows that
the median IT-eS worker refrains from borrowing loans. In fact, IT-eS workers
manage to save a fairly large proportion of their income (see Figure 7.3). The
survey revealed that a very small fraction of respondents did indulge in debt-
laden consumption, purchasing a few modern and expensive goods such as mobile
phones through borrowings. Interviews with employees further shed light on
credit-driven consumption of IT-eS employees. Respondents observed that
employment in the IT-eS industry leads to a sudden surge in the flow of income
at a relatively young age. The temptation for conspicuous, credit-driven
consumption arises from the number of credit cards and incentives that
respondents are offered by banks to indulge in credit-laden consumption. One
respondent explains:
“These banks see the money that is coming in and offer you credit cards. You do
not know how to use the cards and you misuse the liberty given to you. It had
Chapter 7

161
spoiled me and that is why I know.” (Call-centre executive, November,
2014)
Respondents are however quick to add that this is merely a temporary
phenomenon, which primarily takes place when employees are new in the
industry and suddenly witness a surge in their income. After a few years of being
in the sector, they realise the importance of managing their finances better. A
respondent with an industry experience of almost a decade affirms this.
“There was a point when I would get my salary and within five days it would
all go because I had to pay so many debts. This happened for about two to three
years. After that I realised I need to start managing my finances.”
(Team leader, November 2012)
Further investigation reveals that only those employees who are not necessarily
required to support their families indulge in such credit driven consumption.
Many employees in the industry have dependent family members, which compels
them to spend most of their income on household needs. In fact, many young
employees take up a job in the IT-eS sector because the high income earned in the
industry not only allows them to financially support their families, but also
enables them to save enough to pursue further education (see Table 7.1, which
shows that many respondents take up a job in the industry because the night
shifts allow them to continue to pursue their education during the day). Such
employees have little income left after meeting their necessities to finance any
luxurious purchases. They either do not indulge in any opulent consumption or
postpone them for a few years until they feel financially comfortable. A young
undergraduate IT-eS worker, who joined the sector after the demise of his father-
then the only earning member in the family- corroborates this, when asked why
he chose to work in the IT-eS sector.
Formation of a Consumerist New Middle Class in Mumbai

162
Imag
e 5:
Vie
w fr
om in
side
an
IT-e
S fir
m in
Mum
bai:
Em
ploy
ees
enjo
ying
a g
ame
of ta
ble-
tenn
is
Pho
to: S
andh
ya K
rish
nan
Chapter 7

163
Imag
e 6:
Vie
w fr
om in
side
an
IT-e
S fir
m lo
cate
d in
Mum
bai:
A c
afet
eria
offe
ring
a v
arie
ty o
f op
tions
to e
at
Pho
to: S
andh
ya K
rish
nan
Formation of a Consumerist New Middle Class in Mumbai

164
“I had to run my family and had to fund my sister’s education. Also, I want to
study further. This is the only high paying industry wherein you can save and
then do something further.” (Back-office executive, January, 2013)
The empirical evidences presented so far reveal that employment in the IT-eS
industry is indeed an important influence in shaping consumption practices of its
employees. However, in contrast to existing literature, the evidence for
westernisation of consumption or for credit-driven consumption is weak. The
results are similar to those of Upadhya (2009), who finds that IT workers in
Bangalore devote a substantial share of their income on household necessities and
savings; and experience similar lifestyle changes as described here. This shows
that not only both IT and IT-eS industries draw employees mainly from pre-
existing middle class families, but both segments of the service-outsourcing
industry also have similar influences on consumption and lifestyle changes of their
workers.
7.5 IT-eS industry as a long term career option
The chapter so far has shown that the IT-eS industry plays a vital role in driving
its employees to take to new consumption practices, making them a conspicuous
symbol of the new middle class, or rather, the emerging affluent in the country.
To further understand the contribution of the industry to a consumerist new
middle class formation, it is essential to assess whether workers look at the IT-eS
industry as a long term career option. If employees aspire to remain in the
industry for a considerable period, the impact of the sector on a new class
formation and changing consumption habits may be greater. In contrast, if
employees intend to work in the sector only for a short while, then the sector may
perhaps not have a significantly lasting influence on lifestyles and consumption
practices of its employees. This section explores this yet under-researched area of
whether IT-eS workers look up to the industry as a long term career option.
Chapter 7

165
Table 7.2 Reasons for Short-Term Employment in the IT-eS Industry
Current Employees (N=200)* Former Employees (N=74)
Rank 1 Rank 2 Rank 3 Rank 1 Rank 2 Rank 3
Unhappy with nature of job 30 28 16 07 14 11
Interested in another type of
job
24 37 19 03 01 01
Inability to cope with night
shifts
19 22 21 12 14 14
Lack of job security 37 09 21 05 01 06
Lack of growth
opportunities
07 16 13 10 24 09
Unhappy with the pay 07 06 09 30 04 09
Not a respectable job 07 04 10 01 07 01
Company down-sized/shut-
down
NA NA NA 00 01 03
*: Includes only those employees who intend to work in the industry for less than five years from the date of survey
Source: Author’s survey, 2013-14
In spite of the IT-eS industry being an attractive employment option for young
jobseekers, both the survey and interviews indicated that most employees view
their job in the industry as a short term or medium term phenomenon. The
survey showed that over one-third of the current employees in the industry
intend to work in the IT-eS industry for less than two years, while only seven per
cent plan to spend more than 10 years in the industry. Furthermore, former
employees spent an average of merely one year in the industry, with 57 per cent
of them indicating that they are not interested in getting back in the industry in
the future. 31 per cent of the employees were unsure if they would work in the
industry again, while only about 10 per cent of the former workers were keen on
working in the industry again in the future. Current employees cited various
Table 7.2 Reasons for Short-Term Employment in the IT-eS Industry
Current Employees (N=200)*
Former Employees (N=74)
Rank 1 Rank 2 Rank 3 Rank 1 Rank 2 Rank 3
Unhappy with nature of job
30 28 16 07 14 11
Interested in another type of job
24 37 19 03 01 01
Inability to cope with night shifts
19 22 21 12 14 14
Lack of job security 37 09 21 05 01 06
Lack of growth opportunities
07 16 13 10 24 09
Unhappy with the pay 07 06 09 30 04 09
Not a respectable job 07 04 10 01 07 01
Company down-sized/ shut-down
NA NA NA 00 01 03
*: Includes only those employees who intend to work in the industry for less than five years from the date of survey Source: Author’s survey, 2013-14
Formation of a Consumerist New Middle Class in Mumbai

166
reasons for their plans to quit the industry in the near future (see Table 7.2).
These mainly included lack of job security in the industry, the night shifts
hampering their health and their passion for another type of job. Surprisingly,
many former employees quit the industry because they were unhappy with the
pay, which after a while may not be enough to compensate for the pressing work
schedules. A few others cited lack of growth opportunities in the industry,
whereas others were unhappy working in night shifts.
The interviews vindicate the survey results. A former call-centre employee, who
quit the industry after completing his graduate degree, echoes the perception of
many young employees who enter the sector because it enables them to earn a
living along with pursuing their higher studies, but quit the industry once they
complete their studies.
“I was quite sure that once I finished my graduation I would leave this sector.
Night shift was the main reason to quit. The reason I joined there (the IT-eS
industry) was because it enabled me to attend college. But once I had finished
college, what was the point in continuing on the job?” (Former call-centre
executive, February, 2013)
Many respondents cited night shifts as the primary reason for not intending to
pursue a long term career in the industry as it negatively affected their health in
the long run. A few others had reservations about the nature of work in the
sector. Many employees did not find the nature of job in the sector to be fulfilling.
A workforce strategist in a large Indian IT-eS firm dreams of pursuing a career as
a chef after having gathered enough work experience and having earned enough
income in the industry. He tersely puts across his view about the sector:
“This sector has money; that is it.” (Workforce strategist, January, 2013)
Other respondents found their job in the IT-eS industry interesting, but cited lack
of job security in the sector as their reason for short term employment in the
Chapter 7

167
sector. Given the bleak global economic scenario and the rapidly changing
dynamics of the industry (see for example, Brynjolfsson & McAfee, 2014; The
Economist, 2011, 2016), these employees felt that there was no assurance that
India will continue to attract service-outsourcing jobs in the years to come. They
preferred to be employed in Indian public sector jobs, which according to them
“have a future”, besides providing them with various fringe benefits. A young
female respondent, who continues to try to get a job in the public sector even as
she works as a back-office executive in a leading American outsourcing firm,
shares the opinion of many like-minded workers:
“In the IT-eS sector a company can get out any time. Indian companies have a
future. They have more secure jobs.” (Back-office executive, November,
2012)
A few respondents also found Indian private firms to be more secure than service
offshore firms. However, these employees face the predicament that they will
have to accept a lower remuneration if they choose to work in private Indian
firms. A back-office executive, holding a graduate degree, eloquently puts across
this dilemma.
“There is the pressure that in case outsourcing ceases to exist, we might become
jobless. We are not even that highly educated that we will get good jobs in other
sectors. The pay package that we get here is pretty high and we will not earn
such a high package elsewhere. That is why we feel a bit scared.”
(Back-office executive, November, 2012)
Thus, while IT-eS employees are attracted to the high remuneration offered by
the industry, they are constantly under the pressure of losing their job due to
market uncertainties. Indian companies, although offer a lower remuneration;
seem to be a better employment option in the long term. It is indeed remarkable
that these new middle class employees engaged in the ‘new’ economy jobs actually
prefer jobs that are attached with the traditional middle class.
Formation of a Consumerist New Middle Class in Mumbai

168
Given the changing dynamics of the IT-eS industry and the introduction of new
technologies that facilitate automation of modern service activities (such as cloud
computing), it is difficult to foresee the future prospects of offshore service
activities in India. The fears of employees such as those quoted above are not
completely misplaced, because other countries such as the Philippines have started
to attract a large share of the low-end services such as voice processes, leaving
India behind in this segment. India, however, continues to dominate the high-end
segment of the global service outsourcing industry (that is, those segments
involving higher level of skills; for example, financial analytics or web-designing).
The interviews show that it is largely employees in the low-end segment of the
IT-eS industry who enter the sector with a short term employment objective
(mainly call-centre executives or data-entry operators). Those in the high-end
segment do not appear to be apprehensive about losing their jobs. These results
partly bolster the claims of Fernandes (2000), who finds that labour market
restructuring in urban India is characterised with job market insecurity, especially
at the lower-end of the middle class segment. The findings here show that this
may be true even at the upper-end of the middle class segment, that is, among IT-
eS industry workers. It remains to be seen whether the industry will continue to
influence the consumption practices and lifestyles of its employees even as they
move to domestic industries.
Industry leaders too appear to be in cognizance of the transient nature of
employment in the low-end segment of the IT-eS industry. The marketing head
of NASSCOM, the industry body for service-outsourcing firms in India, explains
the nature of employment in different types of services in the sector.
“I think attrition in a (low-end) IT-eS environment is accepted and expected
too because of the nature of the job. People may switch jobs for multiple reasons
like better opportunities elsewhere, for further studies, because of job fatigue or
because they came into the sector with a short-term objective. Generally
Chapter 7

169
attrition is lower in high-end jobs because employees get challenging jobs and
they come there with a specific interest in mind.” (Vice-President,
Marketing, NASSCOM, March, 2013)
Thus, employees especially at the lower-end of the offshore segment view
employment in the industry essentially as a stop-gap arrangement that enables
them to earn enough money to support themselves and their families along with
pursuing higher education. They also see the industry as an opportunity to learn
useful skills that can better their chances of employment in other industries (see
also Beerepoot & Hendriks, 2013). Former employees have already found better
job opportunities, some of the current employees are positive about finding such
opportunities in the future, while still others are anxious if domestic Indian firms
will provide them with similar monetary compensation as the IT-eS industry.
Given the fairly high level of education of IT-eS employees, it is likely they will
find employment opportunities elsewhere which will continue to put them in the
middle class. However, it remains to be seen whether they find employment
opportunities that offer them remunerations similar to the IT-eS industry and
whether their consumption practices picked up in the industry are maintained in
the longer run. These findings also point towards the differences between IT and
the lower-end segment of the IT-eS industry. While the former is considered as a
long term career option, the latter is generally a stop-gap arrangement for
employees to look for better work opportunities elsewhere.
7.6 Conclusion
This chapter analysed how the IT-eS industry in Mumbai influences changes in
lifestyles and consumption practices of its employees. The chapter finds that the
relatively high remuneration paid to IT-eS workers as compared to the average
Indian is an important factor in determining the urban youth’s choice to work in
the industry as well as in bringing about a change in their lifestyles and
Formation of a Consumerist New Middle Class in Mumbai
170
consumption practices. In fact, the high level of income paid to the workers
positions them not in the middle class, but in the upper-middle and affluent
classes of the Indian society. The findings on occupational distribution across
classes in Chapter 5 vindicate these results from the primary survey.
Besides the high level of income, the nature of work in the industry provides
employees with global exposure, creating noticeable changes in their
comportment and personalities. The work culture and ambience further exposes
employees to various new forms of consumption habits such as better dress sense,
international cuisines and expensive modes of transport. However, the changes in
consumption habits do not strictly imply westernisation of consumption or credit-
driven consumption as is argued in existing studies such as that of Brosius (2010)
and Nijman (2006). They rather entail a blend of westernised and local tastes and
preferences. As pointed by Guarín & Knorringa (2014: 155) in the context of new
middle class consumers in emerging economies, the contribution of the IT-eS
industry to a new social class formation must be seen “both as an economic
transformation involving an increase in purchasing ability and discretionary
income, and as a socio-cultural transformation involving a change in beliefs,
attitudes, norms and motivations of consumption”.
The chapter also finds that although the IT-eS industry is an attractive
employment opportunity for the urban middle class youth, the majority of them
view the sector as a transient option. This implies that perhaps, the consumption
practices adopted by these employees may not last for a long period of time. The
competitive and foot-loose nature of the industry especially at the lower-end
further creates uncertainty over the long-run impact of the industry in bringing
about a socio-economic transformation. Moreover, given the rapidly changing
dynamics of the sector, it is difficult to foresee the precise impression that the
industry may leave on the Indian society in the long run. However, as long as
India continues to attract IT and higher-end IT-eS services, these segments will
Chapter 7

171
be a major influence on the lifestyles and consumption practices of its workers.
Findings from the last chapter and this chapter together throw important insights
on how various forms of capitals function to produce a distinct new middle class
identity. As the last chapter showed, access to employment in the IT-eS industry
entails pre-possession of at least a basic level of economic capital and a high level
of cultural capital in the form of English language education. This chapter finds
that employment in the IT-eS industry further transforms these pre-existing
capitals of middle class employees into new forms of capital, resulting in a
distinct identity of a consumerist new middle class. Employment in the IT-eS
industry enables workers to acquire a higher level of economic capital. Moreover,
it has a prominent impact on the cultural capital of employees. Employees are
exposed to and acquire new forms of objectified capital such as latest gadgets and
branded clothes. Their embodied capital also entails a transformation as they
witness changes in their personalities and acquire new ways of dressing and
eating. It is indeed this transformation of capitals that facilitates the shift in class
identity from the middle class to the new middle class.
However, it is also essential to note that the nature of the new middle class
created by the IT-eS industry is different from that of the Indian new middle class
at large, both in quantitative and qualitative terms. Quantitatively, the new middle
class created by the IT-eS industry is rather small when compared to over 600
million Indians who fall in the middle class category. Qualitatively, as the
empirical chapters together show, the consumption patterns of IT-eS employees
differ from that of the general new middle class in India. Furthermore,
structurally the Indian new middle class at large, comprising of different social
groups of the society, is in stark divergence from the new middle class formed out
of the IT-eS industry in Mumbai, comprising essentially of the pre-existing
middle class. Thus, the newness in the middle class of these two groups ought to
be understood differently.
Formation of a Consumerist New Middle Class in Mumbai

172

173
Chapter 8 | Conclusion
This thesis started with the objective to understand the emergence of a new
middle class in India and the contribution of the offshore-services industry to such
a class formation. At a more general level, the research aimed to contribute to
debates surrounding the developmental implications of globalisation and a
services-led growth path in developing countries that seemed to have more or less
skipped the industrialisation-led growth phase (Eichengreen & Gupta, 2011;
Ghani & O’Connell, 2014; Lambregts et al., 2016). India can be seen a key case of
such a service-sector led development as this country has benefitted most from
recent advancements in technology and service-sector globalisation. The study on
the implications of offshore services on the Indian society from the lens of class,
including changes in existing class structures and the rise of new social classes,
enabled to gain a comprehensive understanding of the social, economic and
cultural transformations that have taken place because of the emergence of the
industry.
Bourdieu's (1986) conceptualisation of forms of capital provided a good
framework within which such an analysis could be carried out. Taking economic
capital in the form of consumption expenditures as the fundamental yardstick to
classify society into different classes, this thesis first studied how the middle class
in India has changed quantitatively and qualitatively during the years from 1999-
00 to 2011-12. It then examined how the offshore-services industry has
contributed to such changes in the middle class, giving rise to the formation of a
new middle class.
This concluding chapter of the thesis first summarises the main findings of the
study. It then draws out the theoretical implications of the findings for
development and class theories. The next section proposes policy
Chapter 8| Conclusion

174
recommendations. This is followed by reflections on the scope for further research
from this study. The last section makes some final remarks about this research.
8.1 Key findings of the research
The central findings from this study establish that there has been a remarkable
expansion in the size of the middle class in India between 2004-05 and 2011-12
and an emergence of a quantitatively and qualitatively new middle class. The
contribution of the offshore-services industry to such a new middle class
formation is however quite limited. The industry has played little direct role in
the quantitative expansion of the middle class or in the transformation of the
structural composition of the class. The offshore-services industry has contributed
to a new middle class formation mainly by influencing the consumption practices
and lifestyles of a small privileged section of the existing urban middle class. This
section, drawing on the research questions of Section 1.4, presents the key
findings of this study.
8.1.1 Quantitative expansion of the Indian middle class between 1999-00
and 2011-12
Applying the economic definition of the middle class proposed by Banerjee &
Duflo (2008), Chapter 4 found little growth in India’s middle class size between
the years 1999-00 and 2004-05. The seven years between 2004-05 and 2011-12,
however, witnessed an unprecedented expansion in the size of the Indian middle
class, from less than 30 per cent to over 50 per cent of the population. In absolute
terms, the middle class almost doubled in size. Further analysis revealed that over
70 per cent of the middle class was in the lower-middle class category. The share
of the middle-middle and the upper-middle classes within the middle class was
modest at 18 per cent and 8 per cent, respectively. The analysis thus revealed that
between the years 2004-05 and 2011-12, about 300 million Indians acquired a
level of economic capital that classified them as middle class, which made this
Chapter 8

175
class quantitatively ‘new’. Most of these new entrants were however still quite
close to the poverty line and hence vulnerable to fall back into poverty in case of
an economic shock.
This study also found that this middle class expansion took place across rural and
urban areas as well as in the majority of the states of India. In fact, rural India
surpassed urban India in terms of the number of people in the middle class,
indicating that the new middle class is not concentrated only in urban areas.
Factors driving the significant growth of a new middle class in rural areas
demand appropriate examination, as is discussed in Section 8.4. Although many
states had shown a significant increase in the size of their middle classes, the
states of Rajasthan in the north and Andhra Pradesh and Karnataka in the south
especially recorded a noticeable expansion in the size of their middle classes. The
performance of these states can be attributed to the reforms that they initiated
during the period under analysis. The states in the east of India, though showed
an improvement, remained the laggard states in terms of middle class size. These
findings demonstrate the emergence of a quantitatively new middle class, spread
across different parts of the country.
These results bolster the assertions made in several reports and academic studies
(see Ablett et al., 2007; ADB, 2010; Kharas, 2010) about the Indian middle class
being one of the frontrunners (along with its Chinese counterpart) in driving
global consumption demand in the post-recession period. However, they
contradict the claims of Fernandes (2006), Nijman (2006) and others, who view
the Indian new middle class as essentially an urban phenomenon. At least two
reasons can be cited for this discrepancy in results. First, Fernandes (2006) and
Nijman (2006) define the new middle class rather narrowly, as only those sections
within the existing middle class who have directly benefitted from the processes
of liberalisation and globalisation, that is, those employed in the new economy
Conclusion
176
jobs. Based on this narrow definition of the new middle class, even this study
found the class to be rather small in its size and concentrated in the urban areas.
Second, these studies were carried out much before 2012 and focused only on the
city of Mumbai, because of which they might have found an urban bias in the
middle class. This research demonstrates that the period between 2004-05 and
2011-12 should be seen as the critical period when India witnessed a growth in
the size of its middle class, which trickled down to different parts of the country,
including the rural areas.
8.1.2 Changing consumption patterns of the middle class between 1999-
00 and 2011-12
The analysis of class-wise consumption patterns revealed substantial differences
in spending patterns between classes. In accordance with the Engel’s law, it was
found that the fraction of expenditure spent on food declines as one moves up the
income/consumption expenditure distribution and that on discretionary goods
and services rises. Middle-class households in general spent a substantially larger
share of their expenditure on consumer services, education, health, durable goods
and house-rent (items that are traditionally considered fundamental to middle
class status, see for example, Bergeron et al., 2014; Kochhar, 2015) as compared to
the poor. There were considerable differences in spending patterns within the
middle class, with the lower-middle class spending a much larger share of its
expenditure on food than the upper-middle class. Nevertheless, there were just as
substantial differences in spending patterns between the poor and the lower-
middle class, indicating that daily per capita expenditure just a little above $2
made a noticeable difference in the budgetary allocation of households. This also
showed that the lower-limit of $2 to define the middle class is not as arbitrary as
Banerjee & Duflo (2008: 4) themselves confess it to be. The lower-limit of $2 in
fact provides a base amount of consumption that can contribute economically to
growth by allowing households to spend a fair share of their expenditure on
Chapter 8

177
discretionary goods (Chun et al., 2011). Because this definition also fits other
relative definitions of the middle class (for example, that of Easterly, 2001), it
shows that economic definitions of the middle class are after all not as ad hoc as
they are sometimes perceived to be (see for example, Research Unit in Political
Economy, 2014). Economic definitions of class however differ from country to
country, and should be applied only after a careful analysis of the social and
economic structure of the society under study.
The level of consumption expenditure is also reflected in the possession of the
kind of consumer goods owned, that is, the level of objectified capital acquired by
households. Ownership of type of household appliances, personal vehicles as well
as the more modern technology-based goods differed considerably across classes.
Luxurious goods such as air-conditioners, refrigerators, personal computers and
cars, whose ownership is generally associated with the rise of a new middle class,
were possessed largely by the upper-middle and affluent classes, who constituted
a small proportion of the country’s population. The larger segment of the lower-
middle class mostly owned goods such as motor-bikes and television sets. Mobile
phones, a modern consumer good, were owned by a large number of households
across all classes, indicating its affordability and its importance as a necessity in
the current times of information technology and high-speed communication. The
spending patterns of the new middle class and its possession of different types of
consumer goods have important implications for stakeholders in both the public
and private sectors, which are discussed in Section 8.3.
8.1.3 Changes in the social composition of the middle class between
1999-00 and 2011-12
While Chapter 4 established that the remarkably large size of the contemporary
middle class in India made it quantitatively new, Chapter 5 showed that this
middle class is also qualitatively different from the earlier one with respect to its
Conclusion
178
level of education, type of occupation and caste and religious affiliations. An
important and somewhat surprising finding was that the majority of the new
entrants to the middle class between 2004-05 and 2011-12 had noticeably lower
levels of education than the pre-existing middle class. This shows that acquisition
of institutionalised cultural capital has not kept pace with that of economic capital
and objectified cultural capital. These results are in line with Bourdieu’s assertion
that cultural capital takes relatively more time to accumulate. They also indicate
that some forms of cultural capital, such as objectified capital (ownership of
goods) are more directly related to the level of economic capital and acquired
sooner than other forms of cultural capital such as institutionalised capital
(education).
The low level of education meant that new middle class households were mostly
engaged in non-middle class, unskilled occupations. The largest growth in middle
class size was found in what can be seen as more traditional economic activities,
namely the construction sector, whereas the typical middle class occupations of
trade and public administration recorded a decline in the proportion of middle
class individuals working in them. Moreover, it was also found that modern
services-based jobs brought about by liberalisation and globalisation such as
finance, IT and communications employed only a small segment of the population,
largely belonging to the upper-middle and affluent classes. These findings reflect
some important trends in India’s occupational distribution. Liberalisation and
globalisation have shrunk the number of jobs available in the public sector, where
the Indian middle class was traditionally employed in. Sectors such as IT and
finance have only partially replaced these jobs. Because of their capital and skill-
intensive nature, they employ a smaller share of the population than the public
sector. These new services have however created a demand for various types of
other services and infrastructure facilities, indirectly generating jobs in informal
services. The construction industry, being labour-intensive and a beneficiary of
Chapter 8

179
the backward linkages of services production, has benefitted the most from the
services-led growth in the recent years. The growing demand for construction
workers has in effect raised wages in the construction sector, making the sector
one of the largest drivers of new middle class formation. The increasingly
important role of the construction sector in India’s growth is yet under-studied,
as further discussed in Section 8.4.
Besides education and occupation, considerable changes were also recorded in the
caste and religious compositions of the new middle class. Unlike the earlier
middle class that was composed of mainly the upper-caste Hindus, the expansion
in the size of the middle class between 2004-05 and 2011-12 involved the entry of
many lower-castes into the middle class, from both Hindu and Muslim
households. As such the middle class has become more ethnically diverse and
inclusive, which makes it new from yet another dimension. However, within the
middle class, the upper-middle class continued to be dominated by upper-caste
Hindus whereas the lower-castes mainly occupied the lower-middle class position.
This shows that social divisions in the form of caste and religion continue to exist
and influence class positions in India and that the disadvantaged social groups are
yet to catch-up with the rest of the society. This is because the better jobs such as
those in formal service-based activities generally rely heavily on the cultural
capital of higher education and even other forms of embodied capital such as
comportment and soft skills (as is further shown in the following sub-section). As
Bourdieu (1986) states, cultural capital takes time to accumulate and until then
class divisions on the basis of cultural capital will continue to exist. The entry of
lower-caste groups into the new middle class shows that caste divisions are
getting gradually diluted, but on the basis of only economic capital. It will take
time for the historically disadvantaged caste groups to accumulate the level and
forms of cultural capital that the upper-castes have acquired over the years.
Conclusion

180
8.1.4 Accessibility of employment opportunities in the IT-eS industry in
Mumbai to different classes
While at the all-India level, many households successfully entered the middle
class leaving behind poverty, Chapter 6 found that the IT-eS industry (in
Mumbai) has made little contribution towards such overall new middle class
formation. The majority of the employees in the industry are from pre-existing
urban middle-class families, whose parents possess cultural capital in the forms of
high level of education, knowledge of the English language, occupation in typical
middle class professions, etc. Further analysis showed that the industry by itself is
not biased in favour of employees coming from pre-existing urban middle class
backgrounds. However, the nature of work in the industry demands the
possession of cultural capital such as fluency in the English language and a
university education. Historically, in India, these forms of capital have been
possessed primarily by the pre-existing middle class, concentrated in the large
cities. Since cultural capital takes time to accumulate, these skills continue to be
possessed largely by established middle-class families, making employment
opportunities in the IT-eS industry accessible to the pre-existing urban middle
class alone. The demand for cultural capital and the pre-existing inequalities in
them have thus led to the reproduction of pre-existing class inequalities in India,
especially in the form of unequal possession of cultural capital. Thus, the
contribution of the IT-eS industry in enabling employees from non-middle class
families to access its employment opportunities and become part of the new
middle class is very limited. Also, the role of the industry in facilitating a larger
structural transformation is quite restricted. These findings are in contrast to the
claims made by representatives of the offshore-services industry about the social
inclusiveness of the sector and its potential to promote equitable development (see
for example, Bagchi, 2006; NASSCOM, 2016a; Rastogi & Pradhan, 2011).
Chapter 8
181
8.1.5 Influence of the IT-eS industry on the income levels, consumption
practices and lifestyles of its employees
Even though the IT-eS industry contributes little to new middle class formation
in the sense of enabling non-middle class members to access employment
opportunities in the industry, the remuneration in the industry, together with
exposure to global cultures has left a profound influence on the lifestyles and
consumption practices of the employees. Chapter 7 found that IT-eS employees of
Mumbai figure among the top of the national income distribution, occupying the
upper-middle or affluent positions in the class structure. Besides the high level of
income that these employees are paid at a relatively young age, the work
ambience and culture within the industry play a vital role in driving new forms of
lifestyles adopted by the employees, thus transforming their cultural capital.
Dress style, eating habits and modes of conveyance are the main areas wherein
IT-eS employees witness considerable changes after employment in the industry.
Changes are also noticed in the embodied capital of employees, that is, in areas
such as their level of confidence, social behaviour and professional ethics.
These findings suggest that the IT-eS industry not only demands the possession
of different forms of cultural capital at the entry level, but its work environment
further transforms the economic and cultural capitals of the employees in
conspicuous ways. In effect, instead of promoting socially inclusive development,
the industry widens pre-existing class inequalities in the society, on the basis of
both economic and cultural capitals. Nevertheless, at a qualitative level, the
impact of the IT-eS industry is so great that these employees have become global
representatives of the Indian new middle class. Also, in India, these workers are
seen as global citizens because of their exposure to global culture, their adoption
of global consumption practices and their pioneering of modern, western lifestyles
in liberalised India.
Conclusion
182
8.1.6 IT-eS industry and new middle class formation in India- The bigger
picture
At a larger level, this research shows that the new middle class in India is a
heterogeneous group. On the one hand, there exist a large number of lower-
middle class households who have recently entered the middle class, are
structurally different from the earlier middle class, but are not directly associated
with the offshore-service industry. On the other hand, a relatively smaller section
of IT-eS workers, coming from pre-existing middle class families, have adopted
new forms of consumption practices and lifestyles after entering the industry.
Both these segments depict characteristics which classify them as the new middle
class. The lower-end of the class has recently acquired a level of economic capital
that categorises them in the new middle class. They however lack the cultural
capital of the established middle class, especially in relation to education. The
upper-segment, in contrast, has acquired even higher levels of economic capital as
well as new forms of cultural capital than it did in the pre-liberalised period. In
fact, the level of economic capital of the latter makes it appropriate to classify
them as the emerging affluent or the new rich.
These results indicate that amongst all the existing conceptualisations of the new
middle class, the Indian new middle class can best be described by the definition
of Wietzke & Sumner (2014). It is a class that includes both recent entrants to the
middle class from the erstwhile poor segment of the population as well as the new
rich, who can be called middle class by global standards (that is, those who
consume around or above $10 per day).
The contribution of the IT-eS industry to this particular new middle class
formation extends beyond its direct influence. With the creation of a new class of
consumers, the industry has indirectly led to the rise of a number of other
industries that supply to these consumers. Shopping malls have been built around
Chapter 8

183
the areas of offshore-services firms, new condominium complexes have arisen and
local tourism has received a boost. The infrastructure demands from the industry
in the form of real estate and roads have boosted the construction industry, the
largest driver of new middle class formation. Moreover, even though the number
of offshore-services industry employees might not be very large in proportion to
India’s population, their consumption is highly visible and has led to a new image
of the cities that this industry has thrived in (for example, Bengaluru, Chennai,
Delhi-NCR, Hyderabad, Mumbai and Pune). Because of their new and
international consumption practices, they have globally become symbolic of the
burgeoning Indian middle class and attracted immense attention from academics,
developmental organisations and multi-national companies alike.
8.2 Implications of the research findings
The empirical findings of this study have important theoretical implications, at
least in three areas. First, given the conventional positive relationship between
large middle classes and societal development (Banerjee & Duflo, 2008; Birdsall,
2016; Easterly, 2001), the evidence for the emergence of a remarkably large ‘new’
middle class in India opens questions about its implications for development vis-á-
vis the established middle class. Second, the relevance of the offshore-services
industry in countries like India extends beyond its contribution to a new middle
class formation to a wider services-led growth path in countries that have
apparently skipped the industrialisation phase and relied on the services sector for
economic growth. But the rather meagre contribution of the offshore-services
industry to employment generation and new middle class formation also points
out that countries with large domestic markets will benefit significantly by
focusing on their own domestic industries, especially at times when global
economic growth is not very promising. Third, the application of Bourdieu’s
concept of forms of capital to study the new middle class in the Indian social
context has important implications for adaptability of rather general class theories
Conclusion
184
in specific social contexts. The following sub-sections elaborate on these
implications.
8.2.1 New middle class formation and development
Several extant studies have demonstrated that middle classes are important
because of their positive association with higher socio-economic growth and
development via greater consumption demand, investment in human capital
formation as well as active political participation and greater support for
democracy (see for example, Birdsall, 2016; Doepke & Zilibotti, 2008; Easterly,
2001; K.M. Murphy et al., 1989). Results from this thesis show that the
emergence of the new middle class in India has indeed led to higher demand for
durable goods, health care, education as well as consumer services. But the
majority of the new entrants to the middle class in India has low levels of
education and is engaged in unskilled jobs, quite unlike the established middle
class of India. However, the new middle class invests a significant level of its
expenditure in human capital accumulation such as education and health. Hence,
what makes the contemporary Indian middle class important for development is
its investment in the human capital formation of its offspring, which in the future
will ensure a large educated workforce. The emergence of the qualitatively new
middle class in India thus demonstrates that the country is still in the phase of an
economic take-off, where the majority of the population has low levels of human
capital, but holds the promise of creating the next generation of educated labour
force, which can potentially take the country to the next stage of development.
Although this thesis did not explicitly study the political engagement of the new
middle class, our results indicate that the rise of a large middle class may not
necessarily imply more political participation and better governance, unlike what
is suggested by Birdsall (2016), Easterly (2001) and others. The low level of
education among the majority of the new middle class and its ethnic and social
Chapter 8

185
diversity imply that the new middle class may not come together as one political
force to pressurise the government to implement better public policies. The
developmental implications of the rise of the new middle class on governance in
India are perhaps different from what is generally argued in existing studies. This
dimension of the new middle class demands further research, as is elaborated in
Section 8.4.7.
8.2.2 Services-driven growth and development
Many developing countries seem to have skipped the industrialisation phase of
economic development, relying early-on on services as the main driver of
development. Trade in services has become a key driver of economic growth for
many of these countries. Whether this services-driven growth is sustainable in
the absence of a strong manufacturing base, is debatable (Ghani & O’Connell,
2014; Kloosterman et al., 2016). The findings from this thesis contribute to such
debates on the development implications of services-driven growth in developing
economies. As this thesis showed, trade in services has created many attractive
employment opportunities in the main urban areas in India and further boosted
consumer demand for a variety of goods and services. However, as Chapter 6
showed, at least the direct employment opportunities in the industry are biased
towards the existing urban middle class. As a result, the sector reproduces and
widens pre-existing class and income inequalities, rather than reducing them. The
findings from this thesis indicate that in general, advancement in technology,
globalisation and services-driven growth, although contribute towards higher
economic growth, also reproduce and enhance pre-existing inequalities in the
society (see also Krishna & Pieterse, 2008; Lambregts et al., 2016; Raychaudhuri
& De, 2012).
Indirectly, however, the offshore services sector has created a number of jobs in
the informal sector, although they are often precarious in nature (Kumar, 2016).
Conclusion

186
The data presented in this thesis did not give any evidence on the precise number
of indirect jobs created by the industry. But given the relatively small size of
direct jobs created by the offshore-services sector in India, it is plausible that the
growth witnessed in the informal sector such as construction activities is mostly
driven by the domestic services industry, rather than by offshore services. In fact,
India’s huge domestic market has enabled the country to be resilient to external
economic shocks and thus record an impressive growth in consumer demand
despite the global economic crisis. The precise contribution of the domestic
service sector and offshore services in employment generation and in new middle
class formation needs to be studied more carefully.
In general, however, we can claim that the services sector in India has created
many new middle class jobs, both at the lower and at the higher-end of the class
spectrum. However, unlike traditional middle class jobs, which are known for
their stability (see Banerjee & Duflo, 2008), most of these new middle class jobs
are not necessarily long term, stable jobs. For example, many of the offshore-
services and other knowledge-based service jobs may be lost to automation or
international relocation (Baldwin, 2016; Brynjolfsson & McAfee, 2014; The
Economist, 2016), whereas lower-end middle class jobs, such as those in
construction, are dependent on these formal-sector jobs. Unlike traditional middle
class jobs, new middle class jobs, based on globalisation and modern services-
driven growth are thus more vulnerable to rapid advancements in technology,
global economic changes and other factors. Complementing services with a strong
domestic manufacturing sector will help to a certain extent in creating more
number of jobs in the economy, although jobs in the manufacturing sector too
may similarly be threatened by automation and technological advancements.
Chapter 8

187
8.2.3 Class theories
This research showed that employment opportunities introduced or boosted by
the offshore-services industry, directly or indirectly, have created new class
segments within the middle class. Offshore-service workers typically come from
the established middle class, but are part of a new social class, characterised by
their accumulation of high levels of economic capital and new forms of cultural
capital. In contrast, many construction workers have recently entered the middle
class, characterised by modest level of economic capital and a rather low level of
cultural capital. This research indicates that modern studies on class ought to
recognise such increasing number of class divisions within traditional class
groups. The recent work by Savage et al. (2013), which proposes a new seven
class model for the British society, is an important contribution towards the
recognition of the emergence of such new social classes. An analogous study on
the emergence of new social classes in developing countries like India will help
better understand the impact of globalisation on the society as a whole. Such a
study would in general address how existing social divisions (based on caste,
gender, religion or a combination of these) are reproduced in the emerging social
stratification; and the mechanisms via different forms of capital, that reproduce or
alter these established social divisions.
Further, this research showed that class theories ought to accommodate for
specific social, political and other contexts within which classes emerge and
flourish in different societies. Even though Bourdieu’s conceptualisation of the
forms of capital is an excellent framework to study different dimensions along
which societies are segregated, it does not engage with unique social contexts-
such as caste and religion in the case of India, or race in the case of some western
countries- while talking about classes. As this thesis showed, social setting feeds
into the formation of classes and class identities are often inter-related with other
existing social divisions along the lines of caste, religion, gender or race. The lack
Conclusion
188
of engagement with existing social systems that interplay with class is a
drawback of Bourdieu’s forms of capital, which needs to be addressed in
forthcoming class theories. Here, it is worth mentioning a recent class typology
proposed by Kelly (2007, 2012), which borrows ideas of class structure from
different schools of thought and builds further on them. Kelly’s class framework is
based on four inter-related dimensions of position, performance, process and
politics. Class as position is analogous to economic capital, which refers to the
income or labour market position of an individual in the society. Class as
performance is akin to cultural capital, dealing with consumption practices and
embodiments of an individual. Class as process and politics are dimensions that
have not been fully dealt with by Bourdieu. The former refers to the inter-
relationship between different classes as well as the interactions of class with
other social dimensions such as race, gender and caste, whereas the latter deals
with political mobilisations that articulate the experiences of class. Kelly’s class
typology thus attempts to engage with social contexts that intersect with class,
but this typology is yet to be fully developed. Further work towards building such
class theories will prove useful in analysing modern societies from the lens of
class, especially in understanding how other social processes intersect with class
to augment or reproduce existing societal distinctions.
This thesis has provided some initial empirical groundwork for such an analysis.
It has shown that the economic position of many individuals in India has
improved in the recent years, which categorises them in the middle class. The
labour market position of these individuals is however quite different from that of
the pre-existing middle class, making these individuals a part of the ‘new’ middle
class. Class as performance is yet another indicator of newness in the middle class.
This thesis showed that at least some segments of the existing middle class
(offshore-service workers, for example) have taken to new forms of lifestyles and
consumption and that their classed performance has become their distinguishing
Chapter 8

189
class characteristic. Detailed analysis of classed performance of other groups
within the new middle class, especially of those at the lower-end, was beyond the
scope of this thesis. The entry of many new members at the lower-middle class
level demands deeper analysis of classed performance of this section of the new
middle class. Although this thesis did not study the inter-relationships between
different classes (which is an important subject for further research), an analysis of
the social context within which the middle class operates sheds some light on
class as process. This research showed that existing social divisions along caste
and religious lines continue to intersect with different dimensions of class and are
producing new forms of distinctions between the different social groups on the
basis of their labour market position and class performance. Analysis of class as
politics was beyond the scope of this thesis, but remains an important area for
further research, as discussed in Section 8.4. Thus, overall, this thesis has
provided important empirical evidences that can be fed into bringing out class
theories that can incorporate more number of dimensions than that considered by
Bourdieu, keeping in mind the changing social dynamics of societies in the age of
service-sector globalisation and technological advancements.
8.3 Policy recommendations
Besides the theoretical implications of this research, there are a few policy lessons
too that emerge from the findings of this study. Here, we lay down the
implications of this research for public policy as well as for private firms
interested in tapping India’s large consumer market. Appropriate changes in
public policy can go a long way in ensuring better developmental outcomes and
higher economic growth. The large new middle class of India has been of interest
to many multi-nationals and domestic manufacturers of consumer goods.
Implications of this research for private firms can help them better strategise their
decisions and realise larger profits, along with benefitting the large pool of
consumers.
Conclusion

190
8.3.1 Recommendations for public policy
If employment opportunities from modern knowledge-based services are to
benefit larger sections of the society, India needs to implement important reforms
in its educational sector. As discussed in Chapter 6, the current educational
system in India is flawed, where quality primary education in the English
language is accessible to only the privileged few, who are able to move up to the
higher education level. Higher education, in contrast is subsidised, but it
obviously benefits only those who have had access to quality primary education.
The few English medium schools catering to the poor and low-income groups,
whether private or state-run, are of poor quality, plagued by teacher absenteeism,
poor infrastructure and such other problems. Students enrolled in these schools
fail to pick up even essential reading or mathematical skills, eventually dropping
out of the educational system (see Dreze & Sen, 2013). It is essential that the
government invests heavily in education as well as in vocational training such as
computer literacy so that a larger section of the population is trained to access the
new jobs available in the knowledge-services industry.
Besides implementing reforms in the educational system, the state needs to invest
heavily in social and physical infrastructure. With expansion in the size of the
middle class, there is an increase in the demand for education, health, transport
and other public services. Furthermore, as the middle class invests in human
capital accumulation and produces a large pool of educated workforce in the near
future, there will be further demand for skilled jobs. While offshore services
present one such opportunity, quality jobs also need to be created in other
education-intensive sectors. Failure to do so will not only result in under-
employment or unemployment of the educated youth, but may also have negative
social consequences such as social unrest.
Chapter 8
191
8.3.2 Recommendations for the private sector
The rise of a consumerist new middle class in India is vital for multi-nationals and
other private firms, especially at a time when consumption demand from the
western middle class is bleak. The expansion in the size of the new middle class
showed that India is indeed a promising market for the private sector. Generally,
these firms target the urban upper-middle and affluent classes to sell their
consumer products. Even though these classes constitute only a small proportion
of the country’s population, given India’s total population size, in absolute
numbers, these classes are an attractive consumer market for luxurious goods.
However, this thesis showed that the largest consumer market lies in the lower-
middle class category, which includes both urban and rural markets, of which the
latter remains under-served. These classes of consumers demand more of the
small consumer durable goods rather than luxurious products. India thus has a
huge market for producers of not only luxurious goods but also of existing
products that with simpler modifications will attract consumers with less
spending power. The introduction of the small budget car, Tata Nano, can be seen
as the first step in this direction, and this study indicated that there is a huge
market for such products in India. The most important lesson for private firms
from this research thus lies in realising the size of different markets, their location
and their diverse consumption demand; and accordingly targeting them.
8.4 Avenues for further research
The findings from this research have opened up further research questions, which
could not be fully dealt with in this thesis. This section discusses a few such areas
where further research is recommended.
8.4.1 Sensitivity analysis of different definitions
As discussed early in this thesis, there exist a variety of definitions of the middle
class. This study adopted a well-known consumption-based definition of the
middle class and its results are naturally an outcome of the definition applied. A
Conclusion

192
sensitivity analysis of different types of middle class definitions may hence be
helpful to understand how the results change with changes in the definition of the
middle class. Chapter 4 showed that although the population size of the middle
class changes considerably based on the definition used, the trend in middle class
expansion remains the same irrespective of the type of income/consumption-
based definition used. However, there are yet other ways to define the middle
class besides such absolute income/consumption definitions. For example, Ricci
(2016) applies a middle class definition based on the concept of polarisation,
wherein different classes are demarcated endogenously, based on the distribution
of income. Self-perception is another way of defining classes, which often differs
from more objective income-based definitions. An agenda for further research on
the new middle class would hence be to understand the formation of the class by
making use of such different types of definitions. Such a sensitivity analysis will
help in identifying whether the overall story of new middle class formation in
India remains robust, irrespective of the definition used.
8.4.2 Panel data analysis
Although it was established in this research that in general many households have
moved out of poverty and entered the middle class, we could not make any claims
about how specific households have moved along the consumption distribution
curve over the period under analysis. This is because the NSS surveys are not
panel data-sets. It would be interesting, for example, to analyse which types of
households have been able to move out of poverty to the lower-middle class, or
which ones have moved up from the middle to the affluent class. The analysis
conducted in this study shows that on an average the largest movement from
poverty into the lower-middle class was among construction workers. A panel
data analysis would help us better understand if these workers had given up their
previous occupations (and what type of occupations) to enter the construction
industry and what really drove middle class creation in the construction sector. In
Chapter 8

193
case of the offshore-services industry, such a data-set would throw further light
on which types of households are able to access the industry and how their
consumption distribution changes after employment in the industry. The India
Human Development Survey provides such panel data for India, wherein about 80
per cent of the sample households surveyed in the first period (2004-05) were re-
visited during the next period (2011-12). This data however became available
much after the analysis for this research began. A study on the emergence of the
new middle class in India using such panel data-sets will be an important
contribution in the future to better understand the underlying dynamics of new
middle class formation in India.
8.4.3 A disaggregated analysis of the new middle class
This thesis provided a rather aggregated analysis of new middle class formation
in India. Our finding that the new middle class is not essentially an urban
phenomenon indicates that the geographical distribution of the new middle class
needs more attention. Factors that led a few states to perform better than the
others also merit closer investigation. Analysis of employment distribution of the
middle class showed that many unskilled workers have entered the middle class
between the years 2004-05 and 2011-12. This important finding of this research
also demands closer examination at a more disaggregated level. The employment
analysis presented here pertained to the primary occupation of the household,
rather than employment of each individual in the labour force. Study of the latter
will better reflect the employment distribution of different classes across the
country. Moreover, the analysis also did not account for multiple occupations that
may be held by an individual. For example, a large number of farmers in India
take up supplementary occupations in non-agricultural seasons. Many of them
even migrate to nearby cities to take up employment as construction workers and
return to their fields in the harvest season. Disaggregated analyses of
employment distributions across classes will help in better interpreting the more
Conclusion

194
general findings of this thesis. Particularly, it will reflect more on the role of the
construction sector in driving new middle class formation as well as the sectors
that have indirectly contributed towards more construction activity and thus in
new middle class formation. The Employment-Unemployment Surveys of the
NSS is one such data-set for disaggregated analyses of employment distribution of
different classes across India. This may be accompanied with qualitative,
ethnographic research that can map and trace the trajectories of members of the
new middle class.
8.4.4 Impact of offshore services on smaller cities and rural areas
This study on offshore services focused on the city of Mumbai. Although some of
its findings can be applied to other large Indian cities as well where the sector has
flourished, the city of Mumbai has its own peculiarities, which demands a separate
analysis of other cities that have benefitted from offshore services. First, the
relatively higher standard of living in Mumbai as compared to other cities
probably makes it hard for potential employees to migrate to the city for
employment opportunities in the IT-eS industry, which, as seen in the previous
chapter are perceived as a short-term phenomenon. Analyses of other cities of
India that have benefitted from the industry will perhaps show a more
geographically diverse group of employees than found in this study. Second, the
higher standards of living together with the relatively higher remuneration that
employees in Mumbai are paid may impact their specific consumption patterns
differently from that of IT-eS workers based in other Indian cities.
Albeit gradually, IT and IT-eS firms are also expanding in smaller cities of India,
reflecting at the possibility that people from smaller cities might have easier
access to these jobs and become part of the new middle class. Research on the
impact of offshore services in smaller cities in the Philippines has been carried out
(see for example, Beerepoot & Vogelzang, 2016; Kleibert, 2014), but there hardly
exists any such research yet in the case of India. Further research on offshore
Chapter 8

195
services and new middle class formation in India should hence focus particularly
on cases of smaller cities that have managed to attract the industry. In fact, the
extent of impact of the higher spending power of IT-eS workers will be more
visible and bigger in these cities.
8.4.5 Indirect impact of the offshore-service industry on new middle
class formation
Besides the offshore services’ impact on smaller cities, this thesis indicated, but
could not fully explore, the indirect impact of the sector on new middle class
formation in India. For instance, the construction sector appears to have
benefitted the most from globalisation and liberalisation, albeit in an indirect way.
The industry body of offshore services in India generally claims that there are
three indirect jobs created for every one direct job in the industry (NASSCOM,
2017). There is however no empirical evidence provided in support of such claims.
Research by Kumar (2016) deals with the indirect job opportunities created by the
industry, but it is limited to jobs created within the industry such as that of
security guards, cab drivers and housekeeping staff. As this thesis showed, the
indirect jobs created go beyond the limits of the industry to include construction
workers, and even street vendors, domestic helps, etc. Moreover, these indirectly
benefitted jobs are the largest segments to constitute the burgeoning new middle
class. It is hence highly essential to understand the indirect impact of the
offshore-service industry on employment creation and the formation of a new
middle class. Such an analysis will also contribute towards understanding the
precise role of offshore services vis-á-vis the domestic service industries of India
in indirectly contributing towards economic development.
8.4.6 Gender dynamics in class analysis
As class and caste interact with one another, so do class and gender (Wright,
1997). Particularly in the case of offshore services, which employ a significant
proportion of women workers, it would be interesting to study how gender
Conclusion
196
dynamics are undergoing a change with the onset of service sector globalisation.
During the fieldwork, this researcher came across a few interesting, but diverse
opinions of women working in the industry. One former female employee
expressed the financial independence that the sector provided her at an early age,
which enabled her to support her family. Another young woman respondent was
keen on quitting the sector and finding a government job before she got married,
as according to her, women working at night are not highly preferred in the
Indian marriage market. Given the limited time period for a PhD research, such
gender dynamics could not be explored in this thesis. But as these experiences
show that it would indeed be interesting to further explore how the emergence of
the offshore services sector has changed or strengthened existing gender
inequalities and stereotypes in the society and how such gender dynamics play a
role in new middle class formation.
8.4.7 Social and political activism of the new middle class
As mentioned earlier, an important dimension of the middle class that this thesis
could not explore is the political and social engagement of the class. The CES
surveys of the NSS do not cover any questions on political engagement of the
households. Questions on political and social activism of IT-eS workers did form a
part of the initial survey questionnaire and the interviews. However, not enough
insights could be gathered on this subject with the limited number of questions on
this subject. With the realisation that this subject demanded an independent
research, eventually, these questions were not asked during the field-study. Given
the heterogeneous nature of the new middle class in India, it would indeed be
interesting to study how the different social segments within this class engage in
political activism and contribute to societal development. Recent international
political developments in many countries such as the Philippines and Turkey
show that the middle class does not necessarily support more democracy, but
sometimes rather favours authoritarian leaders. With increasing relevance of civil
Chapter 8

197
society participation in the contemporary times of global environmental
challenges (Guarín & Knorringa, 2014) and changing political leaderships in
many countries, research on this subject will be immensely significant.
8.5 Final remarks
The emergence of offshore services is indeed leaving a significant imprint on the
socio-economic fabric of India. While urban India has most benefitted from this
sector, as this thesis has showed, the sector appears to have indirectly impacted, at
least to some extent, even small towns and the countryside by creating a demand
for construction labourers and other unskilled workers. The dynamic nature of
globalisation and this sector demand the necessity for prolonged research on the
subject of inclusiveness of India’s services-led economic growth and its impact on
new middle class formation. This thesis presented findings of a new middle class
formation in India until the year 2011-12. In the more recent period, however,
India’s economic growth has started to moderate and some preliminary results on
labour market trends indicate that the slow growth has adversely affected
employment creation in non-farm sectors including IT and IT-eS (Varma, 2017).
At the same time, changes in the international political leadership, especially in
the US, are presenting new challenges for the service-offshore industry in India
(Purnell, 2017). Also, India has lost its global leadership in some segments of the
IT-eS sector, especially voice-based processes, to the Philippines (The Economist,
2012; The Guardian, 2012). As a counter effect, India is moving up the value chain
and offering higher-end services. These processes could further skew the class
composition of employees in the industry towards the even higher skilled. But
simultaneously, smaller cities and towns in the country are also being explored as
new avenues for the provision of offshore services. Research on these unexplored
smaller cities as well as on the expansion of the sector in the near future is called
for to monitor how services-led growth and globalisation impact development in
emerging economies.
Conclusion

198

199
References
Ablett, J., Baijal, A., Beinhocker, E., & Bose, A. (2007). The “Bird of Gold”: The Rise
of India’s Consumer Market. McKinsey Global Institute, San Francisco.
ADB. (2010). Special Chapter: The Rise of Asia’s Middle Class in Key Indicators for
Asia and the Pacific. Manila. Retrieved from
http://www.adb.org/sites/default/files/publication/27726/ki2010-special-
chapter.pdf
AfDB. (2011). The Middle of the Pyramid: Dynamics of the Middle Class in Africa.
Agarwal, S., Khaitan, S., Shrivastava, S., & Banks, M. (2005). Destination India:
Offshore Outsourcing and its Implications. Computer and Telecommunications
Law Review (CTLR)-Oxford, 11(8), 246–259.
Ahluwalia, M. S. (2000). Economic Performance of States in Post-Reforms Period.
Economic and Political Weekly, 35(19), 1637–1648.
Bagchi, S. (2006, January 13). Bunty Aur Babli. The Times of India. Bangalore.
Baldwin, R. (2006). Globalisation: the great unbundling(s). Economic Council of
Finland, 20(September), 51. Retrieved from
http://appli8.hec.fr/map/files/globalisationthegreatunbundling(s).pdf
Baldwin, R. (2016). The Great Convergence: Information Technology and the New
Globalization. Cambridge MA and London: Harvard University Press.
Banerjee, A. V, & Duflo, E. (2008). What is Middle Class about the Middle
Classes Around the World? The Journal of Economic Perspectives: A Journal of
the American Economic Association, 22(2), 3.
Bardhan, P. (1989). The Third Dominant Class. Economic and Political Weekly,
24(3), 155–156.
Basole, A., & Basu, D. (2015). Non-Food Expenditures and Consumption
Inequality in India. Economic and Political Weekly, 50(36), 43–53.

200
Beerepoot, N., & Hendriks, M. (2013). Employability of Offshore Service Sector
Workers in the Philippines: Opportunities for Upward Labour Mobility or
Dead-End Jobs? Work, Employment & Society, 27(5), 823–841.
http://doi.org/10.1177/0950017012469065
Beerepoot, N., & Vogelzang. (2016). Service Outsourcing to Smaller Cities in the
Philippines:The Formation of an Emerging Local Middle Class. In B.
Lambregts, N. Beerepoot, & R. Kloosterman (Eds.), The Local Impact of
Globalization in South and Southeast Asia: Offshore Business Processes in Service
Industries (pp. 195–207). London and New York: Routledge.
Bergeron, D., Duke, B., Erickson, J., Gordon, J., Hamm, K., Madowitz, M., &
Miller, K. (2014). The Middle-Class Squeeze: A Picture of Stagnant Incomes,
Rising Costs, and What We Can Do to Strengthen America’s Middle Class. Center
for American Progress. Washington DC. Retrieved from
https://www.americanprogress.org/issues/economy/reports/2014/09/24/
96903/the-middle-class-squeeze/
Beteille, A. (2007). Classes and Communities. Economic & Political Weekly, 945–
952.
Birdsall, N. (2010). The (Indispensable) Middle Class in Developing Countries; or, The
Rich and the Rest, Not the Poor and the Rest. Equity and Growth in a Globalizing
World. Washington DC.
Birdsall, N. (2012). A Note on the Middle Class in Latin America. CGD Working
Paper 303. Washington, DC.
Birdsall, N. (2016). Middle-Class Heroes The Best Guarantee of Good
Governance. Foreign Affairs, 1–7. Retrieved from
https://www.foreignaffairs.com/print/1116490
Birdsall, N., Graham, C., & Pettinato, S. (2000). Stuck In The Tunnel: Is
Globalization Muddling The Middle Class? (Center on Social and Economic
Dynamics Working Paper No. 14).
Blinder, A. S. (2006). Preparing America’s Workforce: Are we Looking in the Rear-
References

201
View Mirror? (CEPS Working Paper No. 135). Center for Economic Policy
Studies.
Bourdieu, P. (1986). The Forms of Capital. In J. Richardson (Ed.), Handbook of
Theory and Research for the Sociology of Education (pp. 241–58). Westport, CT:
Greenwood.
Brosius, C. (2010). India’s Middle Class: New Forms of Urban Leisure, Consumption
and Prosperity. New Delhi: Routledge.
Bryman, A. (2003). Triangulation. Encyclopedia of Social Science Research Methods,
(8), 1–5. http://doi.org/http://dx.doi.org/10.4135/9781412950589
Bryman, A. (2007). Integrating Quantitative and Qualitative Research: How is it
Done? Qualitative Research, 6(1), 97–113.
http://doi.org/10.1177/1468794106058877
Brynjolfsson, E., & McAfee, A. (2014). The Second Machine Age: Work, Progress and
Prosperity in a Time of Brilliant Technologies. New York: WW Norton &
Company.
Cavusgil, S. T., & Buckley, P. J. (2016). Interdisciplinary Perspectives on the
Middle Class Phenomenon in Emerging Markets. International Business
Review, 25(3), 621–623. http://doi.org/10.1016/j.ibusrev.2016.03.010
Chhapia, H. (2014, January 26). States Realize English is What People Want. The
Times of India. Mumbai. Retrieved from
http://timesofindia.indiatimes.com/home/education/news/States-realize-
English-is-what-people-want/articleshow/29374133.cms
Chun, N., Hasan, R., & Ulubasoglu, M. (2011). The Role of the Middle Class in
Economic Development: What Do Cross-Country Data Show? (ADB Economics
Working Paper Series No. 245).
D’Costa, A. P. (2011). Geography, Uneven Development and Distributive Justice:
The Political Economy of IT Growth in India. Cambridge Journal of Regions,
Economy and Society, 4(2), 237–251. http://doi.org/10.1093/cjres/rsr003
D’Monte, D. (2002). Ripping the Fabric: The Decline of Mumbai and its Mills. India:
References

202
Oxford University Press.
Deaton, A. (1997). The Analysis of Household Surveys: A Microeconometric Approach to
Development Policy. Washington DC: The World Bank.
http://doi.org/doi:10.1596/0-8018-5254-4
Deaton, A., & Dreze, J. (2002). Poverty and Inequality in India: A Re-
Examination. Economic and Political Weekly, 3729–3748.
http://doi.org/10.1080/13547860008540785
Desai, S., Dubey, A., Joshi, B. L., Sen, M., Shariff, A., & Vanneman, R. (2008).
India Human Development Survey, 2004-05. University of Maryland, College
Park, MD.
Deshpande, A., & Bhattacharya, P. (2013, November 19). Labour market: The
rural wage boom. Mint. Mumbai. Retrieved from
http://www.livemint.com/Specials/H6IUUYlYHJLPyViYh2ZtgJ/Labour-
market-The-rural-wage-boom.html
Dobbin, C. (1972). Urban leadership in Western India: Politics and Communities in
Bombay City, 1840-85. New York: Oxford University Press.
Doepke, M., & Zilibotti, F. (2008). Occupational Choice and the Spirit of
Capitalism. Quarterly Journal of Economics, 123(2), 747–793.
Dossani, R., & Kenney, M. (2007). The Next Wave of Globalization: Relocating
Service Provision to India. World Development, 35(5), 772–791.
http://doi.org/10.1016/j.worlddev.2006.09.014
Dossani, R., & Kenney, M. (2009). Service Provision for the Global Economy: The
Evolving Indian Experience. Review of Policy Research, 26(1–2), 77–104.
Dreze, J., & Sen, A. (2013). An Uncertain Glory: India and its Contradictions.
Princeton, NJ: Princeton University Press.
Easterly, W. (2001). The Middle Class Consensus and Economic Development.
Journal of Economic Growth, 6(4), 317–335.
Eichengreen, B., & Gupta, P. (2011). The Service Sector as India’s Road to Economic
Growth? National Bureau of Economic Research (Vol. No. w16757).
References

203
Washington DC.
ETIG. (2004). BPO Industry in India: Business Process Outsourcing Revealed.
Economic Times Intelligence Group: India.
Farrell, D., Gersch, U. A., & Stephenson, E. (2006). The Value of China’s
Emerging Middle Class. The McKinsey Quarterly Special Edition: Serving the
New Chinese Consumer, 2, 60–69. Retrieved from
http://www.andrewleunginternationalconsultants.com/files/mckinsey-
quarterly---the-value-of-chinas-emerging-middle-class.pdf
Fernandes, L. (2000). Restructuring the New Middle Class in Liberalizing India.
Comparative Studies of South Asia, Africa and the Middle East, 20(1&2), 88–104.
Fernandes, L. (2006). India’s New Middle Class: Democratic Politics in an Era of
Economic Reform. Minneapolis: University of Minnesota Press.
Friedman, T. (2006). The World is Flat: The Globalized World in the Twenty-First
Century. London: Penguin.
Fuller, C. J., & Narasimhan, H. (2007). Information Technology Professionals and
the New-Rich Middle Class in Chennai (Madras). Modern Asian Studies,
41(1), 121–150. http://doi.org/10.1017/S0026749X05002325
Fuller, C. J., & Narasimhan, H. (2008). From Landlords to Software Engineers:
Migration and Urbanization among Tamil Brahmans. Comparative Studies in
Society and History, 50(1), 170–196.
http://doi.org/10.1017/S0010417508000091
Ghani, E., & O’Connell, S. D. (2014). Can Service Be a Growth Escalator in Low
Income Countries (Policy Research Working Paper, World Bank Group No.
6971). Retrieved from http://www-
wds.worldbank.org/servlet/WDSContentServer/WDSP/IB/2014/07/22/
000158349_20140722093642/Rendered/PDF/WPS6971.pdf
Goldthorpe, J. (1980). Social Mobility and Class Structure in Modern Britain. Oxford:
Clarendon Press.
Grossman, G., & Rossi-Hansberg, E. (2006). The Rise of Offshoring: It’s Not
References

204
Wine for Cloth Anymore. The New Economic Geography: Effects and Policy
Implications, 59–102.
Guarín, A., & Knorringa, P. (2014). New Middle-Class Consumers in Rising
Powers: Responsible Consumption and Private Standards. Oxford
Development Studies, 42(2), 151–171.
http://doi.org/10.1080/13600818.2013.864757
Hatekar, N., Kumar, A., & Mathur, R. (2009). The Making of the Middle Class in
Western India: Age at Marriage for Brahmin Women (1900-50). Economic
And Political Weekly, 44(21), 40–49.
Hatekar, N., & More, K. (2016). The Rise of the New Middle Class and the Role of
Offshoring of Services. In B. Lambregts, N. Beerepoot, & R. Kloosterman
(Eds.), The Local Impact of Globalization in South and Souteast Asia: Offshore
Business Processes in Service Industries (pp. 169–182). London and New York:
Routledge.
Haynes, D., McGowan, A., Roy, T., & Yanagisawa, H. (2010). Towards a History of
Consumption in South Asia. India: Oxford University Press.
Hnatkovska, V., Lahiri, A., & Paul, S. B. (2013). Breaking the Caste Barrier:
Intergenerational Mobility in India. The Journal of Human Resources, 48(2),
435–473.
Jaffrelot, C., & van der Veer, P. (2008). Introduction. In C. Jaffrelot & P. van der
Veer (Eds.), Patterns of Middle Class Consumption in India and China (pp. 11–
34). India: Sage Publications.
John, S. (2007, April 20). Wages of Construction Workers up 50 per cent. The
Times of India. Bangalore. Retrieved from
http://timesofindia.indiatimes.com/business/india-business/Wages-of-
construction-workers-up-50-per-cent/articleshow/1926095.cms
Joseph, M. (2003). Performance of the Southern States: A Comparative Study.
Economic and Political Weekly, 3915–3930.
Joshi, S. (2010a). Introduction. In S. Joshi (Ed.), The Middle Class in Colonial India
References

205
(pp. xv–lvi). New Delhi: Oxford University Press.
Joshi, S. (2010b). The Middle Class in Colonial India. New Delhi: Oxford University
Press.
Karnik, A., & Lalvani, M. (2012). Growth Performance of Indian States. Empirical
Economics, 42(1), 235–259. http://doi.org/10.1007/s00181-010-0433-0
Kelly, P. (2007). Filipino Migration, Transnationalism and Class Identity (Asia
Research Institute No. 30). Singapore. Retrieved from
http://inetapps.nus.edu.sg/ari/docs/wps/wps07_090.pdf
Kelly, P. (2012). Class, Migration, and Identity in a Philippine Village. In C. Pluss
& K. . Chan (Eds.), Living Intersections: Transnational Migrant Identifications in
Asia (pp. 53–72). New York: Springer. http://doi.org/10.1007/978-94-007-
2966-7
Kharas, H. (2010). The Emerging Middle Class in Developing Countries. Global
Development Outlook.
Kidambi, P. (2010). Consumption, Domestic Economy, and the Idea of the
“Middle Class” in Late Colonial Bombay. In S. Joshi (Ed.), The Middle Class
in Colonial India (pp. 132–153). New Delhi: Oxford University Press.
Kleibert, J. M. (2014). Strategic Coupling in “next wave cities”: Local Institutional
Actors and the Offshore Service Sector in the Philippines. Singapore Journal
of Tropical Geography, 35(2), 245–260. http://doi.org/10.1111/sjtg.12044
Kleibert, J. M. (2015). Expanding Global Production Networks: The Emergence,
Evolution and the Developmental Impact of the Offshore Service Sector in the
Philippines. PhD Thesis, Universiteit van Amsterdam.
Kloosterman, R. C., Beerepoot, N., & Lambregts, B. (2016). Service-sector Driven
Economic Development from a Historical Perspective. In B. Lambregts, N.
Beerepoot, & R. C. Kloosterman (Eds.), The Local Impact of Globalization in
South and Southeast Asia: Offshore Business Processes in Service Industries (pp.
17–28). London and New York: Routledge.
Kochhar, R. (2015). A Global Middle Class is more Promise than Reality: From 2001
References

206
to 2011, Nearly 700 million Step out of Poverty, but Most Only Barely. Pew
Research Center. Washington DC. Retrieved from
http://www.pewglobal.org/files/2015/07/Global-Middle-Class-
Report_FINAL_7-8-15.pdf
Krishna, A., & Bajpai, D. (2015). Layers in Globalising Society and the New
Middle Class in India- Trends, Distribution and Prospects. Economic and
Political Weekly, 50(5), 69–77.
Krishna, A., & Pieterse, J. N. (2008). Hierarchical Integration: The Dollar
Economy and the Rupee Economy. Development and Change, 39(2), 219–237.
Kumar, R. (2016). Globalisation of Services Production: Economic and Social
Upgrading in Support-Service Industry Catering to International ICT-ITES
Firms in Mumbai. PhD Thesis, Universiteit van Amsterdam.
Lakha, S. (1999). The State, Globalization, and Indian Middle-Class Identity. In
M. Pinches (Ed.), Culture and Privilege in Capitalist Asia (pp. 251–74). London
and New York: Routledge.
Lambregts, B., Beerepoot, N., & Kloosterman, R. (2016). The Local Impact of
Globalization in South and Southeast Asia: Offshore Business Processes in Services
Industries. London and New York: Routledge.
Landes, D. S. (1998). The Wealth and Poverty of Nations: Why Some are So Rich and
Some So Poor. New York & London: W.W. Norton & Company.
Macaulay, T. B. (1835). Minute by the Hon’ble T.B. Macaulay, dated the 2nd February,
1835. Selections from Educational Records, Part 1 (1781-1839). Calcutta, India:
Superintendent, Government Printing.
Marasigan, M. L. C. (2016). How work in the BPO Sector Affects Employability:
Perceptions of Ex-BPO Workers in Metro Manila. In B. Lambregts, N.
Beerepoot, & R. Kloosterman (Eds.), The Local Impact of Globalization in
South and Southeast Asia: Offshore Business Processes in Service Industries (pp.
138–152). London and New York: Routledge.
Meyer, C., & Birdsall, N. (2012). New Estimates of India’s Middle Class: Technical
References

207
Note. Center for Global Development.
Milanovic, B. (2016). Global Inequality: A new Approach for the Age of Globalization.
Cambridge, Massachusetts: Harvard University Press.
http://doi.org/10.1017/CBO9781107415324.004
Ministry of Statistics and Porgramme Implementation- Government of India.
(n.d.). National Sample Survey Reports. Retrieved September 6, 2016, from
http://www.mospi.nic.in/download-reports
Misra, B. (2010). The Middle Class of Colonial India: A Product of British
Benevolence. In S. Joshi (Ed.), The Middle Class in Colonial India (pp. 33–46).
New Delhi: Oxford University Press.
Motiram, S., & Naraparaju, K. (2015). Growth and Deprivation in India: What
does Recent Evidence Suggest on “Inclusiveness”? Oxford Development
Studies, 43(2), 145–164. http://doi.org/10.1080/13600818.2014.988693
Mundle, S., Chowdhury, S., & Satadru, S. (2016). Governance Performance of
Indian States. Economic and Political Weekly, 51(36), 55–64.
Murphy, J. (2011). Indian Call Centre Workers: Vanguard of a Global Middle
Class? Work, Employment & Society, 25(3), 417–433.
http://doi.org/10.1177/0950017011407968
Murphy, K. M., Shleifer, A., & Vishny, R. (1989). Income Distribution, Market
Size, and Industrialization. The Quarterly Journal of Economics, 104(3), 537–
564. Retrieved from http://www.jstor.org/stable/2937810 .
Nadeem, S. (2009). Macaulay’s (Cyber) Children: The Cultural Politics of
Outsourcing in India. Cultural Sociology, 3(1), 102–122.
http://doi.org/10.1177/1749975508100673
NASSCOM. (2015). India IT-BPM Overview: Impact on India’s growth.
Retrieved July 15, 2015, from http://www.nasscom.in/impact-indias-
growth
NASSCOM. (2016a). Impact of IT-BPO industry on the Indian economy and society.
Retrieved from http://www.nasscom.in/impact-itbpo-industry-indian-
References

208
economy-and-society?fg=71038
NASSCOM. (2016b). India IT-BPM Overview. Retrieved August 10, 2016, from
http://www.nasscom.in/indian-itbpo-industry
NASSCOM. (2017). NASSCOM Knowledge professionals. Retrieved April 21,
2017, from http://www.nasscom.in/knowledge-professionals
Nijman, J. (2006). Mumbai’s Mysterious Middle Class. International Journal of
Urban and Regional Reseacrh, 30(4), 758–775. http://doi.org/10.1111/j.1468-
2427.2006.00694.x
Pannekoek, A. (1909). The New Middle Class. International Socialist Review,
October.
Pew Research Center. (2012). Fewer, Poorer, Gloomier: The Lost Decade of the
Middle Class. Washington, DC.
Pinches, M. (1999). Cultural Relations, Class and the New Rich of Asia. In M.
Pinches (Ed.), Culture and Privilege in Capitalist Asia (pp. 1–56). London and
New York: Routledge. http://doi.org/10.4324/9780203982075
Planning Commission. (2013). Press Note on Poverty Estimates, 2011-12.
Government of India, Press Information Bureau.
Prasad, A., & Shivapriya, N. (2013, February 6). Indian BPO Sector Outpaces IT
Services Growth. Economic Times. Bangalore, Mumbai. Retrieved from
http://economictimes.indiatimes.com/tech/ites/indian-bpo-sector-outpaces-
it-services-growth/articleshow/18359882.cms
Purnell, N. (2017, January 19). Indian Outsourcing Firms Prep for Curbs on H1B
Visa Workers under Trump. The Wall Street Journal. New Delhi. Retrieved
from https://www.wsj.com/articles/indian-outsourcing-firms-fear-curbs-
on-h-1b-visa-workers-under-trump-1484820031
Rastogi, G., & Pradhan, B. (2011). Offshore: How India Got Back on the Global
Business Map. India: Portfolio (Penguin).
Ravallion, M. (2010). The Developing World’s Bulging (but Vulnerable) Middle
Class. World Development, 38(4), 445–454.
References
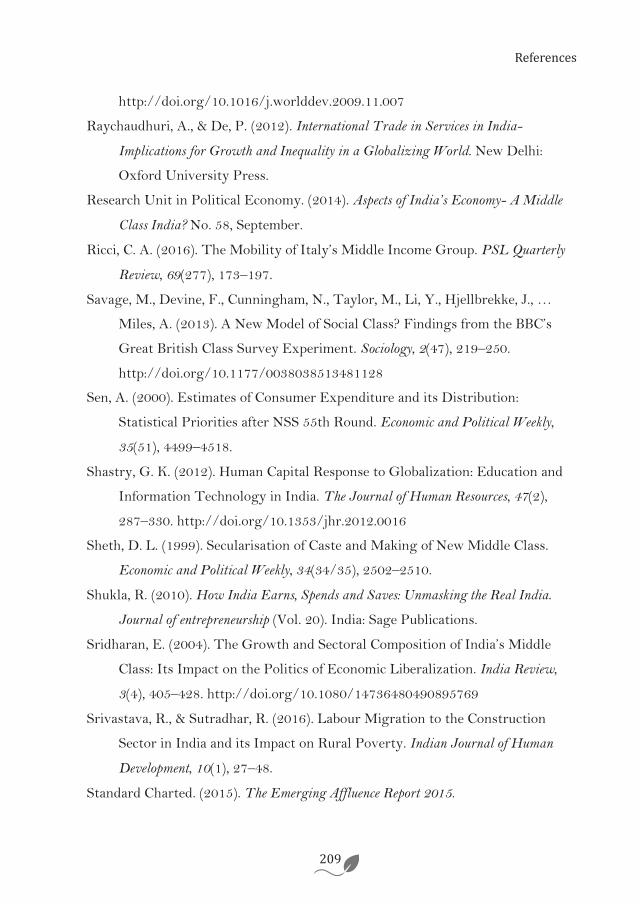
209
http://doi.org/10.1016/j.worlddev.2009.11.007
Raychaudhuri, A., & De, P. (2012). International Trade in Services in India-
Implications for Growth and Inequality in a Globalizing World. New Delhi:
Oxford University Press.
Research Unit in Political Economy. (2014). Aspects of India’s Economy- A Middle
Class India? No. 58, September.
Ricci, C. A. (2016). The Mobility of Italy’s Middle Income Group. PSL Quarterly
Review, 69(277), 173–197.
Savage, M., Devine, F., Cunningham, N., Taylor, M., Li, Y., Hjellbrekke, J., …
Miles, A. (2013). A New Model of Social Class? Findings from the BBC’s
Great British Class Survey Experiment. Sociology, 2(47), 219–250.
http://doi.org/10.1177/0038038513481128
Sen, A. (2000). Estimates of Consumer Expenditure and its Distribution:
Statistical Priorities after NSS 55th Round. Economic and Political Weekly,
35(51), 4499–4518.
Shastry, G. K. (2012). Human Capital Response to Globalization: Education and
Information Technology in India. The Journal of Human Resources, 47(2),
287–330. http://doi.org/10.1353/jhr.2012.0016
Sheth, D. L. (1999). Secularisation of Caste and Making of New Middle Class.
Economic and Political Weekly, 34(34/35), 2502–2510.
Shukla, R. (2010). How India Earns, Spends and Saves: Unmasking the Real India.
Journal of entrepreneurship (Vol. 20). India: Sage Publications.
Sridharan, E. (2004). The Growth and Sectoral Composition of India’s Middle
Class: Its Impact on the Politics of Economic Liberalization. India Review,
3(4), 405–428. http://doi.org/10.1080/14736480490895769
Srivastava, R., & Sutradhar, R. (2016). Labour Migration to the Construction
Sector in India and its Impact on Rural Poverty. Indian Journal of Human
Development, 10(1), 27–48.
Standard Charted. (2015). The Emerging Affluence Report 2015.
References

210
The Economist. (2011, September 24). Exporting Jobs: Gurgaon Grief Now for
the Next Shake-Up in the Global Labour Market. Retrieved from
http://www.economist.com/node/21528983
The Economist. (2012, June 23). At the Front of the Back Office: How the
Philippines Beat India in Call Centres. Manila. Retrieved from
http://www.economist.com/node/21557350
The Economist. (2016, February 6). Call centres: The end of the line. Manila.
Retrieved from http://www.economist.com/news/international/21690041-
call-centres-have-created-millions-good-jobs-emerging-world-technology-
threatens
The Guardian. (2012, March 11). Philippines Beats India, Becomes the Largest
Call Centre Outsourcing Nation. Manila. Retrieved from
http://www.sunday-guardian.com/business/philippines-beats-india-
becomes-the-largest-call-centre-outsourcing-nation
Tholons. (2014). 2015 Top 100 Outsourcing Destinations.
Upadhya, C. (2007). Employment, Exclusion and “Merit” in the Indian IT
Industry. Economic And Political Weekly, 42(20), 1863–1868.
Upadhya, C. (2008). Rewriting the Code: Software Professionals and the
Reconstitution of Indian Middle Class Identity. In C. Jaffrelot & P. van der
Veer (Eds.), Patterns of Middle Class Consumption in India and China (pp. 55–
87). India: Sage Publications. http://doi.org/10.4135/9788178299976.n3
Upadhya, C. (2009). India’s “New Middle Class” and the Globalising City:
Software Professionals in Bangalore, India. In H. Lange & L. Meier (Eds.),
The New Middle Classes: Globalizing Lifestyles, Consumerism and Environmental
Concern (pp. 253–268). Netherlands: Springer. http://doi.org/10.1007/978-
1-4020-9938-0
US Bureau of Labor Statistics. (2014). BLS Reports- Consumer Expenditures in
2012. Retrieved from https://www.bls.gov/cex/csxann12.pdf
Varma, S. (2017, March 30). Only 0.5% jobs added in 8 key non-farm sectors from
References

211
April to September last year. The Times of India. Mumbai. Retrieved from
timesofindia.indiatimes.com/india/only-0-5-jobs-added-in-8-key-non-farm-
sectors-from-april-to-september-last-year/articleshow/57903552.cms
Vira, B., & James, A. (2012). Building Cross-Sector Careers in India’s New Service
Economy? Tracking Former Call Centre Agents in the National Capital
Region. Development and Change, 43(2), 449–479.
http://doi.org/10.1111/j.1467-7660.2012.01768.x
Weininger, E. B. (2005). Foundations of Pierre Bourdieu’s Class Analysis. In E. O.
Wright (Ed.), Approaches to Class Analysis (pp. 82–118). Cambridge:
Cambridge University Press.
Wietzke, B., & Sumner, A. (2014). The Political and Social Implications of the “New
Middle Classes” in Developing Countries : A Literature Review and Avenues for
Future Research. EADI Policy Paper Series.
Wilson, D., & Dragusanu, R. (2008). The Expanding Middle: The Exploding World
Middle Class and Falling Global Inequality (Global Economics Paper No. 170).
Wright, E. O. (1997). Conceptualizing the Interaction of Class and Gender. In
Class Counts (Student Ed, pp. 115–124). Cambridge University Press.
Wright, E. O. (2005). Foundations of Neo-Marxist Class Analysis. In E. O.
Wright (Ed.), Approaches to Class Analysis (pp. 4–30). Cambridge: Cambridge
University Press.
Yin, R. K. (2009). Case Study Research: Design and Methods (Fourth). Los Angeles,
London, New Delhi, Singapore and Washington DC: Sage Publications.
References

212
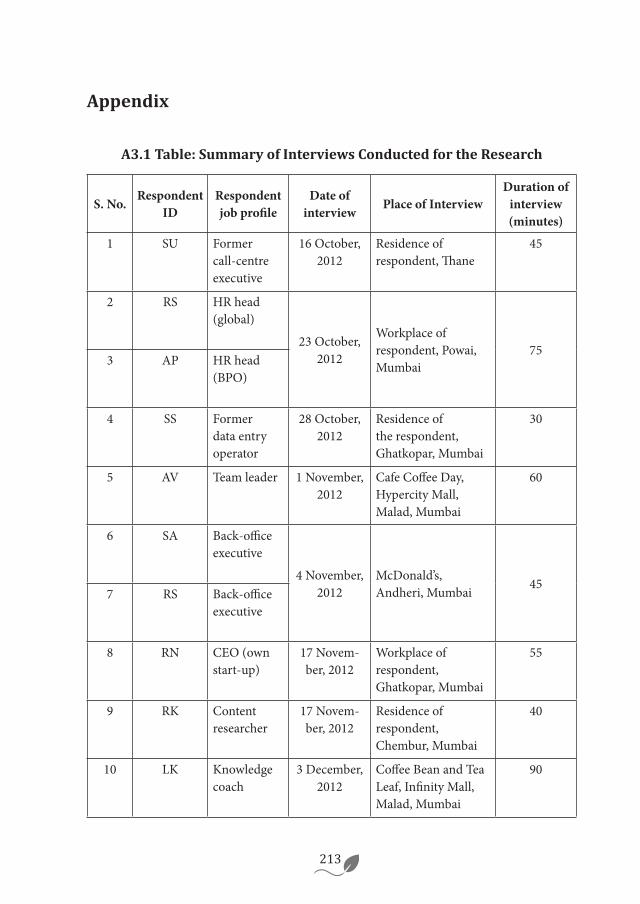
213
A3.1 Table: Summary of Interviews Conducted for the Research
Appendix
S. No. Respondent ID
Respondent job profile
Date of interview Place of Interview
Duration of interview (minutes)
1 SU Former call-centre executive
16 October, 2012
Residence of respondent, Thane
45
2 RS HR head (global)
23 October, 2012
Workplace of respondent, Powai, Mumbai
753 AP HR head
(BPO)
4 SS Former data entry operator
28 October, 2012
Residence of the respondent, Ghatkopar, Mumbai
30
5 AV Team leader 1 November, 2012
Cafe Coffee Day, Hypercity Mall, Malad, Mumbai
60
6 SA Back-office executive
4 November, 2012
McDonald’s, Andheri, Mumbai 45
7 RS Back-office executive
8 RN CEO (own start-up)
17 Novem-ber, 2012
Workplace of respondent, Ghatkopar, Mumbai
55
9 RK Content researcher
17 Novem-ber, 2012
Residence of respondent, Chembur, Mumbai
40
10 LK Knowledge coach
3 December, 2012
Coffee Bean and Tea Leaf, Infinity Mall, Malad, Mumbai
90
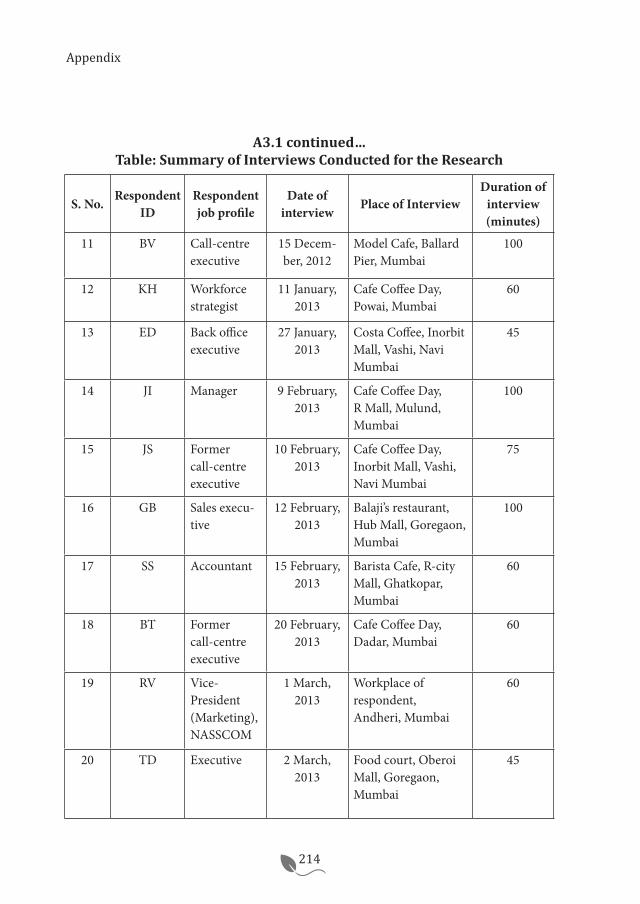
214
A3.1 continued… Table: Summary of Interviews Conducted for the Research
S. No. Respondent ID
Respondent job profile
Date of interview Place of Interview
Duration of interview (minutes)
11 BV Call-centre executive
15 Decem-ber, 2012
Model Cafe, Ballard Pier, Mumbai
100
12 KH Workforce strategist
11 January, 2013
Cafe Coffee Day, Powai, Mumbai
60
13 ED Back office executive
27 January, 2013
Costa Coffee, Inorbit Mall, Vashi, Navi Mumbai
45
14 JI Manager 9 February, 2013
Cafe Coffee Day, R Mall, Mulund, Mumbai
100
15 JS Former call-centre executive
10 February, 2013
Cafe Coffee Day, Inorbit Mall, Vashi, Navi Mumbai
75
16 GB Sales execu-tive
12 February, 2013
Balaji’s restaurant, Hub Mall, Goregaon, Mumbai
100
17 SS Accountant 15 February, 2013
Barista Cafe, R-city Mall, Ghatkopar, Mumbai
60
18 BT Former call-centre executive
20 February, 2013
Cafe Coffee Day, Dadar, Mumbai
60
19 RV Vice-President (Marketing), NASSCOM
1 March, 2013
Workplace of respondent, Andheri, Mumbai
60
20 TD Executive 2 March, 2013
Food court, Oberoi Mall, Goregaon, Mumbai
45
Appendix

215
A3.1 continued… Table: Summary of Interviews Conducted for the Research
S. No. Respondent ID
Respondent job profile
Date of interview Place of Interview
Duration of interview (minutes)
21 SK Marketing head
8 March, 2013
Workplace of respondent, Vikhroli, Mumbai
150
22 RN Research-Director
23 March, 2013
Costa Coffee, Inorbit Mall, Vashi, Navi Mumbai
50
23 VP Financial analyst
30 March, 2013
McDonalds, Chembur, Mumbai
60
24 PS Recruitment team member
31 March, 2013
Costa Coffee, Chembur, Mumbai
45
25 SS Analyst 12 October, 2014
University of Mumbai, Santacruz, Mumbai
20
26 VM Sales execu-tive
16 October, 2014
University of Mumbai, Santacruz, Mumbai
30
27 CW Call-centre executive
15 November, 2014
Residence of respondent, Santacruz, Mumbai
12028 AW Former
call-centre executive
Source: Author’s compilation.
Appendix

216
1. Age ___________________ years
2. Gender
Male
Female
3. Marital Status
Married
Unmarried
Separated/ Divorced/ Widowed
4. Religion
Buddhist
Christian
Hindu
Jain
Islam
Sikh
Others
5. Category
General
SC/ST
OBC/SBC
DT/NT
6. Current Level of education
Undergraduate/Diploma (Please specify the field of study)___
Graduate (Please specify the field of study) ______________
Post-graduate (Please specify the field of study) ______________
Professional degree holder (Please specify the degree, eg, LLB, MBBS, CA, etc.) ______
PhD (Please specify the field of study) ____________________
Others (Please specify the degree and field of study) __________
7. Type of school in which you studied for the majority of the time of your school education
Government
Private
8. Medium of instruction in school
English
Non-English (Please specify the medium) ____________________
If medium of instruction is “English”, please proceed to Q10, else go to the next question
9. Have you had any training in the English language outside your school?
Yes (Please specify in what way) ___
No
10. Which was your place of upbringing, that is, the place where you spent most of your early life and did most of your schooling? Please mention the State and the City/Town/Village.
State: ____________________________
City/ Town/Village: _________________
A3.2 Survey Questionnaire Answered by IT-eS Employees in Mumbai
Appendix

217
11. Father’s level of education
Never attended school
Primary school
Secondary/Higher Secondary school
Undergraduate/Diploma
Graduate (Arts, Science, Commerce, Management, etc.)
Post-graduate (Arts, Science, Commerce, Management, etc.)
Professional (Medical, Engineering, Law, CA, etc.)
PhD
12. Father’s occupation (Mention the last occupation held if deceased or not working anymore)
Agricultural worker (Please specify category of work) _______________
Industrial/ Factory worker (Please specify designation) _____________
Public service (Please specify designation) ____________________
Private service (Please specify designation) ____________________
Self-employed (Please specify designation and field of employment) _____________
Others (Please specify occupation and designation) ________________
13. Father’s gross monthly income (Please write the current income earned if presently working and last income earned if deceased or not working anymore)
Rs. ____________________________________
14. Mother’s level of education
Never attended school
Primary school
Secondary/Higher Secondary school
Undergraduate/Diploma
Graduate (Arts, Science, Commerce, Management, etc.)
Post-graduate (Arts, Science, Commerce, Management, etc.)
Professional (Medical, Engineering, Law, CA, etc.)
PhD
15. Mother’s occupation (Mention the last occupation held if deceased or not working anymore)
Public service (Please specify designation) ____________________
Private service (Please specify designation) ____________________
Industrial/Factory worker (Please specify designation) _____________
Self-employed (Please specify designation and field of employment) _______________
Home-maker
Others (Please specify occupation and designation) ____________________
Agricultural worker (Please specify category of work) _______________
If mother’s occupation is “Home-maker”, please proceed to Q17, else go to the next question.
Appendix

218
16. Mother’s gross monthly income (Please write the current income earned if presently working and last income earned if deceased or not working anymore)
Rs. ____________________________________
17. Do your parents possess any knowledge of the English language (spoken or written)?
Both my parents possess some knowledge of the English language
One of my parents possesses some knowledge of the English language
Neither of my parents have any knowledge of the English language
18. Are you currently living with your family?
Yes
No
If “Yes”, please proceed to Q21, else go to the next question.
19. In which of the following would you categorize your family’s current accommodation?
Bungalow
Flat
Chawl
Hutment
Others (Please specify) ___________
20. What is the type of ownership of your family’s accommodation?
Owned by self or a family member
Owned by government/private company
Rental
Others (Please specify) ____________
21. In which of the following would you categorize your current accommodation?
Bungalow
Flat
Chawl
Hutment
Paying Guest
Hostel
Others (Please specify) ___________
22. What is the type of ownership of your accommodation?
Owned by self or a family member
Owned by government/private company
Rental
Others (Please specify) ___________
23. Does your family own any kind of property like land, house (other than what they may be currently living in), etc?
Yes (Please specify the type of property) ____________________
No
Appendix

219
24. What is the total number of dependents in your family?
0
1
2
3
4
More than 4 (Please specify) _______
25. What is the total number of earning members in your family, including you?
1
2
3
4
5
More than 5 (Please specify) ____
26. Is part of your earned income sent to your family?
Yes
No
27. What is your current gross personal monthly income?
Rs. _________________________________
28. What is your approximate monthly family income?
Rs. _________________________________
29. Against each of the items given below, please write the approximate average amount of money (in ) that you devote to them on a monthly basis. Write 0 against an item on which no money is spent. Please note that money refers to your own personal income as well as borrowed money, which will have to be paid back in future. It does not include income from borrowed sources to which you may not have to pay back.
a. Household necessities (Groceries, maintenance bills, letc.) Rs. ________
b. Personal necessities and accessories (clothes, watches, phones, jewellery, etc.) Rs. __________
c. Personal grooming (Parlour, salon, spa, etc.) Rs. ________
d. Money sent to family (Answer only if you are staying away from family and send money to your family) Rs. _____________
e. Restaurants, bars and cafes Rs. ________
f. Clubbing and partying Rs. _________
g. General entertainment (Movies, concerts, pursuit of hobbies, etc.) Rs.__________
h. Conveyance Rs.__________________
i. Holiday and travel (in this case, write expenditure per year) Rs. _________
j. Personal/ Siblings’/ Children’s education Rs. __________________
k. Payment of interest on loans/ EMIs/ insurance premiums Rs. ___________
l. Charity or donations Rs. __________
m. Savings Rs. ____________________
Appendix

220
30. In which year did you first start working in the outsourcing industry (BPO or KPO)?
_______________
31. What is the total duration of your experience in the outsourcing industry (BPO/KPO)?
__________
32. How many times in all have you been promoted and received increments in income during your career in the outsourcing industry (BPO/KPO)? Please write 0 in case of no promotions or increments so far.
Number of promotions: ___________
Number of increments in income: _____
33. Please fill in the information in the table below about your history of work experience in the outsourcing industry in chronological order, that is, starting from the first company up to the current (in case of ex-employees, last company). In case you have worked for more than eight companies in the industry, please give information on the first and the current/last company, and any other six companies.
Company Type: Captive BPO/ Third Party BPO/
Captive KPO/ Third Party KPO
Job Profile
Duration of work
experience in the
company
Approximate monthly income at
the time of joining the company
Approximate monthly income at the time of leaving
the company-Current monthly income in case of present company
Company 1 Rs. Rs.Company 2 Rs. Rs.Company 3 Rs. Rs.Company 4 Rs. Rs.Company 5 Rs. Rs.Company 6 Rs. Rs.Company 7 Rs. Rs.Company 8 Rs. Rs.
Appendix

221
34. Did you have any significant past work experience before taking up the job in the outsourcing industry?
Yes (Please specify your previous job designation and industry of work) _____________
No
35. Through which of these sources did you find your first job in the outsourcing industry?
I had read about the vacancy in an ad
I had registered myself in a job portal, through which the company contacted me
I got placed through a campus interview
I had registered myself at a placement agency
I was told about the vacancy by an acquaintance
The company contacted me after I was referred to the company by an acquaintance
Others (Please Specify) ___________
36. In which of the following areas were you examined before you were recruited for your first job in the outsourcing industry (includes examination via both written tests and interviews)? Choose all that may apply.
English typing skills
English accent
Communication skills in English
Group discussion skills
Knowledge of computer software (Please specify what kinds of software) ______________________
Aptitude test (Please specify what kinds of aptitude, eg, logical reasoning, language, etc.) __________
Domain knowledge of the specific process that you were recruited for
Past work experience
Others (Please specify) ____________
I did not have to go through any kind of test or interview to get my job
37. Rank the following in the order in which you think they are the most important factors in order to get a job in the outsourcing industry, that is, the most important factor gets rank 1, the second-most important factor gets rank 2, the third-most important gets rank 3 and so on. Please write 0 against items that you think play no role in getting a job in the outsourcing industry. These factors could be specific to your company or your area of work.
___ Educational qualification
___ Past work experience
___ Oral communication skills in English
___ Writing skills in English
___ Typing skills
___ Basic computer skills other than typing
___ Knowledge of specific computer software
___ Domain expertise/knowledge of a particular area of work
___ Leadership or management skills
___ Appearance
___ General knowledge/awareness
Appendix

222
___ Family background
___ Recommendation/reference from a person known to the company
___ Others (Please specify) __________
38. Rank the following in the order in which they were the most important reason for you to choose to join the outsourcing industry, that is, the most important reason gets rank 1, the second-most important reason gets rank 2, the third-most important gets rank 3 and so on . Please write 0 against items that played no role whatsoever in your decision to join the outsourcing industry.
___ It offered a good pay package
___ It let me pursue my studies along with my job
___ It had flexible shifts
___ It was easy to get a job in the outsourcing sector
___ I liked the job profile that was offered to me
___ I perceived it as a respectable job
___ I perceived it as a secure job
___ My friends were also joining the same company
___ I could not find a suitable job in any other industry
___ I had a family member/friend working in the sector who was doing well
___ I just happened to land a job in the industry by chance
___ Others (Please specify)
39. Have you received any on-the-job training during your tenure in the outsourcing industry?
Yes
No
If “No”, proceed to Q42, else go to the next question.
40. What was the average duration of the on-the-job the training? __________
41. In which of the following areas did you receive training during your tenure in the outsourcing industry? Choose all that may apply.
Voice and accent
Computer/Software
Communication and soft skills (Please specify which soft skills) ___________
Process specific training
Others (Please specify) ___________
Answer this question only if you have had any significant past work experience before joining the outsourcing sector
42. During your previous job outside the outsourcing sector, had you made a purchase for which you had paid EMIs?
Yes (Please specify the item(s) purchased) _____________________
No
43. Have you paid or are currently paying EMIs (monthly instalments) for a purchase that you may have made while working in the outsourcing industry?
Yes (Please specify the item(s) purchased) ____________________
No
If “No”, please proceed to Q45, else go to the next question
Appendix

223
44. On an average, what proportion of your income do you pay/have paid as EMI every month?
_________ per cent
45. Do you plan to make a purchase in the recent future for which you would pay out of EMIs?
Yes (Please specify the intended purchase(s)) ____________________
No
46. Which of the following changes in your lifestyle would you attribute to the exposure received in the outsourcing industry? Choose all that may apply.
Improvement in communication and people skills
Better awareness of multiple cultures
Increase in purchase of branded clothes, shoes, etc.
Increase in use of outfits considered modern or fashionable
Improvement in sense of dressing in terms of choice of clothes, colours, etc.
Eating different and new kinds of cuisines
Increase in number of visits to restaurants, bars, cafes, etc.
Increase in consumption of alcohol
Increase in smoking
Increase in frequency of leisure travel or vacations
Change in holiday destination to better or more exotic holiday locations
Change in mode of transport to more comfortable, but expensive services (either regular travel or travel for leisure)
Increase in impulsive shopping (shopping for things that you like at that moment but may not really need)
Increase in on-line shopping
Increase in use of credit/ debit cards for paying bills or shopping
Others (Please specify) ___________
I do not see any changes in my lifestyle due to exposure to the outsourcing industry
47. Are you currently employed in the outsourcing industry (BPO or KPO)?
Yes
No
If “No”, proceed to Q59, else go to the next question
48. In which of the following categories would you place your current company?
Captive BPO
Third Party/Outsourced BPO
Captive KPO
Third Party/ Outsourced KPO
Others (Please Specify) __________
49. Are you currently studying or were studying at any point while working in the outsourcing industry?
Yes (Please specify the course) _____
No
If “No”, proceed to Q51, else go to the next question
Appendix

224
50. Does/did your company financially assist you in your educational pursuit?
Yes
No
51. Do you plan to pursue any further studies in the future?
Yes, I plan to study along with my job
Yes, I plan to study, but after quitting my job
No
If you choose “Yes, I plan to study along with my job”, go to the next question, else, proceed to Q53.
52. Will your current company provide any financial assistance to you in your educational pursuit?
Yes
No
Don’t know
53. Rank the following in the order in which they are the most important reason for you to continue to be working in the outsourcing sector, that is, the most important reason gets rank 1, the second-most important reason gets rank 2, the third-most important gets rank 3 and so on. Please write 0 against items that play no role in your decision to continue working in the outsourcing industry.
____ The sector pays very well
____ There are immense opportunities for learning/scope for career growth in
this industry
____ I like the nature of work that I do
____ There is immense scope for personality development in this industry
____ There is global exposure in terms of interaction with foreign clients or opportunities to travel abroad
____ The work culture here is professional
____ It is a fun sector
____ There is job security in this industry
____ It is a respectable job
____ The sector gives good incentives
____ The sector offers flexible shifts
____ I do not want to continue in this industry, but I cannot find another job, or I am looking out for another job
____ Others (Please specify)
54. What kinds of incentives/perks are provided to you by your company(s) in the outsourcing industry? Choose all that may apply.
Uniform monetary benefits like PF, insurance, etc. (provided to all employees irrespective of performance)
Performance based monetary benefits
Performance based gifts in kind like cell phone, home appliances, etc.
Performance based benefits like house, car, etc.
Easy loans for purchase of house, car, etc.
Credit card/Debit card facilities
Appendix

225
Employee Stock Options
Festival bonus
Maternity leave (To be answered only by Females)
Paternity leave (To be answered only by Males)
Others (Please specify) _______
I do not get any incentives
55. Which of the following amenities are provided by your company(s) in the outsourcing industry or are available within the company premises? Choose all that may apply.
Free pick-up and drop
Free or subsidised accommodation
Multi-cuisine cafeteria
Free or subsidised meals
Library
Gym
Sports facilities
Beauty salon
Medical facilities
Other amenities (Please specify)____
None of the above
56. How do you think your experience in the outsourcing industry will help your career growth? Choose all that may apply.
It will help me get a better job in another industry outside outsourcing
It will help me get a better job in another company within the outsourcing industry
It will help me get a job abroad
Others (Please specify) __________
I do not think this experience will help my career in any significant way
57. For how long do you plan to continue working in this industry?
Less than a year
One to two years
Two to three years
Three to five years
Five to ten years
More than ten years
If you choose the options “Five to Ten Years” or “More than Ten Years”, proceed to Q68, else go to the next question
58. Rank the following in the order in which you think they are the most important reasons for you to regard the outsourcing industry as only a short or medium term career option, that is, the most important reason gets rank 1, the second most important reason gets rank 2, the third most important gets rank 3 and so on. Please write 0 against options that play no role in your decision to look at the industry as a short or medium term career option.
____ I do not like the nature of work that I do
____ I am passionate about another type of job
____ I cannot work in shifts for a long time
____ There is no job security in this industry
____ The industry hardly offers opportunities for growth or learning
Appendix

226
____ The industry is highly competitive
____ I generally like to shift from one type of job to another
____ I am not happy with the pay that I receive
____ I do not like the work culture in this industry
____ There is not much respect in this type of job
____ Others (Please specify)
All respondents currently employed in the outsourcing industry, please proceed to Q68
59. What is your current job designation and industry of work?____________
60. In which of the following categories would you place the last company you worked for, in the outsourcing industry?
Captive BPO
Third Party/Outsourced BPO
Captive KPO
Third Party/Outsourced KPO
Others (Please specify)
61. Were you also studying while working in the outsourcing industry?
Yes (Please specify the course) _____
No
If “Yes”, go the next question, else proceed to Q63
62. Did your company provide any financial assistance for your educational pursuit?
Yes
No
63. What kinds of incentives/perks were provided to you by your company(s) in the outsourcing industry? Choose all that may apply.
Uniform monetary benefits like PF, insurance, etc. (provided to all employees irrespective of performance)
Performance based monetary benefits
Performance based gifts in kind like cell phone, home appliances, etc.
Performance based benefits like house, car, etc.
Easy loans for purchase of house, car, etc.
Credit card/ Debit card facilities
Employee Stock Options
Festival bonus
Maternity leave
Paternity leave
Others (Please specify) ____________________
I did not get any incentives
Appendix

227
64. Which of the following amenities were provided by your company(s) in the outsourcing industry or were available within your company premises? Choose all that may apply.
Free pick-up and drop
Free or subsidised accommodation
Multi-cuisine cafeteria
Free or subsidised meals
Library
Gym
Sports facilities
Beauty salon
Medical facilities
Other amenities (Please specify) ____________________
None of the above
65. How do you think the experience in the outsourcing industry is generally helpful in career growth? Choose all that may apply.
It helps one get a better job outside the outsourcing industry
It helps one get a better job within the outsourcing industry itself
It helps one get a job abroad
I do not think the experience in the outsourcing industry helps one’s career in any significant way
Others (Please specify)
____________________
66. Rank the following in the order in which they were the most important
reason for you to choose to quit the outsourcing industry, that is, the most important reason gets rank 1, the second-most important reason gets rank 2, the third most important reason gets rank 3 and so on. Please write 0 against items that played no role in your decision to quit the industry.
----- I was offered a higher package in another industry
----- I could not cope with the rotational/night shifts at work
----- There was hardly any scope for career growth or learning in the industry
----- I did not like the nature of work in the industry
----- I did not like the work culture in the industry
----- The industry is highly competitive
----- There was no security of job
----- It was not a respectable job
----- I had to leave the industry as my company shut down/they were downsizing
----- I generally cannot work in the same industry for a long time and like shifting from one job to another
----- I was always more passionate about my current type of job
----- Others (Please specify)
67. Would you like to join the outsourcing industry again in the future?
Yes (Please specify, why) __________
No (Please specify, why) __________
Not sure (Please specify, why) ____________________
Appendix

228
68. Would you like to join the outsourcing industry again in the future?
Yes NoCan’t Say
It is easy to get a job in the outsourcing industry in terms of level of rounds of interviews, tests, etc.
It is easy to get a job in the outsourcing industry without a reference or a recommendation
It is easy to get promoted in the outsourcing industry
I would recommend my friends/ relatives to also join the out-sourcing industry
After quitting the outsourcing sector, I managed to find a job that paid me as much as or higher than what I earned in the outsourcing industry
(Answer only if you are currently NOT working in the outsourcing industry)
I worry about losing my job
(Answer only if you ARE currently working in the outsourcing industry)
If I quit my current job, I am confident that I will easily get a job in another industry with the same or a higher pay
(Answer only if you ARE currently working in the outsourcing industry)
69. Please write about your long term career goals in not more than 200 words.
Thank you for answering all the questions. If you do not mind that I contact you in future to seek any clarifications, please leave your contact details below.
Name: ______________________________
Email id and/or phone number: _________
Appendix
229
A4.1 Table: Size of Different Classes in India (%) India
1999-00 2004-05 2011-12
Poor (< $2) 70.7 (707.5) 71.4 (777.3) 47.8 (574.8)
Middle ($2 - $10) 28.9 (289.7) 27.9 (304.2) 50.3 (604.3)
Lower-middle ($2 - $4) 23.6 (236.3) 21.8 (237.8) 37.1 (446.3)
Middle-middle ($4 - $6) 3.9 (38.7) 4.2 (45.4) 9.0 (108.5)
Upper-middle ($6 - $10) 1.5 (14.7) 1.9 (21.0) 4.1 (49.5)
Affluent (>$10) 0.4 (3.8) 0.7 (7.5) 1.9 (22.9)
Rural
1999-00 2004-05 2011-12
Poor (< $2) 79.6 (597.0) 81.4 (662.1) 58.2 (499.1)
Middle ($2 - $10) 20.3 (152.2) 18.4 (149.6) 41.4 (355.7)
Lower-middle ($2 - $4) 18.3 (137.1) 16.2 (131.4) 34.9 (299.1)
Middle-middle ($4 - $6) 1.6 (12.0) 1.7 (13.8) 5.1 (43.4)
Upper-middle ($6 - $10) 0.4 (3.1) 0.5 (4.4) 1.5 (13.2)
Affluent (>$10) 0.1 (0.6) 0.2 (1.8) 0.4 (3.4)
Urban
1999-00 2004-05 2011-12
Poor (< $2) 44.0 (110.6) 41.8 (115.3) 22.0 (75.6)
Middle ($2 - $10) 54.7(137.4) 56.1(154.5) 72.4 (248.7)
Lower-middle ($2 - $4) 39.5 (99.1) 38.6 (106.3) 42.8 (147.2)
Middle-middle ($4 - $6) 10.6 (26.7) 11.5 (31.7) 18.9 (65.1)
Upper-middle ($6 - $10) 4.6 (11.6) 6.0 (16.5) 10.6 (36.4)
Affluent (>$10) 1.3 (3.2) 2.1 (5.7) 5.7 (19.4)
Note: Figures in brackets are population size in million.
Consumption expenditure is based on Mixed Reference Period (MPCE-MRP) of the NSS surveys.
Source: Author’s calculations based on NSS Household Consumer Expenditure Survey, 55th, 61st and 68th
rounds and Reserve Bank of India (annual population figures).
Appendix

230
A4.2 Table: State-wise Size of Middle Class Population (%)
1999-00 2004-05 2011-12 State Rural Urban State Rural Urban State Rural Urban
Andaman & Nicobar I. 70.1 63.4 87.1 70.2 61.0 88.1 84.2 85.1 82.7 Andhra Pradesh 24.6 14.4 49.9 29.6 21.3 53.8 71.3 64.9 84.4 Arunachal Pradesh 40.5 39.2 54.7 40.7 37.8 62.9 50.8 45.5 72.5 Assam 15.5 11.0 55.6 21.5 16.9 66.5 30.7 26.5 67.1 Bihar 10.6 7.3 32.8 8.0 5.2 35.5 23.7 20.6 52.7 Chandigarh 78.4 71.5 79.5 70.2 53.7 72.0 69.5 93.6 67.6 Chhattisgarh NA NA NA 13.8 7.6 48.5 25.2 18.7 49.0 Dadra & Nagar Haveli 28.5 22.6 80.1 28.4 22.2 75.3 44.5 22.8 74.8 Daman & Diu 79.2 76.7 82.7 85.9 88.4 81.4 93.1 98.5 84.5 Delhi 78.1 84.8 75.9 72.8 55.1 74.1 79.5 81.8 79.3 Goa 76.0 64.9 88.2 61.6 58.7 66.2 89.3 86.5 92.0 Gujarat 40.5 29.1 64.9 41.2 26.3 69.7 65.8 51.9 86.3 Haryana 56.5 52.9 66.0 50.0 45.4 62.5 78.8 79.9 76.1 Himachal Pradesh 50.9 47.8 83.0 46.6 42.8 83.4 73.5 72.4 83.4 Jammu & Kashmir 59.5 53.6 82.4 54.1 46.8 75.8 71.2 68.1 81.7 Jharkhand NA NA NA 14.1 6.0 56.4 25.8 16.0 63.2 Karnataka 31.9 20.5 61.1 25.8 11.6 57.6 55.7 47.4 70.4 Kerala 56.3 53.7 63.5 56.5 54.0 64.9 78.2 78.3 78.0 Lakshadweep 81.7 71.6 87.9 76.3 69.9 82.8 90.3 95.6 85.1 Madhya Pradesh 17.6 10.3 43.2 16.9 9.6 40.7 33.5 25.5 56.8 Maharashtra 37.8 22.1 62.9 37.4 20.5 62.3 67.2 55.4 81.2 Manipur 33.5 27.3 52.5 26.1 20.2 44.4 56.1 52.6 65.7 Meghalaya 39.5 29.6 88.9 35.3 29.1 75.3 63.1 56.3 88.8 Mizoram 71.6 60.9 87.7 69.8 58.1 87.7 69.8 50.8 91.9 Nagaland 92.1 91.0 94.7 83.8 79.4 94.5 86.2 83.1 91.9 Odisha 13.7 9.2 36.4 12.8 8.0 43.1 22.9 17.0 55.8 Puducherry 48.8 37.3 56.3 52.4 39.6 59.4 89.7 84.9 92.2 Punjab 58.5 55.1 65.8 57.1 50.3 71.2 85.8 86.1 85.3 Rajasthan 35.3 29.5 56.0 26.3 19.7 49.5 65.5 61.2 79.3 Sikkim 30.1 25.0 75.6 38.6 34.2 73.1 66.3 60.1 95.8 Tamil Nadu 35.7 22.9 59.7 34.5 19.9 57.8 67.7 58.6 79.0 Tripura 29.2 24.2 60.7 16.3 10.2 53.6 42.8 37.6 71.3 Uttarakhand NA NA NA 33.1 25.6 57.6 63.5 58.5 78.2 Uttar Pradesh 22.0 17.5 39.8 20.1 14.9 41.2 31.5 26.8 48.7 West Bengal 23.3 14.7 54.9 26.6 17.0 56.0 45.0 35.8 70.5 Note: Data for 1999-00 are not comparable with that of the other years for Bihar, Madhya Pradesh and Uttar Pradesh as they
were reconstituted in 2000 to form three new states of Jharkhand, Chhattisgarh and Uttarakhand, respectively. Source: Same
as A4.1.
Appendix

231
A4
.3a
Tab
le: A
vera
ge S
har
e of
Con
sum
pti
on E
xpen
dit
ure
on
Dif
fere
nt
Item
Gro
up
s, In
dia
(%
)
Item
gro
up
Poor
(<
$2)
Midd
le ($
2-$1
0)
Lowe
r-mid
dle
($2-
$4)
Midd
le-m
iddl
e ($
4-$6
) Up
per-m
iddl
e ($
6-$1
0)
Afflu
ent
(>$1
0)
99
-00
04-0
5 11
-12
99-0
0 04
-05
11-1
2 99
-00
04-0
5 11
-12
99-0
0 04
-05
11-1
2 99
-00
04-0
5 11
-12
99-0
0 04
-05
11-1
2
Cere
als, p
ulses
, etc.
(i)
40.0
33.8
30.0
22.6
18.1
17.8
26.0
21.4
21.3
17.0
14.3
14.7
12.1
10.2
10.5
10.0
6.1
5.4
Fruit
s, ve
getab
les, m
ilk,
egg,
meat
and f
ish (ii
) 18
.9 19
.2 18
.8 21
.3 18
.6 18
.8 22
.2 20
.1 20
.3 20
.3 17
.0 18
.1 17
.3 14
.5 15
.1 10
.2 9.4
9.3
Beve
rage
s, re
fresh
ments
an
d into
xican
ts (iii
) 6.8
6.8
8.4
8.0
7.4
8.0
7.8
7.4
8.0
8.5
7.5
7.8
9.0
7.2
8.3
9.7
8.4
8.8
Food
(i+ii
+iii)
65.7
59.8
57.1
51.9
44.1
44.6
56.0
48.9
49.6
45.8
38.9
40.6
38.4
31.9
33.8
29.8
23.8
23.5
Cloth
ing, b
eddin
g &
footw
ear
8.1
8.2
8.7
7.4
6.7
7.4
7.6
7.1
7.8
7.1
6.3
7.0
6.6
5.7
6.4
5.9
4.7
5.2
Fuel
8.2
11.1
11.3
6.9
8.9
7.9
7.4
9.5
9.0
6.2
8.2
7.1
5.5
7.3
6.0
9.6
5.1
4.2
Educ
ation
1.6
2.4
2.5
3.9
6.1
6.1
3.3
4.8
4.6
4.9
7.4
7.5
5.6
8.6
9.0
4.5
9.7
9.8
He
alth
4.5
4.4
4.7
6.8
6.9
7.3
6.5
6.7
6.6
7.0
7.3
8.1
7.7
7.3
8.2
8.1
8.4
8.8
Cons
umer
servi
ces
5.0
6.0
7.6
10.8
13.7
13.2
8.7
11.2
11.5
13.8
16.4
14.4
18.0
20.2
16.9
16.7
21.8
19.7
Rent
and t
axes
0.5
0.8
0.6
3.6
4.1
3.8
2.7
3.1
2.3
5.2
5.5
5.0
6.5
6.7
7.1
5.5
8.8
10
.8 Sm
all du
rable
s (iv)
4.9
5.3
5.2
5.0
4.8
4.9
5.1
5.1
5.2
5.0
4.6
4.7
4.7
4.1
4.3
6.6
3.1
3.2
Bu
lky du
rable
s (v)
1.5
2.0
2.3
3.7
4.7
4.8
2.7
3.6
3.4
5.1
5.5
5.6
7.0
8.2
8.3
13.3
14.6
14.8
Dura
bles
(iv+
v)
6.4
7.3
7.5
8.7
9.5
9.7
7.8
8.7
8.6
10.1
10.1
10.3
11.7
12.3
12.6
19.9
17.7
18.0
Note:
Colu
mn to
tals
may n
ot su
m to
100 b
ecau
se o
f rou
nding
off.
Sour
ce: S
ame
as A
4.1.
Appendix

232
A4
.3b
Tab
le: A
vera
ge S
har
e of
Con
sum
pti
on E
xpen
dit
ure
on
Dif
fere
nt
Item
Gro
up
s, R
ura
l In
dia
(%
)
Item
gro
up
Poor
(<
$2)
Midd
le ($
2-$1
0)
Lowe
r-mid
dle
($2-
$4)
Midd
le-m
iddl
e ($
4-$6
) Up
per-m
iddl
e ($
6-$1
0)
Afflu
ent
(>$1
0)
99
-00
04-0
5 11
-12
99-0
0 04
-05
11-1
2 99
-00
04-0
5 11
-12
99-0
0 04
-05
11-1
2 99
-00
04-0
5 11
-12
99-0
0 04
-05
11-1
2
Cere
als, p
ulses
, etc.
(i)
41.0
34.6
30.3
25.6
20.8
19.6
27.5
22.6
21.9
18.3
15.8
14.8
14.1
12.1
10.7
22.5
8.1
5.9
Fruit
s, ve
getab
les, m
ilk, e
gg,
meat
and f
ish (ii
) 18
.7 19
.2 18
.7 22
.5 20
.4 20
.2 22
.9 21
.4 20
.9 21
.7 18
.1 19
.5 16
.8 14
.7 16
.3 8.3
10
.0 8.5
Beve
rage
s, re
fresh
ments
and
intox
icants
(iii)
6.7
6.8
8.5
7.7
7.3
7.9
7.6
7.3
8.1
7.8
7.5
7.2
9.9
6.9
8.6
9.2
7.5
6.8
Food
(i+ii
+iii)
66.4
60.6
57.5
55.8
48.5
47.7
58.0
51.3
50.8
47.8
41.5
41.5
40.8
33.7
35.7
39.8
25.6
21.2
Cloth
ing, b
eddin
g and
foo
twea
r 8.1
8.3
8.7
7.6
6.9
7.6
7.7
7.3
7.9
7.0
6.1
6.8
6.0
5.0
6.0
10
.2 4.5
3.5
Fuel
8.0
10.8
11.3
6.8
8.4
8.2
7.2
8.9
9.1
5.5
7.1
6.6
4.1
5.5
5.2
1.9
3.6
2.6
Educ
ation
1.4
2.2
2.3
2.8
4.3
4.8
2.6
3.9
4.0
3.3
5.8
6.7
4.1
5.8
7.3
2.5
10
.7 7.1
He
alth
4.6
4.5
4.8
8.5
9.2
8.5
7.8
8.4
7.4
10.9
10.9
11.1
13.2
13.8
12.5
15.2
11.5
17.9
Cons
umer
servi
ces
4.8
5.9
7.6
8.8
11.1
12.0
8.1
10.1
11.3
12.1
14.0
13.7
14.2
16.1
14.3
8.2
15.3
11.1
Rent
and t
axes
0.3
0.3
0.3
1.0
1.1
1.0
0.8
0.9
0.7
1.5
1.6
1.6
3.1
1.5
2.1
0.9
5.1
2.2
Sm
all du
rable
s (iv)
4.8
5.3
5.1
4.7
4.7
4.9
4.8
4.9
5.1
4.4
4.2
4.5
3.7
3.4
3.8
2.1
2.5
2.0
Bu
lky du
rable
s (v)
1.6
2.1
2.4
4.0
5.8
5.3
3.0
4.3
3.7
7.5
8.8
7.5
10.8
15.2
13.1
19.2
21.2
32.4
Dura
bles
(iv+
v)
6.4
7.4
7.5
8.7
10.5
10.2
7.8
9.2
8.8
11.9
13.0
12.0
14.5
18.6
16.9
21.3
23.7
34.4
Note:
Colu
mn to
tals
may n
ot su
m to
100 b
ecau
se o
f rou
nding
off.
Sour
ce: S
ame
as A
4.1.
Appendix

233
A4
.3c
Tab
le: A
vera
ge S
har
e of
Con
sum
pti
on E
xpen
dit
ure
on
Dif
fere
nt
Item
Gro
up
s, U
rban
Ind
ia (
%)
Item
gro
up
Poor
(<
$2)
Mid
dle
($2-
$10)
Lo
wer-m
iddl
e ($
2-$4
) Mi
ddle-
mid
dle
($4-
$6)
Uppe
r-mid
dle
($6-
$10)
Af
fluen
t (>
$10)
99-0
0 04
-05
11-1
2 99
-00
04-0
5 11
-12
99-0
0 04
-05
11-1
2 99
-00
04-0
5 11
-12
99-0
0 04
-05
11-1
2 99
-00
04-0
5 11
-12
Cere
als, p
ulses
, etc.
(i)
35.2
30.1
28.3
19.9
16.1
15.9
24.0
20.0
20.3
16.5
13.7
14.6
11.6
9.7
10.4
7.7
5.4
5.3
Fruit
s, ve
getab
les, m
ilk, e
gg,
meat
and f
ish (ii
) 19
.8 19
.0 15
.1 20
.2 17
.2 17
.3 21
.3 18
.7 19
.1 19
.6 16
.6 17
.3 17
.5 14
.5 14
.6 10
.6 9.2
9.4
Beve
rage
s, re
fresh
ments
and
intox
icants
(iii)
7.4
7.0
7.6
8.3
7.4
8.0
8.0
7.4
7.8
8.8
7.5
8.1
8.7
7.3
8.2
9.7
8.6
9.2
Food
(i+ii
+iii)
62.3
56.2
54.7
48.3
40.8
41.2
53.3
46.2
47.2
44.9
37.8
40.0
37.8
31.5
33.2
28.0
23.3
24.0
Cloth
ing, b
eddin
g and
foo
twea
r 7.8
7.7
8.3
7.3
6.6
7.2
7.5
7.0
7.7
7.1
6.4
7.1
6.8
5.9
6.6
5.1
4.7
5.4
Fuel
8.8
12.0
11.5
7.1
9.3
7.8
7.7
10.3
9.0
6.6
8.7
7.5
5.8
7.9
6.2
11.0
5.5
4.5
Educ
ation
2.4
3.2
3.4
4.9
7.2
7.5
4.2
5.9
5.8
5.6
8.1
8.0
6.0
9.3
9.7
4.9
9.5
10
.4 He
alth
4.0
4.0
4.3
5.2
5.2
5.9
4.9
4.8
5.4
5.2
5.7
6.1
6.3
5.5
6.7
6.7
7.4
7.2
Cons
umer
servi
ces
5.5
6.8
8.2
12.6
15.6
14.4
9.6
12.4
11.9
14.6
17.3
14.9
19.0
21.3
17.8
18.3
24.0
21.2
Rent
and t
axes
2.5
3.1
2.4
5.9
6.5
6.8
5.0
5.5
5.1
6.8
7.1
7.3
7.4
8.0
8.8
6.4
9.9
12
.4 Sm
all du
rable
s (iv)
5.4
5.5
5.3
5.3
4.9
4.9
5.5
5.2
5.2
5.3
4.7
4.9
4.9
4.2
4.4
7.4
3.2
3.4
Bu
lky du
rable
s (v)
1.3
1.5
1.9
3.4
3.9
4.3
2.3
2.7
2.7
4.0
4.1
4.4
6.0
6.4
6.6
12.2
12.5
11.5
Dura
bles
(iv+
v)
6.7
7.0
7.2
8.7
8.8
9.2
7.8
7.9
7.9
9.3
8.8
9.3
10.9
10.6
11.0
19.6
15.7
14.9
Note:
Colu
mn to
tals
may n
ot su
m to
100 b
ecau
se o
f rou
nding
off.
Sour
ce: S
ame
as A
4.1.
Appendix
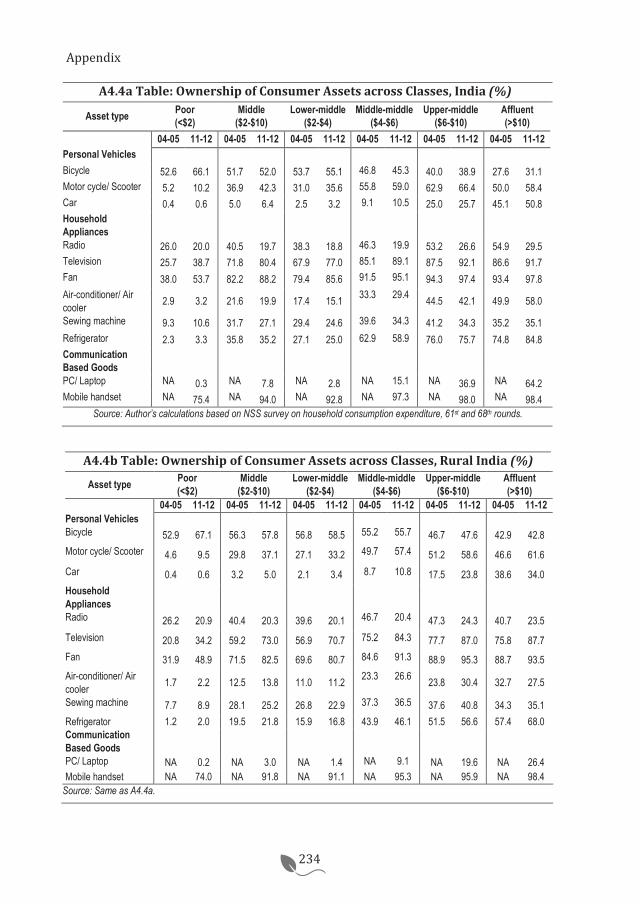
234
A4.4a Table: Ownership of Consumer Assets across Classes, India (%)
Asset type Poor (<$2)
Middle ($2-$10)
Lower-middle ($2-$4)
Middle-middle ($4-$6)
Upper-middle ($6-$10)
Affluent (>$10)
04-05 11-12 04-05 11-12 04-05 11-12 04-05 11-12 04-05 11-12 04-05 11-12 Personal Vehicles Bicycle 52.6 66.1 51.7 52.0 53.7 55.1 46.8 45.3 40.0 38.9 27.6 31.1 Motor cycle/ Scooter 5.2 10.2 36.9 42.3 31.0 35.6 55.8 59.0 62.9 66.4 50.0 58.4 Car 0.4 0.6 5.0 6.4 2.5 3.2 9.1 10.5 25.0 25.7 45.1 50.8 Household Appliances
Radio 26.0 20.0 40.5 19.7 38.3 18.8 46.3 19.9 53.2 26.6 54.9 29.5 Television 25.7 38.7 71.8 80.4 67.9 77.0 85.1 89.1 87.5 92.1 86.6 91.7 Fan 38.0 53.7 82.2 88.2 79.4 85.6 91.5 95.1 94.3 97.4 93.4 97.8 Air-conditioner/ Air cooler 2.9 3.2 21.6 19.9 17.4 15.1 33.3 29.4 44.5 42.1 49.9 58.0
Sewing machine 9.3 10.6 31.7 27.1 29.4 24.6 39.6 34.3 41.2 34.3 35.2 35.1 Refrigerator 2.3 3.3 35.8 35.2 27.1 25.0 62.9 58.9 76.0 75.7 74.8 84.8 Communication Based Goods
PC/ Laptop NA 0.3 NA 7.8 NA 2.8 NA 15.1 NA 36.9 NA 64.2 Mobile handset NA 75.4 NA 94.0 NA 92.8 NA 97.3 NA 98.0 NA 98.4
Source: Author’s calculations based on NSS survey on household consumption expenditure, 61st and 68th rounds.
A4.4b Table: Ownership of Consumer Assets across Classes, Rural India (%)
Asset type Poor (<$2)
Middle ($2-$10)
Lower-middle ($2-$4)
Middle-middle ($4-$6)
Upper-middle ($6-$10)
Affluent (>$10)
04-05 11-12 04-05 11-12 04-05 11-12 04-05 11-12 04-05 11-12 04-05 11-12 Personal Vehicles Bicycle 52.9 67.1 56.3 57.8 56.8 58.5 55.2 55.7 46.7 47.6 42.9 42.8 Motor cycle/ Scooter 4.6 9.5 29.8 37.1 27.1 33.2 49.7 57.4 51.2 58.6 46.6 61.6 Car 0.4 0.6 3.2 5.0 2.1 3.4 8.7 10.8 17.5 23.8 38.6 34.0 Household Appliances
Radio 26.2 20.9 40.4 20.3 39.6 20.1 46.7 20.4 47.3 24.3 40.7 23.5 Television 20.8 34.2 59.2 73.0 56.9 70.7 75.2 84.3 77.7 87.0 75.8 87.7 Fan 31.9 48.9 71.5 82.5 69.6 80.7 84.6 91.3 88.9 95.3 88.7 93.5 Air-conditioner/ Air cooler 1.7 2.2 12.5 13.8 11.0 11.2 23.3 26.6 23.8 30.4 32.7 27.5
Sewing machine 7.7 8.9 28.1 25.2 26.8 22.9 37.3 36.5 37.6 40.8 34.3 35.1 Refrigerator 1.2 2.0 19.5 21.8 15.9 16.8 43.9 46.1 51.5 56.6 57.4 68.0 Communication Based Goods
PC/ Laptop NA 0.2 NA 3.0 NA 1.4 NA 9.1 NA 19.6 NA 26.4 Mobile handset NA 74.0 NA 91.8 NA 91.1 NA 95.3 NA 95.9 NA 98.4
Source: Same as A4.4a.
Appendix
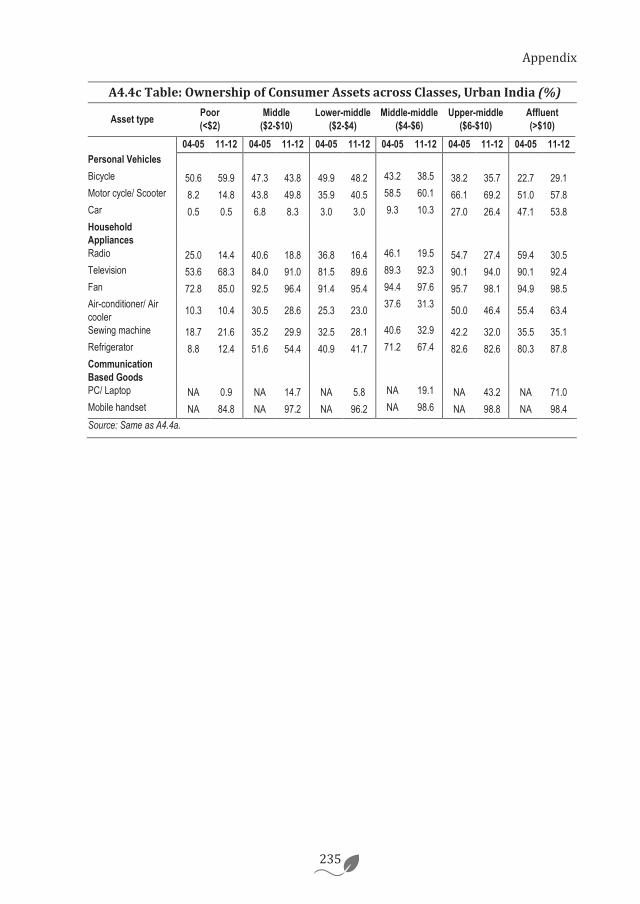
235
A4.4c Table: Ownership of Consumer Assets across Classes, Urban India (%)
Asset type Poor (<$2)
Middle ($2-$10)
Lower-middle ($2-$4)
Middle-middle ($4-$6)
Upper-middle ($6-$10)
Affluent (>$10)
04-05 11-12 04-05 11-12 04-05 11-12 04-05 11-12 04-05 11-12 04-05 11-12 Personal Vehicles Bicycle 50.6 59.9 47.3 43.8 49.9 48.2 43.2 38.5 38.2 35.7 22.7 29.1 Motor cycle/ Scooter 8.2 14.8 43.8 49.8 35.9 40.5 58.5 60.1 66.1 69.2 51.0 57.8 Car 0.5 0.5 6.8 8.3 3.0 3.0 9.3 10.3 27.0 26.4 47.1 53.8 Household Appliances
Radio 25.0 14.4 40.6 18.8 36.8 16.4 46.1 19.5 54.7 27.4 59.4 30.5 Television 53.6 68.3 84.0 91.0 81.5 89.6 89.3 92.3 90.1 94.0 90.1 92.4 Fan 72.8 85.0 92.5 96.4 91.4 95.4 94.4 97.6 95.7 98.1 94.9 98.5 Air-conditioner/ Air cooler 10.3 10.4 30.5 28.6 25.3 23.0 37.6 31.3 50.0 46.4 55.4 63.4
Sewing machine 18.7 21.6 35.2 29.9 32.5 28.1 40.6 32.9 42.2 32.0 35.5 35.1 Refrigerator 8.8 12.4 51.6 54.4 40.9 41.7 71.2 67.4 82.6 82.6 80.3 87.8 Communication Based Goods
PC/ Laptop NA 0.9 NA 14.7 NA 5.8 NA 19.1 NA 43.2 NA 71.0 Mobile handset NA 84.8 NA 97.2 NA 96.2 NA 98.6 NA 98.8 NA 98.4 Source: Same as A4.4a.
Appendix

236
A5.1a Table: Class-wise Distribution of Literacy Level of Household Heads, India (%)
Illiterate/
Informally literate Below primary to primary school
Middle to secondary school
Higher secondary school/ diploma
Graduate and above
1999-00
Poor (< $2) 55.0 25.2 16.0 2.4 1.5 Middle ($2-$10) 23.2 21.6 31.6 9.2 14.4 Lower-middle($2-$4) 27.4 24.4 31.5 7.7 9.0 Middle-middle($4-$6) 10.6 14.1 34.3 13.2 27.8 Upper-middle($6-$10) 4.5 8.3 26.2 17.0 43.8 Affluent (>$10) 6.2 4.7 16.6 12.7 59.8 All classes 43.6 23.8 21.4 4.8 6.4
2004-05
Poor (< $2) 50.1 25.3 20.1 2.9 1.5 Middle ($2-$10) 18.5 19.7 34.7 11.7 15.3 Lower-middle ($2-$4) 22.5 22.7 35.7 9.8 9.3 Middle-middle($4-$6) 8.2 12.7 35.9 16.6 26.6 Upper-middle($6-$10) 4.2 7.7 23.6 18.7 45.0 Affluent (>$10) 2.7 3.3 16.4 19.7 57.9 All classes 38.9 23.2 24.9 6.1 6.8
2011-12 Poor (< $2) 47.1 27.7 20.6 3.2 1.4 Middle ($2-$10) 23.1 22.0 32.4 10.7 11.7
Lower-middle($2-$4) 28.8 24.9 31.9 8.0 6.3 Middle-middle($4-$6) 12.4 18.4 35.4 15.9 18.0 Upper-middle($6-$10) 6.6 10.5 29.6 18.6 34.8 Affluent (>$10) 2.0 4.4 15.5 21.4 56.7 All classes 32.2 23.8 27.0 8.0 8.9 Source: Same as A4.1.
Appendix

237
A5.1b Table: Class-wise Distribution of Literacy Level of Household Heads,
Rural India (%)
Illiterate/
Informally literate Below primary to primary school
Middle to secondary school
Higher secondary school/ diploma
Graduate and above
1999-00
Poor (< $2) 57.8 24.5 15.5 2.0 1.2 Middle ($2-$10) 33.5 25.1 28.6 6.1 6.6 Lower-middle ($2-$4) 35.5 26.1 27.6 5.4 5.4 Middle-middle ($4-$6) 21.5 19.1 35.5 9.3 14.6 Upper-middle ($6-$10) 11.7 15.0 36.9 17.7 18.6 Affluent (>$10) 18.7 16.7 33.2 10.8 20.5 All classes 51.7 24.6 18.0 3.0 2.5
2004-05
Poor (< $2) 52.4 24.8 18.8 2.7 1.3 Middle ($2-$10) 26.9 23.8 33.1 8.5 7.6 Lower-middle ($2-$4) 29.0 25.0 32.4 7.6 6.1 Middle-middle ($4-$6) 15.6 16.8 39.2 13.4 15.0 Upper-middle ($6-$10) 11.3 17.3 33.2 15.5 22.6 Affluent (>$10) 4.5 7.1 22.9 30.4 35.1 All classes 46.5 24.5 22.0 4.1 2.9
2011-12 Poor (< $2) 48.2 27.8 19.8 3.0 1.3 Middle ($2-$10) 30.8 24.4 31.1 7.7 6.0 Lower-middle ($2-$4) 33.7 25.5 29.8 6.5 4.4 Middle-middle ($4-$6) 19.9 21.2 35.4 12.4 11.1 Upper-middle ($6-$10) 13.6 16.7 39.8 13.3 16.6 Affluent (>$10) 9.0 14.3 28.0 24.7 23.9 All classes 39.7 26.1 25.2 5.4 3.7 Source: Same as A4.1.
Appendix

238
A5.1c Table: Class-wise Distribution of Literacy Level of Household Heads,
Urban India (%)
Illiterate/
Informally literate Below primary to primary school
Middle to secondary school
Higher secondary school/ diploma
Graduate and above
1999-00
Poor (< $2) 39.1 28.7 24.3 4.6 3.2 Middle ($2-$10) 12.1 17.9 34.8 12.4 22.7 Lower-middle ($2-$4) 15.9 21.9 37.1 10.8 14.3 Middle-middle ($4-$6) 5.8 11.9 33.7 14.9 33.6 Upper-middle ($6-$10) 2.5 6.4 23.1 16.8 51.0 Affluent (>$10) 3.9 2.6 13.6 13.0 66.9 All classes 21.7 21.5 30.6 9.6 16.6
2004-05
Poor (< $2) 36.4 28.5 27.9 4.4 2.7 Middle ($2-$10) 10.5 15.8 36.2 14.7 22.6 Lower-middle ($2-$4) 14.3 19.8 39.9 12.6 13.4 Middle-middle ($4-$6) 4.9 10.9 34.5 18.0 31.7 Upper-middle ($6-$10) 2.2 5.1 21.0 19.5 51.1 Affluent (>$10) 2.2 2.1 14.4 16.4 64.9 All classes 19.1 19.6 32.6 11.3 17.3
2011-12 Poor (< $2) 39.4 26.8 26.3 5.0 2.5 Middle ($2-$10) 12.4 18.7 34.2 14.9 19.7 Lower-middle ($2-$4) 18.3 23.7 36.4 11.1 10.5 Middle-middle ($4-$6) 7.4 16.5 35.4 18.1 22.5 Upper-middle ($6-$10) 3.9 8.2 25.8 20.5 41.5 Affluent (>$10) 0.6 2.6 13.3 20.8 62.7 All classes 15.8 18.7 31.1 13.8 20.6 Source: Same as A4.1.
Appendix

239
A5.2a Table: Class-wise Distribution of Primary Industry of Occupation of
Households- Rural India (%)
1999-00 Poor
(<$2) Middle
($2-$10) Lower-middle
($2-$4) Middle-Middle
($4-$6) Upper-middle
($6-$10) Affluent (>$10)
Agriculture, forestry and fishing 76.0 60.5 61.9 52.2 42.7 46.2
Mining and quarrying 0.6 0.6 0.6 0.6 0.2 0.1 Manufacturing 6.6 8.7 8.5 9.7 10.4 6.4 Electricity, gas, water supply, waste management 0.2 0.9 0.7 1.4 3.8 0.4
Construction 4.1 3.8 3.9 2.6 4.4 6.4 Trade 4.3 6.9 7.0 6.3 5.9 4.3 Transportation, food and accommodation 3.1 4.4 4.2 5.0 6.9 4.0
Finance, insurance and ICT 0.1 1.0 0.8 2.3 1.4 7.0 Real estate 0.0 0.1 0.1 0.3 0.0 0.0 Professional, scientific and technical activities 0.1 0.3 0.2 0.4 0.9 0.0
Public administration, support services, defence and social security
1.0 5.3 4.9 7.3 8.9 10.5
Education, health and social work 1.0 5.2 4.4 9.8 13.4 10.1
Other service activities (includes recreation, extraterritorial organisations and households as employers)
2.3 2.2 2.3 1.4 0.9 4.6
Appendix

240
A5.2a continued... Table: Class-wise Distribution of Primary Industry of Occupation of Households- Rural India (%)
2004-05
Poor (<$2)
Middle ($2-$10)
Lower-middle ($2-$4)
Middle-Middle ($4-$6)
Upper-middle ($6-$10)
Affluent (>$10)
Agriculture, forestry and fishing 70.6 53.9 55.9 41.6 41.7 30.6
Mining and quarrying 0.7 0.8 0.8 0.7 1.2 0.2
Manufacturing 7.4 8.8 8.3 11.8 12.2 17.0
Electricity, gas, water supply, waste management 0.1 0.8 0.7 1.5 2.7 0.3
Construction 7.2 5.5 5.7 4.4 2.5 1.9
Trade 5.2 9.2 9.1 9.7 8.9 6.2
Transportation, food and accommodation 3.8 6.4 6.4 6.9 4.3 2.6
Finance, insurance and ICT 0.2 1.4 1.2 2.6 3.9 15.6
Real estate 0.0 0.1 0.1 0.1 0.1 0.0
Professional, scientific and technical activities 0.1 0.6 0.6 1.1 1.1 2.8
Public administration, support services, defence and social security
0.9 3.8 3.5 5.7 5.2 6.0
Education, health and social work 1.2 6.4 5.5 11.5 14.1 13.9
Other service activities (includes recreation, extraterritorial organisations and households as employers)
2.3 2.0 1.9 2.1 2.0 3.0
Appendix

241
A5.2a continued... Table: Class-wise Distribution of Primary Industry of Occupation of Households- Rural India (%)
2011-12 Poor
(<$2) Middle
($2-$10) Lower-middle
($2-$4) Middle-Middle
($4-$6) Upper-middle
($6-$10) Affluent (>$10)
Agriculture, forestry and fishing 64.6 54.4 56.6 46.9 38.0 39.1
Mining and quarrying 0.5 0.5 0.5 0.7 0.6 0.8 Manufacturing 6.9 8.8 8.1 10.8 15.1 11.8 Electricity, gas, water supply, waste management 0.2 0.4 0.3 0.9 1.4 1.5
Construction 14.5 10.3 11.0 7.5 5.6 3.1 Trade 5.3 8.2 8.0 9.7 9.2 10.3 Transportation, food and accommodation 3.8 6.5 6.5 6.7 8.8 5.2
Finance, insurance and ICT 0.1 1.1 0.8 2.0 2.0 5.8 Real estate 0.0 0.1 0.1 0.2 0.3 1.2 Professional, scientific and technical activities 0.1 0.4 0.3 0.8 0.9 1.7
Public administration, support services, defence and social security
0.6 2.4 1.9 4.4 6.3 5.9
Education, health and social work 1.2 4.5 3.7 7.3 10.8 11.1
Other service activities (includes recreation, extraterritorial organisations and households as employers)
2.1 2.4 2.4 1.9 1.2 2.6
Note: Industrial classification based on NIC, 2008. Source: Same as A4.1.
Appendix

242
A5.2b Table: Class-wise Distribution of Primary Industry of Occupation of
Households- Urban India (%)
1999-00 Poor
(< $2) Middle
($2-$10) Lower-middle
($2-$4) Middle-middle
($4-$6) Upper-middle
($6-$10) Affluent (>$10)
Agriculture, forestry and fishing 12.0 4.3 5.3 2.6 1.3 2.5
Mining and quarrying 1.1 1.1 1.2 0.8 0.6 0.3 Manufacturing 21.8 22.6 22.6 24.2 19.3 22.4 Electricity, gas, water supply, waste management 1.0 1.4 1.1 2.1 1.8 1.1
Construction 13.3 5.6 6.6 3.9 2.9 4.2 Trade 19.1 18.6 19.9 16.5 14.9 8.7 Transportation, food and accommodation 14.2 12.8 14.2 10.8 8.1 7.7
Finance, insurance and ICT 1.0 4.9 3.6 6.8 9.3 10.6 Real estate 0.1 0.3 0.2 0.4 0.4 1.0 Professional, scientific and technical activities 0.6 2.0 1.5 2.6 3.8 7.9
Public administration, support services, defence and social security
5.0 14.6 12.9 16.7 20.9 19.7
Education, health and social work 3.0 7.3 5.8 9.4 13.4 12.3
Other service activities (includes recreation, extraterritorial organisations and households as employers)
7.2 4.0 4.6 2.9 3.1 1.4
Appendix

243
A5.2b continued... Table: Class-wise Distribution of Primary Industry of Occupation of Households- Urban India (%)
2004-05 Poor
(< $2) Middle
($2-$10) Lower-middle
($2-$4) Middle-middle
($4-$6) Upper-middle
($6-$10) Affluent (>$10)
Agriculture, forestry and fishing 10.2 3.8 4.7 2.3 2.4 3.0
Mining and quarrying 1.0 1.4 1.4 1.1 1.5 1.3 Manufacturing 21.8 22.2 23.4 21.8 16.7 20.9 Electricity, gas, water supply, waste management 0.7 1.4 1.3 1.5 1.6 1.2
Construction 15.1 5.8 6.7 4.1 4.0 3.0 Trade 19.8 21.0 21.5 21.2 17.8 10.0 Transportation, food and accommodation 15.9 12.9 14.3 11.4 8.5 8.0
Finance, insurance and ICT 1.1 5.8 4.0 6.8 14.1 18.0 Real estate 0.0 0.3 0.3 0.3 0.5 0.5 Professional, scientific and technical activities 1.0 2.7 2.2 2.8 5.2 8.1
Public administration, support services, defence and social security
3.7 10.7 9.2 13.6 13.7 9.6
Education, health and social work 2.3 7.8 6.4 9.4 11.9 15.1
Other service activities (includes recreation, extraterritorial organisations and households as employers)
5.5 3.2 3.5 3.0 1.5 1.1
Appendix

244
A5.2b continued... Table: Class-wise Distribution of Primary Industry of Occupation of Households- Urban India (%)
2011-12 Poor
(< $2) Middle
($2-$10) Lower-middle
($2-$4) Middle-middle
($4-$6) Upper-middle
($6-$10) Affluent (>$10)
Agriculture, forestry and fishing 11.0 4.0 5.5 2.5 1.8 1.7
Mining and quarrying 0.7 0.9 0.9 0.9 0.6 2.8 Manufacturing 19.4 21.9 21.3 25.2 18.1 13.3 Electricity, gas, water supply, waste management 0.9 1.9 1.6 2.4 2.0 2.0
Construction 18.8 8.7 11.4 6.2 4.6 4.2 Trade 19.5 20.3 21.4 19.2 18.7 11.8 Transportation, food and accommodation 15.2 13.7 14.8 13.2 11.5 7.6
Finance, insurance and ICT 1.1 5.0 2.8 5.2 11.2 25.1 Real estate 0.1 0.9 0.5 1.2 1.4 1.6 Professional, scientific and technical activities 0.3 1.7 1.1 2.5 2.2 5.0
Public administration, support services, defence and social security
2.8 8.4 6.4 9.3 13.2 10.4
Education, health and social work 2.7 7.6 5.6 8.6 11.7 12.7
Other service activities (includes recreation, extraterritorial organisations and households as employers)
7.2 5.0 6.7 3.3 2.0 1.6
Note: Industrial classification based on NIC, 2008. Source: Same as A4.1.
Appendix
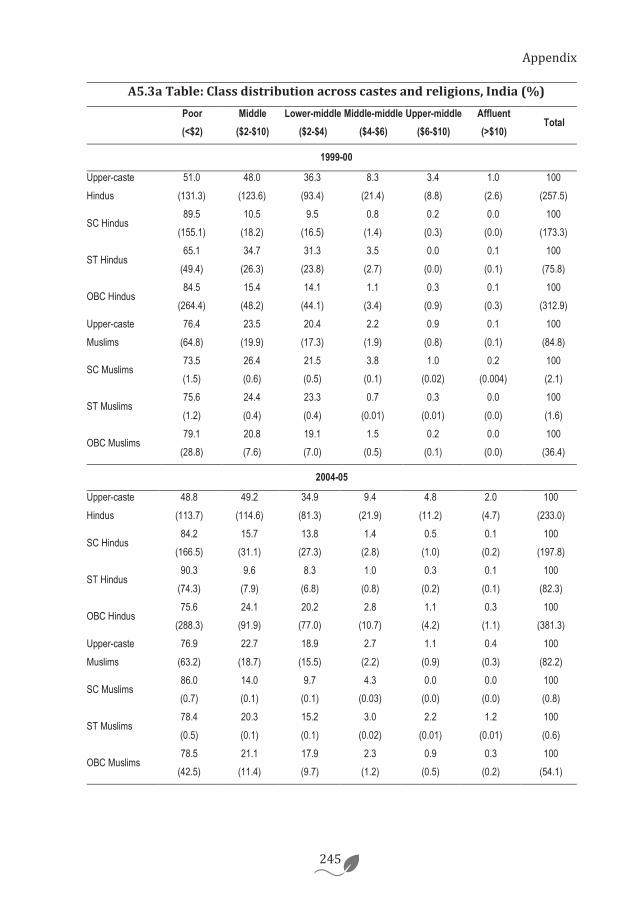
245
A5.3a Table: Class distribution across castes and religions, India (%)
Poor (<$2)
Middle ($2-$10)
Lower-middle ($2-$4)
Middle-middle ($4-$6)
Upper-middle ($6-$10)
Affluent (>$10)
Total
1999-00
Upper-caste Hindus
51.0 (131.3)
48.0 (123.6)
36.3 (93.4)
8.3 (21.4)
3.4 (8.8)
1.0 (2.6)
100 (257.5)
SC Hindus 89.5
(155.1) 10.5
(18.2) 9.5
(16.5) 0.8
(1.4) 0.2
(0.3) 0.0
(0.0) 100
(173.3)
ST Hindus 65.1
(49.4) 34.7
(26.3) 31.3
(23.8) 3.5
(2.7) 0.0
(0.0) 0.1
(0.1) 100
(75.8)
OBC Hindus 84.5
(264.4) 15.4
(48.2) 14.1
(44.1) 1.1
(3.4) 0.3
(0.9) 0.1
(0.3) 100
(312.9) Upper-caste Muslims
76.4 (64.8)
23.5 (19.9)
20.4 (17.3)
2.2 (1.9)
0.9 (0.8)
0.1 (0.1)
100 (84.8)
SC Muslims 73.5 (1.5)
26.4 (0.6)
21.5 (0.5)
3.8 (0.1)
1.0 (0.02)
0.2 (0.004)
100 (2.1)
ST Muslims 75.6 (1.2)
24.4 (0.4)
23.3 (0.4)
0.7 (0.01)
0.3 (0.01)
0.0 (0.0)
100 (1.6)
OBC Muslims 79.1
(28.8) 20.8 (7.6)
19.1 (7.0)
1.5 (0.5)
0.2 (0.1)
0.0 (0.0)
100 (36.4)
2004-05
Upper-caste Hindus
48.8 (113.7)
49.2 (114.6)
34.9 (81.3)
9.4 (21.9)
4.8 (11.2)
2.0 (4.7)
100 (233.0)
SC Hindus 84.2
(166.5) 15.7
(31.1) 13.8
(27.3) 1.4
(2.8) 0.5
(1.0) 0.1
(0.2) 100
(197.8)
ST Hindus 90.3
(74.3) 9.6
(7.9) 8.3
(6.8) 1.0
(0.8) 0.3
(0.2) 0.1
(0.1) 100
(82.3)
OBC Hindus 75.6
(288.3) 24.1
(91.9) 20.2
(77.0) 2.8
(10.7) 1.1
(4.2) 0.3
(1.1) 100
(381.3) Upper-caste Muslims
76.9 (63.2)
22.7 (18.7)
18.9 (15.5)
2.7 (2.2)
1.1 (0.9)
0.4 (0.3)
100 (82.2)
SC Muslims 86.0 (0.7)
14.0 (0.1)
9.7 (0.1)
4.3 (0.03)
0.0 (0.0)
0.0 (0.0)
100 (0.8)
ST Muslims 78.4 (0.5)
20.3 (0.1)
15.2 (0.1)
3.0 (0.02)
2.2 (0.01)
1.2 (0.01)
100 (0.6)
OBC Muslims 78.5
(42.5) 21.1
(11.4) 17.9 (9.7)
2.3 (1.2)
0.9 (0.5)
0.3 (0.2)
100 (54.1)
Appendix

246
A5.3a continued... Table: Class distribution across castes and religions, India (%)
Poor (<$2)
Middle ($2-$10)
Lower-middle ($2-$4)
Middle-middle ($4-$6)
Upper-middle ($6-$10)
Affluent (>$10) Total
2011-12 Upper-caste Hindus
26.9 (64.4)
67.7 (162.1)
42.4 (101.5)
16.4 (39.3)
8.9 (21.3)
5.5 (13.2)
100 (239.8)
SC Hindus 61.0
(132.0) 38.5
(83.3) 31.6
(68.4) 5.2
(11.3) 1.7
(3.7) 0.5
(1.1) 100
(216.4)
ST Hindus 73.2 (68.7)
26.4 (24.8)
23.0 (21.6)
2.6 (2.4)
0.9 (0.8)
0.3 (0.3)
100 (93.8)
OBC Hindus 48.2 (209.8)
50.8 (221.1)
39.4 (171.5)
8.3 (36.1)
3.1 (13.5)
1.1 (4.8)
100
(435.7)
Upper-caste Muslims
53.1 (40.6)
45.9 (35.1)
36.8 (28.2)
6.1 (4.7)
3.0 (2.3)
1.0 (0.8)
100 (76.5)
SC Muslims 61.4 (1.5)
38.6 (1.0)
34.3 (0.9)
2.6 (0.1)
1.7 (0.04)
0.0 (0.0)
100 (2.5)
ST Muslims 54.0 (1.0)
45.6 (0.8)
38.7 (0.7)
4.7 (0.1)
2.3 (0.04)
0.4 (0.01)
100 (1.8)
OBC Muslims 54.6
(45.4) 44.6
(37.1) 36.2
(30.1) 6.4
(5.3) 2.0
(1.7) 0.8
(0.7) 100
(83.2)
All figures are rounded-off. Figures in brackets are population size in million. Source: Same as Table A4.1.
Appendix
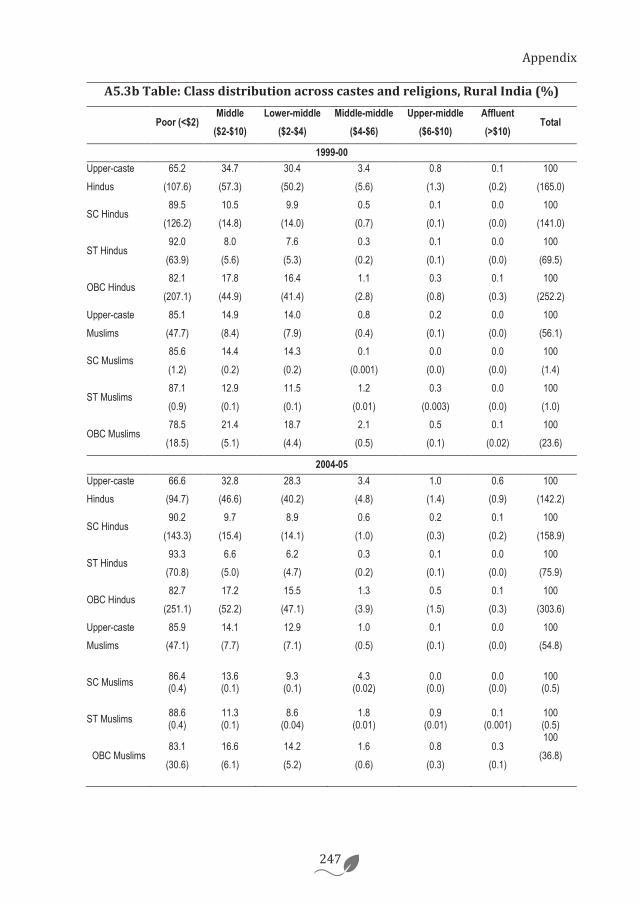
247
A5.3b Table: Class distribution across castes and religions, Rural India (%)
Poor (<$2) Middle
($2-$10) Lower-middle
($2-$4) Middle-middle
($4-$6) Upper-middle
($6-$10) Affluent (>$10)
Total
1999-00 Upper-caste Hindus
65.2 (107.6)
34.7 (57.3)
30.4 (50.2)
3.4 (5.6)
0.8 (1.3)
0.1 (0.2)
100 (165.0)
SC Hindus 89.5
(126.2) 10.5
(14.8) 9.9
(14.0) 0.5
(0.7) 0.1
(0.1) 0.0
(0.0) 100
(141.0)
ST Hindus 92.0
(63.9) 8.0
(5.6) 7.6
(5.3) 0.3
(0.2) 0.1
(0.1) 0.0
(0.0) 100
(69.5)
OBC Hindus 82.1
(207.1) 17.8
(44.9) 16.4
(41.4) 1.1
(2.8) 0.3
(0.8) 0.1
(0.3) 100
(252.2) Upper-caste Muslims
85.1 (47.7)
14.9 (8.4)
14.0 (7.9)
0.8 (0.4)
0.2 (0.1)
0.0 (0.0)
100 (56.1)
SC Muslims 85.6 (1.2)
14.4 (0.2)
14.3 (0.2)
0.1 (0.001)
0.0 (0.0)
0.0 (0.0)
100 (1.4)
ST Muslims 87.1 (0.9)
12.9 (0.1)
11.5 (0.1)
1.2 (0.01)
0.3 (0.003)
0.0 (0.0)
100 (1.0)
OBC Muslims 78.5
(18.5) 21.4 (5.1)
18.7 (4.4)
2.1 (0.5)
0.5 (0.1)
0.1 (0.02)
100 (23.6)
2004-05 Upper-caste Hindus
66.6 (94.7)
32.8 (46.6)
28.3 (40.2)
3.4 (4.8)
1.0 (1.4)
0.6 (0.9)
100 (142.2)
SC Hindus 90.2
(143.3) 9.7
(15.4) 8.9
(14.1) 0.6
(1.0) 0.2
(0.3) 0.1
(0.2) 100
(158.9)
ST Hindus 93.3
(70.8) 6.6
(5.0) 6.2
(4.7) 0.3
(0.2) 0.1
(0.1) 0.0
(0.0) 100
(75.9)
OBC Hindus 82.7
(251.1) 17.2
(52.2) 15.5
(47.1) 1.3
(3.9) 0.5
(1.5) 0.1
(0.3) 100
(303.6) Upper-caste Muslims
85.9 (47.1)
14.1 (7.7)
12.9 (7.1)
1.0 (0.5)
0.1 (0.1)
0.0 (0.0)
100 (54.8)
SC Muslims 86.4 (0.4)
13.6 (0.1)
9.3 (0.1)
4.3 (0.02)
0.0
(0.0)
0.0 (0.0)
100 (0.5)
ST Muslims 88.6 (0.4)
11.3 (0.1)
8.6 (0.04)
1.8 (0.01)
0.9 (0.01)
0.1 (0.001)
100 (0.5)
OBC Muslims 83.1
(30.6) 16.6 (6.1)
14.2 (5.2)
1.6 (0.6)
0.8 (0.3)
0.3 (0.1)
100 (36.8)
Appendix
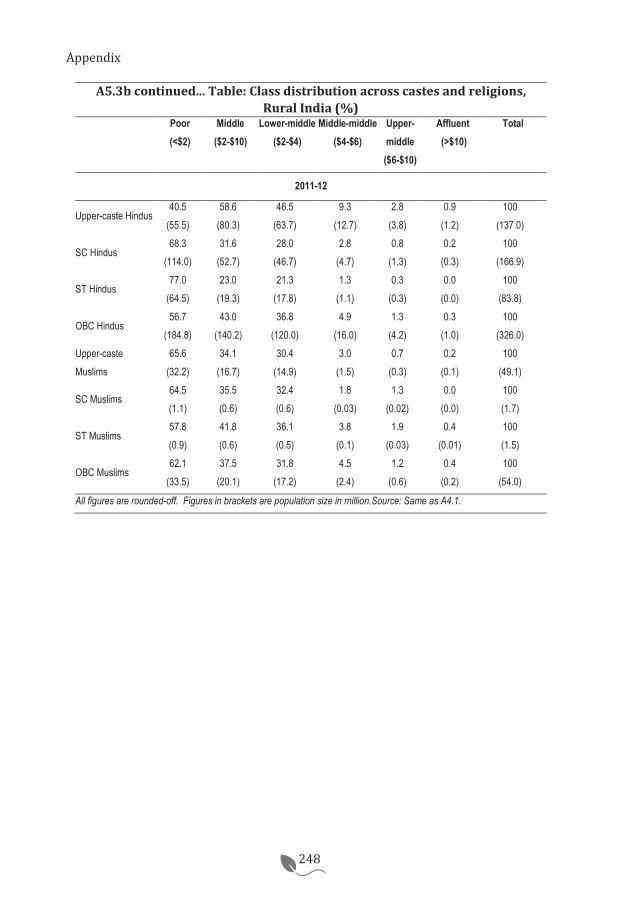
248
A5.3b continued... Table: Class distribution across castes and religions, Rural India (%)
Poor (<$2)
Middle ($2-$10)
Lower-middle ($2-$4)
Middle-middle ($4-$6)
Upper-middle ($6-$10)
Affluent (>$10)
Total
2011-12
Upper-caste Hindus 40.5
(55.5) 58.6
(80.3) 46.5
(63.7) 9.3
(12.7) 2.8
(3.8) 0.9
(1.2) 100
(137.0)
SC Hindus 68.3
(114.0) 31.6
(52.7) 28.0
(46.7) 2.8
(4.7) 0.8
(1.3) 0.2
(0.3) 100
(166.9)
ST Hindus 77.0
(64.5) 23.0
(19.3) 21.3
(17.8) 1.3
(1.1) 0.3
(0.3) 0.0
(0.0) 100
(83.8)
OBC Hindus 56.7
(184.8) 43.0
(140.2) 36.8
(120.0) 4.9
(16.0) 1.3
(4.2) 0.3
(1.0) 100
(326.0) Upper-caste Muslims
65.6 (32.2)
34.1 (16.7)
30.4 (14.9)
3.0 (1.5)
0.7 (0.3)
0.2 (0.1)
100 (49.1)
SC Muslims 64.5 (1.1)
35.5 (0.6)
32.4 (0.6)
1.8 (0.03)
1.3 (0.02)
0.0 (0.0)
100 (1.7)
ST Muslims 57.8 (0.9)
41.8 (0.6)
36.1 (0.5)
3.8 (0.1)
1.9 (0.03)
0.4 (0.01)
100 (1.5)
OBC Muslims 62.1
(33.5) 37.5
(20.1) 31.8
(17.2) 4.5
(2.4) 1.2
(0.6) 0.4
(0.2) 100
(54.0)
All figures are rounded-off. Figures in brackets are population size in million.Source: Same as A4.1.
Appendix
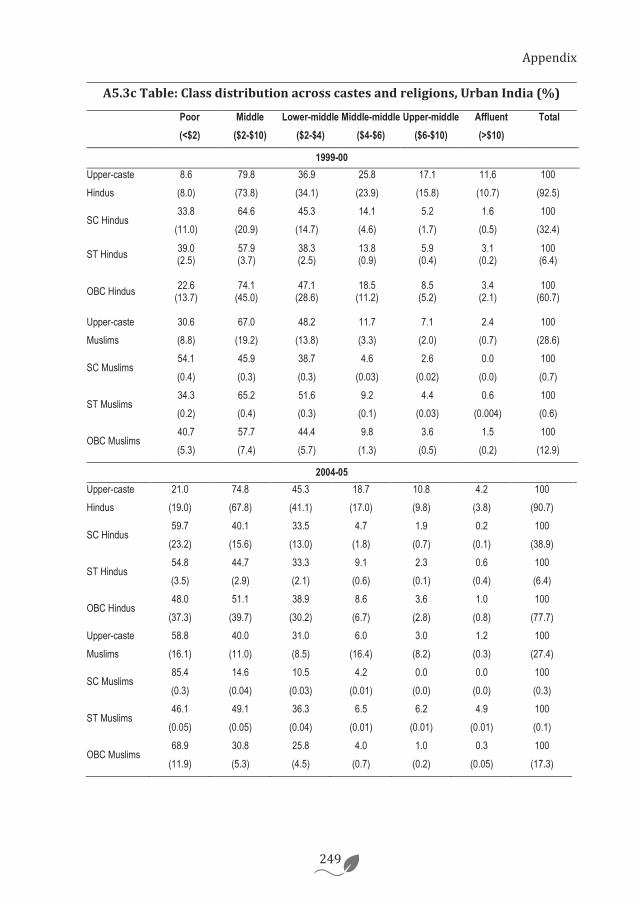
249
A5.3c Table: Class distribution across castes and religions, Urban India (%)
Poor (<$2)
Middle ($2-$10)
Lower-middle ($2-$4)
Middle-middle ($4-$6)
Upper-middle ($6-$10)
Affluent (>$10)
Total
1999-00 Upper-caste Hindus
8.6 (8.0)
79.8 (73.8)
36.9 (34.1)
25.8 (23.9)
17.1 (15.8)
11.6 (10.7)
100 (92.5)
SC Hindus 33.8
(11.0) 64.6
(20.9) 45.3
(14.7) 14.1 (4.6)
5.2 (1.7)
1.6 (0.5)
100 (32.4)
ST Hindus 39.0 (2.5)
57.9 (3.7)
38.3 (2.5)
13.8 (0.9)
5.9 (0.4)
3.1 (0.2)
100 (6.4)
OBC Hindus 22.6 (13.7)
74.1
(45.0)
47.1 (28.6)
18.5 (11.2)
8.5 (5.2)
3.4 (2.1)
100 (60.7)
Upper-caste Muslims
30.6 (8.8)
67.0 (19.2)
48.2 (13.8)
11.7 (3.3)
7.1 (2.0)
2.4 (0.7)
100 (28.6)
SC Muslims 54.1 (0.4)
45.9 (0.3)
38.7 (0.3)
4.6 (0.03)
2.6 (0.02)
0.0 (0.0)
100 (0.7)
ST Muslims 34.3 (0.2)
65.2 (0.4)
51.6 (0.3)
9.2 (0.1)
4.4 (0.03)
0.6 (0.004)
100 (0.6)
OBC Muslims 40.7 (5.3)
57.7 (7.4)
44.4 (5.7)
9.8 (1.3)
3.6 (0.5)
1.5 (0.2)
100 (12.9)
2004-05 Upper-caste Hindus
21.0 (19.0)
74.8 (67.8)
45.3 (41.1)
18.7 (17.0)
10.8 (9.8)
4.2 (3.8)
100 (90.7)
SC Hindus 59.7
(23.2) 40.1
(15.6) 33.5
(13.0) 4.7
(1.8) 1.9
(0.7) 0.2
(0.1) 100
(38.9)
ST Hindus 54.8 (3.5)
44.7 (2.9)
33.3 (2.1)
9.1 (0.6)
2.3 (0.1)
0.6 (0.4)
100 (6.4)
OBC Hindus 48.0
(37.3) 51.1
(39.7) 38.9
(30.2) 8.6
(6.7) 3.6
(2.8) 1.0
(0.8) 100
(77.7) Upper-caste Muslims
58.8 (16.1)
40.0 (11.0)
31.0 (8.5)
6.0 (16.4)
3.0 (8.2)
1.2 (0.3)
100 (27.4)
SC Muslims 85.4 (0.3)
14.6 (0.04)
10.5 (0.03)
4.2 (0.01)
0.0 (0.0)
0.0 (0.0)
100 (0.3)
ST Muslims 46.1
(0.05) 49.1
(0.05) 36.3
(0.04) 6.5
(0.01) 6.2
(0.01) 4.9
(0.01) 100 (0.1)
OBC Muslims 68.9
(11.9) 30.8 (5.3)
25.8 (4.5)
4.0 (0.7)
1.0 (0.2)
0.3 (0.05)
100 (17.3)
Appendix

250
A5.3c continued... Table: Class distribution across castes and religions, Urban India (%)
Poor (<$2)
Middle ($2-$10)
Lower-middle ($2-$4)
Middle-middle ($4-$6)
Upper-middle ($6-$10)
Affluent (>$10)
Total
2011-12
Upper-caste Hindus
8.6 (8.8)
79.8 (81.8)
36.9 (37.8)
25.8 (26.4)
17.1 (17.5)
11.6 (11.9)
100 (102.5)
SC Hindus 33.8
(15.1) 64.6
(28.8) 45.3
(20.2) 14.1 (6.3)
5.2 (2.3)
1.6 (0.7)
100 (44.6)
ST Hindus 39.0 (3.6)
57.9 (5.4)
38.3 (3.6)
13.8 (1.3)
5.9 (0.5)
3.1 (0.3)
100 (9.3)
OBC Hindus 22.6
(24.7) 74.1
(80.9) 47.1
(51.4) 18.5
(20.2) 8.5
(9.3) 3.4
(3.7) 100
(109.2)
Upper-caste Muslims
30.6 (8.4)
67.0 (18.4)
48.2 (13.2)
11.7 (3.2)
7.1 (1.9)
2.4 (0.7)
100 (27.4)
SC Muslims 54.1 (0.4)
45.9 (0.3)
38.7 (0.3)
4.6 (0.03)
2.6 (0.02)
0.0 (0.0)
100 (0.7)
ST Muslims 34.3 (0.1)
65.2 (0.2)
51.6 (0.2)
9.2 (0.03)
4.4 (0.01)
0.6 (0.002)
100 (0.3)
OBC Muslims 40.7
(11.9) 57.7
(16.9) 44.4
(13.0) 9.8
(2.9) 3.6
(1.1) 1.5
(0.4) 100
(29.3)
All figures are rounded-off. Figures in brackets are population size in million. Source: Same as A4.1.
Appendix

251

252
English Summary
Services-driven Growth and India’s Changing Socio-economic Fabric:
Emergence of a New Middle Class and the Contribution of Mumbai’s IT-eS
Industry to its Formation
Globalisation of services, together with technological advancement has
introduced new employment opportunities in India in the offshore-services
industry. India is the global leader in the provisioning of offshore services, but
there has been little rigorous research on the impact of the industry on the socio-
economic fabric of the country. This thesis examines the socio-economic impact of
the offshore-service industry in India by exploring the contribution of the
industry to a new middle class formation. It takes the case of IT-enabled services
(IT-eS) in the city of Mumbai, globally positioned in the third place among the
most attractive destinations for offshore services.
The study uses the concept of class as the central analytical tool, as it
encompasses multiple dimensions along which societies are stratified to provide a
holistic understanding of how societies function and how socio-economic
transformations take place. The theoretical framework of the research is anchored
on Bourdieu’s work, Forms of Capital. The thesis studies how the possession and
distribution of economic and cultural capitals have changed as well as how they
have further transformed into new forms of capital to give rise to the formation of
a new middle class. At a larger level, the study contributes to debates on the
developmental impact of a services-led model in emerging economies that seem to
have skipped the industrialisation phase of growth. It also contributes to recent
literature on burgeoning middle classes in developing countries, at a time when
consumer demand from western middle classes is stagnating.
English Summary

253
The thesis is divided into eight chapters, of which Chapters 4 to 7 constitute the
main body. The main body is further divided into two parts. The first part
(Chapters 4 and 5) provides evidence for the emergence of a quantitatively and
qualitatively ‘new’ middle class in India. The second part of the thesis (Chapters 6
and 7) explores the contribution of Mumbai’s IT-eS industry to such a new
middle class formation. The study uses a mixed-methods approach. The analysis
of the first part is quantitative, based on national-level household consumer
expenditure surveys, conducted during 1999-00, 2004-05 and 2011-12 by the
National Sample Survey Office (NSSO) of India. The second part draws on
qualitative and quantitative data collected by the author between the years 2012
and 2014 via semi-structured interviews and a primary survey of IT-eS employees
in Mumbai.
Quantitative and qualitative changes in India’s middle class
Defining the middle class as those whose daily per capita consumption
expenditure lies between $2 and $10 (following Banerjee and Duflo), this thesis
finds that during the period 2005 and 2012, the Indian middle class expanded
unprecedentedly from 27.9 per cent (304.2 million people) to 50.3 per cent (604.3
million people) of the country’s population. Moreover, this expansion took place
across rural and urban areas as well as in the majority of the states in India,
contradicting many existing studies that consider the new middle class in India a
purely urban phenomenon. Nonetheless, most of this growth happened at the
lower-middle class level, that is, those who spent between $2 and $4. The increase
in the level of economic capital is also reflected in the possession of objectified
cultural capital. As households enter the middle class, they tend to spend a larger
fraction of their expenditure on education, health, consumer goods and services
and a lower share on food and other basic necessities as compared to the poor.
English Summary

254
The high levels of economic and objectified cultural capital acquired by the middle
class has however not been accompanied with sufficient levels of institutionalised
and embodied cultural capital; forms of capital that take more time to accumulate.
The new entrants to the middle class are far less educated than the pre-existing
middle class and many of them are engaged in unskilled occupations. In fact, the
construction sector turned out to be the most significant driver of middle class
expansion. By contrast, traditional middle-class industries such as public services
and trade as well as modern services such as finance and IT hardly contributed to
growth in the size of the middle class. Besides education and occupation, the
ethnic composition of the new entrants to the middle class is also different from
the pre-existing one. Unlike the earlier middle class that was dominated by upper-
caste Hindus, many lower-castes as well as Muslims have managed to enter the
middle class in the recent years.
Contribution of the IT-eS Industry to a new middle class formation
The primary data collected on IT-eS employees of Mumbai shows that the
contribution of the industry to a quantitative expansion in the middle class is
quite restricted. Employment opportunities in Mumbai’s IT-eS industry are
accessible largely to workers coming from pre-existing urban middle class
families. The IT-eS industry demands the possession of institutionalised cultural
capital in the form of a university education and English-language skills, which
have historically been possessed only by the pre-existing urban middle class in
India. Subsequently, the majority of the Indian population is deprived of
opportunities to access the industry. Instead of allowing for upward class mobility
of non-middle class households, the industry thus reproduces pre-existing class
inequalities.
The contribution of the IT-eS industry to a new middle class formation lies in its
conspicuous impact in transforming the existing economic and cultural capitals of
English Summary

255
its urban middle class employees. Remuneration in the IT-eS industry is far
higher than comparable domestic industries, which places its employees in the
upper-middle and affluent categories. Furthermore, via its work culture, facilities
and ambience, the industry introduces its employees to new forms of consumption
practices and lifestyles, and brings about noticeable changes in their personalities,
transforming their objectified and embodied cultural capital. The most significant
changes are noticed in the dress sense, eating habits and modes of conveyance of
the employees. These changes entail a blend of Indian and western consumption
practices.
Services-driven growth and new middle class formation
This research thus shows that in the recent years many Indian households, in
spite of belonging to historically disadvantaged social backgrounds or coming
from rural areas, have managed to acquire sufficient levels of economic capital
that places them in the middle class. These households are however yet to possess
the level of institutionalised cultural capital accumulated by the pre-existing
middle class over a period of time. These quantitative and qualitative structural
changes in India’s contemporary middle class make it appropriate to label it as the
‘new middle class’. The lack of institutionalised cultural capital among the new
entrants to the middle class has however deprived them of accessing the attractive
employment opportunities offered by knowledge-based service industries such as
the IT-eS. New knowledge-based services are heavily reliant on new
advancements in technology and other skills such as English language that take
time to accumulate. Until these skills are acquired by the majority of the
population, services-led growth will reproduce and even widen pre-existing class
inequalities.
These results point out that most of the growth in India’s middle class has been
driven by the country’s own domestic industries, rather than on its reliance on
English Summary
256
trade in services. It is perhaps for this reason that the country has remained
resilient to the global economic slowdown and has produced a large middle class
that can potentially drive global consumer demand in the future. Indirectly,
however, the IT-eS industry appears to have boosted employment in unskilled
jobs such as that in the construction sector. The results from this thesis call for a
more nuanced and disaggregated analysis of the indirect contribution of the IT-eS
industry and in general of a services-based development model to new middle
class formation in India.

257
Nederlandse Samenvatting
De Groei van de Dienstensector en India’s Veranderende Sociaal-
economische Samenstelling: De Bijdrage van Mumbai’s IT-sector aan de
Opkomst van een Nieuwe Middenklasse
De door technologische ontwikkelingen gefaciliteerde mondialisering van de
dienstensector heeft nieuwe werkgelegenheidsmogelijkheden gebracht in de
Indiase offshore dienstensector. India is de mondiale leider in het uitvoeren van
offshore diensten, maar er ontbreekt nog diepgaand onderzoek naar de impact van
deze sector op de sociaal economische ontwikkeling van het land. Deze dissertatie
analyseert de sociaal economische invloed van de offshore dienstensector in India
door haar bijdrage in het ontstaan van een nieuwe middenklasse te onderzoeken.
De business process outsourcing sector in Mumbai– beschouwd als mondiaal de
derde meest aantrekkelijke bestemming voor offshore diensten – vormt de
empirische casus voor dit onderzoek.
Het centrale concept in dit onderzoek betreft (maatschappelijke) ‘klasse’, gezien
dat het meerdere dimensies omvat waarlangs samenlevingen gestratificeerd zijn.
Als zodanig biedt het een holistisch begrip van hoe samenlevingen functioneren
en hoe socio-economische veranderingen plaatsvinden. Het theoretisch kader van
dit onderzoek is gebaseerd op het werk van Bourdieu: Forms of Capital. In deze
dissertatie wordt bestudeerd hoe het bezit en de verdeling van economisch en
cultureel kapitaal zijn veranderd, en tevens hoe deze vormen van kapitaal verder
zijn getransformeerd tot nieuwe vormen van kapitaal die vervolgens de opkomst
van een nieuwe middenklasse hebben doen ontstaan. Op een hoger abstractie
niveau draagt dit onderzoek bij aan de debatten over de impact van een op de
dienstensector gebaseerd economisch model op de ontwikkeling van opkomende
economieën die de fase van industrialisering lijken te hebben overgeslagen. Deze

258
studie draagt tevens bij aan de recente literatuur betreffende de opkomende
middenklasse in ontwikkelende landen, in een tijd waarin het consumentisme van
de westerse middenklasse stagneert.
De dissertatie is verdeeld in acht hoofdstukken, waarvan hoofdstuk vier tot en
met zeven het empirische gedeelte omvatten. Het empirische deel van deze
dissertatie is verder opgedeeld in twee delen. Het eerste deel (hoofdstukken vier
en vijf) presenteren bewijs voor de opkomst van een kwantitatieve en kwalitatieve
‘nieuwe’ middenklasse in India. Het tweede deel (hoofdstukken zes en zeven)
verkent het aandeel van Mumbai’s IT-eS sector in de opkomst van deze ‘nieuwe’
middenklasse. In het onderzoek zijn kwantitatieve en kwalitatieve
onderzoeksmethoden toegepast. Het eerste deel omvat een kwantitatieve analyse,
gebaseerd op nationale enquêtes, betreffende huishoud uitgaven, die zijn
afgenomen tussen 1990-2000, 2004-2005 en 2011-2012 door het Indiase National
Sample Survey Office (NSSO). De tweede analyse is gebaseerd op zowel
kwantitatieve als kwalitatieve data verzameld door de auteur zelf tussen 2012 en
2014 middels semi-gestructureerde interviews en een enquête afgenomen bij IT-
eS werknemers in Mumbai.
Kwantitatieve en Kwalitatieve veranderingen in de Indiase middenklasse
Wanneer ervan wordt uitgegaan dat de middenklasse mensen omvat wiens
consumptie uitgaven per capita liggen tussen de twee en tien Amerikaanse dollar
per dag (gebaseerd op de definitie van Banerjee en Duflo), dan blijkt uit deze
dissertatie dat de Indiase middenklasse als deel van de totale bevolking tussen
2005 en 2012 is gegroeid van 27,9 procent (304.2 miljoen mensen) naar 50,3
procent (604.3 miljoen mensen). Uit de studie blijkt tevens dat deze groei plaats
vond in zowel rurale als stedelijke gebieden in de meeste staten van India. Deze
bevindingen zijn in tegenspraak met bestaande onderzoeken die beargumenteren
dat de opkomst van de nieuw middenklasse in India hoofdzakelijk een stedelijk
Nederlandse Samenvatting
259
fenomeen is. Niettemin, het overgrote deel van deze groei vond plaats aan de
‘onderkant’ van de middenklasse, dat zijn degenen met een bestedingskracht van
twee tot vier dollar per dag. De toename in het bezit van economisch kapitaal is
tevens terug te zien in het bezit van geobjectiveerd cultureel kapitaal. Op het
moment dat huishoudens toetreden tot de middenklasse zijn ze geneigd een
groter deel van hun uitgaven te besteden aan scholing, gezondheidzorg,
consumptiegoederen en diensten, en een kleiner aandeel aan voedsel en andere
basisbehoeften in vergelijking met de armere groepen in de samenleving.
De hoge mate van economisch en geobjectiveerd cultureel kapitaal, vergaard door
de middenklasse, hebben nog niet geleid tot voldoende mate van
geïnstitutionaliseerd kapitaal, vormen van kapitaal waarvan de accumulatie meer
tijd kost. De nieuwe toetreders tot de middenklasse zijn een stuk minder hoog
opgeleid dan de reeds bestaande middenklasse, en een groot deel van deze nieuwe
toetreders bevindt zich in beroepen waarvoor weinig tot geen scholing vereist is.
Het blijkt zelfs dat de bouwsector de meest significante drijvende kracht is achter
de groei van de middenklasse. De meer ‘traditionele’ middenklasse activiteiten en
banen zoals in publieke diensten, handel, financiële diensten en IT blijken
nauwelijks bij te dragen aan de groei van de middenklasse. Naast het verschil in
opleiding en beroep, blijkt ook de etnische samenstelling van de nieuwe toetreders
tot de middenklasse te verschillen van de reeds bestaande middenklasse. Hoewel
de middenklasse voorheen voornamelijk bestond uit Hindoes uit de hogere kasten,
treden nu steeds vaker ook personen uit de lagere kasten en Moslims toe tot de
middenklasse.
Het aandeel van de IT-eS sector in de totstandkoming van een nieuwe
middenklasse
De primaire data die is verzameld over IT-eS werknemers in Mumbai toont dat
het aandeel van de sector in een kwantitatieve groei van de middenklasse redelijk
Nederlandse Samenvatting

260
beperkt is. Werkgelegenheidskansen in de IT-eS sector in Mumbai zijn vooral
toegankelijk voor werknemers die afkomstig zijn uit reeds bestaande stedelijke
middenklassenfamilies. De IT-eS sector vereist de beschikking over
geïnstitutionaliseerd cultureel kapitaal in de vorm van een universiteitsopleiding
en Engelse vaardigheden, die historisch gezien vooral in het bezit zijn van de
stedelijke middenklasse in India. Hierdoor wordt de meerderheid van de
bevolking de kans op toegang tot deze economische sector ontnomen. In plaats
van dat lagere middenklasse huishoudens de kans hebben op opwaartse mobiliteit
in de middenklasse, reproduceert de sector de reeds bestaande
klassenongelijkheden.
De bijdrage van de IT-eS sector in de totstandkoming van de nieuwe
middenklasse zit in de duidelijke impact op het economische en culturele kapitaal
van de werknemers uit de stedelijke middenklasse. Het loon in de IT-eS sector is
aanzienlijk hoger dan vergelijkbare binnenlandse industrieën, waardoor de
werknemers in deze sector tot het bovenste deel van de middenklasse behoren.
Middels de arbeidscultuur, faciliteiten en werksfeer introduceert deze sector
nieuwe consumptiepatronen en levensstijlen, en brengt het duidelijke
veranderingen teweeg in de persoonlijkheden van de werknemers, waardoor hun
geobjectiveerde culturele kapitaal veranderd. De belangrijkste veranderingen zijn
zichtbaar in de manier van kleden, eetgewoonten en vormen van transport van de
werknemers. Al deze veranderingen omvatten een mix van Indiase en westerse
consumptiepraktijken.
Dienstensector groei en de totstandkoming van een nieuwe middenklasse
Samenvattend toont dit onderzoek dat in de afgelopen jaren Indiase huishoudens
met sociaal economische achterstanden erin geslaagd zijn om een aanzienlijke
hoeveelheid economisch kapitaal te vergaren waardoor zij nu tot de middenklasse
behoren. Echter, deze huishoudens bezitten nog geen aanzienlijke mate van
Nederlandse Samenvatting

261
geïnstitutionaliseerd cultureel kapitaal, zoals de reeds bestaande middenklasse dat
over een periode van tijd heeft vergaard. Deze kwantitatieve en kwalitatieve
structurele veranderingen in de hedendaagse middenklasse van India leiden ertoe
dat deze groep de ‘nieuwe middenklasse’ genoemd kan worden. Het gebrekkige
geïnstitutionaliseerde cultureel kapitaal van de nieuwe leden van de middenklasse
heeft er echter voor gezorgd dat deze groep beperkte toegang heeft tot
aantrekkelijke werkgelegenheidskansen in de op kennis intensieve
dienstensectoren zoals IT-eS. Nieuwe op kennis intensieve diensten zijn in grote
mate afhankelijke van nieuwe technologische ontwikkelingen en andere
vaardigheden zoals beheersing van de Engelse taal, wat tijd kost om te vergaren.
Totdat het merendeel van de bevolking deze vaardigheden bezit, zal op diensten
gebaseerde economische groei reeds bestaande klassenongelijkheden
reproduceren en zelfs vergroten.
Deze resultaten tonen dat het grootste deel van de groei van de middenklasse in
India wordt gedreven door de binnenlandse sectoren, in plaatst van dat het
afhankelijk is van de internationaal georiënteerde dienstensector. Het zou kunnen
dat het land hierdoor veerkrachtig is gebleven ten tijde van de wereldwijde
economische crisis. Daarnaast gaat deze middenklasse in toenemende mate op
wereldniveau een belangrijke rol spelen als consumentengroep en potentiele
afzetmarkt voor multinationals. Hiernaast heeft de IT-eS sector de
werkgelegenheid in banen waarvoor geen of weinig scholing vereist is (zoals de
bouwsector) indirect doen groeien. De resultaten in deze dissertatie pleiten voor
een genuanceerdere en separate analyse van zowel het indirecte aandeel van de
IT-eS sector als het op diensten gebaseerde economische groeimodel wat betreft
de totstandkoming van de nieuwe middenklasse in India.
Nederlandse Samenvatting

262


The emergence of the offshore-services industry is claimed to have significantly altered the socio-economic fabric of India, giving rise to the formation of a ‘new’ middle class. This thesis explores the contribution of Mumbai’s offshore-services industry to a new middle class formation, in the broader context of the rise of such a class in India in general. The concept of class is used as the central analytical tool as it encompasses multiple dimensions along which societies are stratified to provide a holistic understanding of how societies function and how socio-economic transformations take place. The theoretical framework of this thesis is anchored on Bourdieu’s Forms of Capital. It studies changes in the possession and distribution of economic and cultural capitals and their conversion into new forms of capital in India in general, along with the specific role of offshore-services in bringing about such a transformation.
Mind Design • www.mindesign.in