ux metrics: deriving country-specific usage patterns of a
TRANSCRIPT
HAL Id: hal-01717221https://hal.inria.fr/hal-01717221
Submitted on 26 Feb 2018
HAL is a multi-disciplinary open accessarchive for the deposit and dissemination of sci-entific research documents, whether they are pub-lished or not. The documents may come fromteaching and research institutions in France orabroad, or from public or private research centers.
L’archive ouverte pluridisciplinaire HAL, estdestinée au dépôt et à la diffusion de documentsscientifiques de niveau recherche, publiés ou non,émanant des établissements d’enseignement et derecherche français ou étrangers, des laboratoirespublics ou privés.
Distributed under a Creative Commons Attribution| 4.0 International License
UX Metrics: Deriving Country-Specific Usage Patternsof a Website Plug-In from Web Analytics
Florian Lachner, Florian Fincke, Andreas Butz
To cite this version:Florian Lachner, Florian Fincke, Andreas Butz. UX Metrics: Deriving Country-Specific Usage Pat-terns of a Website Plug-In from Web Analytics. 16th IFIP Conference on Human-Computer Inter-action (INTERACT), Sep 2017, Bombay, India. pp.142-159, �10.1007/978-3-319-67687-6_11�. �hal-01717221�
UX Metrics: Deriving Country-Specific Usage Patternsof a Website Plug-in From Web Analytics
Florian Lachner, Florian Fincke, and Andreas Butz
LMU Munich, Human-Computer Interaction GroupAmalienstr. 17, 80333 Munich, Germany{florian.lachner,butz}@[email protected]
Abstract. Metrics for User Experience (UX) often involve traditional usabilityaspects, such as task success, but also mental aspects, such as interpretation andmeaning. The actual experience of a user also highly depends on personal charac-teristics, such as the social and cultural background. In this paper, we investigatethe relation between users’ country of origin and their interaction patterns withan e-commerce website plug-in. We used a quantitative web analytics approachbased on six UX-related metrics to evaluate the applicability of a quantitative UXevaluation approach in an international context. In a 34 day study we analyzedthe usage patterns of 5.843 French, 2.760 German, and 5.548 Italian websitevisitors and found that they show significantly different patterns. This indicatesthat website metrics are a suitable means for cost-effective UX analysis on a largescale, which can provide valuable starting points for a further in-depth analysis.
Keywords: User experience; cross-cultural design; user tracking; data logging;interfaces; globalization; localization
1 Introduction
The theory of User Experience (UX) goes back to the consideration of pleasure andemotions as part of a product’s characteristics. Early approaches emerged from a user-centered design perspective, and the awareness of human factor professionals that usersatisfaction is insufficiently considered in the concept of usability [26]. The considerationof pleasure and emotions was further increased by the focus on the interplay betweenaffect and cognition. Due to this enhanced view on product design and development,aesthetics, pleasure, and usability became a balanced triad in the HCI community [40].
Nowadays, the primary goal of UX designers and engineers often is to create apleasurable interaction between the user and the product that goes beyond traditionalusability considerations [19]. It also has become common ground in the HCI com-munity that experiences are subjective in nature and highly dependent on the usagecontext [24,32]. Hence, a user’s experiences can be shaped and influenced based on hisor her individual preferences (regarding aesthetics or ergonomics), mood, prior interac-tions, product brand, age, gender, and culture [7,12,16,29,30,34,42,51,52]. The culturalaspect becomes particularly interesting for global businesses, whose products or servicescan be accessed, evaluated, and purchased from all over the world [17,37,46,61].
2 Lachner et al. 2017
In order to ensure the intended quality of UX, measurement tools and methodsrepresent a crucial resource in UX design and research processes. However, there is stillan ongoing debate about the applicability and effectiveness of qualitative and quantitativeapproaches for UX measurement [6,33,57]. Furthermore, researchers and designers haveto balance information value, cost efficiency, and expenditure of time when gatheringattitudinal (e.g., through lab studies or surveys) or behavioral data (e.g., through datalogging or time measurement) [50,55,56].
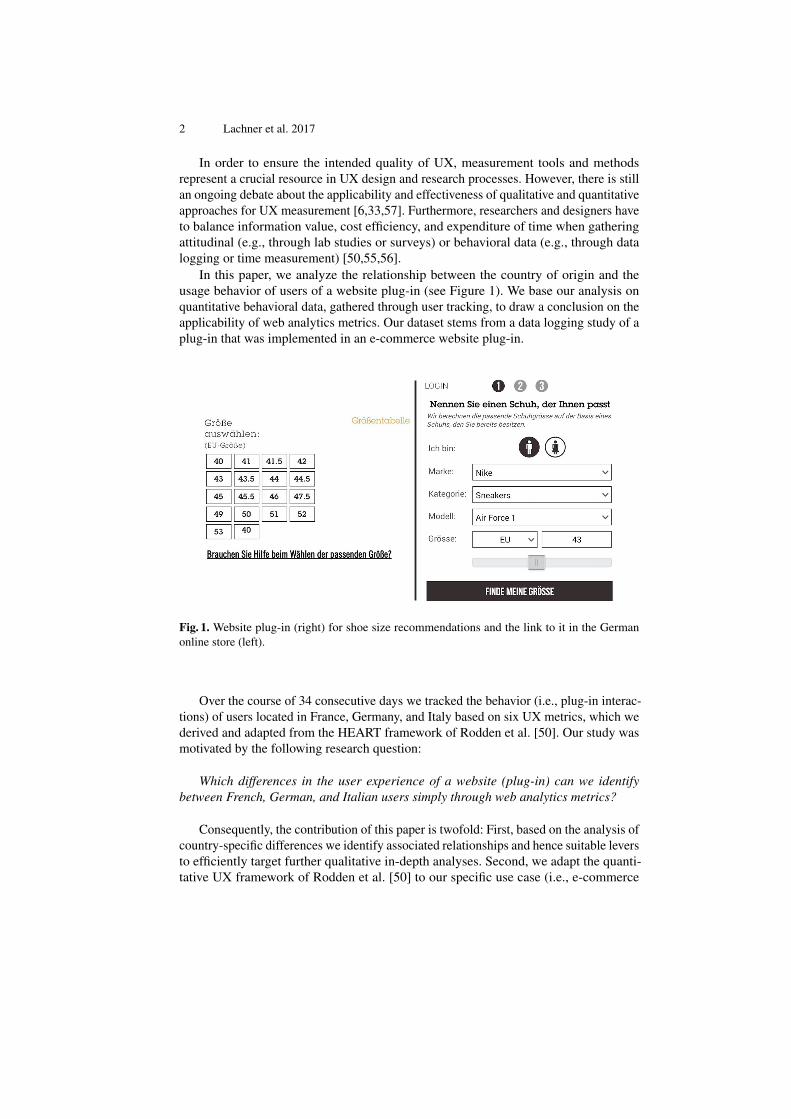
In this paper, we analyze the relationship between the country of origin and theusage behavior of users of a website plug-in (see Figure 1). We base our analysis onquantitative behavioral data, gathered through user tracking, to draw a conclusion on theapplicability of web analytics metrics. Our dataset stems from a data logging study of aplug-in that was implemented in an e-commerce website plug-in.
Fig. 1. Website plug-in (right) for shoe size recommendations and the link to it in the Germanonline store (left).
Over the course of 34 consecutive days we tracked the behavior (i.e., plug-in interac-tions) of users located in France, Germany, and Italy based on six UX metrics, which wederived and adapted from the HEART framework of Rodden et al. [50]. Our study wasmotivated by the following research question:
Which differences in the user experience of a website (plug-in) can we identifybetween French, German, and Italian users simply through web analytics metrics?
Consequently, the contribution of this paper is twofold: First, based on the analysis ofcountry-specific differences we identify associated relationships and hence suitable leversto efficiently target further qualitative in-depth analyses. Second, we adapt the quanti-tative UX framework of Rodden et al. [50] to our specific use case (i.e., e-commerce
UX Metrics: Deriving Country-Specific Usage Patterns From Web Analytics 3
website plug-in) in order to examine the applicability of UX metrics that build uponlarge-scale website tracking data. Ultimately, we draw a conclusion how such a quanti-tative approach can support designers in saving time and money for cross-cultural UXevaluation and potentially localized interface adaptions. For our analysis, we, therefore,exclude a supplemental investigation of further factors, such as gender differences ordevice type. Our underlying goal is to foster an ongoing debate about cross-cultural UXdesign and about an appropriate balance of qualitative and quantitative UX measurement.
2 Background and Related Work
Despite the general agreement on its importance for human-centered design, researchersand practitioners still struggle to narrow down the broad field of UX to one unifieddefinition [20]. The lack of a common definition of UX entails a large variety of researchdirections in the field of HCI, with foci ranging from usability to psychological needsand emotions [6,32]. To locate our work in this ongoing discourse, the following sec-tions illustrate the basic scope of (our understanding of) UX, some key aspects of UXmeasurement, as well as related work in the field of cross-cultural UX design.
2.1 The Scope of User Experience
The main difference between usability and UX is that UX researchers and designerscan not merely focus on a product’s characteristics (i.e., functionality, purpose, etc.)but also have to consider the user’s needs and motivation as well as the context of use(i.e., the environment) [9,13,19,24,38]. Consequently, experiences do not only resultfrom interacting with a product but also from a user’s expectations, others’ opinions, orfrom experiences with related technologies before the actual interaction. At the sametime, experiences and associated feelings merely evolve over time through reflection onprevious interactions, advertisements, and again through others’ opinions [24,27,35,52].
The scope of UX becomes even more complex for globally acting businesses: First,the concept of UX is differently understood between academia and industry as well asbetween different countries [31,32]. Second, cultural differences in language, values,or needs raise various questions regarding the suitability of globally optimal or locallyadapted designs of products and services [4,37,59].
In this paper, our goal is to analyze cultural differences in UX design. For thispurpose, we simplify the origin of cultural differences to individual preferences causedby one’s country of origin. Thus, we do not focus on further cultural allocations, suchas age group or social background. Furthermore, UX in our context shall include bothusability aspects as well as mental aspects, such as the interpretation of an e-commercewebsite plug-in. In order to answer our research question, we will, therefore, derivesuitable web analytics metrics, which we call UX metrics.
2.2 Cross-Cultural Differences in UX Design
The need for cross-cultural considerations in interface design emerged more than twocenturies ago, shortly after designers started to put an emphasis on the usability aspects of
4 Lachner et al. 2017
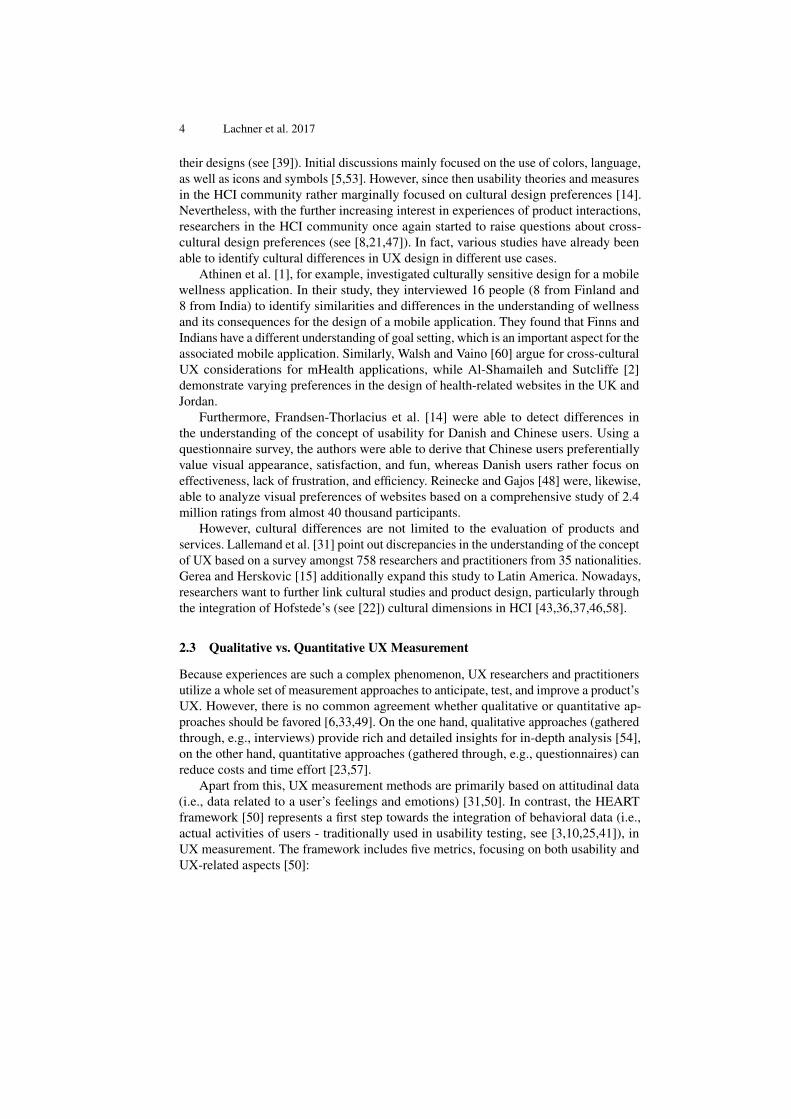
their designs (see [39]). Initial discussions mainly focused on the use of colors, language,as well as icons and symbols [5,53]. However, since then usability theories and measuresin the HCI community rather marginally focused on cultural design preferences [14].Nevertheless, with the further increasing interest in experiences of product interactions,researchers in the HCI community once again started to raise questions about cross-cultural design preferences (see [8,21,47]). In fact, various studies have already beenable to identify cultural differences in UX design in different use cases.
Athinen et al. [1], for example, investigated culturally sensitive design for a mobilewellness application. In their study, they interviewed 16 people (8 from Finland and8 from India) to identify similarities and differences in the understanding of wellnessand its consequences for the design of a mobile application. They found that Finns andIndians have a different understanding of goal setting, which is an important aspect for theassociated mobile application. Similarly, Walsh and Vaino [60] argue for cross-culturalUX considerations for mHealth applications, while Al-Shamaileh and Sutcliffe [2]demonstrate varying preferences in the design of health-related websites in the UK andJordan.
Furthermore, Frandsen-Thorlacius et al. [14] were able to detect differences inthe understanding of the concept of usability for Danish and Chinese users. Using aquestionnaire survey, the authors were able to derive that Chinese users preferentiallyvalue visual appearance, satisfaction, and fun, whereas Danish users rather focus oneffectiveness, lack of frustration, and efficiency. Reinecke and Gajos [48] were, likewise,able to analyze visual preferences of websites based on a comprehensive study of 2.4million ratings from almost 40 thousand participants.
However, cultural differences are not limited to the evaluation of products andservices. Lallemand et al. [31] point out discrepancies in the understanding of the conceptof UX based on a survey amongst 758 researchers and practitioners from 35 nationalities.Gerea and Herskovic [15] additionally expand this study to Latin America. Nowadays,researchers want to further link cultural studies and product design, particularly throughthe integration of Hofstede’s (see [22]) cultural dimensions in HCI [43,36,37,46,58].
2.3 Qualitative vs. Quantitative UX Measurement
Because experiences are such a complex phenomenon, UX researchers and practitionersutilize a whole set of measurement approaches to anticipate, test, and improve a product’sUX. However, there is no common agreement whether qualitative or quantitative ap-proaches should be favored [6,33,49]. On the one hand, qualitative approaches (gatheredthrough, e.g., interviews) provide rich and detailed insights for in-depth analysis [54],on the other hand, quantitative approaches (gathered through, e.g., questionnaires) canreduce costs and time effort [23,57].
Apart from this, UX measurement methods are primarily based on attitudinal data(i.e., data related to a user’s feelings and emotions) [31,50]. In contrast, the HEARTframework [50] represents a first step towards the integration of behavioral data (i.e.,actual activities of users - traditionally used in usability testing, see [3,10,25,41]), inUX measurement. The framework includes five metrics, focusing on both usability andUX-related aspects [50]:
UX Metrics: Deriving Country-Specific Usage Patterns From Web Analytics 5
– Happiness: referring to, e.g., satisfaction and ease of use.– Engagement: describing the user’s level of involvement.– Adoption: addressing customer acquisition.– Retention: analyzing recurring users.– Task success: covering traditional usability aspects.
The framework does not aim to describe UX as a whole but to strategically direct UXmeasurement processes based on large-scale data, particularly when working in teams.Therefore, one has to define a suitable measurement goal and approach per metric (e.g.,the number of visits per week for Engagement, the error rate for Task success) dependingon the respective product or service.
We understand their approach as an initial step towards including behavioral datafrom usability testing in UX measurement. Therefore, we aim to evaluate its applicabilityfor our use case, i.e., the analysis of UX-related, country-specific usage patterns ofFrench, German, and Italian users from web analytics. However, to ensure a suitableimplementation of UX metrics in our collaboration partner’s development process, weslightly customized our UX metrics based on the HEART framework.
3 Methodology and User Study
In order to examine the applicability of UX-oriented web analytics metrics for iden-tifying country-specific user behaviors, we partnered with a company that provides acustomizable website plug-in for online shoe stores. The plug-in allows customers toidentify their correct shoe size based on the comparison with the size of another model.
3.1 Setting and Procedure
For our study, we tracked the plug-in interactions of a globally acting online shoestore. The analyzed plug-in (see Figure 1 right) is integrated in the store’s website andaccessible through a link below the actual selection of the shoe size (see Figure 1 left).The overall goal of the plug-in is that customers can enter information about a shoe thatthey already own in order to identify the correct size of the shoe they want to buy. Toensure a problem-free implementation in different countries, the plug-in was translatedby professional translators for all countries.
Once a customer clicks on the link, the plug-in opens and asks for the customer’sgender as well as the brand, category, model, and size of a comparative shoe (i.e., plug-insteps one to five). This information is used to identify the correct size for the customerdepending on the shape and differences in size of the desired shoe. The comparativedata is taken from our partner’s internal database. As a sixth plug-in step, users canrequest (i.e., click) a shoe size recommendation. After receiving all the information, therecommended size is stored for 90 days and additionally displayed within the link’s textlabel once a customer accesses the online store again. Thus, it is not necessary to openand use the plug-in repeatedly.
For post-hoc analysis, all tracked data points (plug-in openings, plug-in interactions,recommendation requests, and adding products to the website shopping cart) were
6 Lachner et al. 2017
anonymized and securely stored at our partner’s server infrastructure for long-termevaluations through client-based tracking. Client-based tracking (i.e., Javascript-basedfor plug-in interactions and cookie-based tracking for long-term analysis of recurringusers) was pursued to minimize data traffic in order to ensure a smooth and pleasant plug-in implementation. Shoe recommendations were tracked through server-based tracking.The country of origin was identified by the client’s IP address.
3.2 Study Data and Analysis
Observations. We ran our study for 34 consecutive days. During this time, no specialoffer or promotion was announced at the client’s online store in order to ensure thecomparability of our analysis. Over the course of our study people from 200 countriesvisited the client’s website, whereof people from 121 countries accessed the plug-in.For our investigation we focused on France, Germany, and Italy (277,551, 141,897, and172,887 website loadings leading to 5843, 2760, and 5548 plug-in openings, respectively).Overall, about one third (31,4% in France, 30,4% in Germany, and 37,2% in Italy) of allwebsite visitors per country accessed the website on a mobile device, two thirds (68,6%in France, 69,6% in Germany, and 62,8% in Italy) on a desktop device.
UX metrics. Our quantitative analysis of the plug-in interactions was based on sixmetrics (see Table 1) that we derived and adapted from the HEART framework [50].Our metrics were consciously labeled with a distinguishing term in order to highlightthe objective of each metric. Furthermore, the particular term allowed our collaborationpartner to align strategic initiatives and development efforts.
Table 1. UX metrics used for the analysis of plug-in interactions.
UX Metric Definition and Objective see HEART [50]
Adoption No. of openings (link clicks) to measure user acquisition AdoptionComplexity Time per data input to analyze complexity per plug-in step EngagementTask Success No. of total recommendations to track plug-in effectiveness Task SuccessContinuity No. of successful inputs per step to retrace plug-in continuity Task SuccessTrust No. of recommended orders to derive trust in suggestions HappinessMastery No. of suggested orders without plug-in opening (recurring Retention
users) to derive long-term trust
First of all, we tracked the user Adoption, i.e., the number of users that click on thelink to the plug-in as well as the Complexity of the plug-in (based on the process timeper plug-in step). In order to analyze the effectiveness of the plug-in, we defined thetwo metrics, Task Success (overall number of final recommendations) and Continuity(successful completions per plug-in step). These four metrics describe usability aspectsof the plug-in.
For the interaction with the online shoe store plug-in, we wanted the associatedUX to be a pleasant interaction with the service that results in a trustworthy shoe size
UX Metrics: Deriving Country-Specific Usage Patterns From Web Analytics 7
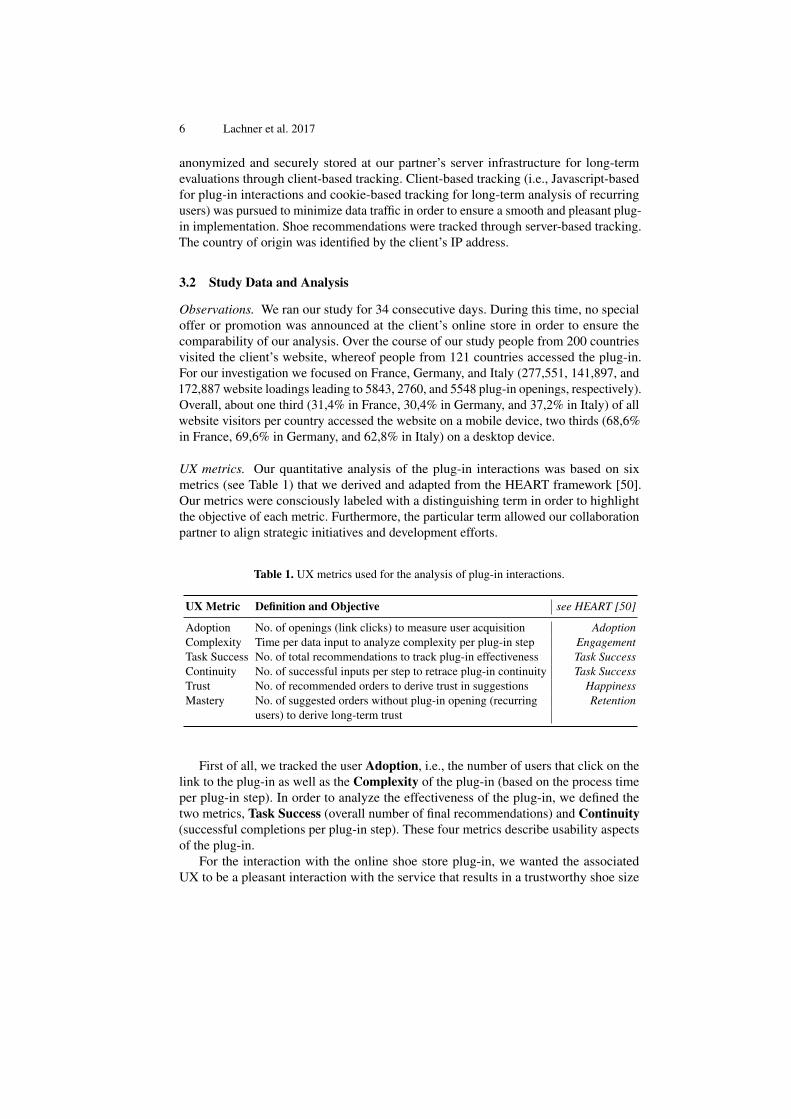
recommendation. The goal of the plug-in recommendation, therefore, is that customersidentify the correct size of a shoe and trust the plug-in even when the recommendationdiffers from the size of the comparative shoe. An additional feature of the plug-in is thatthe recommended shoe size is stored and shown in the plug-in link when users completeall plug-in steps and access the website again within 90 days (see Figure 2).
Fig. 2. Link (in the German online store) to the plug-in without recommendation (left) and withrecommendation for recurring users (right).
Against this background, we defined the metric Trust to understand if users relyon the shoe size recommendation of the plug-in (i.e., put the recommended shoe sizeinto the website’s shopping cart). We, therefore, only considered users who ordered arecommended shoe size that differed from the initially entered size of the comparativeshoe and excluded users whose recommended size corresponded to the size of theselected comparative shoe. Thus, we could evaluate if users clearly relied on the plug-in’s recommendation. We adapted the metric happiness from the HEART framework toour use case as it was not desired to establish a direct communication with the user. Allusers who successfully clicked through all steps received a recommendation whereas wedefined a pleased user as a user that relied on the recommended size for his/her final order.In order to draw conclusions on the long-term experience with the recommendationservice, we defined the metric Mastery. This metric refers to the number of orders (ofrecommended shoe sizes) from recurring users that did not open the plug-in again butrelied on the suggestion of a suitable size based on their previously entered information.The information was stored in a client-side cookie for 90 days as described before. Forthis purpose, the recommended shoe size was shown in the link’s text label. Once again,we only considered orders that included differing shoe sizes.
All in all, we see these metrics as suitable measuring points for the UX evaluationof equivalent recommendation plug-ins (with the objective to minimize recurring inter-actions) in an e-commerce context. In further use cases, researchers and designers willhave to question their generalization and adapt the metrics accordingly (e.g., when arepetitious interaction is aspired).
8 Lachner et al. 2017
Data analysis. We conducted a statistical analysis (using SPSS version 20.0) to identifyvarying usage behaviors between French, German, and Italian users. We used the Chi-Square Test in order to analyze the association between the country and the UX metricsof Adoption, Task Success, Continuity, Trust, and Mastery. In order to evaluate the UXmetric Complexity we used two-way ANOVA and post-hoc Sidak as well as an ANOVAtest. We excluded outliers in the process times for the analysis of the metric Complexityaccording to Grubbs [18]. An identified outlier was also excluded from the analysisof previous plug-in steps to ensure consistency within our results. For all analyses wedefined a significance level of 5%.
4 Results
The analysis of our data set using the previously defined UX metrics yielded a numberof differences in the usage behaviours of the website plug-in between French, German,and Italian users. Thus, we were able to derive significant differences in the adoptionrate, dropout rate per plug-in step, the temporal usage patterns, and the reliance onrecommendations as described below.
4.1 Country-specific Adoption, Dropout, and Recommendation Rate
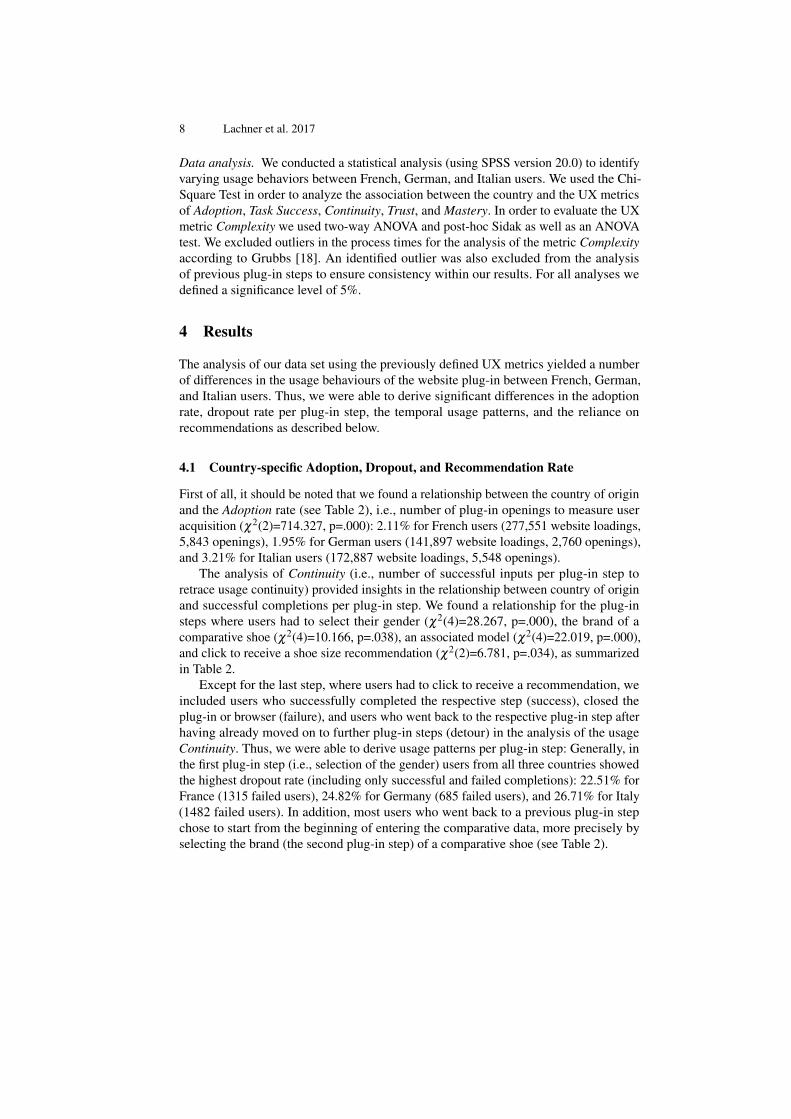
First of all, it should be noted that we found a relationship between the country of originand the Adoption rate (see Table 2), i.e., number of plug-in openings to measure useracquisition (χ2(2)=714.327, p=.000): 2.11% for French users (277,551 website loadings,5,843 openings), 1.95% for German users (141,897 website loadings, 2,760 openings),and 3.21% for Italian users (172,887 website loadings, 5,548 openings).
The analysis of Continuity (i.e., number of successful inputs per plug-in step toretrace usage continuity) provided insights in the relationship between country of originand successful completions per plug-in step. We found a relationship for the plug-insteps where users had to select their gender (χ2(4)=28.267, p=.000), the brand of acomparative shoe (χ2(4)=10.166, p=.038), an associated model (χ2(4)=22.019, p=.000),and click to receive a shoe size recommendation (χ2(2)=6.781, p=.034), as summarizedin Table 2.
Except for the last step, where users had to click to receive a recommendation, weincluded users who successfully completed the respective step (success), closed theplug-in or browser (failure), and users who went back to the respective plug-in step afterhaving already moved on to further plug-in steps (detour) in the analysis of the usageContinuity. Thus, we were able to derive usage patterns per plug-in step: Generally, inthe first plug-in step (i.e., selection of the gender) users from all three countries showedthe highest dropout rate (including only successful and failed completions): 22.51% forFrance (1315 failed users), 24.82% for Germany (685 failed users), and 26.71% for Italy(1482 failed users). In addition, most users who went back to a previous plug-in stepchose to start from the beginning of entering the comparative data, more precisely byselecting the brand (the second plug-in step) of a comparative shoe (see Table 2).
UX Metrics: Deriving Country-Specific Usage Patterns From Web Analytics 9
Table 2. Chi-Square results (χ2) based on the UX metrics Adoption, Continuity, Task Success,Trust, and Mastery for French (FRA), German (GER), and Italian (ITA) users.
UX metric Plug-In Step Country of Originχ2 Cramer’s V
FRA GER ITA Total
AdoptionSuccess 5843 2760 5548 14.151
714.327 .035Failure 271.708 139.137 167.339 578.184Total 277.551 141.897 172.887 592.335 p=.000
Continuity
Gender
Success 4528 2075 4066 10,66928.267 .032Failure 1315 685 1482 3482
Detour 14 8 19 41Total 5857 2768 5567 14,192 p=.000
Brand
Success 4105 1917 3733 975510.166 .022Failure 183 72 134 389
Detour 320 120 308 748Total 4608 2109 4175 10.892 p=.038
Category
Success 3908 1797 3540 92454.218 n.s.Failure 312 155 283 750
Detour 178 87 196 461Total 4398 2039 4019 10.456 p=.377
Model
Success 3354 1516 2906 777622.019 .034Failure 664 325 728 1717
Detour 27 18 44 89Total 4045 1859 3678 9582 p=.000
Size
Success 3159 1417 2698 72748.256 n.s.Failure 213 108 228 549
Detour 6 4 12 22Total 3378 1529 2938 7845 p=.083
Rec.Success 3038 1350 2560 6948
6.781 .031Failure 125 70 145 340Total 3163 1420 2705 7288 p=.034
Task SuccessOpenings 5843 2760 5548 14.151
13.332 .025Rec. 3038 1350 2560 6948Total 8881 4110 8108 21.099 p=.001
TrustYes 10 3 9 22
21.232 .193No 381 113 53 547Total 391 116 62 569 p=.000
MasteryYes 158 17 103 278
42.130 .136No 1094 421 500 2015Total 1252 438 603 2293 p=.000
10 Lachner et al. 2017
In addition, we were able to identify a relationship of Task Success (i.e., numberof total recommendations to understand plug-in effectiveness) and country of origin(χ2(2)=13.332, p=.001). Users from France showed the highest rate of successful rec-ommendations (52% out of 5843 plug-in openings), followed by Germany (49% out of2760 plug-in openings), and Italy (46% out of 5548 plug-in openings).
4.2 Divergent Temporal Usage Patterns
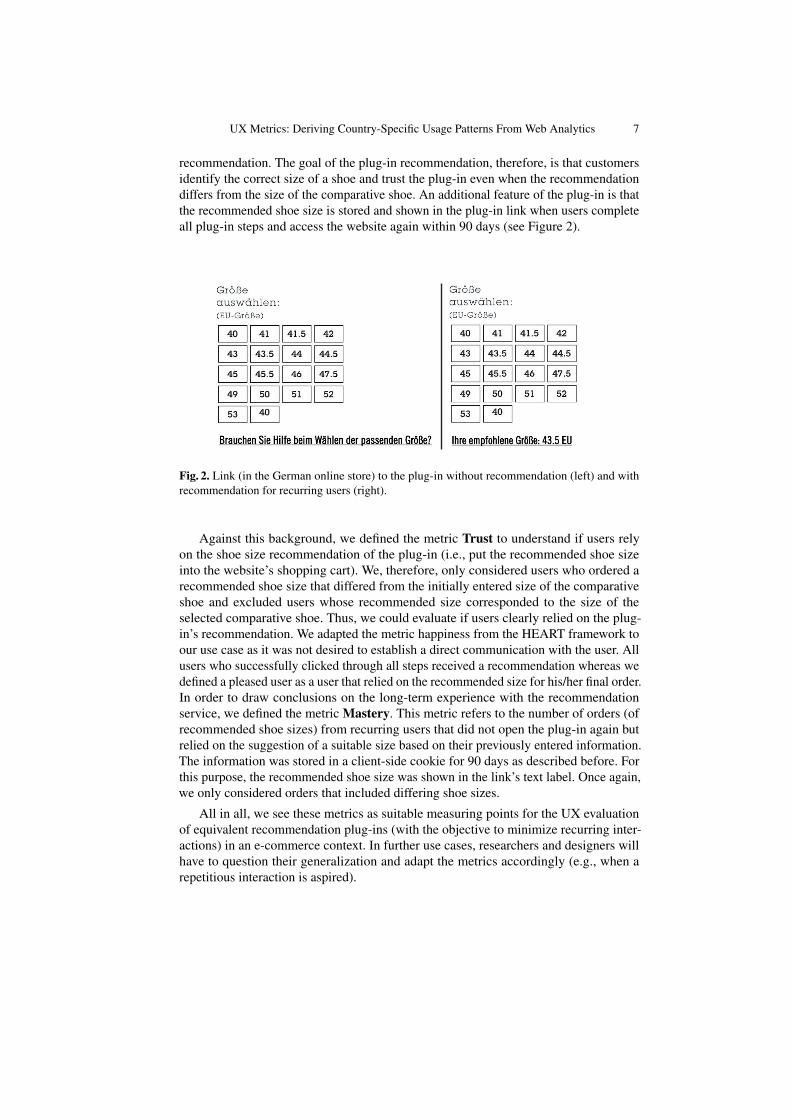
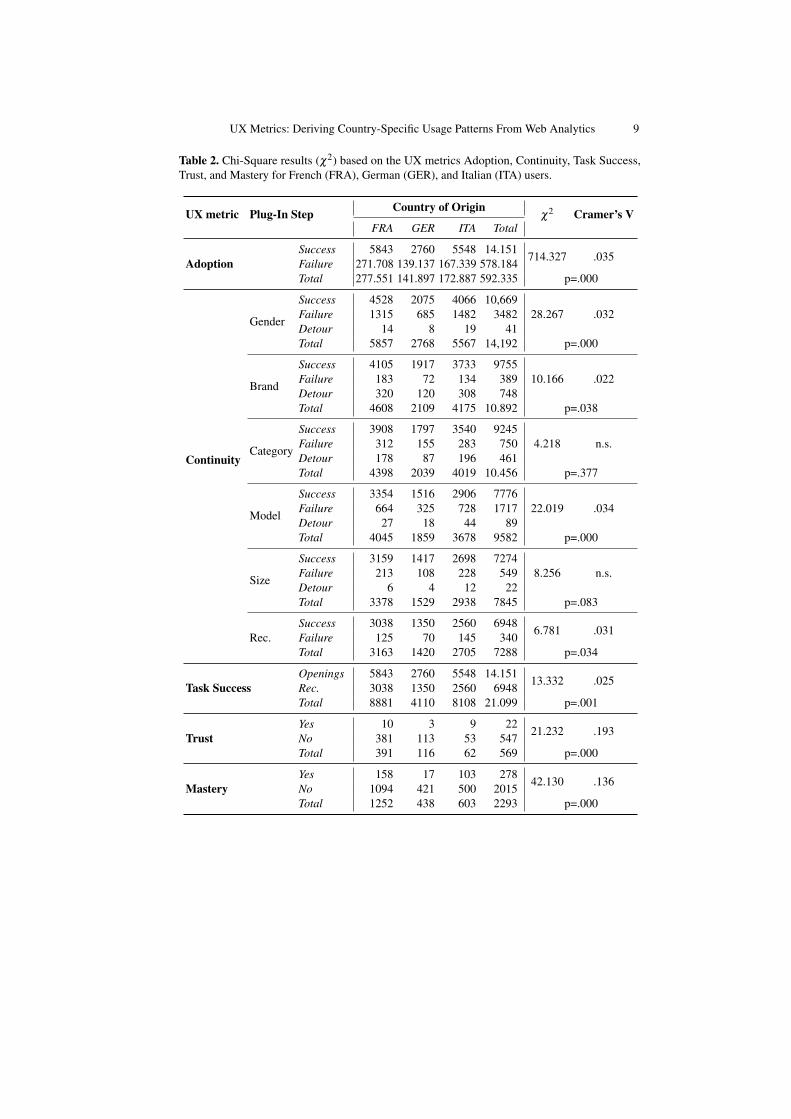
The goal of the metric Complexity was to identify temporal differences along the processsteps in order to diagnose key hurdles of the plug-in. We used the z-score transformationto make the data normal before conducting the (two-way) ANOVA and post-hoc Sidaktest, as our dataset (process time per plug-in step) did not represent a normal distributionaccording to the Kolmogorov-Smirnov test. We used post-hoc Sidak test as all usersinteracted with the plug-in independently. We then used the two-way ANOVA and a post-hoc Sidak test to analyze the effect of the country of origin on the time spent on each stepalong the plug-in process. Thus, we found out that there was an effect between countryof origin and the process time per plug-in step (F(10,2)=10.427, p=.000, η2=.011). Inour study, Italian users significantly differed in their temporal usage patterns along allplug-in steps from French users (p=.000) as well as from German users (p=.022). Frenchand Germany did not differ significantly (p>.050) (see Figure 3).
Gender
Brand
Category
ModelSize
Recommen
dation
0
10000
20000
30000
time
(ms)
France
Germany
Italy
Fig. 3. Average process times for each plug-in step per country including the standard deviation.
Next, we conducted an ANOVA and post-hoc Sidak test to investigate whether theprocess times significantly vary per plug-in step. Thus, we found out that there is aneffect of country of origin for the first plug-in step to select the gender (F(12,2)=10.774,p=.000, η2=.012) as well as the third plug-in step to select a category of a comparativeshoe (F(12,2)=6.342, p=.002, η2=.007). For the other plug-in steps (i.e., brand, model,
UX Metrics: Deriving Country-Specific Usage Patterns From Web Analytics 11
size, and recommendation) we could not identify significant differences (p>.050). Moreprecisely, for the first step (i.e., gender) the process time (i.e., the mean) of Italian usersdiffered from French users (p=.000) as well as from German users (p=.008). Furthermore,the mean of the process time of Italian users to select a category varied from the processtime of French users (p=0.001). On average, Italian users needed more time for eachplug-in step.
4.3 Varying Reliance on Recommendations
Based on the two metrics Trust (number of recommended orders) and Mastery (numberof recommended orders of recurring users without opening the plug-in) we analyzed theusage behaviors of plug-in users directly related to the recommendation service. Theobjective of these metrics is to understand whether the country of origin is related to thereliance of users on the shoe size recommendation as well as with the understanding ofrecurring users (who already successfully clicked through the whole plug-in process andshould understand that their suitable size is directly represented in the plug-in openinglink) that they do not have to open the plug-in again.
We found out that there is a relationship between country of origin and the Trust inthe recommendation of the plug-in (χ2(2)=13.983, p=.001). Furthermore, the country oforigin is related to the understanding of the link’s text label recommendation (Mastery)for recurring users (χ2(2)=42.130, p=.000).
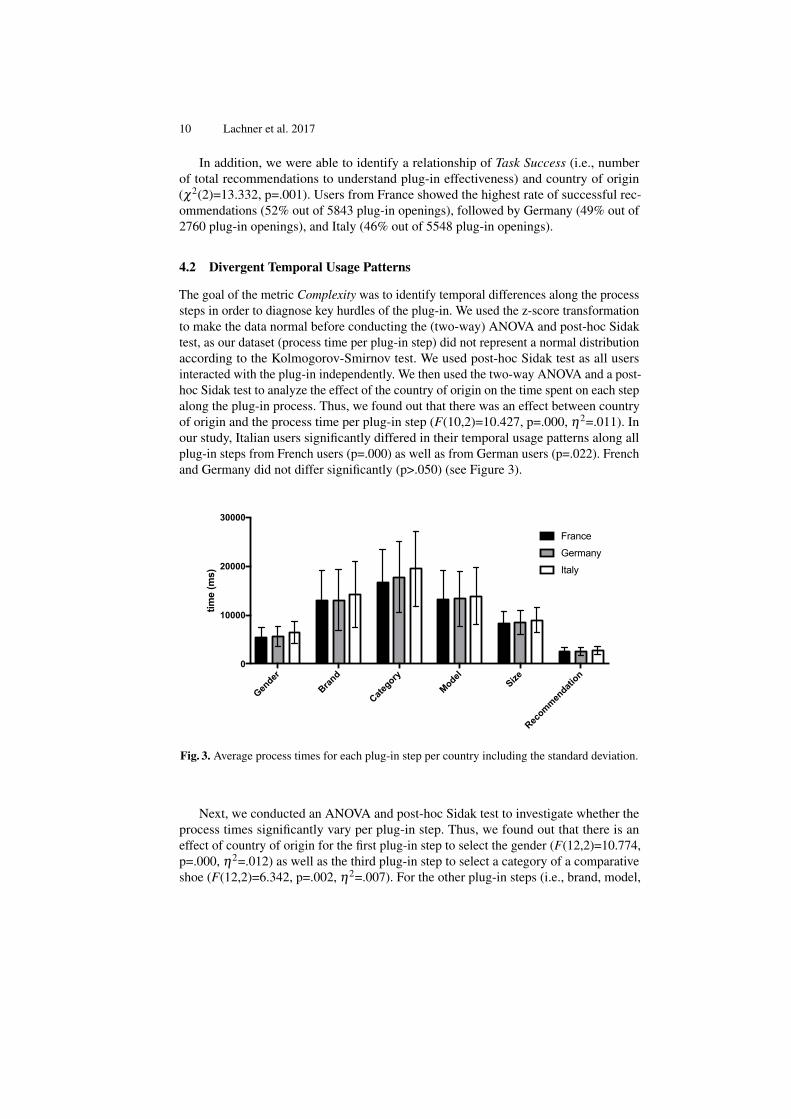
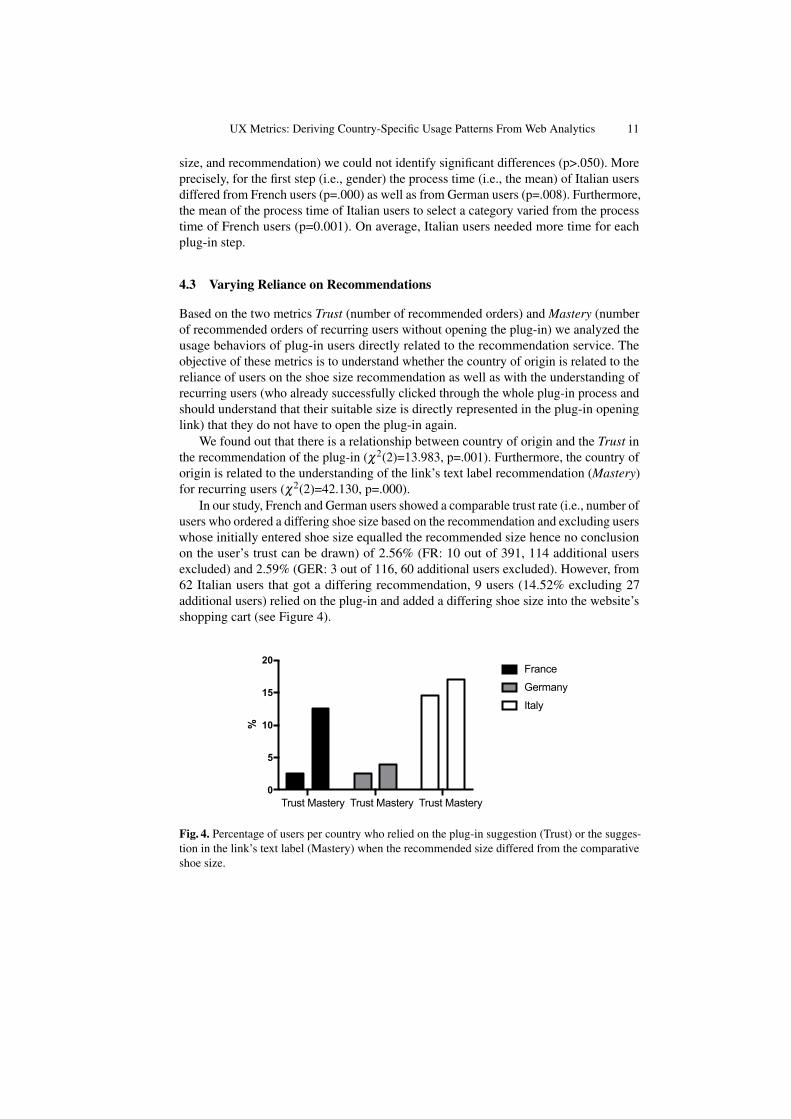
In our study, French and German users showed a comparable trust rate (i.e., number ofusers who ordered a differing shoe size based on the recommendation and excluding userswhose initially entered shoe size equalled the recommended size hence no conclusionon the user’s trust can be drawn) of 2.56% (FR: 10 out of 391, 114 additional usersexcluded) and 2.59% (GER: 3 out of 116, 60 additional users excluded). However, from62 Italian users that got a differing recommendation, 9 users (14.52% excluding 27additional users) relied on the plug-in and added a differing shoe size into the website’sshopping cart (see Figure 4).
France
Germany
Italy
0
5
10
15
20
%
France
Germany
Italy
Trust Mastery Trust Mastery Trust Mastery
Fig. 4. Percentage of users per country who relied on the plug-in suggestion (Trust) or the sugges-tion in the link’s text label (Mastery) when the recommended size differed from the comparativeshoe size.
12 Lachner et al. 2017
With regards to recurring users relying on the recommendation of the plug-in link,the number of French users (adding a differing shoe size into the website’s shopping cartwithout opening the plug-in and once again excluding users for whom no conclusioncan be drawn as the recommended size equalled the initially entered size) increased to12.62% (158 out of 1252, excluding 486 additional users) and the number of reliantItalian users increased to 17.08% (103 out of 603, excluding 133 additional users).German users, however, remained at a rather low rate of 3.88% (17 out of 438, excluding250 additional users) (see Figure 4).
4.4 Summary and Interpretation
The analysis of UX metrics allowed us to understand country-specific usage patternsof French, German, and Italian users. Users from all three countries showed distinctadoption and dropout rates as well as, in particular, significant associations with theplug-in steps gender, brand, model, and recommendation. In addition, we identifiedsignificant differences in the overall task success rates. Furthermore, the country oforigin is related to the temporal usage patterns along the plug-in steps, with Italian usersbeing the slowest.
Finally, the analysis of the UX-focused metrics Trust and Mastery showed lowerrates for French and German users compared to users from Italy. However, recurringusers from France strongly increased their long-term trust rate (i.e., Mastery) due to thesuggestion in the plug-in link’s text label. The described UX metrics helped our projectpartner to efficiently focus on selected plug-in steps as the analysis highlighted country-specific relationships with a low effect size that are worth paying attention (Cramer’sV between .10 and .20 and η2=.01) compared to country-specific relationships witha marginal effect size (Cramer’s V between .00 and .10 and η2<.01) according toRea & Parker [45] and Cohen [11]. The localization of all plug-in steps will increasedevelopment time and costs. Through the focus on selected and significant plug-insteps with at least low effect sizes, our project partner was able to allocate research anddevelopment resources more efficiently.
In order to identify localized interfaces for different countries, designers and re-searchers need to analyze suitable aspects in further in-depth studies. First, the interfaceof the website plug-in can be localized and evaluated recurringly for each country tominimize the dropout rate for the critical plug-in steps. One might, for example, prefertext-based icons for the selection of the gender. Second, with regards to the differingprocess times the plug-in design can be complemented with additional information inorder to balance process times per step, dropout rate, and backward steps. Third, it isimportant to investigate the differences in the Trust and Mastery rate. German users, forexample, might not want to receive suggestions within the link’s text label but preferto receive an individual recommendation each time. Thus, the overall plug-in and linkdesign should be rearranged. Therefore, further qualitative in-depth investigations in thefuture will allow us to clarify our interpretations.
UX Metrics: Deriving Country-Specific Usage Patterns From Web Analytics 13
5 Conclusion, Limitation, and Future Work
In this paper, we demonstrated the applicability of web analytics metrics to analyzedifferences in the usage behavior and UX of an e-commerce website plug-in betweenFrench, German, and Italian users. We were able to identify significant relationshipsbetween the country of origin and the adoption rate as well as dropout rate of severalplug-in steps. In addition, users from France, Germany, and Italy showed differenttemporal usage patterns as well as trust in the plug-in’s recommendation. Although ourwork focused on the analysis of an e-commerce plug-in, further country-specific usagepatterns have already been identified for Q&A websites such as Yahoo Answers (see[28]) as well as StackOverflow and Superuser (see [44]).
However, narrowing down the complex scope of UX to a selection of six customizedwebsite analytics metrics based on client-side user tracking can only be a first step.Overall, it will be necessary to further investigate and analyze the applicability of usertracking for UX measurement due to its quantitatively descriptive nature (see [24,32,41].Inspired by traditional usability approaches (i.e., logging data) we see our work as astarting point to efficiently guide in-depth UX analyses, complementary to qualitativeevaluations with a focus on attitudinal data. Additionally, client-based tracking mightnot holistically track all website visitors due to, e.g., blocked website cookies. It is, bynature, not possible to track how many website visitors block cookies. We, therefore,limited our analysis to recurring users of plug-in interactions and not website visits.Furthermore, the collaboration with our industry partner did not allow any modificationof the original website. Consequently, it was not possible to add a registration process totrack the user behavior across different devices.
Based on our research, future studies should add further metrics and qualitativein-depth analysis of country-specific usage patterns, test our findings through locallyadapted user interface studies, and investigate the impact of server-based tracking on boththe users’ UX and the validity of web analytics metrics. Furthermore, the investigationof user-level data (i.e., the consolidated usage data of individual users) might allowconclusions about more detailed user behaviors. Ultimately, to set up a holistic UX-focused user tracking process, it is necessary to compare the effect of cross-countrydifferences with and in contrast to further aspects, such as gender and device type.
We conclude that user tracking can be an efficient way to identify UX-related leversfor culturally sensitive design adaptions of website plug-ins. At the same time, we agreewith Vermeeren et al. [57] and Law et al. [33] that an exclusive focus on quantitative UXmeasurement (through, e.g., web analytics metrics) might ignore relevant insights ofqualitative measurement approaches. Consequently a balance of various measurementtools and approaches should be promoted. In culturally sensitive development processes,the research and design team can implement UX-focused user tracking to identifysuitable levers for country-specific design adaptions. Once significant differences in theusage behaviors for certain steps of a website plug-in have been identified, researchersand developers can, e.g., efficiently set-up subsequent A/B-tests and investigate theimpact on the click behavior for different designs. This includes but is not limited tomore or less information for such plug-insteps, different designs (colours, fonts, etc.)or simply a different user flow through the plug-in. Changes in the design can then beanalyzed through further user tracking and supplemental qualitative evaluations.
14 Lachner et al. 2017
In summary, our work was guided by the motivation to pursue a quantitative approachbased on web analytics metrics to identify UX-related, country-specific usage behaviorsof a website plug-in. We aim to foster an ongoing discussion about cross-cultural UX de-sign as well as a suitable balance between qualitative and quantitative UX measurement- following up on the investigation of large-scale behavioral data. In particular, however,we want to emphasize that the challenging need of globally acting companies to analyzecountry-specific preferences and usage patterns requires cost-efficient and quickly adapt-able UX measurement tools. In this light, we perceive our work as a constructive startingpoint for further cross-cultural investigations based on large-scale behavioral data.
References
1. Ahtinen, A., Ramiah, S., Blom, J., Isomursu, M.: 2008. Design of Mobile Wellness Applications:Identifying Cross-Cultural Factors. In: Proceedings of the 20th Australasian Conference onComputer-Human Interaction (OZCHI), pp. 164–171. ACM Press (2008)
2. Al-Shamaileh, O., Sutcliffe, A.: Investigating a Multi-faceted View of User Experience. In:Proceedings of the 24th Australian Computer-Human Interaction Conference (OZCHI), pp.9–18. ACM Press (2012)
3. Andreasen, M., Nielsen, H., Schrøder, S., Stage, J.: What Happened to Remote UsabilityTesting? An Empirical Study of Three Methods. In: Proceedings of the SIGCHI Conference onHuman Factors in Computing Systems (CHI), pp. 1405–1414, ACM Press (2007)
4. Aykin, N: Overview: Where to Start and What to Consider. In: Aykin, N. (Ed.): Usability andInternationalization of Information Technology, pp. 3–20. Lawrence Erlbaum Associates, Inc.,New Jersey (2005)
5. Barber, W., Badre, A.: Culturability: The Merging of Culture and Usability (1998) http://research.microsoft.com/en-us/um/people/marycz/hfweb98/barber/
6. Bargas-Avila, J., Hornbæk, K.: Old Wine in New Bottles or Novel Challenges? A CriticalAnalysis of Empirical Studies of User Experience. In: Proceedings of the SIGCHI Conferenceon Human Factors in Computing Systems (CHI), pp. 2689–2698. ACM Press (2011)
7. Battarbee, K., Koskinen, I.: Co-experience: user experience as interaction. CoDesign 1 (1),5–18 (2005)
8. Beaton, J., Kumar, R.: Indian Cultural Effects on User Research Methodologies. In: Proceedingsof the SIGCHI Conference on Human Factors in Computing Systems Extended Abstracts (CHIEA), pp. 4267–4271. ACM Press (2010)
9. Bjørneseth, F., Dunlop, M., Strand, J.: Dynamic positioning systems: usability and interac-tion styles. In: Proceedings of the 5th Nordic Conference on Human-Computer Interaction(NordiCHI), pp. 43–52. ACM Press (2008)
10. Chang, T-H., Yeh, T., Miller, R.: GUI Testing Using Computer Vision. In: Proceedings of theSIGCHI Conference on Human Factors in Computing Systems (CHI), pp. 1535–1544. ACMPress (2010)
11. Cohen, J.: Statistical power analysis for the behavioral sciences. Academic Press, New York(1998)
12. Dunlop, M., Hamilton, I,. Komninos, A., Nicol, E.: Shake ’N’ Tap: A gesture enhancedkeyboard for older adults. In: Proceedings of the 16th international conference on Human-computer interaction with mobile devices & services (MobileHCI), pp. 525–530. ACM Press(2014)
13. Dunlop, M., Mcgregor, B., Elliot, M.: Using smartphones in cities to crowdsource dangerousroad sections and give effective in-car warnings. In: Proceedings of the SEACHI 2016 on SmartCities for Better Living with HCI and UX (SEACHI), pp. 14–18. ACM Press (2016)
UX Metrics: Deriving Country-Specific Usage Patterns From Web Analytics 15
14. Frandsen-Thorlacius, O., Hornbæk, K., Hertzum, M., Clemmensen, T.: Non-Universal Usabil-ity? A Survey of How Usability is Understood by Chinese and Danish Users. In: Proceedingsof the SIGCHI Conference on Human Factors in Computing Systems (CHI), pp. 41–50. ACMPress (2009)
15. Gerea, C., Herskovic, V.: Measuring User Experience in Latin America: An ExploratorySurvey. In: Proceedings of the Latin American Conference on Human Computer Interaction(CLIHC). ACM Press (2015)
16. Gordon, M., Ouyang, T., Zhai, S.: WatchWriter. In: Proceedings of the SIGCHI Conferenceon Human Factors in Computing Systems (CHI), pp. 3817–3821. ACM Press (2016)
17. Gorman, T., Rose, E., Yaaqoubi, J., Bayor, A., Kolko, B.: Adapting Usability Testing for Oral,Rural Users. In: Proceedings of the SIGCHI Conference on Human Factors in ComputingSystems (CHI), pp. 1437–1440. ACM Press (2011)
18. Grubbs, F.: Procedures for detecting outlying observations in samples. Technometrics 11 (1),1–21 (1974)
19. Hassenzahl, M., Tractinsky, N.: User experience - a research agenda. Behaviour & InformationTechnology 25 (2), 91–97 (2006)
20. Hassenzahl, M.: User experience (UX): towards an experiential perspective on product quality.In: Proceedings of the 20th Conference on l’Interaction Homme-Machine (IHM), pp. 11–15.ACM Press (2008)
21. He, Y., Zhao, C., Hinds, P.: Understanding Information Sharing from a Cross-cultural Per-spective. In: Proceedings of the SIGCHI Conference on Human Factors in Computing SystemsExtended Abstracts (CHI EA), pp. 3823–3828. ACM Press (2010)
22. Hofstede, G., Hofstede, G. J., Minkov, M.: Cultures and Organizations. Software of the Mind.McGraw-Hill, New York (2010)
23. Hoßfeld, T., Keimel, C., Hirth, M., Gardlo, B., Habigt, J., Diepold, K., Tran-Gia, P.: BestPractices for QoE Crowdtesting: QoE Assessment With Crowdsourcing. In: IEEE Transactionson Multimedia 16 (2), 541–588 (2014)
24. ISO DIS. 2009. 9241-210. Ergonomics of human system interaction-Part 210: Human-centreddesign for interactive systems. International Standardization Organization (ISO). Switzerland(2009).
25. Jewell, C., Salvetti, F.: Towards a Combined Method of Web Usability Testing: An Assessmentof the Complementary Advantages of Lab Testing, Pre-Session Assignments, and OnlineUsability Services. In: Proceedings of the SIGCHI Conference on Human Factors in ComputingSystems Extended Abstracts (CHI EA), pp. 1865–1870. ACM Press (2012)
26. Jordan, P.: Human factors for pleasure in product use. Applied Ergonomics 29 (1), 25–3(1998)
27. Karapanos, E., Zimmerman, J., Forlizzi, J., Martens, J.: User Experience Over Time: AnInitial Framework. In: Proceedings of the SIGCHI Conference on Human Factors in ComputingSystems (CHI), pp. 729–738. ACM Press (2009)
28. Kayes, I., Kourtellis, N., Quercia, D., Iamnitchi, A., Bonchi, F.: Cultures in communityquestion answering. In: Proceedings of the 26th ACM Conference on Hypertext & SocialMedia, pp. 175–184. ACM Press (2015)
29. Komninos, A., Nicol, E., Dunlop, M.: Designed with Older Adults to SupportBetter ErrorCorrection in SmartPhone Text Entry. In: Proceedings of the 17th International Conference onHuman-Computer Interaction with Mobile Devices and Services Adjunct (MobileHCI), pp.797–802. ACM Press (2015)
30. Lachner, F., Nägelein, P., Kowalski, R., Spann, M., Butz, A.: Quantified UX: Towards aCommon Organizational Understanding of User Experience. In: Proceedings of the 9th NordicConference on Human-Computer Interaction (NordiCHI). ACM Press (2016)
16 Lachner et al. 2017
31. Lallemand, C., Gronier, G., Koenig, V.: User experience: A concept without consensus?Exploring practitioners’ perspectives through an international survey. Computers in HumanBehavior 43, 35–48 (2015)
32. Law, E., Roto, V., Hassenzahl, M., Vermeeren, A., Kort, J.: Understanding, scoping anddefining user experience. In: Proceedings of the SIGCHI Conference on Human Factors inComputing Systems (CHI), pp. 719–728. ACM Press (2009)
33. Law, E., Van Schaik, P., Roto, V.: Attitudes towards user experience (UX) measurement.International Journal of Human Computer Studies 72 (6), 526–541 (2014)
34. Lindley, S., Wallace, J.: Placing in Age: Transitioning to a New Home in Later Life. Transac-tions on Computer-Human Interaction 22 (4), 1–40 (2015)
35. Lindley, S.: Making Time. In: 18th ACM Conference on Computer Supported CooperativeWork & Social Computing (CSCW), pp. 1442–1452. ACM Press (2015)
36. Malinen, S., Nurkka, P.: The role of community in exercise: Cross-cultural study of onlineexercise diary users. In: Proceedings of the 6th International Conference on Communities andTechnologies (C&T), pp. 55–63. ACM Press (2013)
37. Marcus, A., Gould, E.: Crosscurrents: Cultural Dimensions and Global Web User-InterfaceDesign. Interactions 7 (4), 32–46 (2000)
38. Mekler, E., Hornbæk, K.: Momentary Pleasure or Lasting Meaning ? Distinguishing Eudai-monic and Hedonic User Experiences. In: Proceedings of the SIGCHI Conference on HumanFactors in Computing Systems (CHI), pp. 4509–4520. ACM Press (2016)
39. Nielsen, J.: Designing for International Use (Panel). In: Proceedings of the SIGCHI Confer-ence on Human Factors in Computing Systems (CHI), pp. 291–294. ACM Press (1990)
40. Norman, D.: Emotional design. Ubiquity 45 (4), 1–1 (2004)41. Obrist, M., Roto, V., Väänänen-Vainio-Mattila, K.: User Experience Evaluation - Do You
Know Which Method to Use? In: Proceedings of the SIGCHI Conference on Human Factorsin Computing Systems (CHI), pp. 2763–2766. ACM Press (2009)
42. Obrist, M., Wurhofer, D., Gärtner, M., Förster, F., Tscheligi, M.: Exploring children’s 3DTVexperience. In: Proceedings of the 10th European conference on Interactive tv and video(EuroiTV), pp. 125–134. ACM Press (2012)
43. Oliveira, N.: Culture-aware Q&A Environments. In: Proc. DC CSCW Companion, pp. 101–104. ACM Press (2015)
44. Oliveira, N., Andrade, N., Reinecke, K.: Participation Differences in Q&A Sites AcrossCountries: Opportunities for Cultural Adaptation. In: Proceedings of the 9th Nordic Conferenceon Human-Computer Interaction (NordiCHI). ACM Press (2016)
45. Rea, L. M., Parker, R. A.: Designing and conducting survey research: A comprehensive guide.John Wiley & Sons (2014).
46. Reinecke, K., Bernstein, A.: Improving Performance, Perceived Usability, and Aestheticswith Culturally Adaptive User Interfaces. Transactions on Computer-Human Interaction 18 (2),1–29 (2011)
47. Reinecke, K., Bernstein, A.: Predicting User Interface Preferences of Culturally AmbiguousUsers. In: Proceedings of the SIGCHI Conference on Human Factors in Computing SystemsExtended Abstracts (CHI EA), pp. 3261–3266. ACM Press (2008)
48. Reinecke, K., Gajos, K.: Quantifying Visual Preferences Around theWorld. In: Proceedingsof the SIGCHI Conference on Human Factors in Computing Systems (CHI), pp. 11–20. ACMPress (2014)
49. Reyal, S., Zhai, S., Kristensson, P.: Performance and User Experience of Touchscreen andGesture Keyboards in a Lab Setting and in the Wild. In: Proceedings of the SIGCHI Conferenceon Human Factors in Computing Systems (CHI), pp. 679–688. ACM Press (2015)
50. Rodden, K., Hutchinson, H., Fu, X.: Measuring the User Experience on a Large Scale: User-Centered Metrics for Web Applications. In: Proceedings of the SIGCHI Conference on HumanFactors in Computing Systems (CHI), pp. 2395–2398. ACM Press (2010)
UX Metrics: Deriving Country-Specific Usage Patterns From Web Analytics 17
51. Rödel, C., Stadler, S., Meschtscherjakov, A., Tscheligi, M: Towards autonomous cars: Theeffect of autonomy levels on acceptance and user experience. In: Proceedings of the 6thInternational Conference on Automotive User Interfaces and Interactive Vehicular Applications(AutomotiveUI), pp. 1–8. ACM Press (2014)
52. Roto, V., Law, E., Vermeeren, A., Hoonhout, J.: UX White Paper. Bringing clarity to theconcept of user experience. Result from Dagstuhl Seminar on Demarcating User Experience(2011)
53. Sun, H.: Building a Culturally-Competent Corporate Web Site: An Exploratory Study ofCultural Markers in Multilingual Web Design. In: Proceedings of the 19th annual internationalconference on Computer documentation (SIGDOC), pp. 95–102. ACM Press (2001)
54. Swallow, D., Blythe, M., Wright, P.: Grounding Experience: Relating Theory and Method toEvaluate the User Experience of Smartphones. In: Proceedings of the 2005 annual conferenceon European association of cognitive ergonomics (EACE), pp. 91–98. ACM Press (2005)
55. Tuch, A., Trusell, R., Hornbæk, K.: Analyzing Users’ Narratives to Understand Experiencewith Interactive Products. In: Proceedings of the SIGCHI Conference on Human Factors inComputing Systems (CHI), pp. 2079–2088. ACM Press (2013)
56. Tullis T., Albert, B.: Measuring the User Experience: Collecting, Analyzing, and PresentingUsability Metrics. Second Edition. Morgan Kaufmann, Waltham (2013)
57. Vermeeren, A., Law, E., Roto, V., Obrist, M., Hoonhout, J., Väänänen-Vainio-Mattila, K.:User experience evaluation methods: current state and development needs. In: Proceedings ofthe 6th Nordic Conference on Human-Computer Interaction (NordiCHI), pp. 521–530. ACMPress (2010)
58. Walsh, T., Nurkka, P., Walsh, R.: Cultural Differences in Smartphone User ExperienceEvaluation. In: Proceedings of the 9th International Conference on Mobile and UbiquitousMultimedia (MUM), pp. 1–9. ACM Press (2010)
59. Walsh, T., Nurkka, P.: Approaches to Cross-Cultural Design: Two Case Studies with UXWeb-Surveys. In: Proceedings of the 24th Australian Computer-Human Interaction Conference(OZCHI), pp. 633–642. ACM Press (2012)
60. Walsh, T., Vainio, T.: Cross-Cultural Design for mHealth Applications. In: Proceedings of the23rd Australian Computer-Human Interaction Conference (OZCHI). ACM Press (2011)
61. Yatani, K., Novati, M., Trusty, A., Truong, K.: Review Spotlight: A User Interface forSummarizing User-generated Reviews Using Adjective-Noun Word Pairs. In: Proceedingsof the SIGCHI Conference on Human Factors in Computing Systems (CHI), pp. 1541–1550.ACM Press (2011)