v i s u a l p r o g r a mmi n g w i th p y w o r k fl o w
TRANSCRIPT
Visual Programming with PyWorkflow:
A Web-Based Python IDE for Graphical Data Analysis -
Milestone 3 Report
Samir Reddigari, Matthew Smith, Diego Struk, Matthew Thomas, Cesar Agustin Garcia Vazquez
Division of Continuing Education, Harvard University
CSCI E-599: Software Engineering Capstone
Dr. Peter Henstock
May 7th, 2020
2
Index
Index 2 Journal Paper 4
Abstract 4 Introduction 5 Review of Literature 6
Visual Programming: A Combination of Necessity and Value 6 Data Workflows as Directed Graphs 6 Existing Visual Programming Platforms for Data Science 7 Web-based IDEs and the Language Server Protocol 8
Visual Programming with PyWorkflow 9 Conclusion and Future Work 12 References 14 Introduction 14
Visual Programming: A Combination of Necessity and Value 14 Data Workflows as Directed Graphs 14 Existing Virtual Programming Platforms for Data Science 15 Web-based IDEs 15
Design of the System 16 Workflow Model 16
Workflow 17 Node 21 Exceptions 24
User Interface 25 Main application screen 25 Node configuration 26 Front-end Architecture 27
Test Results 31 Workflow model 31 REST API Endpoints 32 UI 33
Development Process 34 Meeting the Requirements 34 Technical Decision-Making 35
3
Estimates 36 Risks 39 Team Dynamic 40
Appendix 43 Screenshots/Wireframes 43 Requirements and Initial Estimation 47 System Installation Manual 49 Relevant Journals 49
4
Abstract
Scientists in all fields are tasked with analyzing increasingly large and convoluted datasets. The
educational tax of understanding not only the data and their domain, but the analysis software
has made the advent of visual programming tools invaluable at all levels of expertise. However,
existing solutions lack features critical to modern data science, such as web-friendliness and
native support of the Python data ecosystem. We describe the design and development of
PyWorkflow, a highly extensible, browser-based visual programming tool for data analysis.
PyWorkflow offers an intuitive interface built with modern web standards, backed by
customizable units of Python processing logic. Using a visual programming tool like PyWorkflow
allows scientists to focus on their area of expertise without the added complexity of managing
code.
Keywords: visual programming, data analysis, Python, pandas, data visualization
5
Introduction Visual programming applications allow for the creation of programs using linked graphical elements representing functions rather than textual commands. As early as 2000, tools such as the Konstanz Information Miner (KNIME) [1], Pipeline Pilot [2], and RapidMiner [3] have applied visual programming to the field of data science, enabling the creation of visual data flows and pipelines. These desktop applications give users the power to create complex data models without needing to write any code or being data science experts. Understanding the documentation of the specific graphical elements is, in many cases, enough to build a complex workflow. The majority of these visual programming applications are desktop-based, meaning that both the user and application have to be on the same machine in order to execute a particular workflow. One of the most widely used applications, KNIME, excels in a desktop environment, but could be drastically improved without some of the limitations imposed by such an environment. If KNIME were a web application, users could save their data flow models in the cloud and execute them from any machine. It would also allow for easier sharing and collaboration. The pandas software library is written for Python (not a visual language) specifically to compute and analyze datasets. It is one of the most widely adopted tools in the data science field [4]. Through its tabular DataFrame structure, pandas is used for data analysis and machine learning in virtually every industry where analysis of data is needed, from medicine to banking and beyond. While many existing tools, including KNIME, allow for integration of Python code snippets, these integrations have proven to be difficult. In KNIME, all data flows through the Java Virtual Machine which can dramatically slow down processing speed and manipulate the data in unintended ways when converted between custom Java table classes and the language of choice [5]. This leaves seamless Python integration as a low-hanging, but highly valuable, goal. The data science community would greatly benefit from a web-based visual programming interface with Python at its foundation that leverages popular libraries such as pandas, a powerful tool for performing operations on a range of datasets [6]. The clear benefits of such an application lie in its extensibility, ease of collaboration, accessibility, and performance—features that are lacking in today’s desktop-based products.
6
Review of Literature
Visual Programming: A Combination of Necessity and Value As datasets grow in both complexity and size, scientists in every field have needed to learn programming languages to manipulate and analyze their data. Visual programming is gaining traction as a way to abstract the tools needed to analyze the data. This allows data scientists to focus on their area of expertise. As such, visual programming languages are beneficial to not only emerging developers, and the expansion of visual programming tools is making the task of analyzing our world much more efficient, translatable, and reusable. Individuals approaching programming for the first time often suffer from a lack of self-efficacy [7]. As such, the learning of textual programming languages represents an extremely steep learning curve, and especially when you consider that the language must then be applied to a subject matter that also has to be well-understood. This educational weight of needing knowledge in a scientific domain in addition to a programming language, compounded by ever-evolving datasets, means that problem solving and analyzing data by means of an abstracted visual programming language is needed now more than ever [8]. Programming often begins with a visual flowchart or pseudo-code that ignores the syntax of the final solution’s language. Afterwards, the programmer then translates the solution into code [9]. When answers finally surface, technical individuals then have to communicate the processes and analysis often to non-technical individuals who understand the visual approach more easily. Furthermore, visual programming has also been shown to provide a better means for collaboration, which often produces more successful outcomes [10]. They are also easier to use than their text-based counterparts, if created in a general and openly extensible fashion [11]. Although a general conclusion itself, there is a reason abstraction is such an important concept in software. Just as textual programming languages abstract the machine code for human understanding, so too does visual programming abstract the dense and knowledge-intensive textual language for easier understanding.
Data Workflows as Directed Graphs The visual representation of data analysis tasks often takes the form of workflows, with various operations being strung together in sequence. These workflows (or pipelines) are easily modeled as directed acyclic graphs (DAGs). In mathematics, a graph is a data structure comprising nodes connected by edges. A DAG is a graph in which the edges are directional, and traversing the edges never results in revisiting a node. Workflows may be thought of as graphs where the nodes are operations on data, and the edges are data moving between nodes (the output of a node becoming the input of another).

7
A key property of DAGs relevant to modeling data workflows is that every DAG has at least one topological ordering: an ordering of the nodes such that every node precedes all of its descendents [12]. Representing a workflow as a DAG facilitates several facets of workflow execution:
● Ordering: The topological ordering of the workflow’s nodes provides the correct order of operations, as the ordering ensures no operation runs until all its upstream operations have completed.
● Parallelism: Subregions of a workflow that do not share upstream nodes may be executed in parallel.
● Optimization: If a node’s output is persisted, it does not need to be re-executed, and nodes downstream of it may be executed without waiting for upstream nodes to complete.
Graph-based workflow tools exist at all levels of computation. Deep learning frameworks such as TensorFlow and PyTorch represent machine learning models as graphs of operations (such as matrix multiplication and nonlinear activation functions) through which numeric data flow, and graph traversal underlies the backpropagation algorithm that enables the training of such models [13]. Data analysis tools such as KNIME (a visual paradigm) and Dask (a Python library for parallel computing) exist to define pipelines for tabular data that can be executed at once. Tools like Apache Airflow and Luigi handle complex task orchestration by representing tasks and their dependencies as DAGs. Even the standard UNIX utility make relies on graph representations internally [14], and has been advocated by computational neuroscientists for creating reproducible workflows in their field [15]. In general, the above tools allow a user to define their workflow graph, although they vary in the abstraction of the graph exposed to the user. For example, KNIME requires the user to visually build the entire graph, while Luigi can dynamically build a workflow based on the requirements of individual tasks. Additionally, a different paradigm is described by Rodrigues et al. [16], in which the user defines the graph of all possible operations, and a program determines the best workflow by analyzing the graph with standard shortest-path algorithms. A successful application for visual workflows must not only leverage the graph-theoretical properties that allow workflows to be executed correctly and efficiently, but make design choices informed by the many existing graph-based programs.
Existing Visual Programming Platforms for Data Science There are a number of visual programming platforms for data science. Research indicates that two of the most popular platforms are the Konstanz Information Miner Analysis Platform (“KNIME”) and Pipeline Pilot. While they are both considered visual programming applications for data science, they have different internal workings resulting from the origins of these two applications. KNIME comes from a data mining background [17] while Pipeline Pilot was originally used in the field of cheminformatics.
8
Modularity is one of the principles behind KNIME [18]. Processing units and data containers work independently of each other. This allows for easy distribution of computation and isolation of algorithms.The modularity principle allows the user to execute a whole workflow or a specific set of nodes in isolation. Having each node working independently makes it harder to open streams of data between them [19]. In KNIME, the data at every node is stored in tables containing rows and columns. KNIME processes workflows node-by-node which offers a few benefits. Multiple iterations over the same data are used by many data mining algorithms, providing the ability to view intermediate results on the connections between nodes even after the workflow has been executed. The workflow can be restarted at any intermediate node. Due to the large size of datasets, the tables that hold intermediate results are saved in disk rather than remain in memory. The drawback of storing tables in disk is a slow down in data transfer which makes node execution slower. Through a web application, their intermediate storage of data could be performed on the cloud in such a way that data transfer won’t slow down node processing. Pipeline Pilot is another desktop application that provides the ability to process and analyze data workflows through a visual interface [20]. Pipeline Pilot provides better support than KNIME for streaming data between components [21]. Rather than maintaining the modularity that is used in KNIME, it emphasizes efficiency for certain tasks by starting downstream operations on some records while an upstream operation is still working on others. Pipeline Pilot still provides the most efficient product in terms of memory and scalability. Even though KNIME has been working to improve this aspect, it is still not as scalable as Pipeline Pilot. A drawback of Pipeline Pilot’s streaming capabilities is that viewing intermediate results between components is a bit harder. Since one of the requirements for our application is to provide users with a way to see intermediate results, supporting streams the way Pipeline Pilot does could be a challenging undertaking. KNIME and Pipeline Pilot are considered standards in visual programming platforms for data science with many ideas in common; however, they perform better in different scenarios. The modularity principle at the core of KNIME is extremely useful for data mining tasks where multiple iterations of operations over the same data are needed. On the other hand, Pipeline Pilot’s better support for streams makes it the preferable platform for applications for which calculations of data are made in real time and where efficiency and scalability is of extreme importance. Our requirements focus on modularity so our approach will be more similar to that of KNIME.
Web-based IDEs and the Language Server Protocol The rise of web-based integrated development environments (IDEs) has brought many benefits to users including increased collaboration, ease-of-use, and extensibility [22]. These web-based IDEs range from smaller and more focused tools like JSFiddle for testing HTML, CSS, and Javascript, to more full-featured IDEs like Cloud9 or Eclipse Theia [23]. A web-based IDE can

9
be installed and configured once on a centralized server, and have an end-user connect to and from any machine with a web-browser. This reduces the need for top-of-the-line personal machines and can increase overall performance by allocating resources where they can be used by all [24]. Microsoft developed the Language Server Protocol (LSP) which allows front-end IDE clients and back-end servers to interact seamlessly without implementation-specific code to support a new language [25]. Eclipse Che and Theia provide support for graphical extensions to traditional text-based use cases, including for the Graphical Language Server Platform (GLSP), a framework to define a diagram editor that can create shapes (nodes) and edge connections between those shapes [26]. Because GLSP includes support for the language server protocol, no additional work is needed to incorporate the graphical editor with an IDE like Eclipse Theia that also supports LSP. Having an IDE that supports a graphical language framework can lead to a product that works for less-experienced programmers, like scientists who want to perform data analysis but cannot necessarily write a whole program in Python. Being able to freely arrange shapes, connect and modify them in a diagram editor can open up new possibilities to scientists to manipulate and explore their data. The LSP has the potential to narrow the divide between visual and textual programming languages because it can define a common syntax and language to translate from one to the other. However, this proved to not be necessary for PyWorkflow which was able to achieve the visual/textual translation through a standard RESTful API. Implementing the LSP for PyWorkflow would have added unneeded complexity and a steeper learning curve for prospective users. By taking a RESTful approach, workflow modifications are easy to understand and can be easily extended as new technologies are developed.
Visual Programming with PyWorkflow
Overview PyWorkflow is a web-based visual programming application for building data science pipelines and workflows. It leverages the power of Python and pandas DataFrames underneath an intuitive user interface. Everyone from students to experienced data scientists can speed up analysis with configurable and reusable workflows that can be shared across use cases. With a containerized back-end and a browser-based front-end, running a PyWorkflow is as simple as visiting a webpage. For those wanting more local functionality, the containerized application can be hosted on a local machine. It is open source and also available on GitHub [27].
Design Interface
10
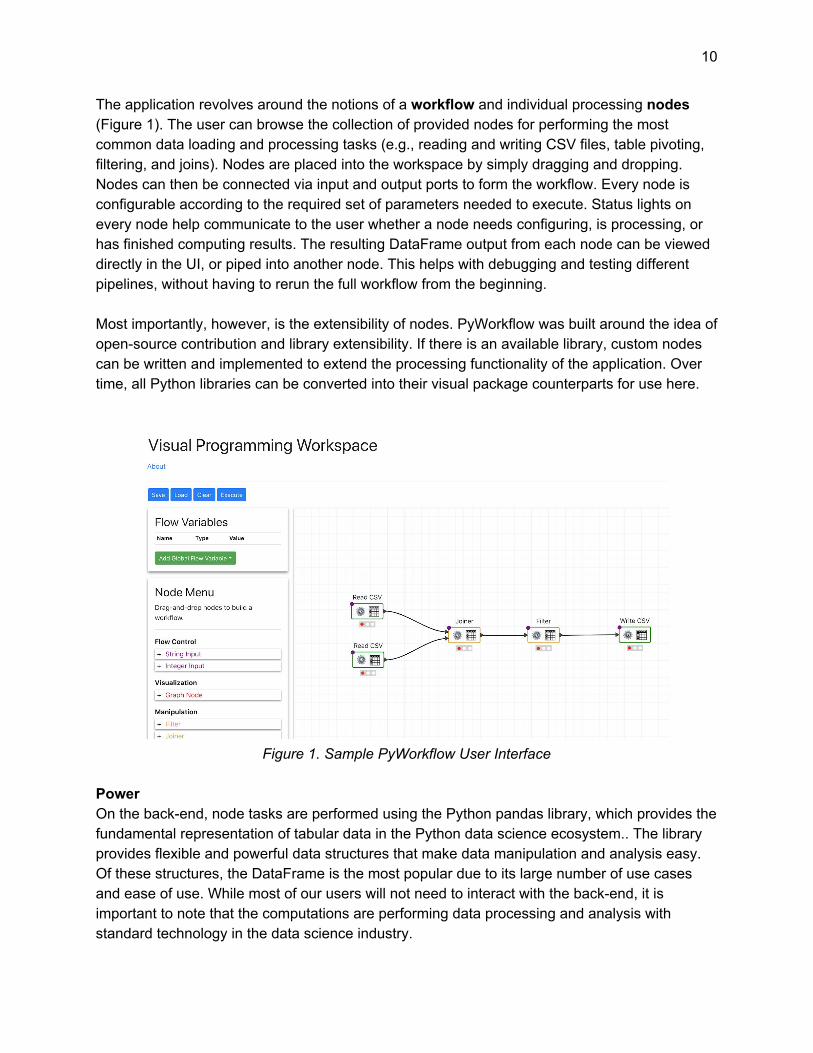
The application revolves around the notions of a workflow and individual processing nodes (Figure 1). The user can browse the collection of provided nodes for performing the most common data loading and processing tasks (e.g., reading and writing CSV files, table pivoting, filtering, and joins). Nodes are placed into the workspace by simply dragging and dropping. Nodes can then be connected via input and output ports to form the workflow. Every node is configurable according to the required set of parameters needed to execute. Status lights on every node help communicate to the user whether a node needs configuring, is processing, or has finished computing results. The resulting DataFrame output from each node can be viewed directly in the UI, or piped into another node. This helps with debugging and testing different pipelines, without having to rerun the full workflow from the beginning. Most importantly, however, is the extensibility of nodes. PyWorkflow was built around the idea of open-source contribution and library extensibility. If there is an available library, custom nodes can be written and implemented to extend the processing functionality of the application. Over time, all Python libraries can be converted into their visual package counterparts for use here.
Figure 1. Sample PyWorkflow User Interface
Power On the back-end, node tasks are performed using the Python pandas library, which provides the fundamental representation of tabular data in the Python data science ecosystem.. The library provides flexible and powerful data structures that make data manipulation and analysis easy. Of these structures, the DataFrame is the most popular due to its large number of use cases and ease of use. While most of our users will not need to interact with the back-end, it is important to note that the computations are performing data processing and analysis with standard technology in the data science industry.
11
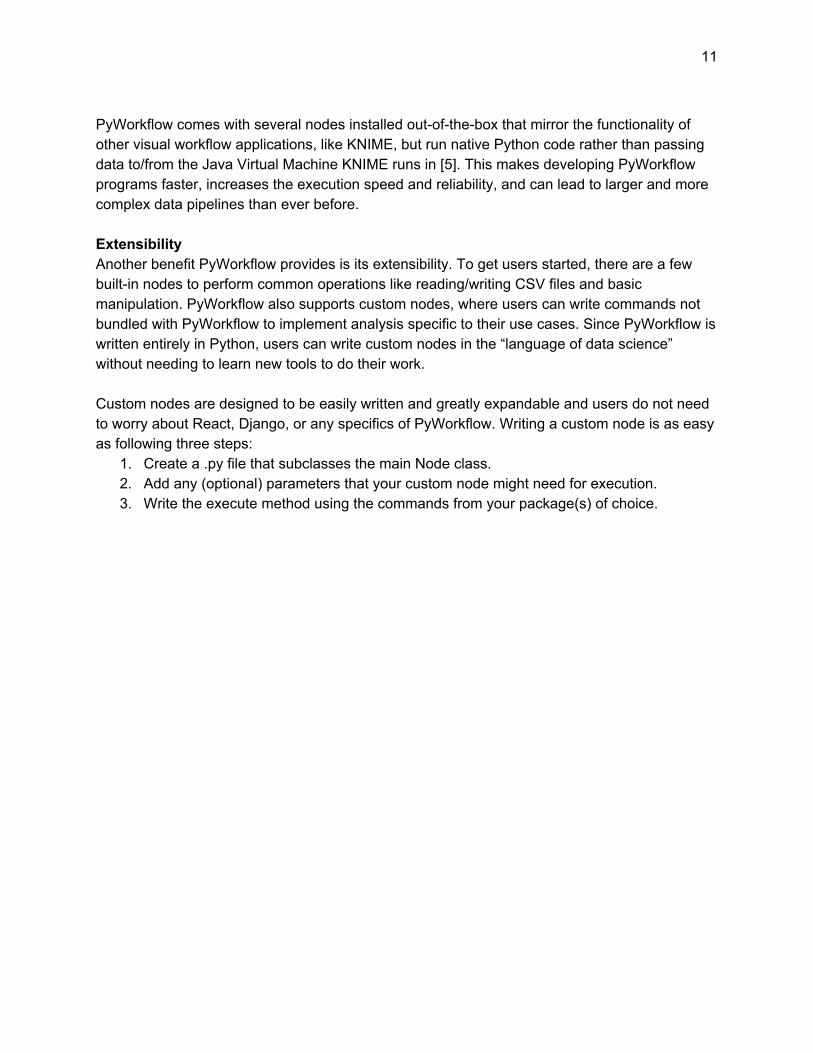
PyWorkflow comes with several nodes installed out-of-the-box that mirror the functionality of other visual workflow applications, like KNIME, but run native Python code rather than passing data to/from the Java Virtual Machine KNIME runs in [5]. This makes developing PyWorkflow programs faster, increases the execution speed and reliability, and can lead to larger and more complex data pipelines than ever before. Extensibility Another benefit PyWorkflow provides is its extensibility. To get users started, there are a few built-in nodes to perform common operations like reading/writing CSV files and basic manipulation. PyWorkflow also supports custom nodes, where users can write commands not bundled with PyWorkflow to implement analysis specific to their use cases. Since PyWorkflow is written entirely in Python, users can write custom nodes in the “language of data science” without needing to learn new tools to do their work. Custom nodes are designed to be easily written and greatly expandable and users do not need to worry about React, Django, or any specifics of PyWorkflow. Writing a custom node is as easy as following three steps:
1. Create a .py file that subclasses the main Node class. 2. Add any (optional) parameters that your custom node might need for execution. 3. Write the execute method using the commands from your package(s) of choice.
12
Figure 2. Example of a custom node class.
Steps one and two are mostly boilerplate code that can be copied from existing built-in nodes, or from custom nodes users have already written. The real power and customization lies in the execute method where users can take advantage of any Python package from pandas for data analysis, Altair or MatPlotLib for creating charts and visualizations, or even PyTorch and TensorFlow for machine learning. Each execute method is provided with the data from the preceding Nodes and current node configuration options (including any flow variable substitutions). The custom node can then read, write, modify, and add new data, or whatever functionality is provided by the package of choice. Nodes that rely solely on pre-installed packages like pandas require no additional steps. They can be easily uploaded through the user interface where it appears with other nodes to drag-and-drop into a new or existing workflow. In the case where PyWorkflow is running remotely and managed by an administrator, custom nodes appear for all users with access to the deployment.
13
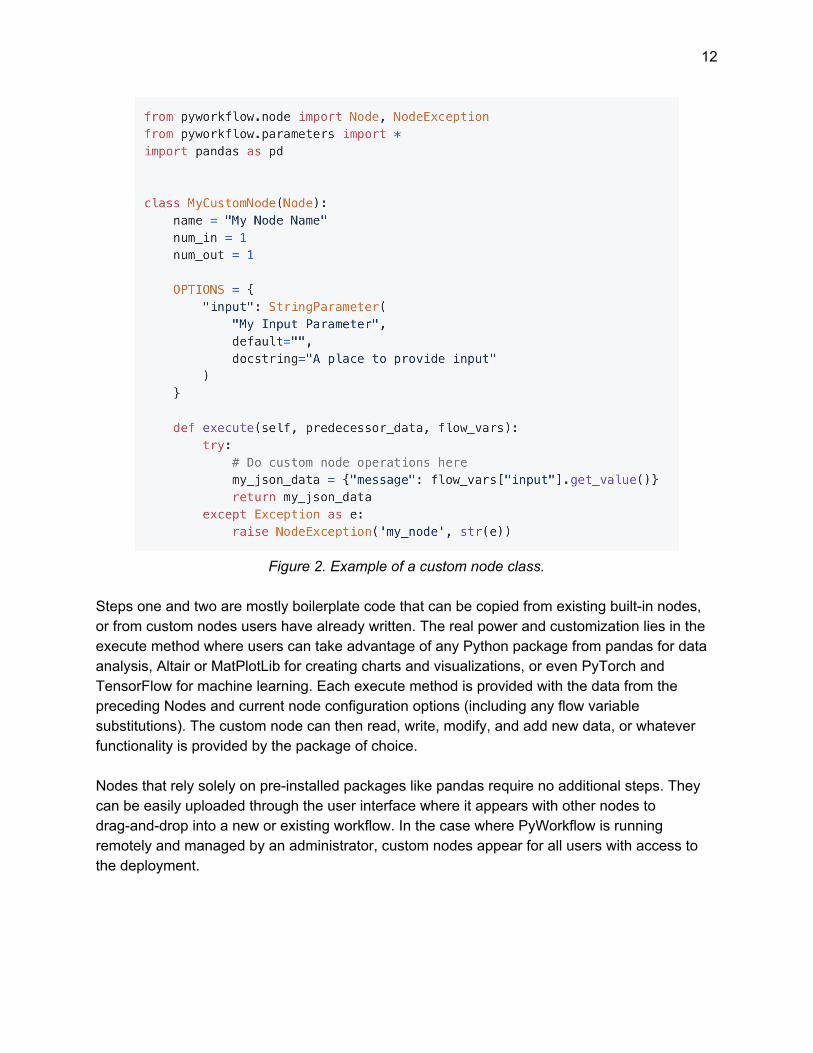
Figure 3. Custom node that is missing packages.
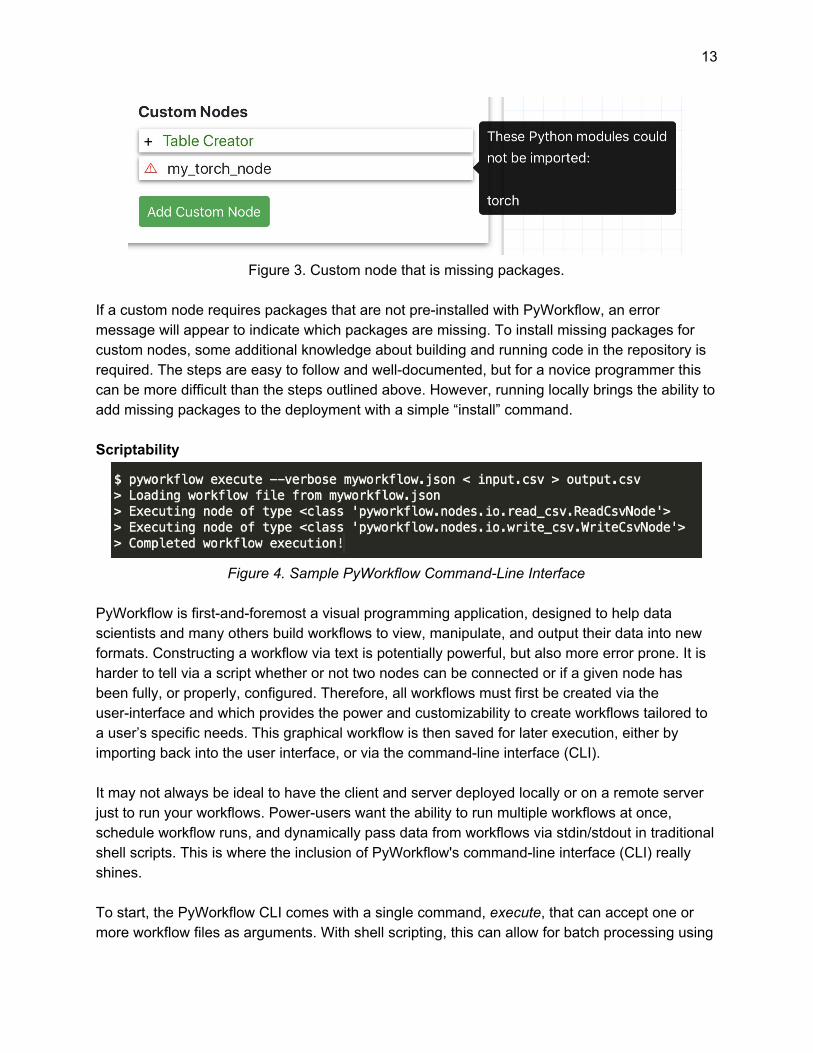
If a custom node requires packages that are not pre-installed with PyWorkflow, an error message will appear to indicate which packages are missing. To install missing packages for custom nodes, some additional knowledge about building and running code in the repository is required. The steps are easy to follow and well-documented, but for a novice programmer this can be more difficult than the steps outlined above. However, running locally brings the ability to add missing packages to the deployment with a simple “install” command. Scriptability
Figure 4. Sample PyWorkflow Command-Line Interface
PyWorkflow is first-and-foremost a visual programming application, designed to help data scientists and many others build workflows to view, manipulate, and output their data into new formats. Constructing a workflow via text is potentially powerful, but also more error prone. It is harder to tell via a script whether or not two nodes can be connected or if a given node has been fully, or properly, configured. Therefore, all workflows must first be created via the user-interface and which provides the power and customizability to create workflows tailored to a user’s specific needs. This graphical workflow is then saved for later execution, either by importing back into the user interface, or via the command-line interface (CLI). It may not always be ideal to have the client and server deployed locally or on a remote server just to run your workflows. Power-users want the ability to run multiple workflows at once, schedule workflow runs, and dynamically pass data from workflows via stdin/stdout in traditional shell scripts. This is where the inclusion of PyWorkflow's command-line interface (CLI) really shines. To start, the PyWorkflow CLI comes with a single command, execute, that can accept one or more workflow files as arguments. With shell scripting, this can allow for batch processing using
14
wildcards to select multiple workflows at once and scheduling using tools like cron. PyWorkflow also supports redirection and pipes to read data from stdin and write data to stdout. All these tools combined allows for easy integration into existing scripts and fast development of new ones. A user can use redirection combined with batch processing to run the same workflows multiple times using different inputs and then compare results. It also enables users to integrate PyWorkflow with existing scripts to pass data between other command-line tools opening workflows to pre-built solutions and tools.
Technical Design Decisions As with any software project, decisions and tradeoffs were made during the design and development of PyWorkflow. UI Toolkit The application’s originator had envisioned a web-based IDE built with Theia and its GLSP (Graphical Language Server Protocol) extension. While Theia is a powerful and extensible IDE toolkit, its use with GLSP was largely undocumented and unintuitive. The team determined such a system would require a complex architecture with multiple servers, as well as valuable development time to bootstrap. We opted to sacrifice the functionality of Theia for the simplicity of a single page application with the popular React framework. Incremental Workflow Construction With the client-server model established, the question of request structure became critical; namely whether each user action (e.g., add node, configure parameter) should trigger the server to incrementally adjust its representation of the workflow, or whether it should be constructed only after the user had configured it entirely. The incremental approach would provide more opportunities for immediate feedback and validation at the expense of having to persist the back end graph between requests. As we identified the set of user actions, we found that they mapped clearly onto CRUD operations, and designed a REST API with resources modeling workflows and nodes. Each action the user performs is translated to a request that updates the workflow on the server. Workflow Representation and Persistence The choice to build workflows over dozens of API requests forced us to decide how to persist the workflow on the server in between requests. Because the front-end library used JSON to serialize the workflow, we opted for consistency, and used the JSON I/O functionality of Python’s NetworkX library to serialize the workflow on the server. By storing the graph as structured JSON, we can easily de-serialize the graph upon each request. Another benefit of storing workflows as structured JSON data is it enables comparison across different versions of the same workflow. This can be used to track how nodes and edges are modified across time, allowing users to debug their workflow should a problem occur after a change. Plain text is also
15
easily compressed which is great for large workflows that need to be shared amongst many people. Client-Server File Handling A consequence of a web-based application (in contrast to a local one like KNIME) is that all files involved in a workflow must be sent between the browser and the server. We struggled to coordinate file handling between the application components (UI, API, and processing model). Our solution involved UUID-based file identification and the passing of file storage locations as parameters across components. The design synchronously transfers files when necessary, a design limitation acknowledged in the next section.
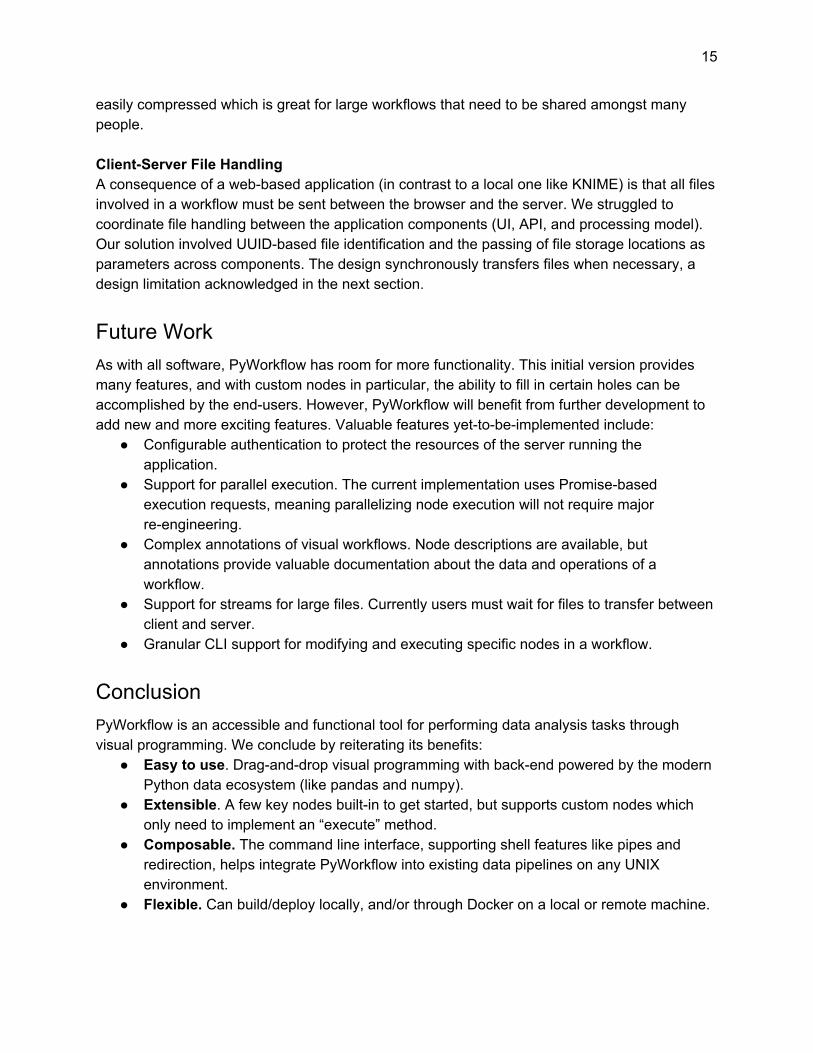
Future Work As with all software, PyWorkflow has room for more functionality. This initial version provides many features, and with custom nodes in particular, the ability to fill in certain holes can be accomplished by the end-users. However, PyWorkflow will benefit from further development to add new and more exciting features. Valuable features yet-to-be-implemented include:
● Configurable authentication to protect the resources of the server running the application.
● Support for parallel execution. The current implementation uses Promise-based execution requests, meaning parallelizing node execution will not require major re-engineering.
● Complex annotations of visual workflows. Node descriptions are available, but annotations provide valuable documentation about the data and operations of a workflow.
● Support for streams for large files. Currently users must wait for files to transfer between client and server.
● Granular CLI support for modifying and executing specific nodes in a workflow.
Conclusion PyWorkflow is an accessible and functional tool for performing data analysis tasks through visual programming. We conclude by reiterating its benefits:
● Easy to use. Drag-and-drop visual programming with back-end powered by the modern Python data ecosystem (like pandas and numpy).
● Extensible. A few key nodes built-in to get started, but supports custom nodes which only need to implement an “execute” method.
● Composable. The command line interface, supporting shell features like pipes and redirection, helps integrate PyWorkflow into existing data pipelines on any UNIX environment.
● Flexible. Can build/deploy locally, and/or through Docker on a local or remote machine.
16
References 1. https://www.knime.com 2. https://www.3dsbiovia.com/portfolio/pipeline-pilot.html 3. https://rapidminer.com 4. Kopf, D. (2017, December 8). “Meet the man behind the most important tool in data
science.” Quartz. https://qz.com/1126615/the-story-of-the-most-important-tool-in-data-science/
5. https://www.knime.com/blog/optimizing-knime-workflows-for-performance 6. https://www.manning.com/books/pandas-in-action 7. Tsai, C.-Y. (2019, June). Improving Students' Understanding of Basic Programming
Concepts Through VIsual Programming Language: The Role of Self-Efficacy. Computers in Human Behavior, 95, 224-232.
8. Dunn, Jr., W., Burgun, A., Krebs, M.-O., & Rance, B. (2017, November). Exploring and Visualizing Multidimensional Data in Translational Research Platforms. Briefings in Bioinformatics, 18(6), 1044-1056.
9. Blackwell, A. F., Whitley, K. N., Good, J., & Petre, M. (2001). Cognitive Factors in Programming with Diagrams. Artificial Intelligence Review, 15, 95-114.
10. Hill, B. M., & Monroy-Hernandez, A. (2013). The Cost of Collaboration for Code and Art: Evidence from a Remixing Community. ACM Conference on Computer Supported Cooperative Work. San Antonio, TX: ACM.
11. Ko, A. J., Burnett, M. M., Green, T. G., Rothermel, K. J., & Cook, C. R. (2002). Improving the Design of Visual Programming Language Experiments Using Cognitive Walkthroughs. Journal of VIsual Languages and Computing, 13, 517-544.
12. Cormen, T. H., Leiserson, C. E., Rivest, R. L., & Stein, C. (2009). Introduction to algorithms. MIT press.
13. Olah, C. Calculus on Computational Graphs: Backpropagation. https://colah.github.io/posts/2015-08-Backprop/
14. Reading makefiles. https://www.gnu.org/software/make/manual/html_node/Reading-Makefiles.html
15. Askren, M. K., McAllister-Day, T. K., Koh, N., Mestre, Z., Dines, J. N., Korman, B. A., ... & Rane, S. D. (2016). Using make for reproducible and parallel neuroimaging workflow and quality-assurance. Frontiers in Neuroinformatics, 10, 2.
16. Rodrigues, M. R., Magalhães, W. C., Machado, M., & Tarazona-Santos, E. (2012). A graph-based approach for designing extensible pipelines. BMC bioinformatics, 13(1), 163.
17. KNIME Analytics Platform.(2020). Retrieved from www.knime.com/knime-analytics-platform.
18. Berthold M.R. et al. (2008) KNIME: The Konstanz Information Miner. In: Preisach C., Burkhardt H., Schmidt-Thieme L., Decker R. (eds) Data Analysis, Machine Learning and Applications. Studies in Classification, Data Analysis, and Knowledge Organization. Springer, Berlin, Heidelberg.

17
19. KNIME Data Table Structure. (2020). Retrieved from www.knime.com/knime-introductory-course/chapter1/section3/data-table-structure.
20. Pipeline Pilot (2020). Retrieved from www.3dsbiovia.com/portfolio/pipeline-pilot.html . 21. Warr, W.A. Scientific workflow systems: Pipeline Pilot and KNIME. J Comput Aided Mol
Des 26, 801–804 (2012). 22. Tran, Hai T, Dang, Hai H, Do, Kha N, Tran, Thu D, & Nguyen, Vu. (2013). An interactive
Web-based IDE towards teaching and learning in programming courses. Proceedings of 2013 IEEE International Conference on Teaching, Assessment and Learning for Engineering (TALE), 439-444.
23. Wayner, P. (2013). Review: 4 killer cloud IDEs. InfoWorld.Com. 24. Itahriouan, Z., Aknin, N., Abtoy, A., & El Kadiri, K. (2014). Building a Web-based IDE
from Web 2. 0 perspective. International Journal of Computer Applications, 96(22), 46-50.
25. https://microsoft.github.io/language-server-protocol/ 26. https://www.eclipse.org/glsp/ 27. https://github.com/PyWorkflowApp/visual-programming
Design of the System
Figure 5. Application Diagram with Service Interactions
The backbone of the application logic is the Workflow model, described in detail in the next section. The model offers a programmatic interface to create, configure, connect, and delete processing nodes to create an executable workflow. This functionality is made accessible primarily by a REST API built with the Django web framework. To build a workflow, a user employs the web-based interface: a single page application (built with React) that interacts with the API via asynchronous HTTP requests. The UI offers the ability to save and load configured workflows. Finally, those workflows can be executed or batched via a command line interface, which interfaces directly with the workflow model rather than the web server.
18
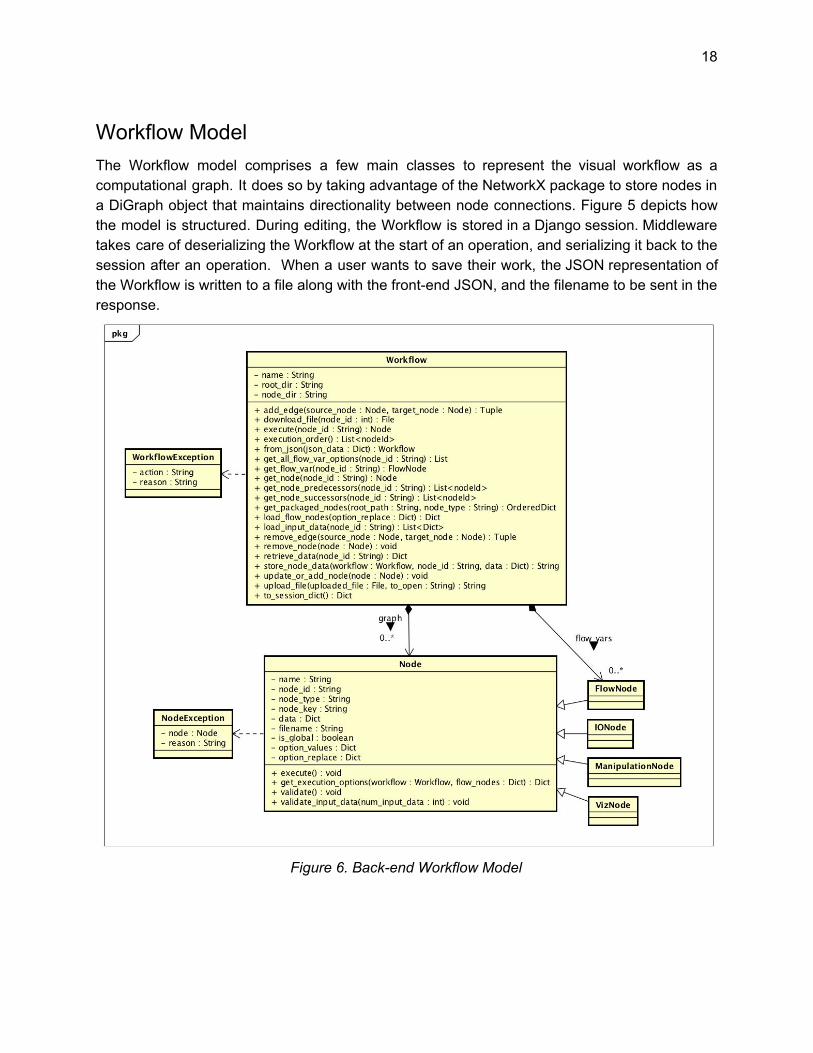
Workflow Model The Workflow model comprises a few main classes to represent the visual workflow as a computational graph. It does so by taking advantage of the NetworkX package to store nodes in a DiGraph object that maintains directionality between node connections. Figure 5 depicts how the model is structured. During editing, the Workflow is stored in a Django session. Middleware takes care of deserializing the Workflow at the start of an operation, and serializing it back to the session after an operation. When a user wants to save their work, the JSON representation of the Workflow is written to a file along with the front-end JSON, and the filename to be sent in the response.
Figure 6. Back-end Workflow Model

19
Workflow The Workflow class defines all information and basic operations needed to translate the visual workflow to a computational graph. The computational graph is defined using the NetworkX package that manages the graph structure. The Workflow class implements basic create, read, update, and delete functionality to modify Nodes and edge connections in the NetworkX representation. Other NetworkX functions important for the Workflow, like a topologically sorted list of Nodes, are present in wrapper functions. The Workflow class also handles operations to pass data to/from the Django application.
Property Name Type Description
name String Name of the Workflow.
root_dir String Root directory to store files associated with the Workflow (raw data files, intermediate execution data).
node_dir String Directory where Nodes available to the Workflow are located.
Association Name Type Description
graph DiGraph A NetworkX DiGraph object that contains a collection of Node objects. The graph is deserialized at the start of each request, and is serialized back to JSON at the end, so it can be stored in the session.
flow_vars Graph A NetworkX Graph object that contains a collection of FlowNode objects separate from the main workflow graph. These FlowNodes are different from nodes in the workflow in that they cannot form edge connections like regular Nodes.
20
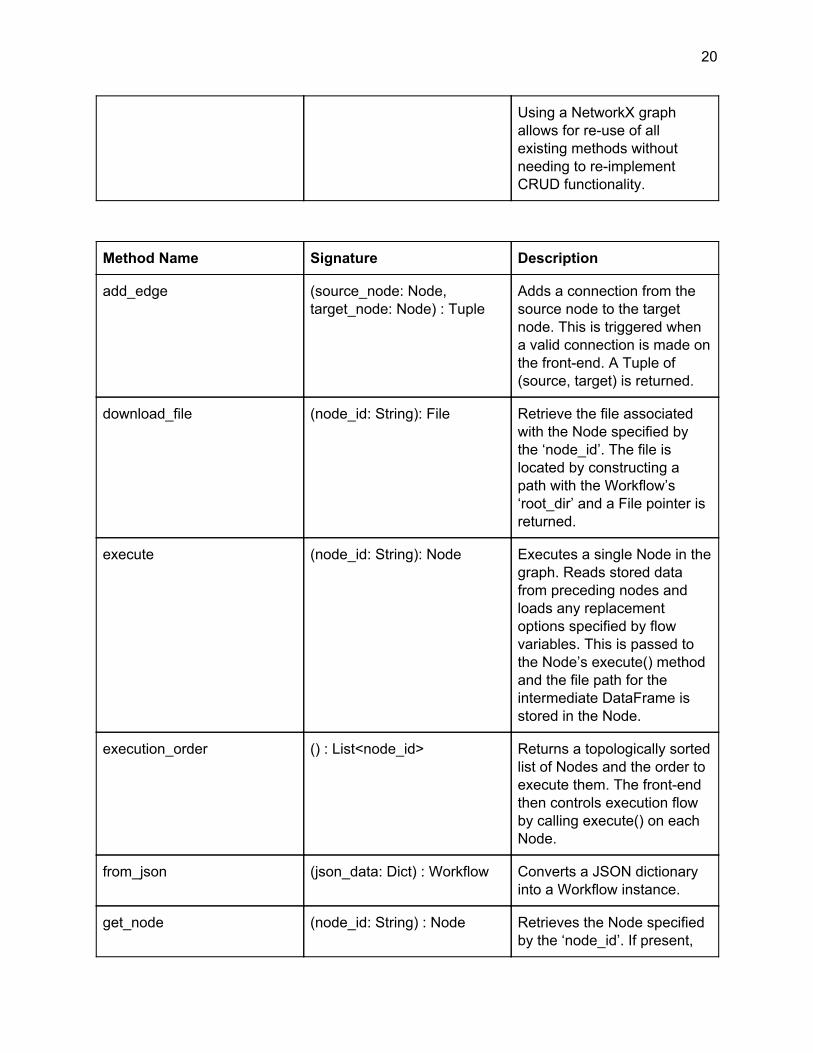
Using a NetworkX graph allows for re-use of all existing methods without needing to re-implement CRUD functionality.
Method Name Signature Description
add_edge (source_node: Node, target_node: Node) : Tuple
Adds a connection from the source node to the target node. This is triggered when a valid connection is made on the front-end. A Tuple of (source, target) is returned.
download_file (node_id: String): File Retrieve the file associated with the Node specified by the ‘node_id’. The file is located by constructing a path with the Workflow’s ‘root_dir’ and a File pointer is returned.
execute (node_id: String): Node Executes a single Node in the graph. Reads stored data from preceding nodes and loads any replacement options specified by flow variables. This is passed to the Node’s execute() method and the file path for the intermediate DataFrame is stored in the Node.
execution_order () : List<node_id> Returns a topologically sorted list of Nodes and the order to execute them. The front-end then controls execution flow by calling execute() on each Node.
from_json (json_data: Dict) : Workflow Converts a JSON dictionary into a Workflow instance.
get_node (node_id: String) : Node Retrieves the Node specified by the ‘node_id’. If present,
21
the JSON information is retrieved from the graph and converted into a Node object.
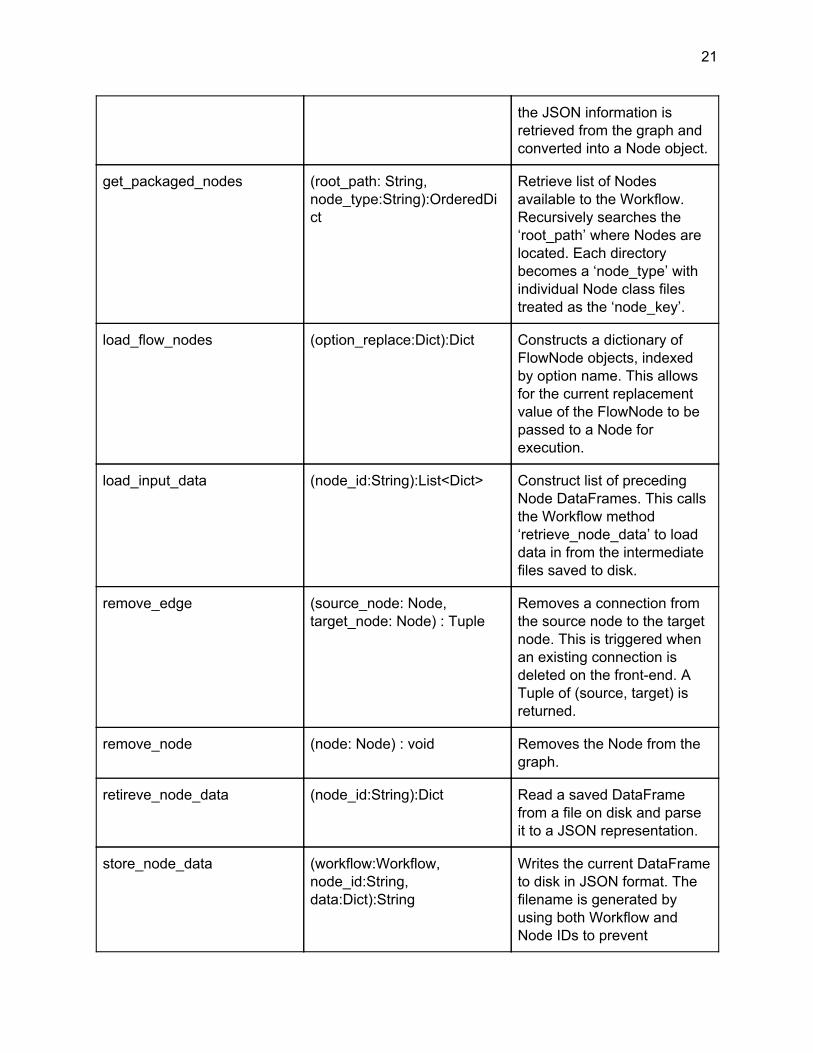
get_packaged_nodes (root_path: String, node_type:String):OrderedDict
Retrieve list of Nodes available to the Workflow. Recursively searches the ‘root_path’ where Nodes are located. Each directory becomes a ‘node_type’ with individual Node class files treated as the ‘node_key’.
load_flow_nodes (option_replace:Dict):Dict Constructs a dictionary of FlowNode objects, indexed by option name. This allows for the current replacement value of the FlowNode to be passed to a Node for execution.
load_input_data (node_id:String):List<Dict> Construct list of preceding Node DataFrames. This calls the Workflow method ‘retrieve_node_data’ to load data in from the intermediate files saved to disk.
remove_edge (source_node: Node, target_node: Node) : Tuple
Removes a connection from the source node to the target node. This is triggered when an existing connection is deleted on the front-end. A Tuple of (source, target) is returned.
remove_node (node: Node) : void Removes the Node from the graph.
retireve_node_data (node_id:String):Dict Read a saved DataFrame from a file on disk and parse it to a JSON representation.
store_node_data (workflow:Workflow, node_id:String, data:Dict):String
Writes the current DataFrame to disk in JSON format. The filename is generated by using both Workflow and Node IDs to prevent

22
clobbering.
update_or_add_node (node: Node) : void Updates the Node in the graph, if one matching the ‘node_id’ exists. Otherwise, it creates a new Node in the graph.
upload_file (uploaded_file: File, to_open:String):String
Takes a file pointer and a path for where to save it. This makes the method accept both raw Node data and custom Node files.
to_session_dict () : Dict Serializes the Workflow into a dict() that can be stored in the session.
Node The Node class is an interface that defines all properties and methods required of any command to be executed by the workflow.
Property Name Type Description
name String Display name for the Node.
node_id String Unique id for the Node, generated by React-diagrams.
node_type String The type of Node (allowed values: ‘io, ‘manipulation’, ‘flow_control’, ‘visualization’, and ‘custom_nodes’).
node_key String The concrete Node key (allowed values: concrete Node class names—e.g., ReadCsvNode, WriteCsvNode).
data String The file path that points to a pandas DataFrame converted to JSON after execution. If the Node has not been executed, the value is None.
23
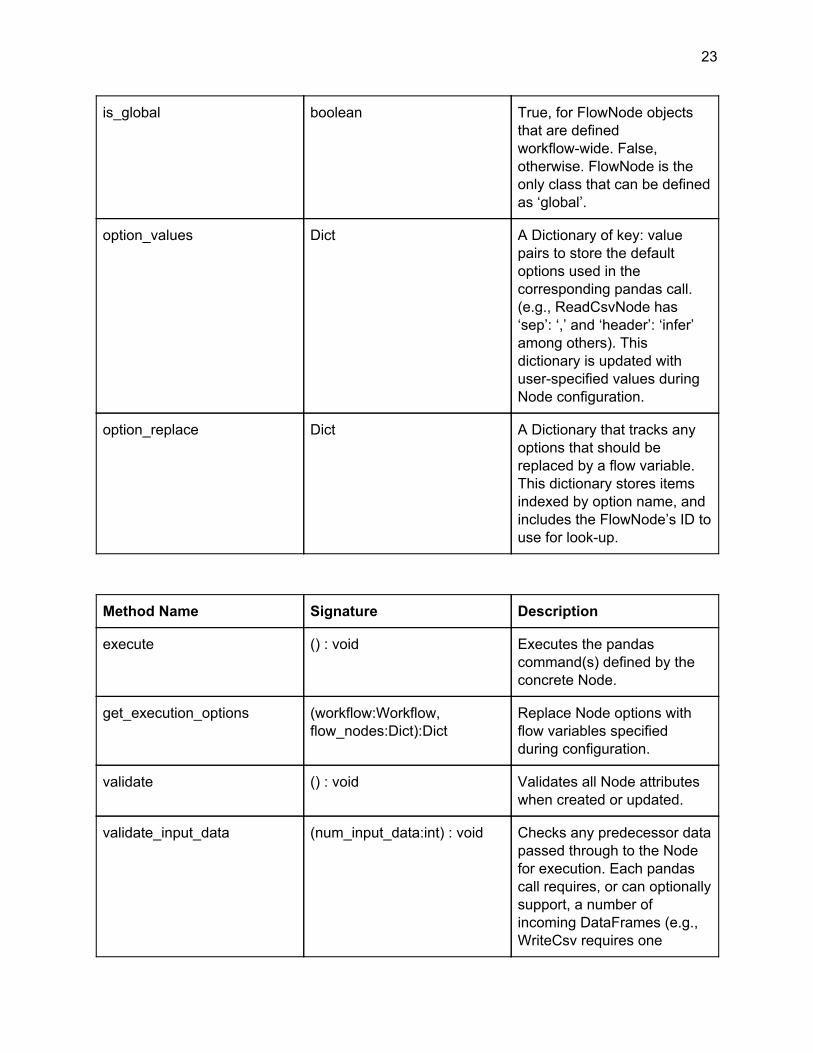
is_global boolean True, for FlowNode objects that are defined workflow-wide. False, otherwise. FlowNode is the only class that can be defined as ‘global’.
option_values Dict A Dictionary of key: value pairs to store the default options used in the corresponding pandas call. (e.g., ReadCsvNode has ‘sep’: ‘,’ and ‘header’: ‘infer’ among others). This dictionary is updated with user-specified values during Node configuration.
option_replace Dict A Dictionary that tracks any options that should be replaced by a flow variable. This dictionary stores items indexed by option name, and includes the FlowNode’s ID to use for look-up.
Method Name Signature Description
execute () : void Executes the pandas command(s) defined by the concrete Node.
get_execution_options (workflow:Workflow, flow_nodes:Dict):Dict
Replace Node options with flow variables specified during configuration.
validate () : void Validates all Node attributes when created or updated.
validate_input_data (num_input_data:int) : void Checks any predecessor data passed through to the Node for execution. Each pandas call requires, or can optionally support, a number of incoming DataFrames (e.g., WriteCsv requires one
24
DataFrame; JoinNode requires one DataFrame, but can accept two).
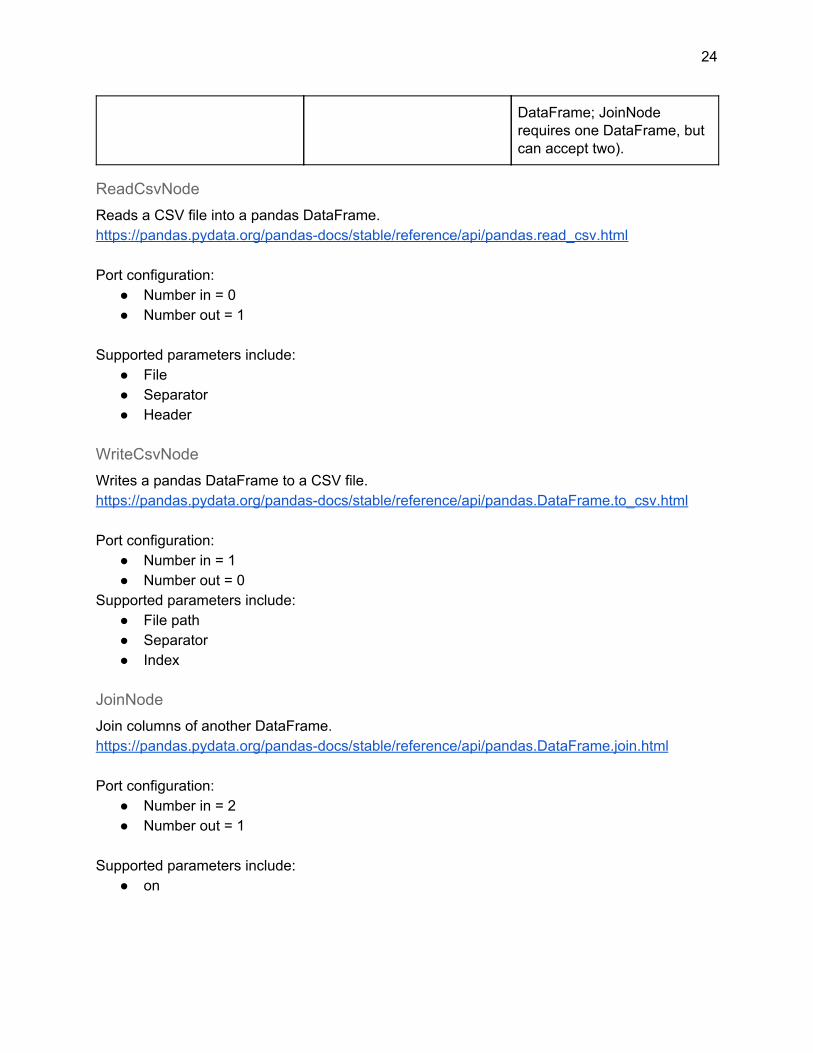
ReadCsvNode Reads a CSV file into a pandas DataFrame. https://pandas.pydata.org/pandas-docs/stable/reference/api/pandas.read_csv.html Port configuration:
● Number in = 0 ● Number out = 1
Supported parameters include:
● File ● Separator ● Header
WriteCsvNode Writes a pandas DataFrame to a CSV file. https://pandas.pydata.org/pandas-docs/stable/reference/api/pandas.DataFrame.to_csv.html Port configuration:
● Number in = 1 ● Number out = 0
Supported parameters include: ● File path ● Separator ● Index
JoinNode Join columns of another DataFrame. https://pandas.pydata.org/pandas-docs/stable/reference/api/pandas.DataFrame.join.html Port configuration:
● Number in = 2 ● Number out = 1
Supported parameters include:
● on
25
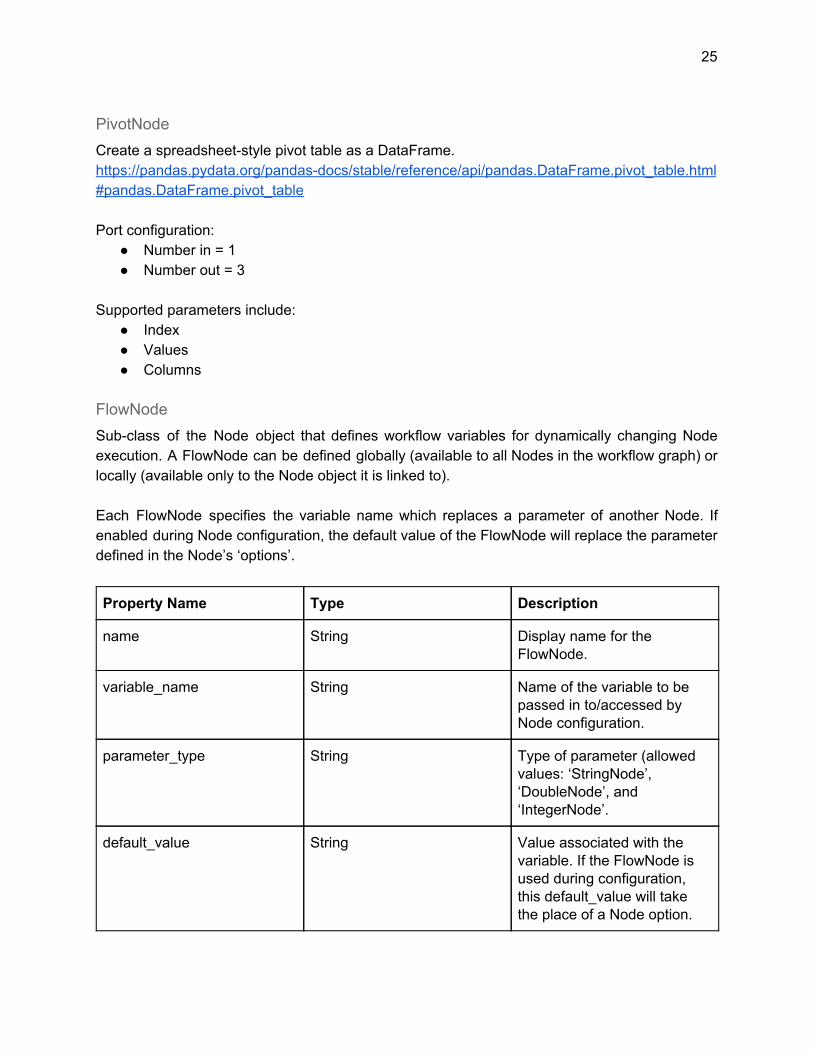
PivotNode Create a spreadsheet-style pivot table as a DataFrame. https://pandas.pydata.org/pandas-docs/stable/reference/api/pandas.DataFrame.pivot_table.html#pandas.DataFrame.pivot_table Port configuration:
● Number in = 1 ● Number out = 3
Supported parameters include:
● Index ● Values ● Columns
FlowNode Sub-class of the Node object that defines workflow variables for dynamically changing Node execution. A FlowNode can be defined globally (available to all Nodes in the workflow graph) or locally (available only to the Node object it is linked to). Each FlowNode specifies the variable name which replaces a parameter of another Node. If enabled during Node configuration, the default value of the FlowNode will replace the parameter defined in the Node’s ‘options’.
Property Name Type Description
name String Display name for the FlowNode.
variable_name String Name of the variable to be passed in to/accessed by Node configuration.
parameter_type String Type of parameter (allowed values: ‘StringNode’, ‘DoubleNode’, and ‘IntegerNode’.
default_value String Value associated with the variable. If the FlowNode is used during configuration, this default_value will take the place of a Node option.
26
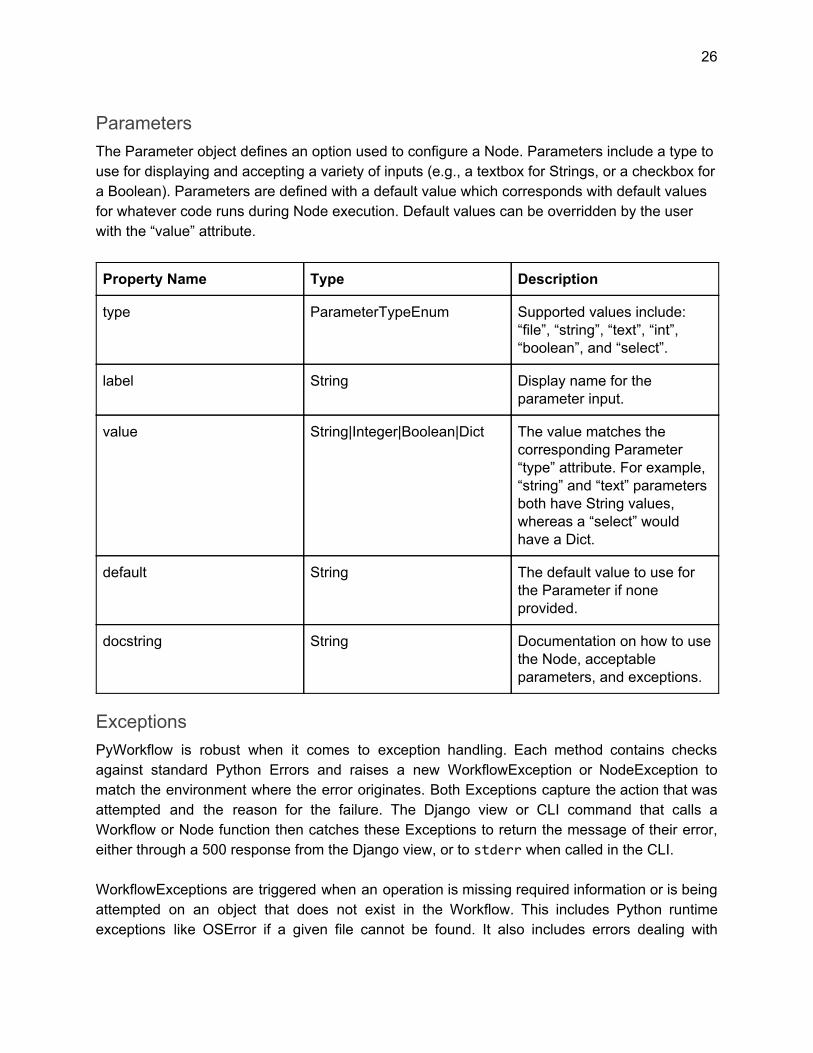
Parameters The Parameter object defines an option used to configure a Node. Parameters include a type to use for displaying and accepting a variety of inputs (e.g., a textbox for Strings, or a checkbox for a Boolean). Parameters are defined with a default value which corresponds with default values for whatever code runs during Node execution. Default values can be overridden by the user with the “value” attribute.
Property Name Type Description
type ParameterTypeEnum Supported values include: “file”, “string”, “text”, “int”, “boolean”, and “select”.
label String Display name for the parameter input.
value String|Integer|Boolean|Dict The value matches the corresponding Parameter “type” attribute. For example, “string” and “text” parameters both have String values, whereas a “select” would have a Dict.
default String The default value to use for the Parameter if none provided.
docstring String Documentation on how to use the Node, acceptable parameters, and exceptions.
Exceptions PyWorkflow is robust when it comes to exception handling. Each method contains checks against standard Python Errors and raises a new WorkflowException or NodeException to match the environment where the error originates. Both Exceptions capture the action that was attempted and the reason for the failure. The Django view or CLI command that calls a Workflow or Node function then catches these Exceptions to return the message of their error, either through a 500 response from the Django view, or to stderr when called in the CLI. WorkflowExceptions are triggered when an operation is missing required information or is being attempted on an object that does not exist in the Workflow. This includes Python runtime exceptions like OSError if a given file cannot be found. It also includes errors dealing with

27
improperly configured Workflow objects. The Workflow must contain valid components to create, read, update, or delete, otherwise a WorkflowException is thrown. For example, to call ‘remove_node’ the Node to remove must exist in the graph. In the case of ‘add_edge’, both the source and target Nodes must exist and there must not already be an edge between the Nodes. All WorkflowExceptions will include the operation that was attempted and the reason for failure; either the message of the runtime error, or the PyWorkflow specific message. Likewise, NodeExceptions are triggered either during configuration or execution. Configuration exceptions will occur if missing or invalid options are present. For example, if the user attempts to add an integer to a string parameter, validation will fail. An exception will also be raised if a required parameter is missing. During Node execution, the built-in Nodes catch the broad ‘Exception’ case and will wrap the reason in a NodeException. This handles both runtime exceptions (like a missing file) as well as configuration exceptions (if the data is missing a column “X”). Node exceptions during execution could be customized to handle errors differently. When writing a custom node, you could catch an OSError for missing data and have the Node point to a default dataset instead. These custom exceptions can be tailored to the need of each individual Node without affecting other Nodes or the Workflow as a whole. If there are mis-matching input types, a ParameterValidationError will be raised. This validation occurs whenever a Node configuration has been updated and will check all Parameters associated with a Node. The error will contain the value and type provided in addition to the type it is expecting.
Custom Nodes The power of PyWorkflow comes from its support for custom nodes. New data science and other Python packages are being constantly developed. With custom nodes, you can write workflows tailored to your specific needs and packages needed for your specific field. Custom nodes were designed to be easily written and greatly expandable. You don't need to worry about React, Django, or any specifics of PyWorkflow to get started. All you need is:
1. Create a ‘.py’ file that subclasses the main Node class. 2. Add any parameters you need for your node might need for execution. 3. Write an ‘execute()’ method using your package of choice. 4. That's it!
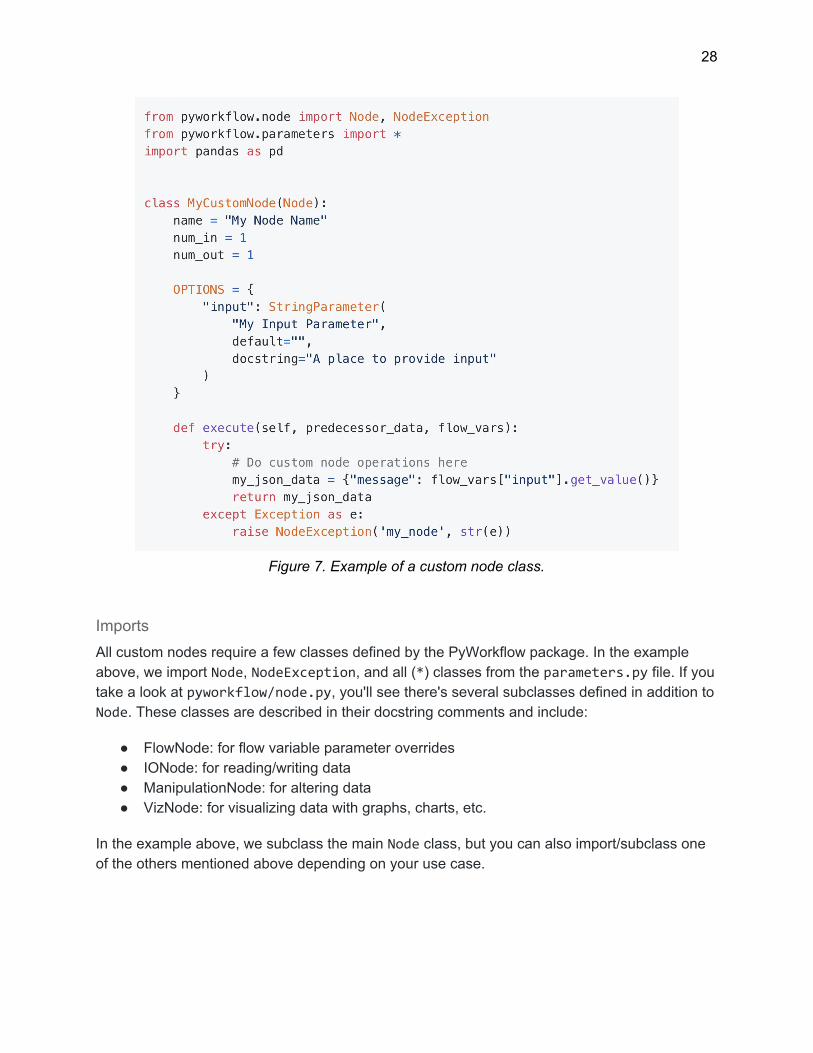
The rest is handled for you, from flow variable overrides, to input data from other nodes in the workflow. A custom node will look something like the code in Figure 7.
28
Figure 7. Example of a custom node class.
Imports All custom nodes require a few classes defined by the PyWorkflow package. In the example above, we import Node, NodeException, and all (*) classes from the parameters.py file. If you take a look at pyworkflow/node.py, you'll see there's several subclasses defined in addition to Node. These classes are described in their docstring comments and include:
● FlowNode: for flow variable parameter overrides ● IONode: for reading/writing data ● ManipulationNode: for altering data ● VizNode: for visualizing data with graphs, charts, etc.
In the example above, we subclass the main Node class, but you can also import/subclass one of the others mentioned above depending on your use case.
29
The final line, import pandas as pd is important as all PyWorkflow nodes use a pandas DataFrame as the atom of data representation. If your custom node reads or writes data, it must start or end with a pandas DataFrame.
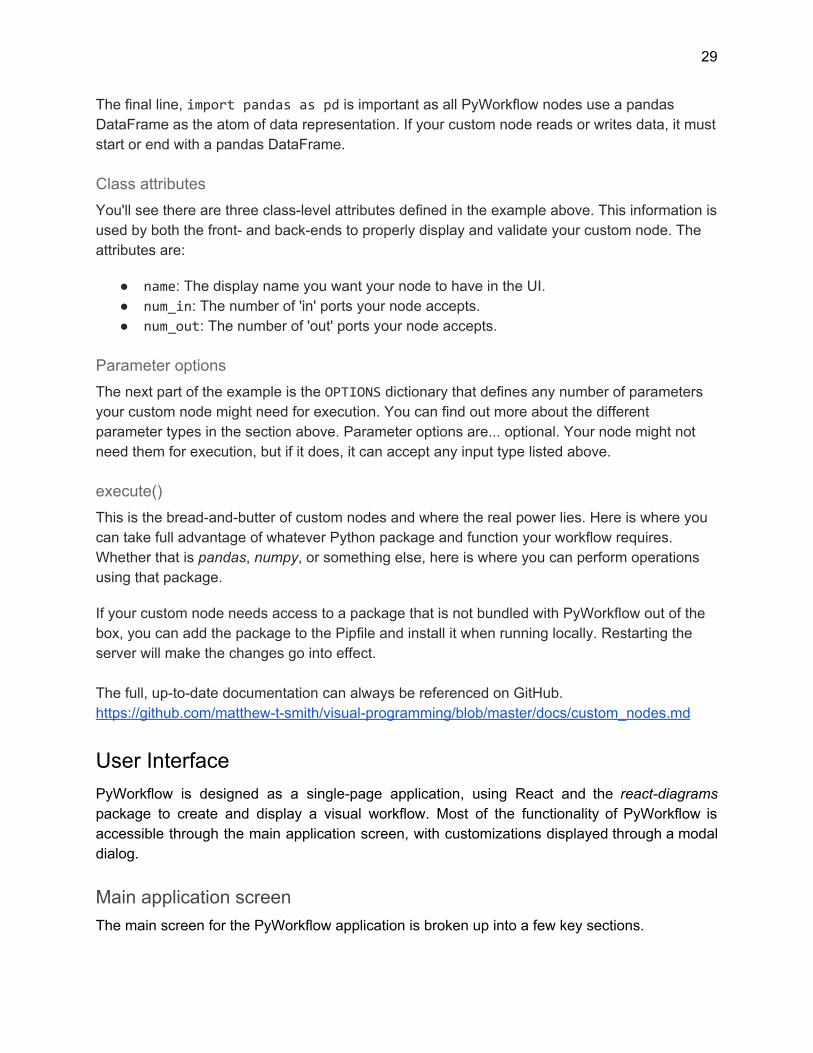
Class attributes You'll see there are three class-level attributes defined in the example above. This information is used by both the front- and back-ends to properly display and validate your custom node. The attributes are:
● name: The display name you want your node to have in the UI. ● num_in: The number of 'in' ports your node accepts. ● num_out: The number of 'out' ports your node accepts.
Parameter options The next part of the example is the OPTIONS dictionary that defines any number of parameters your custom node might need for execution. You can find out more about the different parameter types in the section above. Parameter options are... optional. Your node might not need them for execution, but if it does, it can accept any input type listed above.
execute() This is the bread-and-butter of custom nodes and where the real power lies. Here is where you can take full advantage of whatever Python package and function your workflow requires. Whether that is pandas, numpy, or something else, here is where you can perform operations using that package.
If your custom node needs access to a package that is not bundled with PyWorkflow out of the box, you can add the package to the Pipfile and install it when running locally. Restarting the server will make the changes go into effect. The full, up-to-date documentation can always be referenced on GitHub. https://github.com/matthew-t-smith/visual-programming/blob/master/docs/custom_nodes.md
User Interface PyWorkflow is designed as a single-page application, using React and the react-diagrams package to create and display a visual workflow. Most of the functionality of PyWorkflow is accessible through the main application screen, with customizations displayed through a modal dialog.
Main application screen The main screen for the PyWorkflow application is broken up into a few key sections.
30
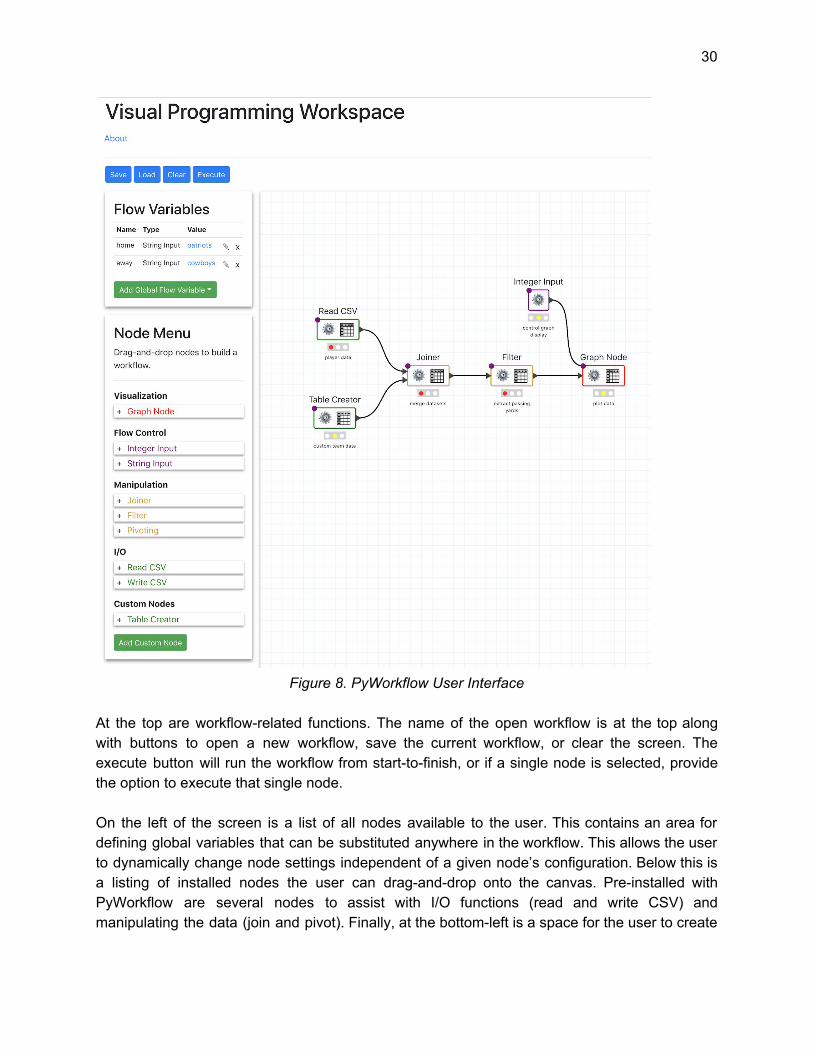
Figure 8. PyWorkflow User Interface
At the top are workflow-related functions. The name of the open workflow is at the top along with buttons to open a new workflow, save the current workflow, or clear the screen. The execute button will run the workflow from start-to-finish, or if a single node is selected, provide the option to execute that single node. On the left of the screen is a list of all nodes available to the user. This contains an area for defining global variables that can be substituted anywhere in the workflow. This allows the user to dynamically change node settings independent of a given node’s configuration. Below this is a listing of installed nodes the user can drag-and-drop onto the canvas. Pre-installed with PyWorkflow are several nodes to assist with I/O functions (read and write CSV) and manipulating the data (join and pivot). Finally, at the bottom-left is a space for the user to create
31
custom nodes. This makes PyWorkflow extensible and open not only to other pandas functions, but other data science packages as well. In the middle is the main canvas where the user constructs their workflow. Nodes added to the canvas can be linked to other nodes by dragging a new edge from an out-port to an in-port. Each node is slightly different depending on the requirements of the underlying pandas function. Every node has icons to configure the settings (the gear) and display the data associated with the node (the table). Clicking either icon will pop-up a modal window that displays the information. The last bit of the main screen is the documentation pane on the right-hand side. A user may access the documentation for any installed node by selecting the node and clicking ‘Help’.
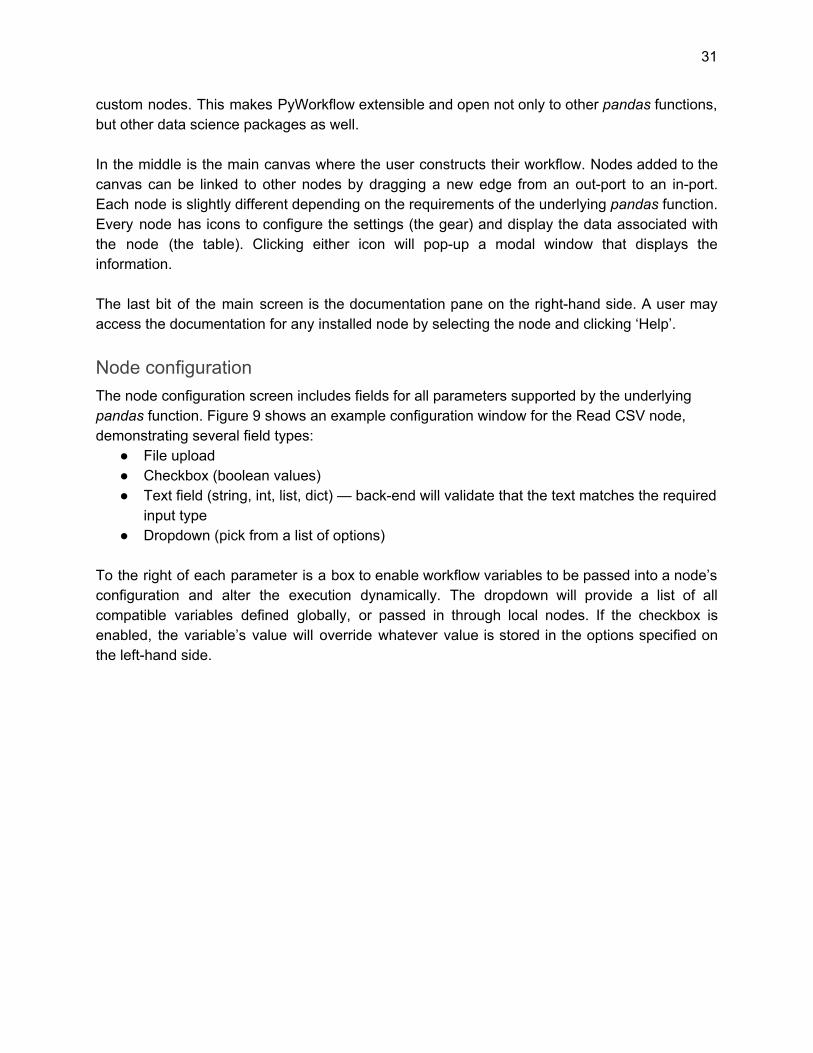
Node configuration The node configuration screen includes fields for all parameters supported by the underlying pandas function. Figure 9 shows an example configuration window for the Read CSV node, demonstrating several field types:
● File upload ● Checkbox (boolean values) ● Text field (string, int, list, dict) — back-end will validate that the text matches the required
input type ● Dropdown (pick from a list of options)
To the right of each parameter is a box to enable workflow variables to be passed into a node’s configuration and alter the execution dynamically. The dropdown will provide a list of all compatible variables defined globally, or passed in through local nodes. If the checkbox is enabled, the variable’s value will override whatever value is stored in the options specified on the left-hand side.
32
Figure 9. Read CSV Configuration Panel
Front-end Architecture The foundation of the front-end relies on the react-diagrams library, which provides models and components for the diagram canvas, nodes, ports, and links, as well as (de)serialization of those models. We extended the base classes to model the state of our domain-specific nodes and links. Figure 10 shows a partial class diagram of domain-specific subclassing of the react-diagrams node model. Our CustomNodeModel (which represents all types of processing nodes) includes attributes for the number of in- and out-ports, key-value pairs of the parameters needed to execute the node, and the node’s status (unconfigured, ready, complete). A port connects a node to another node, and it is in charge of creating the link to connect them. We extend the DefaultPortModel as VPPortModel to create VPLinkModels, and only connect ports if one is of type input, and the other is of type output. The VPLinkModel extends DefaultLinkModel, and has two listeners, whenever a link is connected to a port, we notify the back-end, and in a similar manner, when the link is deleted, we also notify the back-end. VPLinkModel also fixes a bug that DefaultLinkModel has when we create a link by just clicking on a port. Originally, this action would link the port to the left upper corner (coordinates (0, 0)). Now, we check the position is trying to link to and stop linking if we find it is connecting the default coordinate.
33
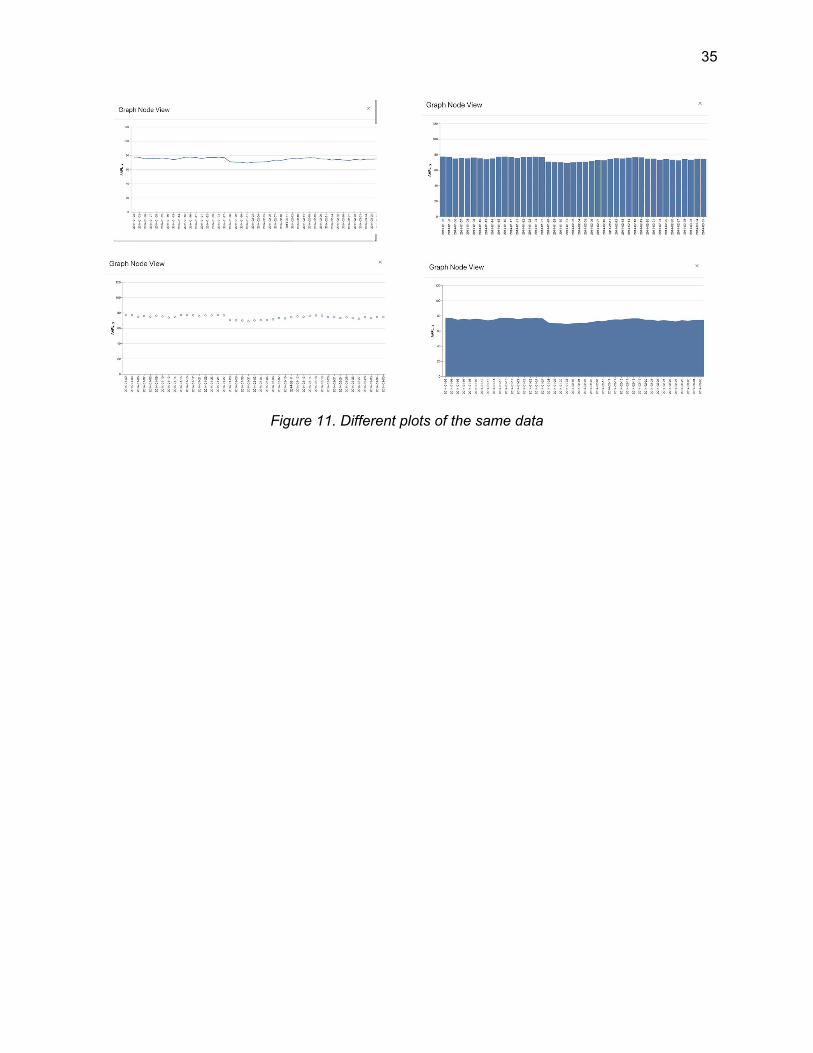
Given that we extend three base classes, we need to also provide their customized factory classes, i.e., CustomNodeFactory, VPLinkFactory, and VPPortFactory. The engine provides methods to set the corresponding factory. These components require three classes: 1) the model, which contains the main logic of the object; 2) the factory, which defines how the models are instantiated; and 3) the widget, which defines how the object is displayed in HTML. The models VPLinkModel and VPPortModel didn’t need a customized widget, so we keep using the default widgets. The CustomNodeFactory generates the mode as CustomNodeModel, and the react widget as CustomNodeWidget, which composes the port widgets, and other components such as NodeConfig, GraphView, and StatusLight. The component NodeConfig opens a dialog with a form to configure each node. This configuration depends on the type of node we are working on, i.e., a graph node displays a configuration related to plotting the data, whereas a reader node displays a configuration related to the file and how to parse it. The StatusLight component is used to display three circles at the bottom of each node to indicate its status by color: red is unconfigured, yellow is ready-to-execute, and green is executed. The GraphView component displays the data in either tabular or graphical form. For tabular form, we use the react-window component, which is scalable up to thousands of rows and thousands of columns. The data needs to be first loaded from the server before displaying in either form. During this time, we use the Roller component from react-spinner-css to display a loading spinner. Once the data is loaded, the state of our GraphView component changes and the render method is called again to display the data. In order to plot the data, we use the component VegaLite from react-vega to display it as an area, bar, line, or points chart. Figure 7-B shows the different types of plots currently available.

34
Figure 10. Partial Class Diagram of UI Components
35
Figure 11. Different plots of the same data
36
Test Results
Workflow model
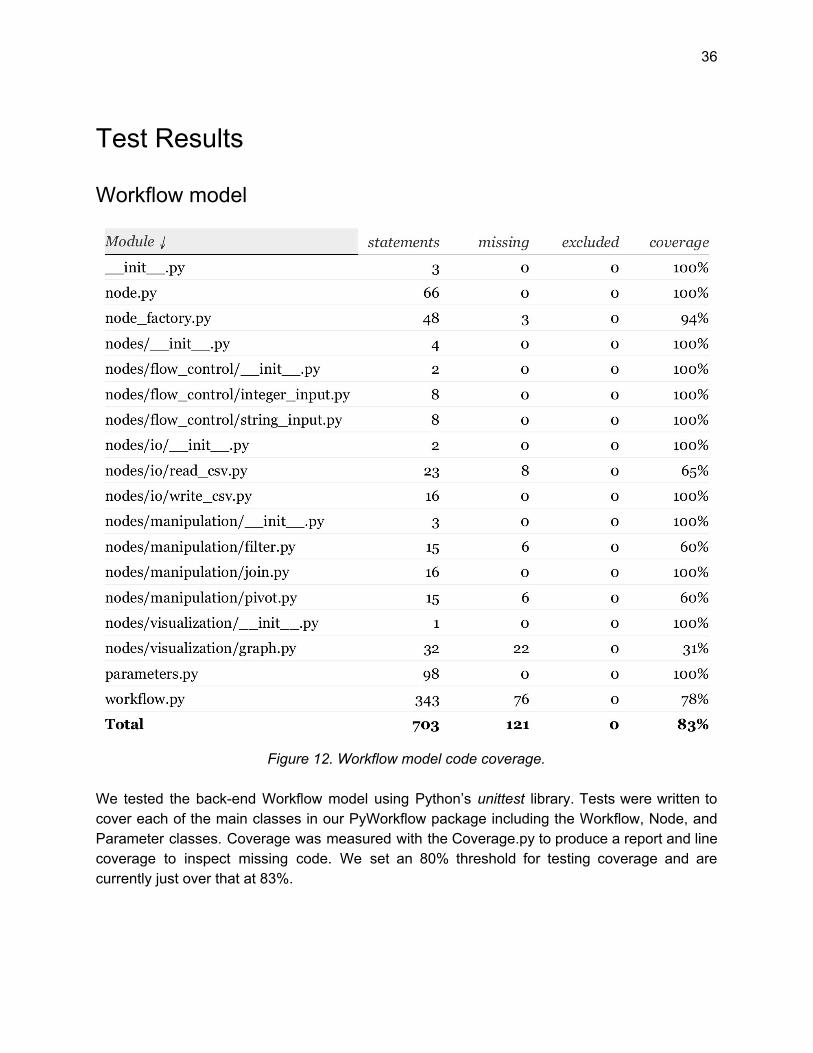
Figure 12. Workflow model code coverage.
We tested the back-end Workflow model using Python’s unittest library. Tests were written to cover each of the main classes in our PyWorkflow package including the Workflow, Node, and Parameter classes. Coverage was measured with the Coverage.py to produce a report and line coverage to inspect missing code. We set an 80% threshold for testing coverage and are currently just over that at 83%.

37
REST API Endpoints
Figure 13. Postman test runner for Django endpoints
In order to test requests and responses to/from the Django application REST endpoints we are using Postman. By using the Postman Runner feature we are able to run a set of requests at once, simulating the front-end application. It has allowed us to work in the back-end without depending on the front-end and vice-versa.

38
UI
Figure 14. Code coverage for front-end using jest.
The React components composing the UI are tested in isolation and together with jest, a lightweight and easy-to-configure tool for testing React applications. We use snapshots to validate the HTML output is still the one we are expecting based on what we visually validated to be correct. We take snapshots of each element individually, and as a group, so the test fails in case we make a change that modifies the output in html format. During development of the UI, the snapshots were updated frequently due to the changes and additions to the components. There are three main components that are mocked, in order to test and simulate the actions on the browser: the fetch function, the global object (window, document), and the canvas. The canvas is mocked through the package jest-canvas-mock (version 2.2.0), and it is mainly required to avoid warnings during testing that might obfuscate other problems. fetch is a global function that retrieves data from the server, so it is mocked along the window/document functions. Certain actions on the UI require confirmation, which is currently done through the native browser confirmation window, which requires us to mock the window object. The document object is not available during testing, hence, the need to mock it to validate the URLs and elements are created accordingly. Figure 14 shows the current code coverage with jest, currently just above 64%. We have some failures due to the usage of hooks in non-react-component elements, which we are currently fixing.

39
Development Process
Meeting the Requirements
Completion of Customer Requirements Nearly every customer requirement was met for the project (see appendix for complete requirements list). The team was unable to complete only the following tasks within our timeframe:
- A user shall be able to insert annotations to visually group/organize nodes in a workflow, or to add more information such as instructions or documentation.
- Browser-based access shall be authenticated by SSO or LDAP mechanisms. - The application shall alert the user if a node fails to execute and make the stack trace
available for inspection. - The application is accessible via web browser from remote computers (machines other
than the one executing the data processing steps). The team felt confident that the work done was well-prioritized and discussed with the client. While more lofty goals and wishes for the application exist, the goal of creating a strong foundation for extensibility and further development was met.
Strategic Decisions Development began swiftly for the team, and a time-boxed interval was set for the initial task of evaluating our tech stack and architectural design decisions. Thanks to the organizational powers of a Kanban board, prioritizing and tracking progress was rather straightforward. The client had continuous input and was a great resource for understanding how the end-user would most enjoy using the application. From an operational standpoint, the team operated on a week-long sprint cycle with retrospectives and grooming taking place in one meeting. The backlog was tentatively groomed based on milestone deadlines and requirements with blockers. This method worked extremely well for the team, and it allowed for each individual to head into the week with a set task that complemented or unblocked a future week’s requirement. Additionally, the team separated, at least initially, into a front-end and back-end group. This ensured that talents were well-placed for such a demanding timeline. Operating in this manner for the five personalities of the team was definitely the best path forward. The decisions that were least beneficial to the team included trying to perform too many scrum ceremonies in such a short development cycle. Excess meetings were quickly dropped in favor

40
of Slack posts or code review commentary. This allowed for issues to rise naturally, however irregular, and to be addressed without wasting resources or time.
Technical Decision-Making
Evaluation of Eclipse Theia and GLSP During requirements gathering, the customer suggested utilizing Eclipse Theia and Eclipse GLSP to build the user interface of the application. Theia in particular seems powerful and has many extensions to build custom web IDEs. However, the extension required for building a diagram editor, GLSP, is still in its infancy and lacking documentation. Additionally, both Theia and GLSP require their own server-side processes to support their functionality in the browser, resulting in a complex architecture (without even considering the data processing service). This complexity, together with the difficulty encountered bootstrapping a Theia/GLSP prototype, drove us to choose a simpler architecture composed of popular and well-documented tools: React (and react-diagrams), backed by a single Django web service. We considered this a sacrifice of pre-built and full-featured IDE components for the sake of a manageable and predictable architecture.
Incremental vs. Comprehensive Graph Building The largest requirement was to represent a visual workflow as a computational one. Thus, the biggest design decision toward its implementation was whether the computational graph should be constructed incrementally (i.e., “build-as-you-go”) or comprehensively (i.e., “build-on-execute”). We found that individual user actions cleanly mapped onto CRUD operations supportable by a RESTful API. We also concluded that quick responses (such as error messages) to user actions provides a better user experience than responses delayed until a complete visual graph is executed. For example, we wanted to avoid a situation where a user builds a workflow they think is valid, and then receives a long list of errors (possibly relating to dozens of different nodes) only upon trying to execute it. Instead, the user may be alerted to issues as the relevant entities are added and configured.
Storage of Visual and Computational Graphs Because we opted for a RESTful service to support graph construction on the server, we had to choose a mechanism of maintaining state between requests from the browser. The requirement that the application shall support saving and loading workflows to/from disk informed this decision: if workflows must be serializable, we can leverage that property in storing them server-side. Further, we found that both the client- and server-side tools we had chosen for graph representation provided built-in JSON serialization. This naturally led us to the decision to store the JSON-serialized computational graph directly in the Django session object between request-response cycles, and send the serialized visual graph from the browser to the server to be stored in the same way when changes are made. This storage facilitates the user’s request

41
to save their workflow, as the server just retrieves the serialized data from the session and sends it as a JSON file. It also allows the visual workflow to be at least partially recovered if the user’s browser were to crash.
Django vs. Flask The choice between Django and Flask is a common one when building a Python web service. Django is a full-featured web-app framework whereas Flask is lightweight and extensible micro-framework. Both frameworks have their advantages and disadvantages, but the choice for our team was easy. We went with Django because there was minimal-to-no experience with Flask amongst our group. In the end, with Django we were able to develop a modular system that maintains separation of concerns and allows for easy extensibility in the future. While this project did not tackle authentication, the choice to go with Django makes this more feasible in the future given Django’s other built-in components that would need to be built from scratch with Flask.
Client-Server File Handling The KNIME application we are seeking to clone is designed to run locally, making access to data files straightforward. The client-server architecture adopted here means all input data must be transferred to the server before it can be processed, and output data must be sent back to the client for download. This has posed a number of challenges in design and implementation, such as: determining which nodes require an upload or download process, preventing filename clashes between workflows, and organizing file storage on the server so that both the web application controller logic and the back-end workflow model can access the same data files. We leveraged universally unique identifiers at the level of workflows and nodes to unambiguously label data. The Workflow model was designed to accept parameters for storage configuration to dynamically create paths for files (with a root path) and custom nodes (with a node path). These paths are then used in conjunction with the Python standard library API for reading and writing files.
Estimates Estimates can be found in the Appendix accompanying each specific project requirement. These were determined through a planning poker session in which all team members privately scored each requirement in terms of points, relative to the standard Fibonacci scale. For requirements that had a range of scores, the team discussed whether to point-up or point-down based on challenges or possible solutions other team members raised. Points were assigned to requirements on a relative basis. Requirement #11 (“The application shall convert a visual workflow of nodes into a computational workflow.”) received the highest score of 34 points, which indicated the biggest challenge our team needed to solve as many other requirements depend, directly or indirectly, on the ability to convert the visual workflow to
42
a computational one. This suggested the task at hand was more of an ‘epic’ than simply a ‘story.’ As such, during development, the larger pointed requirements were broken down into more manageable chunks and re-scored.
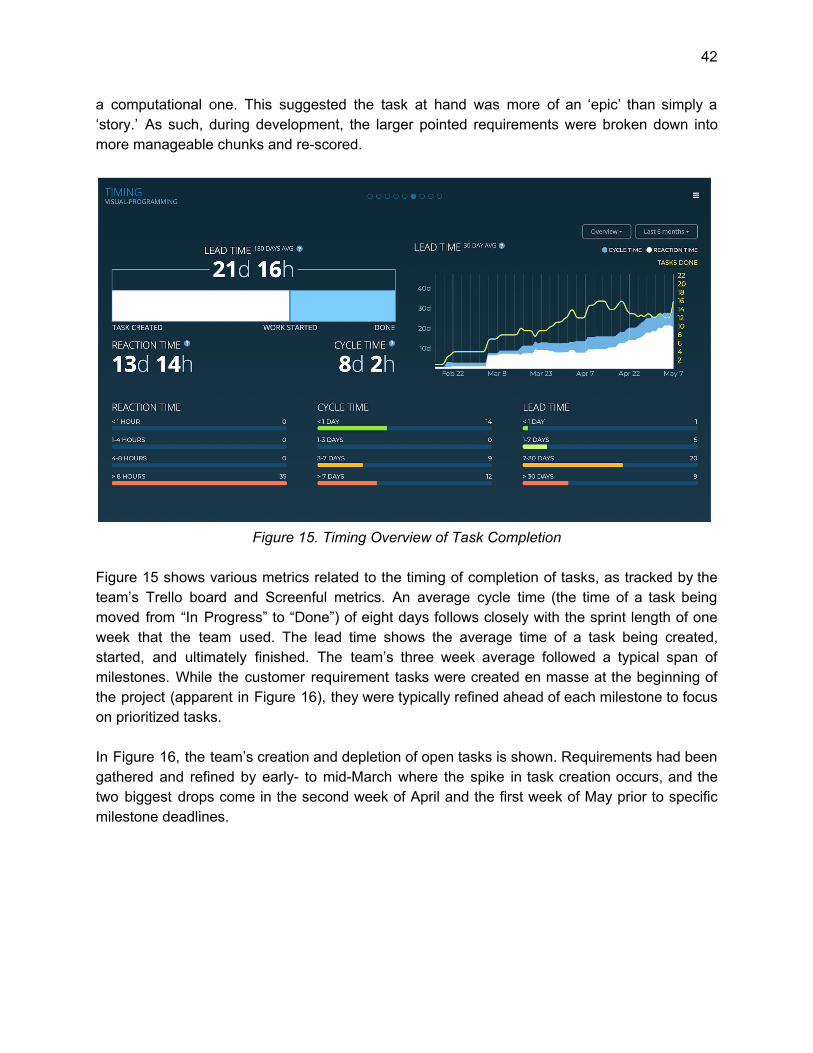
Figure 15. Timing Overview of Task Completion
Figure 15 shows various metrics related to the timing of completion of tasks, as tracked by the team’s Trello board and Screenful metrics. An average cycle time (the time of a task being moved from “In Progress” to “Done”) of eight days follows closely with the sprint length of one week that the team used. The lead time shows the average time of a task being created, started, and ultimately finished. The team’s three week average followed a typical span of milestones. While the customer requirement tasks were created en masse at the beginning of the project (apparent in Figure 16), they were typically refined ahead of each milestone to focus on prioritized tasks. In Figure 16, the team’s creation and depletion of open tasks is shown. Requirements had been gathered and refined by early- to mid-March where the spike in task creation occurs, and the two biggest drops come in the second week of April and the first week of May prior to specific milestone deadlines.

43
Figure 16. Burndown Chart of Open Tasks

44
Risks
Risk Mitigation Lack of experience with KNIME. One of the core aspects of this project is creating a KNIME “clone”, which requires some knowledge and understanding about what the application does and how it works.
The team has downloaded the application and worked through several of the provided examples. Through meetings with the customer, we have also clarified questions we had about specific tools/features and narrowed in on which features are key to developing our “clone”.
Customer’s requested technologies. To make a web-based clone of KNIME, the customer requested using Eclipse Theia and GLSP (a diagram editor framework) which include both front- and back-end components in Java or similar. Another request of the customer is that the application process code written in Python, and in particular, pandas library functions. Figuring out how the pieces will interact, in a manageable way for the scope of the project, is a major risk.
Our team very quickly discovered that Eclipse Theia and GLSP were not the right tools for the job. GLSP in particular lacked a lot of documentation and extending the built-in diagraming features it has was challenging enough without considering the work that would be needed to tie multiple servers running several different languages together. Working with the customer, we revised this requirement to use react-diagrams on the front-end and built a computational graph using NetworkX on the back-end.
Range of software engineering experience levels. Some members have worked in the field for years and have experience working on large/group projects, while one member has only worked on individual and class assignments. Our experiences with individual technologies, languages, and the tools we plan to use are also varied.
The course has access to Datacamp which provides additional learning tools, especially for Python libraries like pandas and numpy. More experienced team members will provide guidance and direction for less-experienced members to equally contribute to the work. A lot of upfront time has also been spent reading the documentation for Theia and GLSP in particular to try and familiarize ourselves with how these technologies work. Unknowns still remain on how, or if, integrating the Java-based tools with Python will work.
Platform-specific/file-system risks? During development, we might use different operating systems or versions of Python locally, which might cause or hide issues.
As a web app deployed through Docker, we will perform tests trying to simulate the production environment. If multiple Docker instances become a burden for our local machines, we will deploy test Docker images in the cloud to avoid deploying the whole

45
system on our local machine.
File handling (large files) The required client-server architecture means data files must be transferred to the server to be processed. Without support for asynchronously transferring large files, we create a potentially unfriendly user experience where one must wait for their file to transfer before further configuring a workflow. This is a known limitation that can be addressed through writing a custom node that supports reading data from a remote location. pandas includes methods that support passing an Amazon S3 URL as a data source which could be used to mitigate this issue.
Team Dynamic
Method The team has followed an Agile methodology using the scrum framework with the following roles and ceremonies.
1. Sprints Given the short nature of the project we used one week sprints with a sprint review at the end of the cycle with the client, as available. Sprints went from Monday until Sunday.
2. Roles
Client / Product Owner: Dr. Shinichiro Wachi. Project Manager: Matthew Smith Scrum Master: Diego Struk Team:
Name Role
Cesar Agustin Garcia Vazquez Front-end Developer
Diego Struk Back-end Developer
Matthew Thomas Back-end Developer

46
Matthew Smith Back-end Developer
Samir Reddigari Front-end Developer
3. Ceremonies Backlog Refinement: A backlog refinement session was held towards the end of the sprint through Slack on Saturdays to prioritize and go over the stories that would be worked on in the next upcoming sprint.
Sprint Planning: This meeting was held on Mondays to plan the goals for the upcoming sprint. If more time was needed to work on implementation, this meeting was merged with backlog refinement.
Daily Scrum: Held through a dedicated Slack channel every morning where team members gave an update on the items that were in process in the backlog and any blockers they were facing.
Sprint Review: Held at the end of the Sprints, this was a meeting with the product owner to evaluate whether the product was ready for release. This meeting was held weekly or bi-weekly, depending on product owners’ availability.
Retrospectives: When time permits, a retrospective session was held during the same meeting time as the backlog refinement session after a sprint was completed. Otherwise, feedback was gathered through FunRetro (please see tools for more details) and compiled by a team member.
Tools Communication:
1. Slack: for day to day communication between team members and the customer, as needed.
2. Email: for communication with product owners when meetings are not necessary.
Backlog/Workflow:
47
1. Trello boards: cards written in user story format and assigned to team members which will own the card until it is released.
File sharing and requirement gathering/managing: 1. Google Drive: to share files among the team such as deliverables, retrospective
outcomes and documentation. This tool is also used for requirement gathering. 2. Draw.io: for requirement visualization.
Version Control and CI/CD:
1. GitHub: as a centralized code repository. Given the short duration of the project and relatively small code base, the team will be using trunk based development. The Branch by Abstraction [1] technique will be used for changes that might take too long to complete.
2. GitHub Actions: as a continuous integration/delivery pipeline. The tool will kick in after each commit and run a pipeline that will build, run code validation, and run tests.
Testing: 1. Postman: as an API client to run automated tests to our APIs. 2. unittest: python unit testing framework.
Documentation:
1. Swagger: to produce Open API compliant documentation to aid anyone that would like to consume our API in the future.
2. FunRetro: for gathering feedback during retrospective meetings.
Outlook By and large, our team stuck to the original plan of meetings, tooling, and collaboration. The daily stand-up by means of a Slack channel turned out to be the most effective means of following our activity day-to-day. We met weekly for our ceremonies, and we utilized most all of our tool selections to keep organized.
48
Appendix
Screenshots/Wireframes
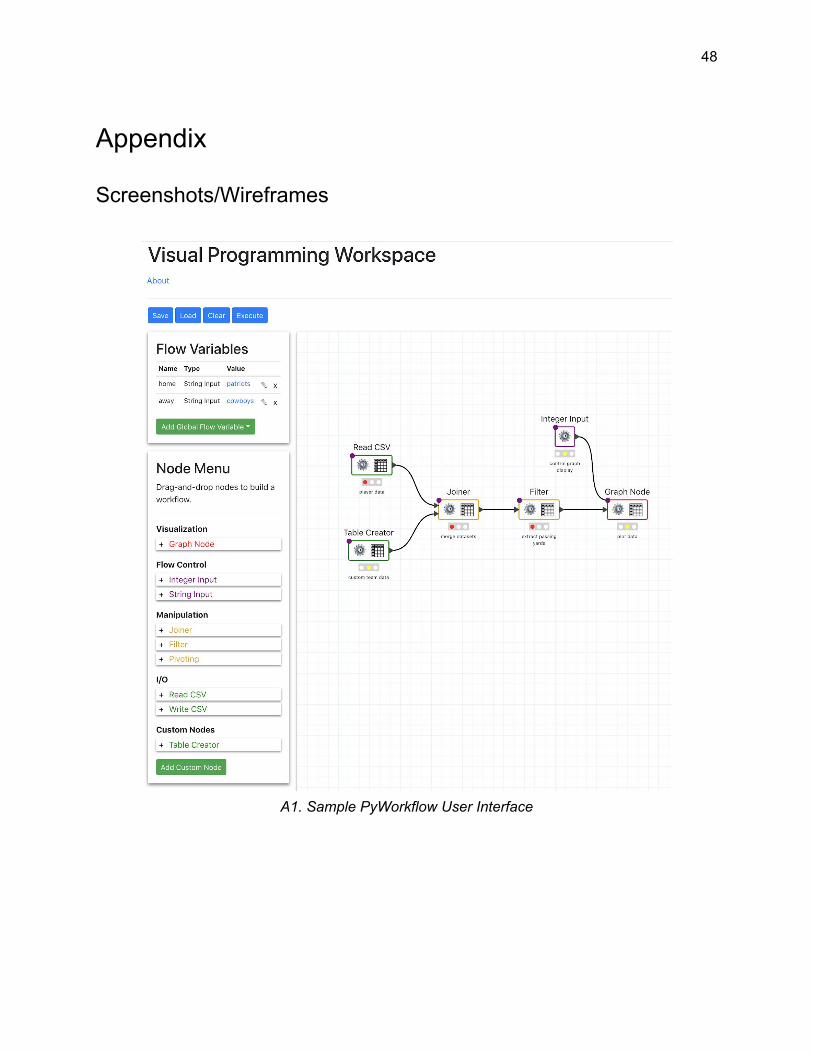
A1. Sample PyWorkflow User Interface

49
A2. Sample Node Configuration Settings

50
A3. Sample File Upload Screen

51
A4. Wireframe of Main Screen
A5. Wireframe of Node Configuration Box
52
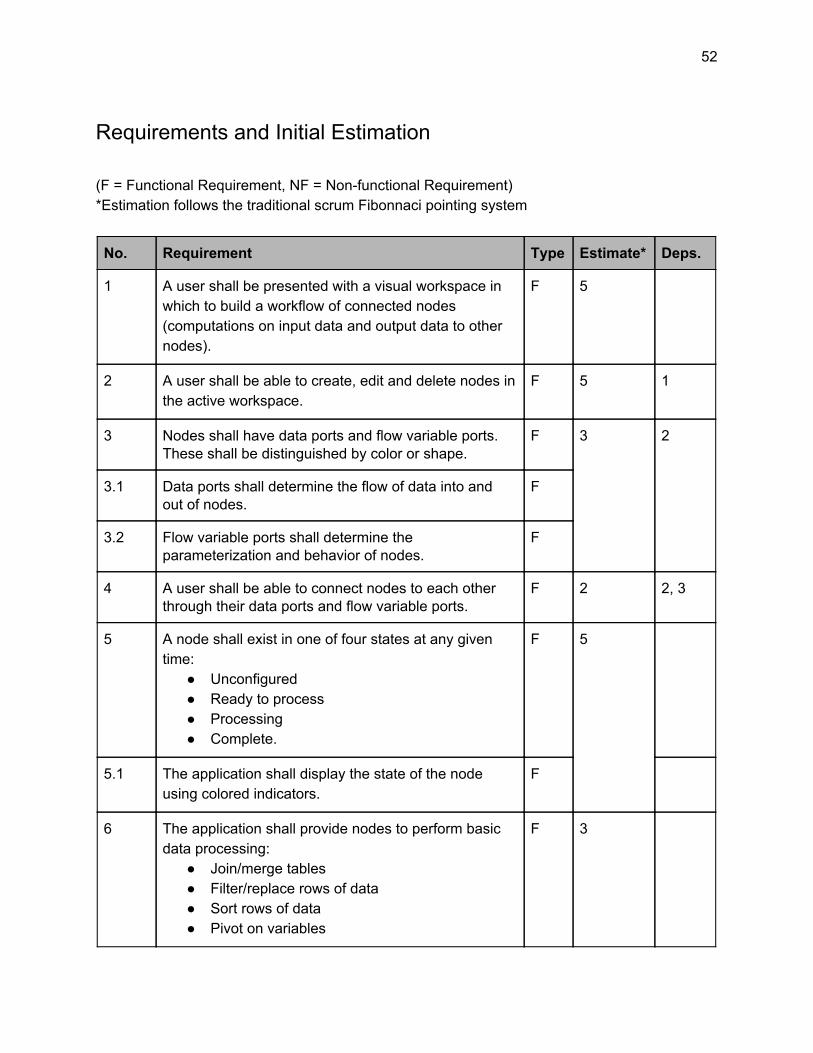
Requirements and Initial Estimation (F = Functional Requirement, NF = Non-functional Requirement) *Estimation follows the traditional scrum Fibonnaci pointing system
No. Requirement Type Estimate* Deps.
1 A user shall be presented with a visual workspace in which to build a workflow of connected nodes (computations on input data and output data to other nodes).
F 5
2 A user shall be able to create, edit and delete nodes in the active workspace.
F 5 1
3 Nodes shall have data ports and flow variable ports. These shall be distinguished by color or shape.
F 3 2
3.1 Data ports shall determine the flow of data into and out of nodes.
F
3.2 Flow variable ports shall determine the parameterization and behavior of nodes.
F
4 A user shall be able to connect nodes to each other through their data ports and flow variable ports.
F 2 2, 3
5 A node shall exist in one of four states at any given time:
● Unconfigured ● Ready to process ● Processing ● Complete.
F 5
5.1 The application shall display the state of the node using colored indicators.
F
6 The application shall provide nodes to perform basic data processing:
● Join/merge tables ● Filter/replace rows of data ● Sort rows of data ● Pivot on variables
F 3
53
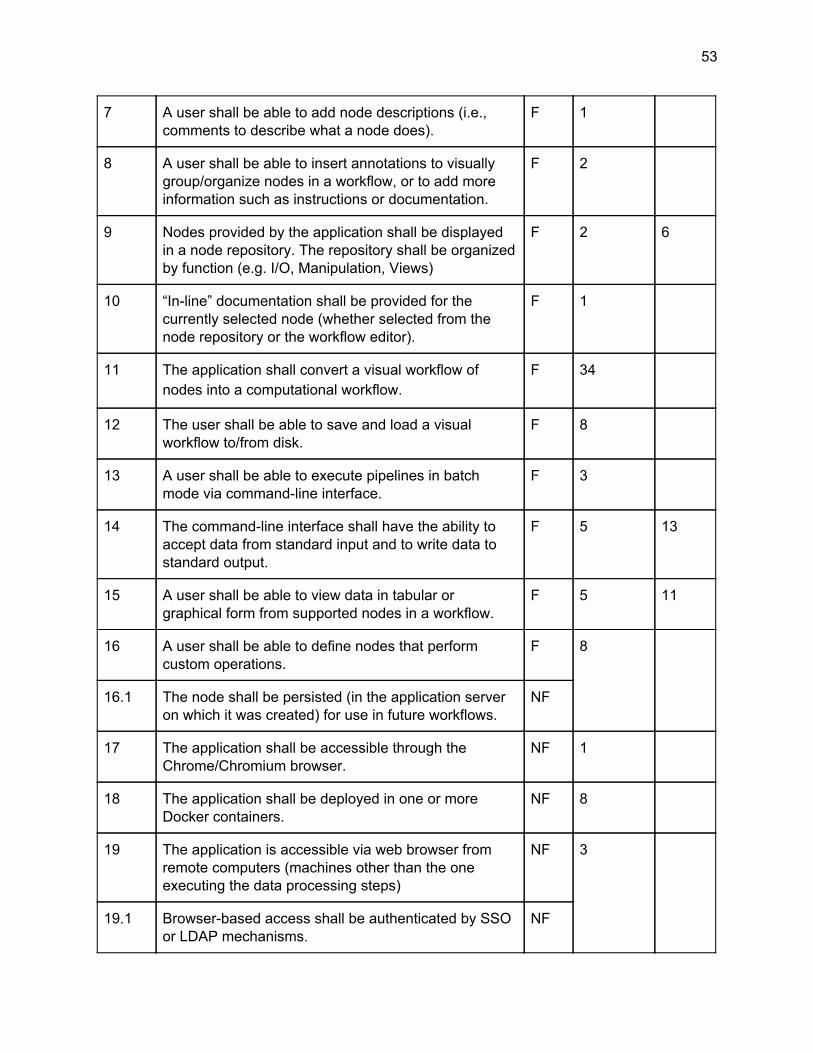
7 A user shall be able to add node descriptions (i.e., comments to describe what a node does).
F 1
8 A user shall be able to insert annotations to visually group/organize nodes in a workflow, or to add more information such as instructions or documentation.
F 2
9 Nodes provided by the application shall be displayed in a node repository. The repository shall be organized by function (e.g. I/O, Manipulation, Views)
F 2 6
10 “In-line” documentation shall be provided for the currently selected node (whether selected from the node repository or the workflow editor).
F 1
11 The application shall convert a visual workflow of nodes into a computational workflow.
F 34
12 The user shall be able to save and load a visual workflow to/from disk.
F 8
13 A user shall be able to execute pipelines in batch mode via command-line interface.
F 3
14 The command-line interface shall have the ability to accept data from standard input and to write data to standard output.
F 5 13
15 A user shall be able to view data in tabular or graphical form from supported nodes in a workflow.
F 5 11
16 A user shall be able to define nodes that perform custom operations.
F 8
16.1 The node shall be persisted (in the application server on which it was created) for use in future workflows.
NF
17 The application shall be accessible through the Chrome/Chromium browser.
NF 1
18 The application shall be deployed in one or more Docker containers.
NF 8
19 The application is accessible via web browser from remote computers (machines other than the one executing the data processing steps)
NF 3
19.1 Browser-based access shall be authenticated by SSO or LDAP mechanisms.
NF
54
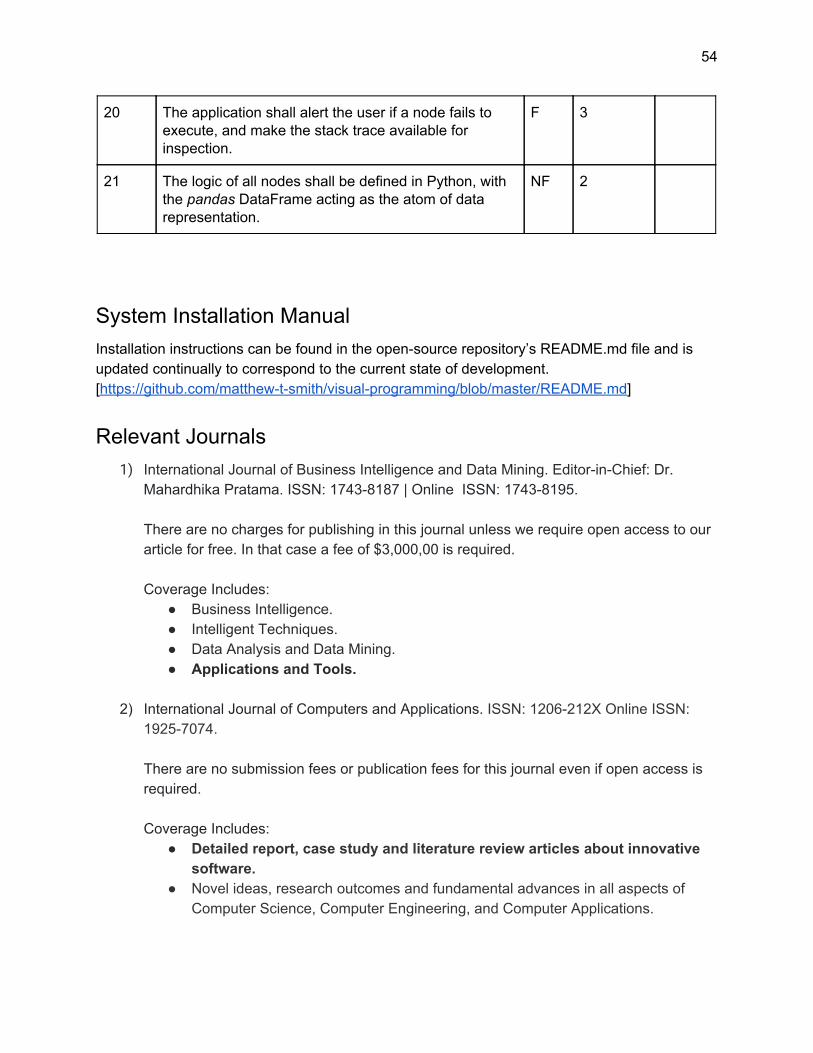
20 The application shall alert the user if a node fails to execute, and make the stack trace available for inspection.
F 3
21 The logic of all nodes shall be defined in Python, with the pandas DataFrame acting as the atom of data representation.
NF 2
System Installation Manual Installation instructions can be found in the open-source repository’s README.md file and is updated continually to correspond to the current state of development. [https://github.com/matthew-t-smith/visual-programming/blob/master/README.md]
Relevant Journals 1) International Journal of Business Intelligence and Data Mining. Editor-in-Chief: Dr.
Mahardhika Pratama. ISSN: 1743-8187 | Online ISSN: 1743-8195. There are no charges for publishing in this journal unless we require open access to our article for free. In that case a fee of $3,000,00 is required. Coverage Includes:
● Business Intelligence. ● Intelligent Techniques. ● Data Analysis and Data Mining. ● Applications and Tools.
2) International Journal of Computers and Applications. ISSN: 1206-212X Online ISSN:
1925-7074. There are no submission fees or publication fees for this journal even if open access is required.
Coverage Includes:
● Detailed report, case study and literature review articles about innovative software.
● Novel ideas, research outcomes and fundamental advances in all aspects of Computer Science, Computer Engineering, and Computer Applications.

55
3) Big Data. Editor-in-Chief: Zoran Obradovic, PhD. ISSN: 2167-6461 | Online ISSN: 2167-647X
Big Data is a subscription based journal. However, Creative Commons CC-BY and CC-BY-NC licensing is available for all articles published open access for a standard Article Processing Charge (APC) of $3,200.00.
Coverage includes:
● Big data industry standards. ● New technologies being developed specifically for big data. ● Data acquisition, cleaning, distribution, and best practices. ● Data protection, privacy, and policy. ● Business interests from research to product. ● Visualization and design principles of big data infrastructures. ● Opportunities around big data and how companies can harness it to their
advantage.
References:
1. Fowler, M. (January 7, 2014). BranchByAbstraction. Retrieved from: https://martinfowler.com/bliki/BranchByAbstraction.html.